
SUSTAINABLE TRANSPORT FORSUSTAINABLE CITIES – A WORLD
BANK PERSPECTIVE
Jose Luis IrigoyenDirector, Transport and ICT Global Practice
World Bank
This image cannot currently be displayed.
“Sustainable Urban Transport”,a local, national and global issue

Cities are drivers of growth and globalclimate change, also home to the poor
-
50,000
100,000
150,000
200,000
250,000
300,000
1980 1985 1990 1995 2000 2005 2010 2015 2020 2025 2030
CO
2 (M
ILL
ION
KG
)
CO2 emissions from urban transport (1980-2030)Source: Shyam Menon, WorldBank/EMBARQ (WRI),Jan 2007
Local & Global Environment• Urban outdoor pollution linked
to 4 million premature deaths• Cities contribute 70% of energy
–related GHG emissions
Urbanization and GDP per capita
Economic Growth• Cities generate 80% of
global output (500, 60%of global income growth)
• Growing welfare costs oftraffic congestion
Inclusive Development• Growth of slums (urban
poverty, social exclusion)• Bottom quintile spends
disproportionate share ofincome on public transport

Emerging trends make “SustainableTransport” a local, national, global issue
Green House Gas Effect
Financial Liabilities
Farmland Conversion
Traffic Accidents
Auto Pollution
Traffic Congestion
GLOBAL
LOCAL
NATIONAL
Energy Security / Fuel Prices
GLOBALGLOBAL
LOCALLOCAL
NATIONALNATIONALAdd G20 toolkit
G-20 Toolkit on Urban TransportMexico, 2012
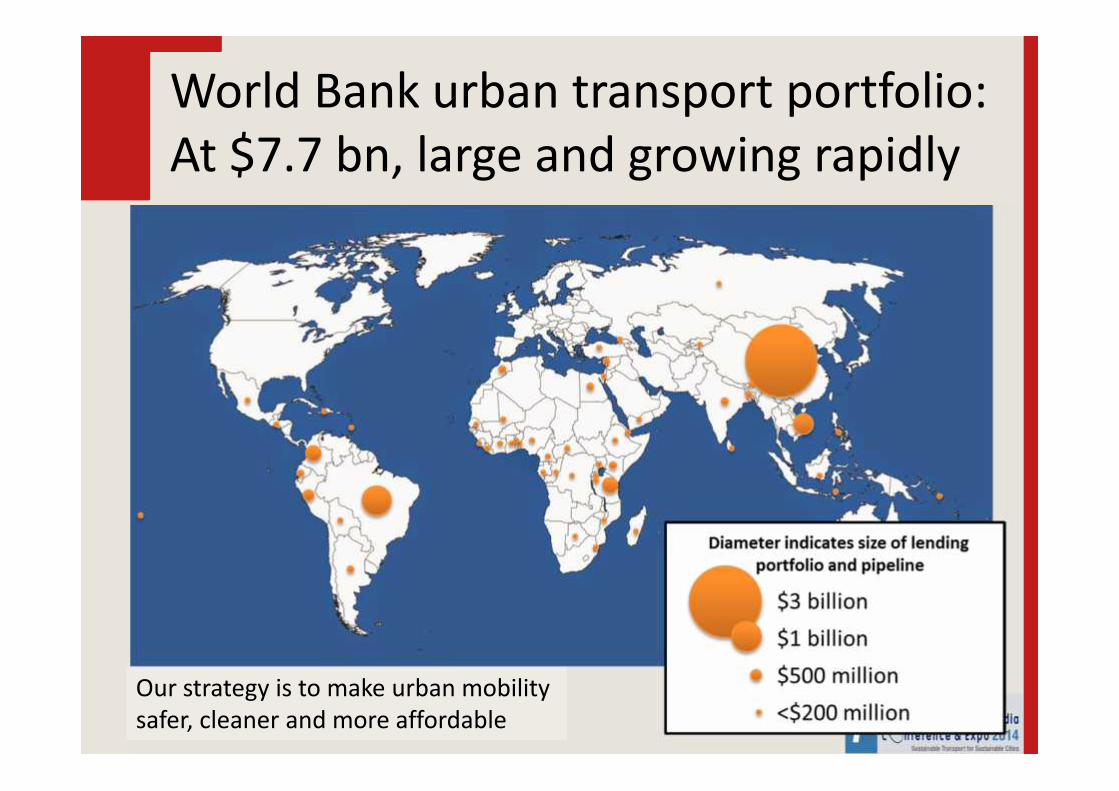
World Bank urban transport portfolio:At $7.7 bn, large and growing rapidly
Our strategy is to make urban mobilitysafer, cleaner and more affordable

This image cannot currently be displayed.
Evolving “best practice” emphasizesholistic approach, more integratedsolutions that balance supply anddemand to support sustainable city

Cities where the WB has had significantUrban Transport engagements
TOD, Curitiba
Transmilenio,Bogota

• Previous decade:– Efficiency of public transport operations within a public-private
partnership framework; focus on rapid transit; competition for market;strengthening institutions;
– Air quality, NMT (especially LAC); traffic management (less than previousdecade); road safety; urban road infrastructure (mainly China, Africa)
• 2005-Today:– Emphasis on Sustainable/Low Carbon Transport: modal shift to clean
public transport; increased urban transport efficiency through greaterintegration and use of technology while reducing carbon footprint;
– Metros (LAC); People-centered systems for “smart cities” (LAC, EAP);– Global capacity building effort: Leaders in Urban Transport Planning; Data
Tool
Dominant thrust of Bank support: improveperformance of public transport services

Bus Rapid Transit in Lagos, Nigeria
Integrated Transport Corridors, Anhui(medium cities) and Wuhan, China
PROTRAM, Mexico
Metro Line Development inSao Paulo, Brazil
Focus on rapid transit includes BRTs,Rail, a few Metros, …
Lima
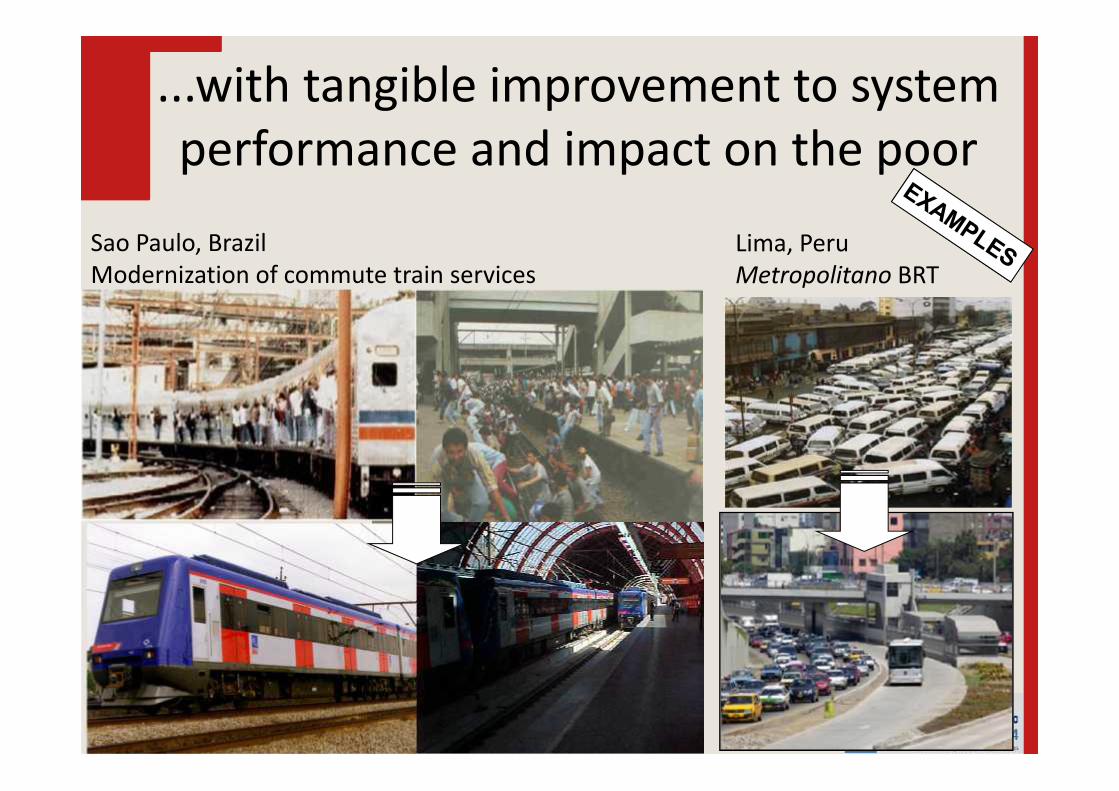
Sao Paulo, BrazilModernization of commute train services
Lima, PeruMetropolitano BRT
...with tangible improvement to systemperformance and impact on the poor

Curitiba
Sustainable cities prioritize public andNMT transport, integrate land use
Bogota

12
0
10
20
30
40
50
60
70
20102020
20302040
2050Source: ADB and IEA, 2011
Public transport
Cars and motorcycles
Mod
e sh
are
(p-k
m)
Business-as-usual projections to 2050
Cities facing rapid motorization learnednot possible to build way out of congestion
13
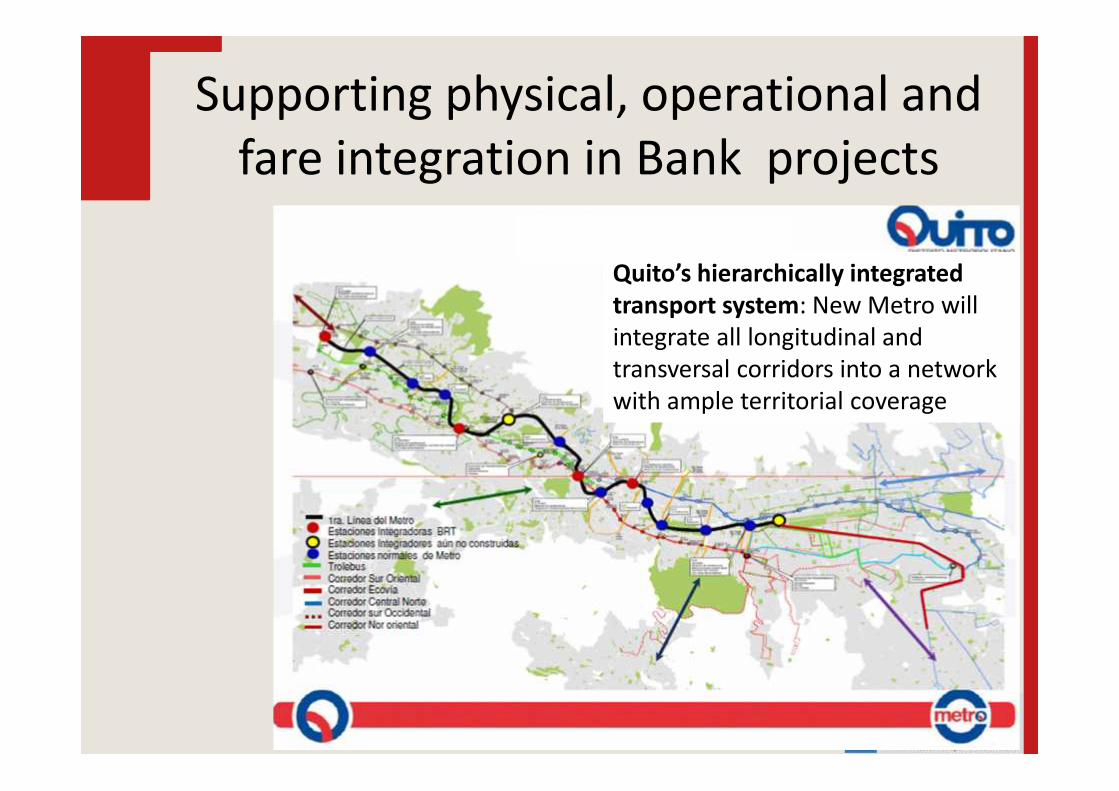
Quito’s hierarchically integratedtransport system: New Metro willintegrate all longitudinal andtransversal corridors into a networkwith ample territorial coverage
Supporting physical, operational andfare integration in Bank projects

14
Supporting physical, operational andfare integration in Bank projects

Technology enables full integration whichmaximizes user impact, rationalizes supply
1. Card is system integratoramong all modes. Openstandards/ protocols enableseamless user experience
2. Card allows design ofsubsidy: Govt Rio pays whenuser needs multiple transfers
4. Subsidy schemecan be linked tosocial securityinfrastructure
Bogota SITPfare card Aadhaar
card,India3. Multi-purpose use of
card can stimulate useof public transport

Planning people-centered services
Unleashing the power of big data can helpgovernments become “smarter”…
Buenos Aires, Argentina: GPS data to analyzejobs accessible by transit within 60min
Rio, Brazil: Cell phone records trace data forplanning. WB finance ITS Center to process realtime data from Metro, Train, Buses and Ferries
Sao Paulo, Brazil: Bus Dashboard using historicreal-time data from buses’ Automatic VehicleLocation. Portrayal of bus speeds along routes
Monitoring performance oftransit system in real time
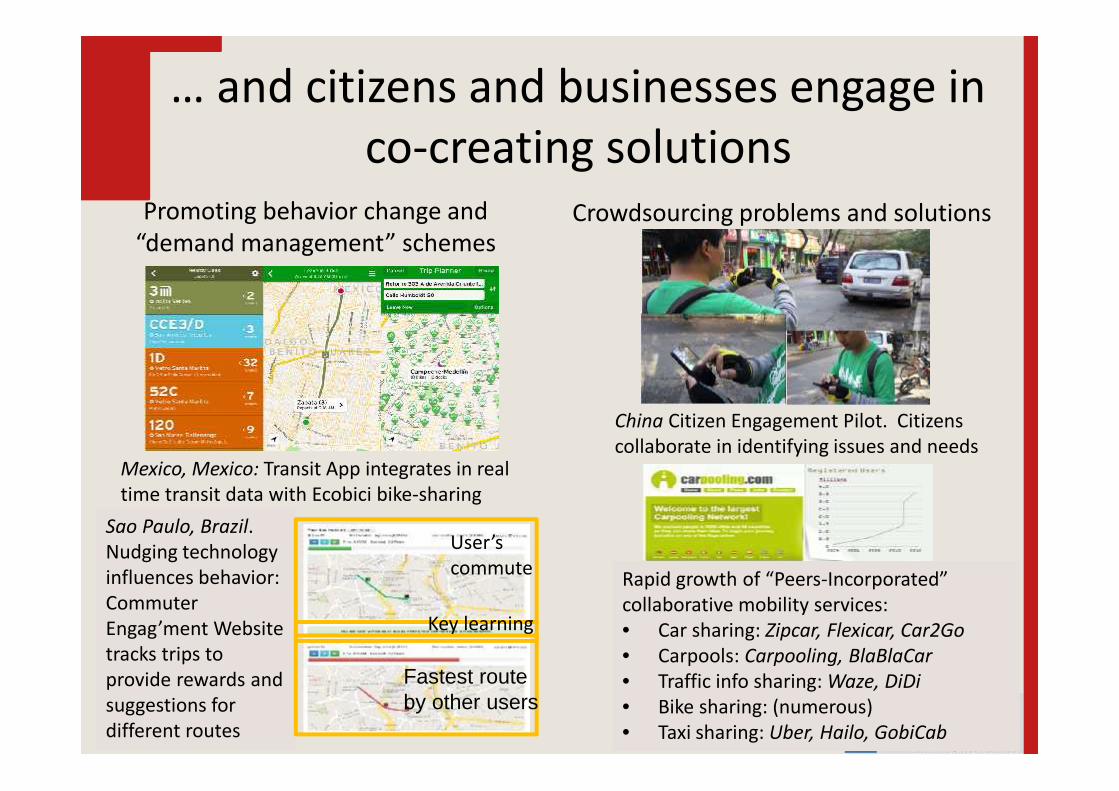
Promoting behavior change and“demand management” schemes
Mexico, Mexico: Transit App integrates in realtime transit data with Ecobici bike-sharing
Sao Paulo, Brazil.Nudging technologyinfluences behavior:CommuterEngag’ment Websitetracks trips toprovide rewards andsuggestions fordifferent routes
User’scommute
Fastest routeby other users
Key learning
… and citizens and businesses engage inco-creating solutions
Crowdsourcing problems and solutions
China Citizen Engagement Pilot. Citizenscollaborate in identifying issues and needs
Rapid growth of “Peers-Incorporated”collaborative mobility services:• Car sharing: Zipcar, Flexicar, Car2Go• Carpools: Carpooling, BlaBlaCar• Traffic info sharing: Waze, DiDi• Bike sharing: (numerous)• Taxi sharing: Uber, Hailo, GobiCab

The people-centered transport systemfor the “smart city”: a framework
Citizen-centered
SmartGovernment
Government asplatform for open,collaborative city
• Enabling ecosystem for innovationdeployment of new technologies
• Data standards/interoperable protocols• Smart regulation based on defined
public interest
• Opening data• Efficient delivery of
services that meetneeds of citizens andbusinesses
• Traffic optimization• Nudging and
behavior change
• Trip planners, real-time information toenhance public transport experience
• Smart Cards, smart subsidies• User-feedback loops• Crowdsourcing/co-creation
Integration formaximum impact
This image cannot currently be displayed.
Challenges, old and new, have gottenbigger. So the opportunities. Now isthe time for bold action before citieslock into inefficient, unsustainabledevelopment paths.
20
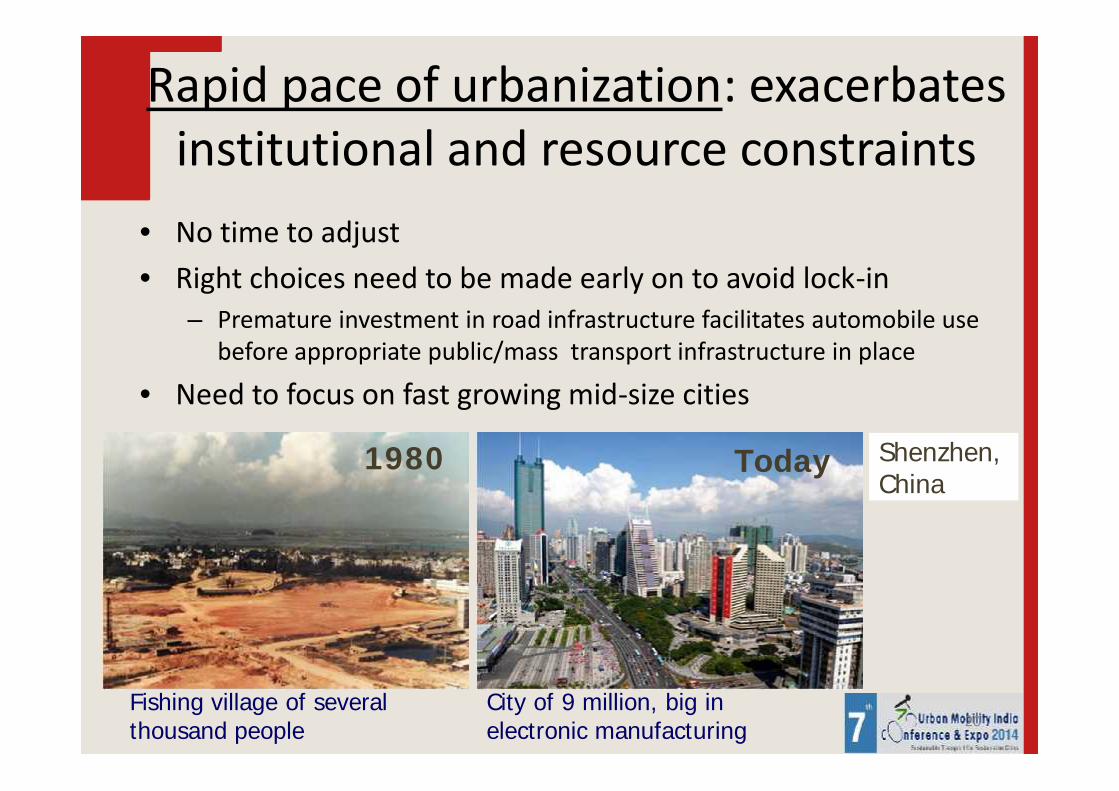
Rapid pace of urbanization: exacerbatesinstitutional and resource constraints
Shenzhen,China
1980 Today
Fishing village of severalthousand people
City of 9 million, big inelectronic manufacturing
• No time to adjust• Right choices need to be made early on to avoid lock-in
– Premature investment in road infrastructure facilitates automobile usebefore appropriate public/mass transport infrastructure in place
• Need to focus on fast growing mid-size cities
21
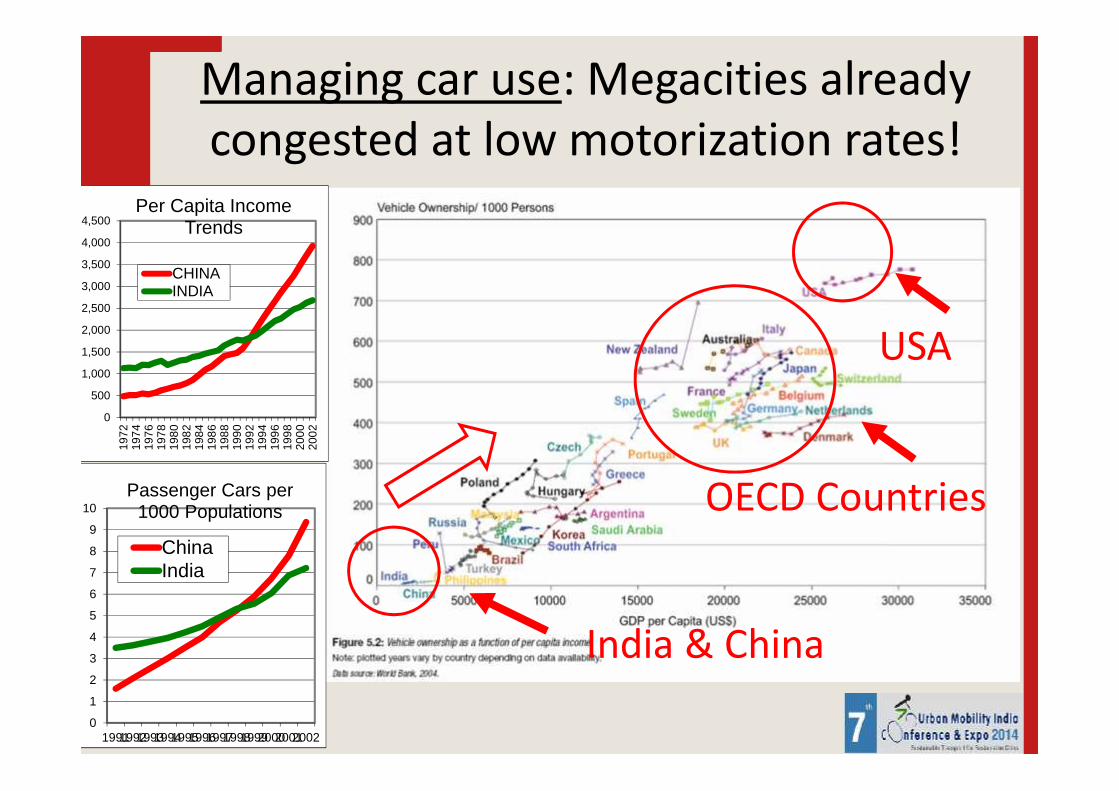
USA
OECD Countries
India & China0
1
2
3
4
5
6
7
8
9
10
199119921993199419951996199719981999200020012002
Passenger Cars per1000 Populations
ChinaIndia
0
500
1,000
1,500
2,000
2,500
3,000
3,500
4,000
4,500
1972
1974
1976
1978
1980
1982
1984
1986
1988
1990
1992
1994
1996
1998
2000
2002
Per Capita IncomeTrends
CHINAINDIA
Managing car use: Megacities alreadycongested at low motorization rates!
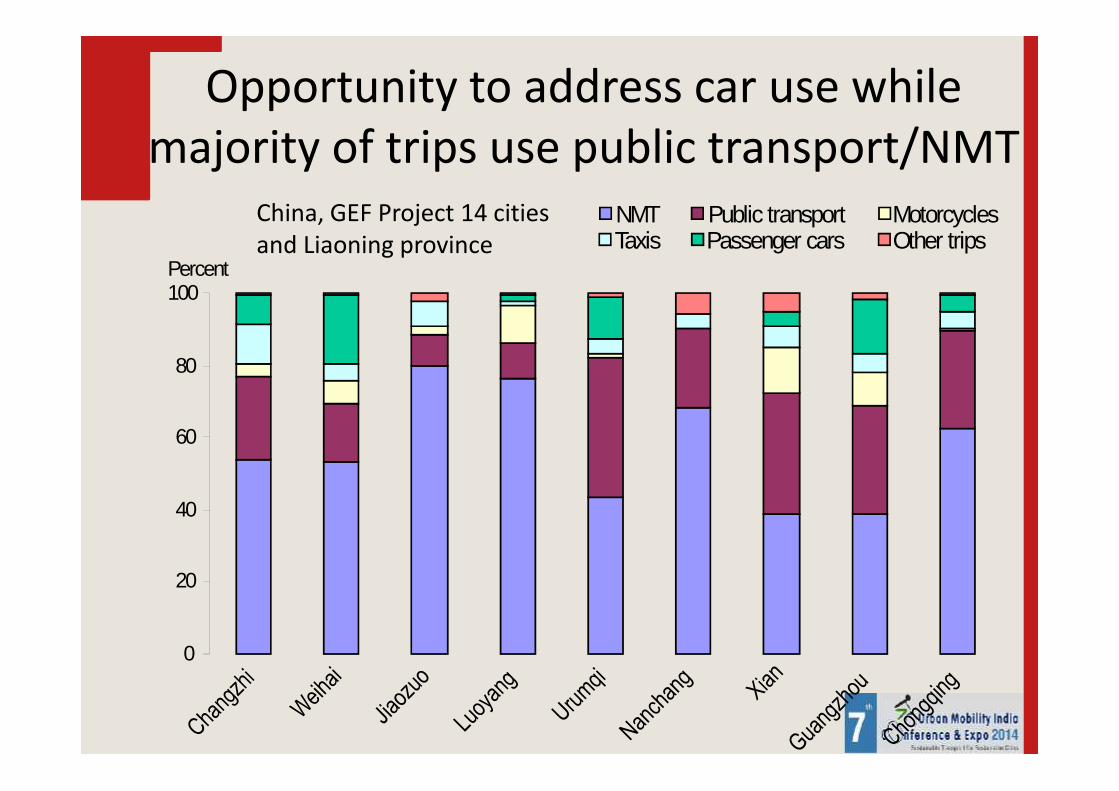
0
20
40
60
80
100
NMT Public transport MotorcyclesTaxis Passenger cars Other trips
Percent
Opportunity to address car use whilemajority of trips use public transport/NMT
China, GEF Project 14 citiesand Liaoning province

Sustainability: even a world-class transitsystem can be troubled by its own success
Transmilenio, 1999 - 2014
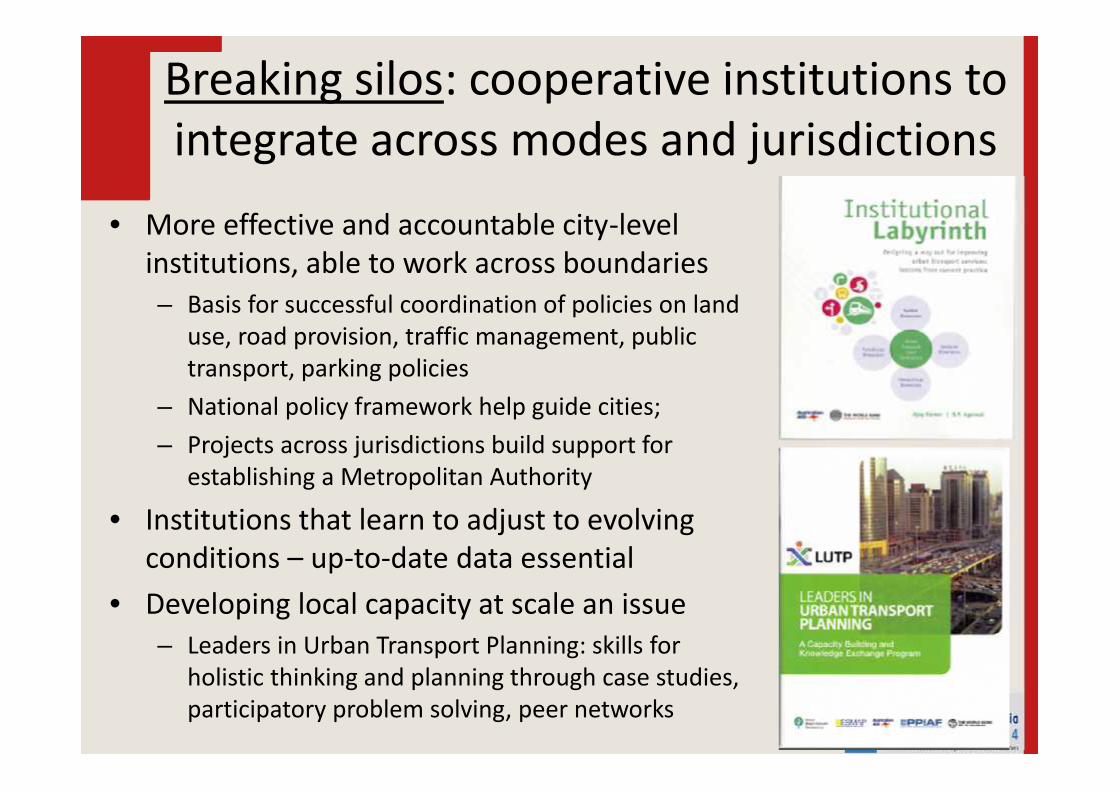
• More effective and accountable city-levelinstitutions, able to work across boundaries– Basis for successful coordination of policies on land
use, road provision, traffic management, publictransport, parking policies
– National policy framework help guide cities;– Projects across jurisdictions build support for
establishing a Metropolitan Authority
• Institutions that learn to adjust to evolvingconditions – up-to-date data essential
• Developing local capacity at scale an issue– Leaders in Urban Transport Planning: skills for
holistic thinking and planning through case studies,participatory problem solving, peer networks
Breaking silos: cooperative institutions tointegrate across modes and jurisdictions
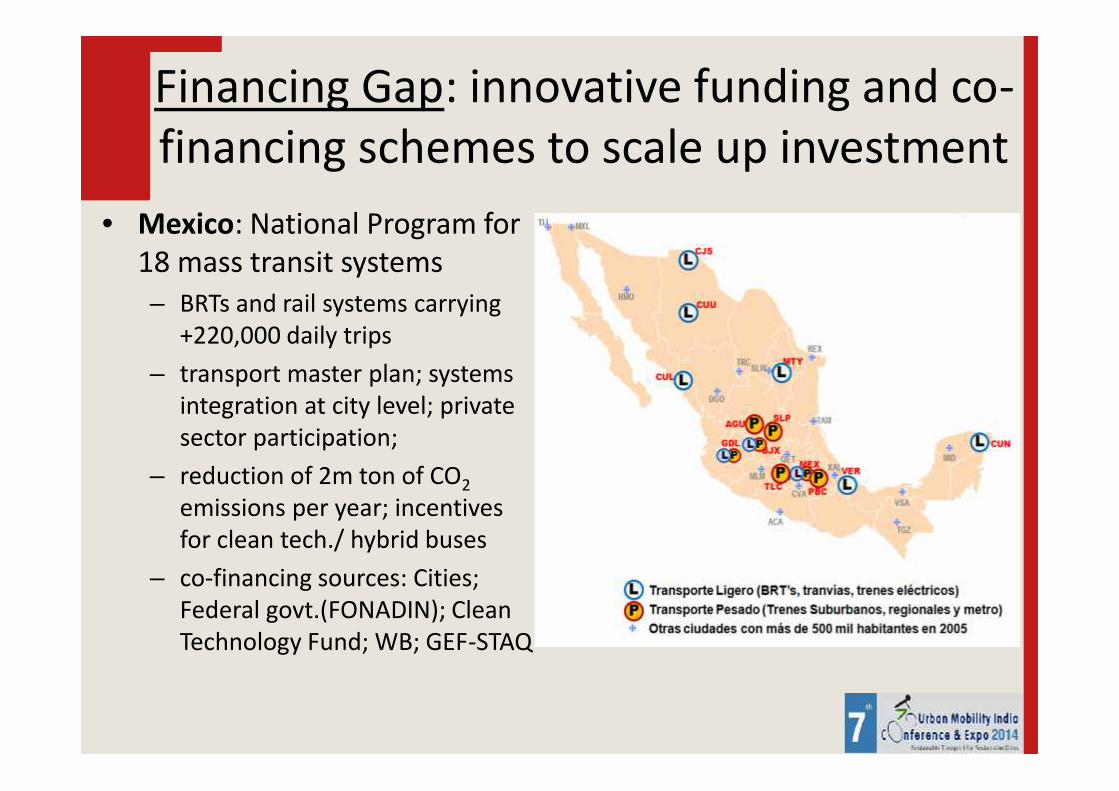
Financing Gap: innovative funding and co-financing schemes to scale up investment
• Mexico: National Program for18 mass transit systems– BRTs and rail systems carrying
+220,000 daily trips– transport master plan; systems
integration at city level; privatesector participation;
– reduction of 2m ton of CO2emissions per year; incentivesfor clean tech./ hybrid buses
– co-financing sources: Cities;Federal govt.(FONADIN); CleanTechnology Fund; WB; GEF-STAQ
Dhanyavaad!Thank You!


