Copyright 2017 ITRI 工業技術研究院 1
Taiwan Energy Transition : for the Harmonization of Economy, Energy, and
Environment
Industrial Technology Research Institute
Canon Institute for Global Studies
December 14, 2017
Tze-Chin PAN, Ph.D.
Copyright 2017 ITRI 工業技術研究院 2
Contents
Part 1. Energy Situation in Taiwan
Part 2. Goals of Energy Transition
Part 3. Challenges of Energy Transition
Part 4. Key Measures for Energy Transition

Copyright 2017 ITRI 工業技術研究院 3
Part 1.
Energy Situation in Taiwan

Copyright 2017 ITRI 工業技術研究院 4
Taiwan Basic Information
Area: 36 thousand km2
Population: 23 million persons
2015 GDP (nominal):
US$ 523 billion
2015 GDP per capita
(nominal): US$ 22 thousand
(ppp-IMF): US$ 49 thousand
Energy Situation in Taiwan (1/7)
Source: ROC Yearbook
Structure of Taiwan GDP
35.0% 63.6% 1.4%
0% 20% 40% 60% 80% 100%
Industrial Services Agricultural

Copyright 2017 ITRI 工業技術研究院 5
0
20,000
40,000
60,000
80,000
100,000
120,000
2000 2002 2004 2006 2008 2010 2012 2014 2016
10
00
KL
OE
98% of Taiwan’s energy consumption are imported.
Fossil energy accounts for nearly 90% of energy supply.
Source:Taiwan Energy Monthly Statistics, 2017.
Energy Situation in Taiwan (2/7)
Industrial
Services (11%)
Residential (11%)
Transportation (12%)
Energy Sector Own Use
Non-Energy Use
Agricultural
37%
Domestic Energy Consumption
(by Sector) from 2000-2016
Total Energy Supply
(by Energy Form) from 2000-2016
-
20,000
40,000
60,000
80,000
100,000
120,000
140,000
160,000
2000 2002 2004 2006 2008 2010 2012 2014 2016
10
00
KL
OE
Nuclear Power (6%)
Coal (29%)
Oil (49%)
LNG (14%)
Renewable Energy (2%)

Copyright 2017 ITRI 工業技術研究院 6
2.2% 1.7% 1.2% 1.2%
50.5%53.5% 49.5% 45.4%
13.7%
7.7%3.3% 4.1%
10.9%
17.0% 25.9% 32.4%
4.0%
3.2%3.5%
4.8%
18.8%
16.9%
16.7%12.0%
0
50,000
100,000
150,000
200,000
250,000
300,000
2001 2006 2011 2016
GWh
RenewableEnergy
Nuclear Power
LNG-Fired
Oil-Fired
Coal-Fired
Hydro Power
-
50,000
100,000
150,000
200,000
250,000
300,000
2000 2002 2004 2006 2008 2010 2012 2014 2016
In 2016, the share of nuclear power was decreased.
Industry sector is the primary consumer of electricity.
Electricity Supply
(by Fuel) from 2000-2016
Domestic Electricity Consumption
(by Sector) from 2000-2016
Source:Taiwan Energy Monthly Statistics, 2017.
Energy Situation in Taiwan (3/7)
(GWh)
Industrial
Services
Residential
Energy Sector Own Use
AgriculturalTransportation
53%

Copyright 2017 ITRI 工業技術研究院 7
0
2
4
6
8
10
12
14
16
2000 2002 2004 2006 2008 2010 2012 2014 2016
Energ
y In
tensity (
LO
E/1
000N
T$)
Domestic Service Industrial Electronic
The energy intensities in all sectors are continuously
improving from 2001 to 2016.
From 2001 to 2016, the improvement of energy intensity in
industrial sector (46%) is better than that in Taiwan (37%).
Energy Situation in Taiwan (4/7)
Source:Taiwan Energy Monthly Statistics, 2016.
Energy Intensity in 2015
37%
46%
Trend of Energy Intensity
(by Sector) from 2000-2016
0.1
0.0920.089
0.0750.07
0.065 0.063
0.053
0.042
0
0.02
0.04
0.06
0.08
0.1
0.12
TF
C/G
DP
(t
oe p
er
thousand 2
010 U
SD
PP
P)
Source:IEA, World Indicator, 2017.

Copyright 2017 ITRI 工業技術研究院 8
The electricity consumption in electronic industry is obviously
higher than other industries. The electronic industry also
contributed the greatest amount of GDP.
Energy Situation in Taiwan (5/7)
Source:Taiwan Energy Monthly Statistics, 2017.
Structure of Industrial Sector
for GDP, Energy Consumption, and Electricity Demand in 2016
47%
25%35%
6.6%
26%19%
6.1% 14% 12%
35.2%21% 24%
0%
20%
40%
60%
80%
100%
GDP Energy Consumption Electricity Demand
Other
Paper & Pulp
Cement
Textile
Iron & Steel Industry
Chemical Industry
Electronic Industy

Copyright 2017 ITRI 工業技術研究院 9
The GDP share of electronic industry is continuously raising
as well as electricity consumption share.
Because of electronic industry’s economic growth, the
electricity demand in 2016 is three times more than it in 2000.
Energy Situation in Taiwan (6/7)
Source:Taiwan Energy Monthly Statistics, 2017.
Share of GDP and Electricity
Consumption for Electronic
Industry
Trend of GDP, Electricity Consumption,
and Electricity Intensity in Electronic
Industry
4.3
3.1
0.7 0.00
0.50
1.00
1.50
2.00
2.50
3.00
3.50
4.00
4.50
2000 2002 2004 2006 2008 2010 2012 2014 2016
GDP Electricity Consumption Electricity Intensity
6.5%
8.7%
16.0%
18.4%
0%
5%
10%
15%
20%
Share of GDP Share of ElectricityConsumption
2000 2016

Copyright 2017 ITRI 工業技術研究院 10
The electricity price in Taiwan fluctuates with international
fossil fuel price.
The low electricity prices reduces the motivation of energy
users to improve energy efficiency.
Energy Situation in Taiwan (7/7)
Source:Taiwan Energy Monthly Statistics, 2017.
Electricity PriceTrend of Electricity Price
2.79
2.54
2.62
1.0
1.5
2.0
2.5
3.0
3.5
2000 2002 2004 2006 2008 2010 2012 2014 2016
Ele
ctr
icity P
rice
(N
T$
/KW
h)
Lighting Power Average
Source:IEA
0.00
0.05
0.10
0.15
0.20
0.25
0.30
0.35
US
$/k
Wh
Household Electricity Price
Industrial Electricity Price

Copyright 2017 ITRI 工業技術研究院 11
Part 2.
Goals of Energy Transition
1. Vision of Energy Transition
2. GHG Emissions Reduction Target
3. 2025 Nuclear Free
4. 2025 Electricity Portfolio (20-30-50)
Copyright 2017 ITRI 工業技術研究院 12
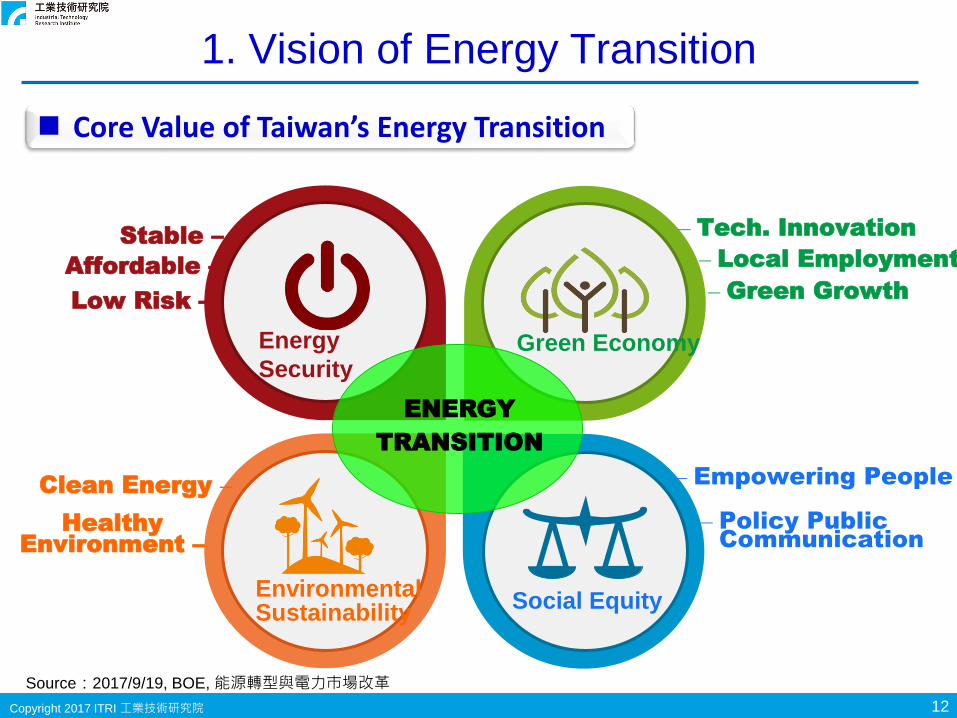
1. Vision of Energy Transition
Core Value of Taiwan’s Energy Transition
Energy
Security
Environmental Sustainability
Green Economy
Social Equity
Stable –
Affordable –
Low Risk –
‒ Tech. Innovation
‒ Local Employment
‒ Green Growth
Clean Energy –
Healthy
Environment –
‒ Empowering People
‒ Policy Public
Communication
ENERGY
TRANSITION
Source:2017/9/19, BOE, 能源轉型與電力巿場改革

Copyright 2017 ITRI 工業技術研究院 13
0
50
100
150
200
250
300
1990 1995 2000 2005 2010 2015 2020 2025 2030 2035 2040 2045 2050
GH
G E
mis
sio
ns (
Mt
CO
2 e
q.)
2. GHG Emissions Reduction Target
Note: The main source of GHGs emission is fuel combustion, which accounts for 87.55%, and the GHGs emission from
industrial process accounts for 7.19%.
Source: Environmental Protection Administration, R.O.C.
50%
133
GHG Emissions Reduction and Management Act
(Base year: 2005)
213
20%
266 263
224
INDC
2%260
Greenhouse Gas Emission Trajectory
GHG Emission Reduction and Management Act
2050: 50% less than 2005.
INDC2030: 20% less than 2005.
Copyright 2017 ITRI 工業技術研究院 14
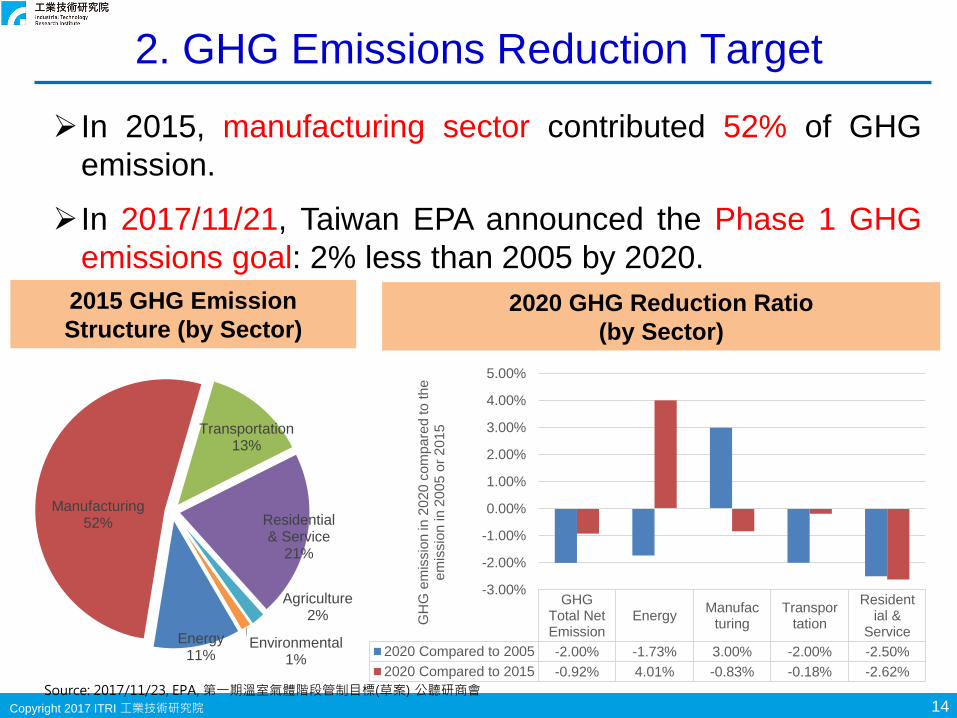
2. GHG Emissions Reduction Target
In 2015, manufacturing sector contributed 52% of GHG
emission.
In 2017/11/21, Taiwan EPA announced the Phase 1 GHG
emissions goal: 2% less than 2005 by 2020.
GHGTotal NetEmission
EnergyManufac
turingTranspor
tation
Residential &
Service
2020 Compared to 2005 -2.00% -1.73% 3.00% -2.00% -2.50%
2020 Compared to 2015 -0.92% 4.01% -0.83% -0.18% -2.62%
-3.00%
-2.00%
-1.00%
0.00%
1.00%
2.00%
3.00%
4.00%
5.00%
GH
G e
mis
sio
n in
20
20
co
mp
are
d to
th
e
em
issio
n in
20
05
or
20
15
Energy11%
Manufacturing52%
Transportation13%
Residential & Service
21%
Agriculture2%
Environmental1%
2015 GHG Emission
Structure (by Sector) 2020 GHG Reduction Ratio
(by Sector)
Source: 2017/11/23, EPA, 第一期溫室氣體階段管制目標(草案) 公聽研商會

Copyright 2017 ITRI 工業技術研究院 15
Basic Environment Act announced in 2002/12
• Article 23: The government shall establish plans to gradually
achieve the goal of becoming a nuclear-free country.
The Electricity Act revised in 2017/01
• Article 95: The nuclear-energy-based power-generating facilities
shall wholly stop running by 2025.
3. Nuclear Free in 2025
NameUnit
No.Capacity
Capacity
Share*
Commission
Date
Decommission
DateStatus
1st nuclear
power plant
# 1 636 MW 1.3% 1978/12 2018/12 Maintenance (from 2014/12)
# 2 636 MW 1.3% 1979/07 2019/07 Spent fuel pool is full.
2nd nuclear
power plant
# 1 985 MW 2.0% 1981/12 2021/12 Operating
# 2 985 MW 2.0% 1983/03 2023/03 Maintenance (from 2016/05)
3rd nuclear
power plant
# 1 951 MW 1.9% 1984/07 2024/07 Operating
# 2 951 MW 1.9% 1985/05 2025/05 Operating
4th nuclear
power plant
# 1 1350 MW-- Progress: 98% Construction halted
# 2 1350 MW
* the nuclear unit share of total Taiwan electricity generating capacity (49.9GW)
Copyright 2017 ITRI 工業技術研究院 16
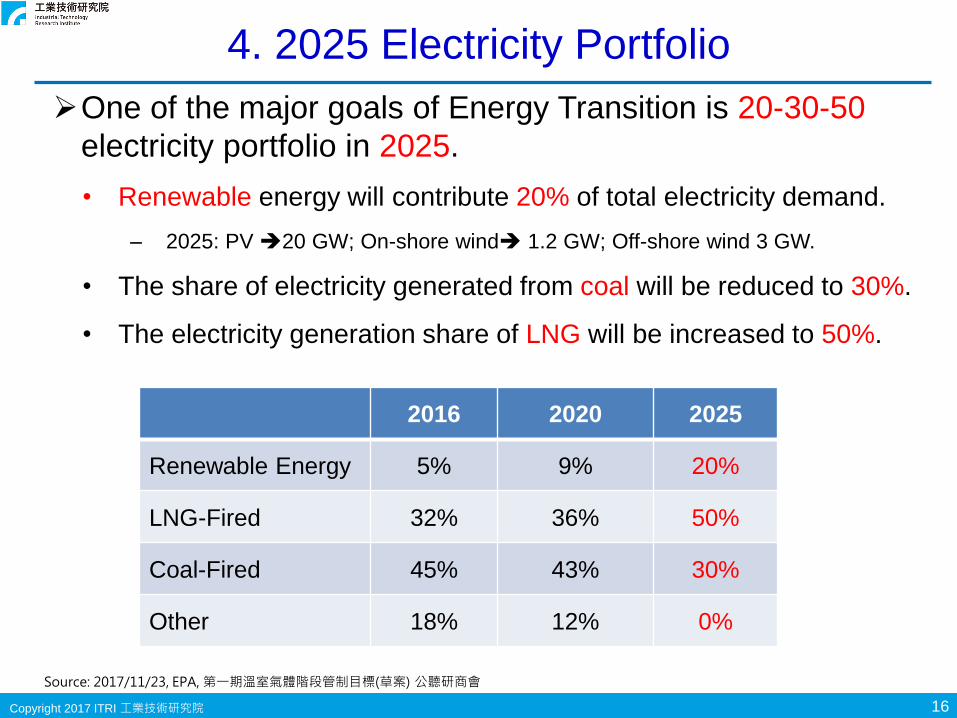
One of the major goals of Energy Transition is 20-30-50
electricity portfolio in 2025.
• Renewable energy will contribute 20% of total electricity demand.
– 2025: PV 20 GW; On-shore wind 1.2 GW; Off-shore wind 3 GW.
• The share of electricity generated from coal will be reduced to 30%.
• The electricity generation share of LNG will be increased to 50%.
4. 2025 Electricity Portfolio
2016 2020 2025
Renewable Energy 5% 9% 20%
LNG-Fired 32% 36% 50%
Coal-Fired 45% 43% 30%
Other 18% 12% 0%
Source: 2017/11/23, EPA, 第一期溫室氣體階段管制目標(草案) 公聽研商會

Copyright 2017 ITRI 工業技術研究院 17
Part 3.
Challenges of Energy Transition
1. Low Reserve Capacity in Recent Years
2. Insufficient Electricity Infrastructure
3. Environmental Conflicts

Copyright 2017 ITRI 工業技術研究院 18
Reserve Margin
• A reserve margin is a measure of the amount of electricity imports
and in-state generation capacity available over average peak
demand conditions. (California Clean Energy Future Metrics)
•𝑀𝑎𝑥𝑖𝑚𝑢𝑚 𝑝𝑙𝑎𝑛𝑛𝑖𝑛𝑔 𝑠𝑢𝑝𝑝𝑙𝑦 𝑐𝑎𝑝𝑎𝑐𝑖𝑡𝑦 −𝑃𝑒𝑎𝑘 𝐷𝑒𝑚𝑎𝑛𝑑
𝑃𝑒𝑎𝑘 𝐷𝑒𝑚𝑎𝑛𝑑
Industrial sector is worried about the power outage.
• Chinese National Federation of Industries, American Chamber of
Commerce in Taipei.
2017/11 Executive Yuan
announced the targets:
• Reserve margin > 15%;
• Operating margin > 10%.
1. Low Reserve Margin (1/2)
19
33
80
102
0
20
40
60
80
100
120
2013 2014 2015 2016 2017
DA
Y
Days of Operating Margin
below 6% in Taiwan
Copyright 2017 ITRI 工業技術研究院 19
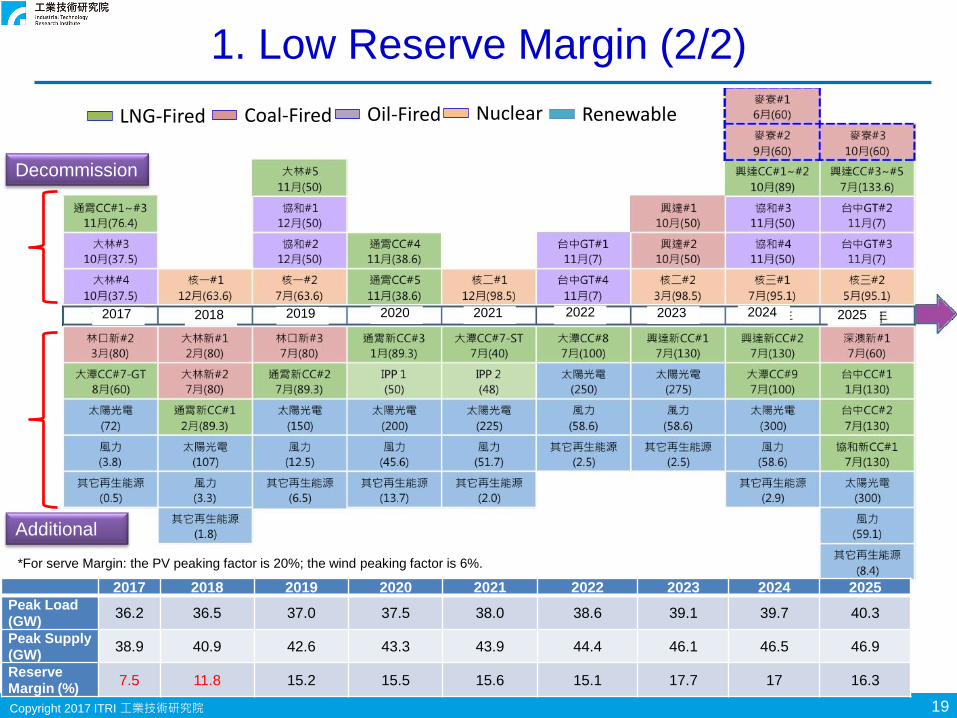
1. Low Reserve Margin (2/2)
LNG-Fired Coal-Fired
Additional
Decommission
Oil-Fired Nuclear Renewable
2017 20192018 2024 20252020 2021 2022 2023
2017 2018 2019 2020 2021 2022 2023 2024 2025
Peak Load (GW)
36.2 36.5 37.0 37.5 38.0 38.6 39.1 39.7 40.3
Peak Supply (GW)
38.9 40.9 42.6 43.3 43.9 44.4 46.1 46.5 46.9
Reserve Margin (%)
7.5 11.8 15.2 15.5 15.6 15.1 17.7 17 16.3
*For serve Margin: the PV peaking factor is 20%; the wind peaking factor is 6%.
Copyright 2017 ITRI 工業技術研究院 20
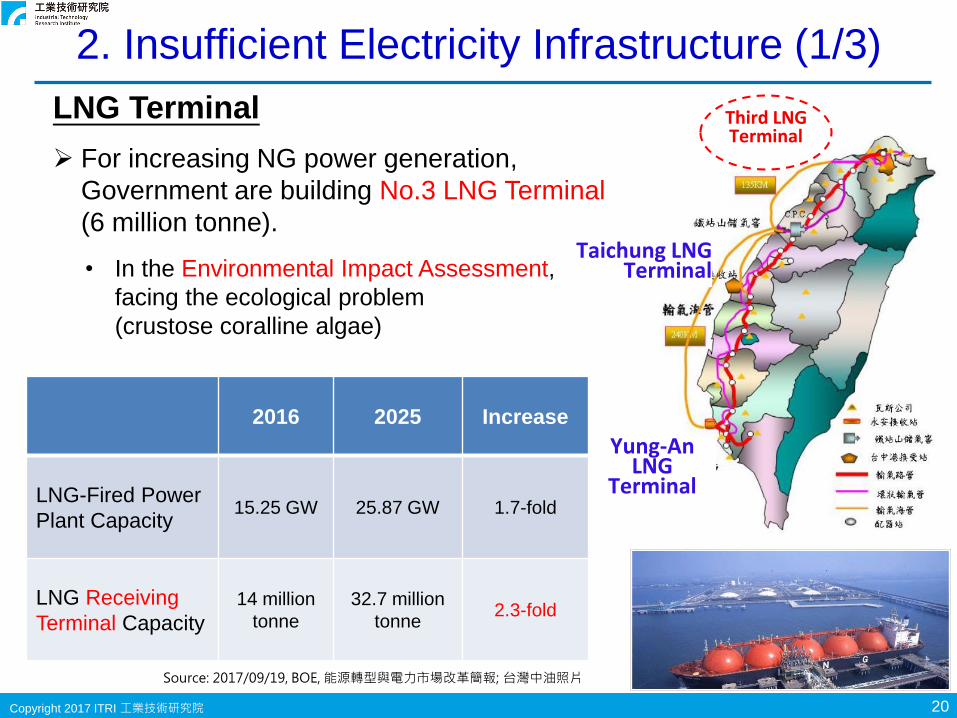
LNG Terminal
For increasing NG power generation,
Government are building No.3 LNG Terminal
(6 million tonne).
• In the Environmental Impact Assessment,
facing the ecological problem
(crustose coralline algae)
2. Insufficient Electricity Infrastructure (1/3)
Source: 2017/09/19, BOE, 能源轉型與電力市場改革簡報; 台灣中油照片
2016 2025 Increase
LNG-Fired Power
Plant Capacity15.25 GW 25.87 GW 1.7-fold
LNG Receiving
Terminal Capacity
14 million
tonne
32.7 million
tonne2.3-fold
Yung-An LNG
Terminal
Taichung LNG Terminal
Third LNG Terminal

Copyright 2017 ITRI 工業技術研究院 21
Electricity Grid Challenge
Electricity Demand in north region
is obviously higher than supply.
In 2017/7/29, the typhoon caused
a transmission tower collapsed,
and prevented 1.3 GW from
Heping power station.
(Loss 4% reserve margin)
2. Insufficient Electricity Infrastructure (2/3)
Source: 2017/11 Taipower, 106年長期電源開發方案(10610案)
Region Supply
in Peak
Demand
in Peak
North 34.5% 39.3%
Central 33.3% 30.0%
South 32.2% 30.7%
Source: Taipower

Copyright 2017 ITRI 工業技術研究院 22
815 Power Outage
On August 15th at 4:51 p.m., an abrupt disruption in the natural gas
supply at Taipower Datan Power Plant caused 6 power generators
(4.38 GW) to shut down immediately.
• Reduced the nation’s power supply by 12% (5.92 million users impacted)
• Fully restored power by 9:40 p.m.
2. Insufficient Electricity Infrastructure (3/3)
Source: 2017/09/07 行政院815停電事故行政調查專案報告
Copyright 2017 ITRI 工業技術研究院 23
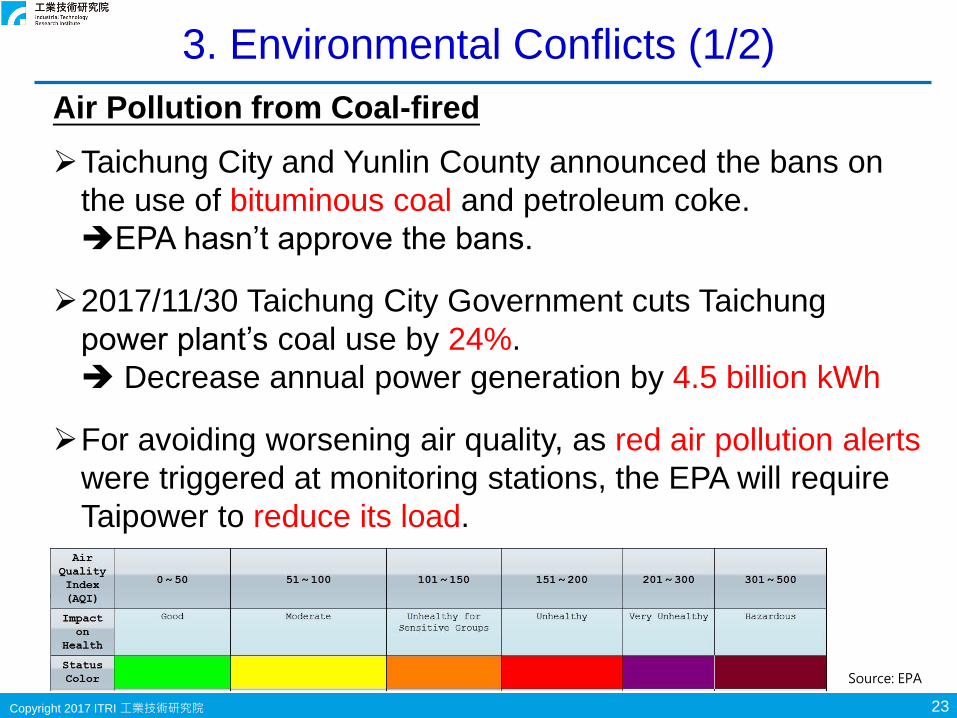
Air Pollution from Coal-fired
Taichung City and Yunlin County announced the bans on
the use of bituminous coal and petroleum coke.
EPA hasn’t approve the bans.
2017/11/30 Taichung City Government cuts Taichung
power plant’s coal use by 24%.
Decrease annual power generation by 4.5 billion kWh
For avoiding worsening air quality, as red air pollution alerts
were triggered at monitoring stations, the EPA will require
Taipower to reduce its load.
3. Environmental Conflicts (1/2)
Source: EPA

Copyright 2017 ITRI 工業技術研究院 24
Nuclear Free Problem
Difficult to set the site for final disposal of spent nuclear
fuel.
Local government doesn’t allow to set the dry cask storage
of spent nuclear fuel.
The spent fuel pool in 1st nuclear power station No. 2 unit is full.
The construction of 4th Nuclear Power Plant has been
halted from 2015/07.
3. Environmental Conflicts (2/2)
Source: Taipower

Copyright 2017 ITRI 工業技術研究院 25
Part 4.
Key Measures for Energy Transition
1. Renewable Energy Development
2. Peak Load Management
3. Energy Conservation
4. Inter-Ministerial Cooperation

Copyright 2017 ITRI 工業技術研究院 26
1. Renewable Energy Development (1/4)
Expand Renewable Energy Development Target
2010
2011
2014
2015
2016
10,858 MW
(by 2030)
13,750 MW
(by 2030)
12,502 MW
(by 2030)
17,250 MW
(by 2030)
PowerGeneration
20%
Copyright 2017 ITRI 工業技術研究院 27
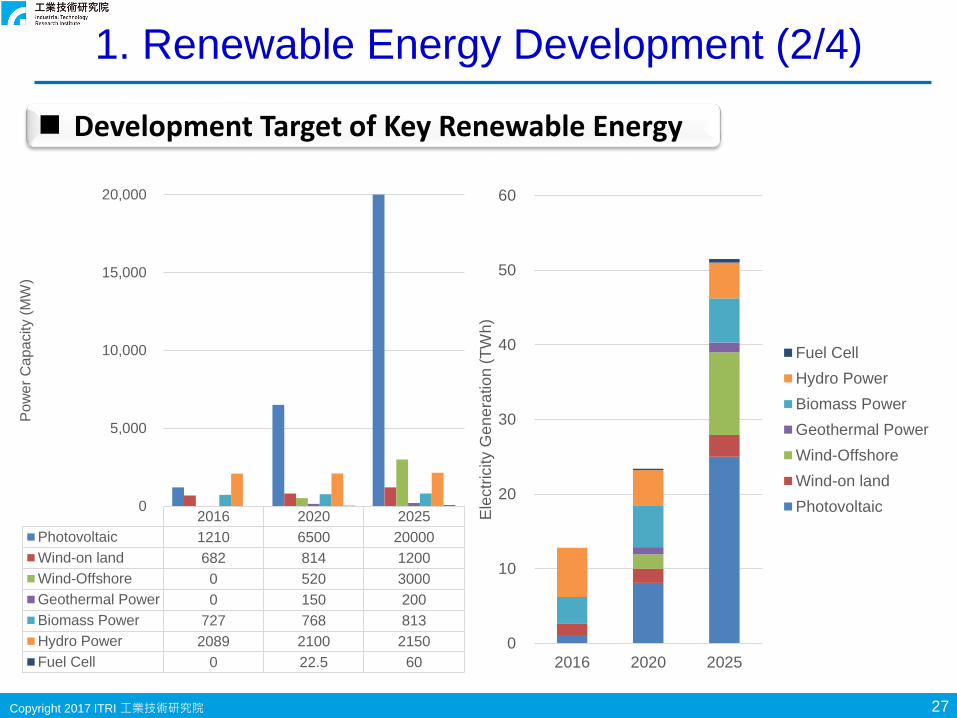
1. Renewable Energy Development (2/4)
Development Target of Key Renewable Energy
0
10
20
30
40
50
60
2016 2020 2025
Ele
ctr
icity G
en
era
tio
n (
TW
h)
Fuel Cell
Hydro Power
Biomass Power
Geothermal Power
Wind-Offshore
Wind-on land
Photovoltaic2016 2020 2025
Photovoltaic 1210 6500 20000
Wind-on land 682 814 1200
Wind-Offshore 0 520 3000
Geothermal Power 0 150 200
Biomass Power 727 768 813
Hydro Power 2089 2100 2150
Fuel Cell 0 22.5 60
0
5,000
10,000
15,000
20,000
Po
we
r C
apa
city (
MW
)
Copyright 2017 ITRI 工業技術研究院 28
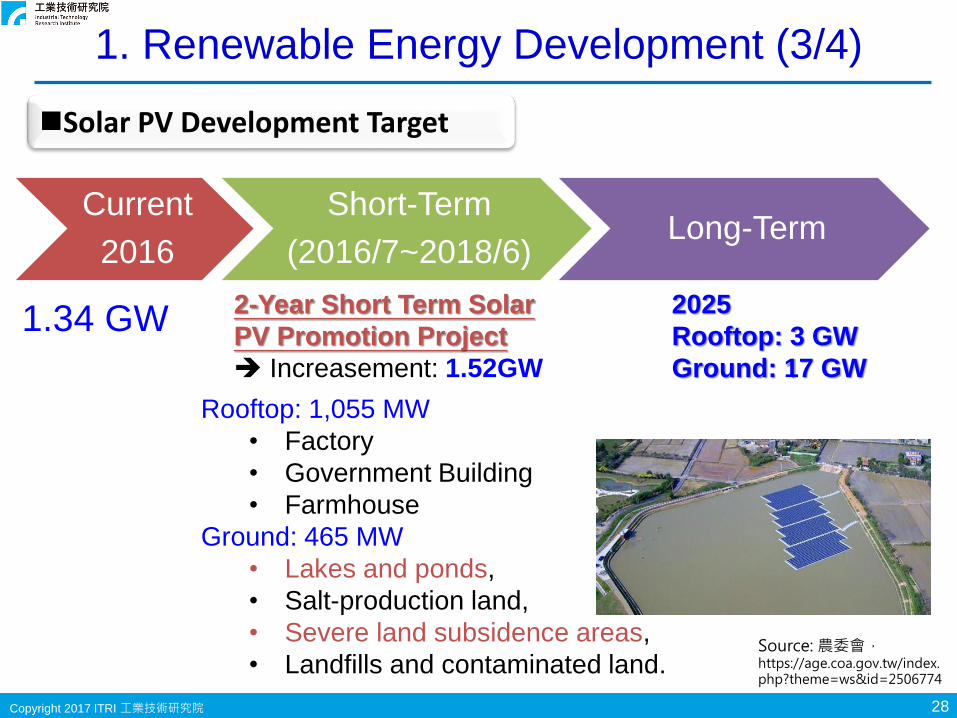
1. Renewable Energy Development (3/4)
Solar PV Development Target
Current
2016
Short-Term
(2016/7~2018/6)Long-Term
1.34 GW2-Year Short Term Solar
PV Promotion Project
Increasement: 1.52GW
Rooftop: 1,055 MW
• Factory
• Government Building
• Farmhouse
Ground: 465 MW
• Lakes and ponds,
• Salt-production land,
• Severe land subsidence areas,
• Landfills and contaminated land.
2025
Rooftop: 3 GW
Ground: 17 GW
Source: 農委會,https://age.coa.gov.tw/index.php?theme=ws&id=2506774

Copyright 2017 ITRI 工業技術研究院 29
1. Renewable Energy Development (4/4)
Wind Turbines Development Target
2016 2020 2025
On land
• First develop best wind farm
• Then ancillary wind farm.
Offshore
• Develop shallow sea area first
• Then develop deep water area.
Four-year plan
687 MW 814 MW 1,200 MW
2 Demo
Wind
Turbines
3MW
3 Demo
Wind Farm
520 MW
Zonal
Development
3,000 MW

Copyright 2017 ITRI 工業技術研究院 30
2. Peak Load Management
Expand Time of Use Tariff
Promoting Virtual Power Plants
and Aggregator
Increasing
Time-of-Use Tariff
Participants
Raising Residential and Commercial
Sectors’ Time-of-Use Tariff
Expanding Demand Bidding
Measures
Peak LoadManagement
Increasing Electricity supply, Raising Operating Reserve, Reducing Peak Load
Broaden Demand Response Measures
Ensuring Electricity Supply
Source:2017/3/27. BOE

Copyright 2017 ITRI 工業技術研究院 31
3. Energy Conservation (1/4)
1
2
3 1% mandatory electricity
saving target for large users (>800 kW)
4
Iron & Steel Petrochemical Paper & Pulp Electronics Cement Textiles
Energy Audit Establish internal
energy conservation working group
Advisory &Subsidies
Voluntary Electricity Conservation
E.E. Regulation for 6 Energy Intensive Industries
Mandatory Electricity-Saving Target
Industrial Energy Efficiency Management
Waste Heat Recovery Energy Saving Performance Contract High efficiency pump, fan, air compress
Energy Intensity 2025: 50% less than 2005
Source:2016/9/9. MOEA
Copyright 2017 ITRI 工業技術研究院 32
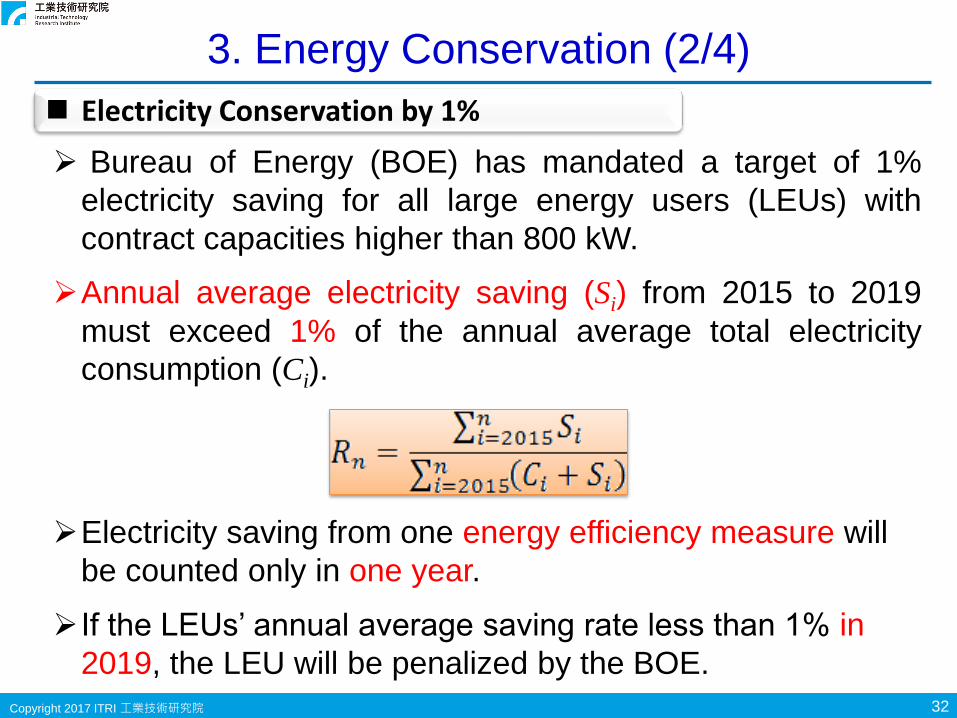
3. Energy Conservation (2/4)
Bureau of Energy (BOE) has mandated a target of 1%
electricity saving for all large energy users (LEUs) with
contract capacities higher than 800 kW.
Annual average electricity saving (Si) from 2015 to 2019
must exceed 1% of the annual average total electricity
consumption (Ci).
Electricity saving from one energy efficiency measure will
be counted only in one year.
If the LEUs’ annual average saving rate less than 1% in
2019, the LEU will be penalized by the BOE.
Electricity Conservation by 1%
Copyright 2017 ITRI 工業技術研究院 33
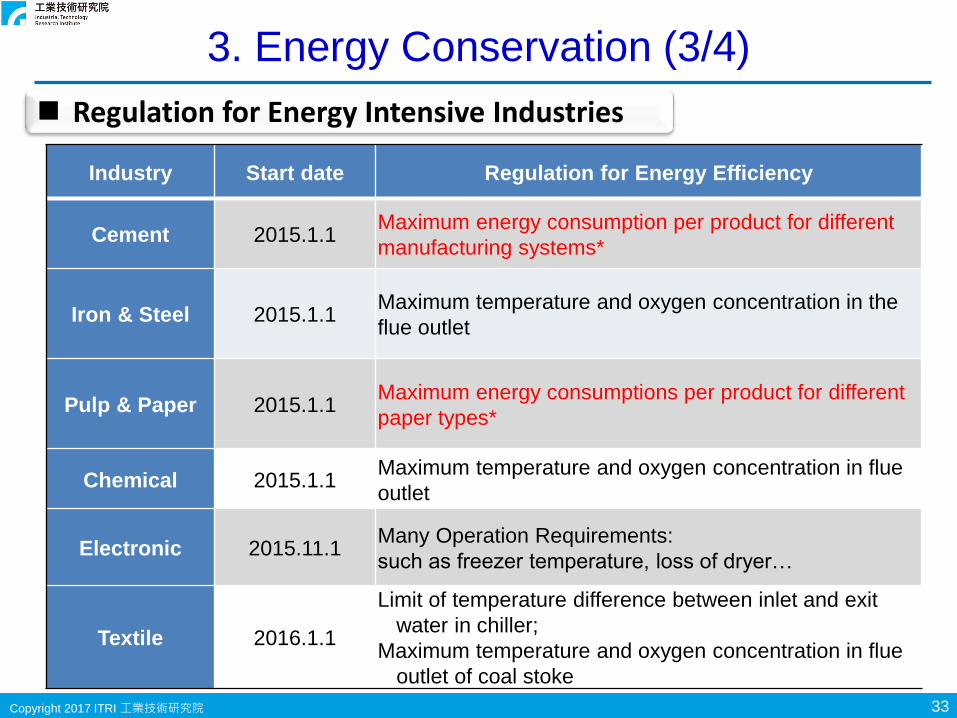
3. Energy Conservation (3/4)
Industry Start date Regulation for Energy Efficiency
Cement 2015.1.1Maximum energy consumption per product for different
manufacturing systems*
Iron & Steel 2015.1.1Maximum temperature and oxygen concentration in the
flue outlet
Pulp & Paper 2015.1.1Maximum energy consumptions per product for different
paper types*
Chemical 2015.1.1Maximum temperature and oxygen concentration in flue
outlet
Electronic 2015.11.1Many Operation Requirements:
such as freezer temperature, loss of dryer…
Textile 2016.1.1
Limit of temperature difference between inlet and exit
water in chiller;
Maximum temperature and oxygen concentration in flue
outlet of coal stoke
Regulation for Energy Intensive Industries

Copyright 2017 ITRI 工業技術研究院 34
3. Energy Conservation (4/4)
Launching a New Electricity Saving Campaign
New Electricity
SavingCampaign
Government Agency
Energy Saving program
EUI Benchmark
Energy Efficiency Upgrade Plan for Motor and Utility Facilities
Subsidy (2017~2018)
Building local energy governance capacity(2017)
Accredited Agency
Electricity Saving Volunteer
Launch pilot program of interactive energy savingexhibition of AMI/HEMS
2017 2019
4%• Fan
• Pump
• Air Compressor
• System Optimization for
Air Conditioning
Source:2017/9/19, BOE, 能源轉型與電力巿場改革

Copyright 2017 ITRI 工業技術研究院 35
4. Inter-Ministerial Cooperation
Committee on Energy and Carbon Reduction
Committee Members (14-16 ministers)
( 11 Minister, CEO of NEP, CEO of ECRO, 3-5 Experts)
Chair and Co-chair: Ministers without Portfolio 3 Vice Chairmen: Ministers of MOEA, MOST, and EPA
Public Participation Platform
Local Government Contact Person
Policy Meeting
Working Group
Green Economy
Energy Security
EnvironmentalSustainability
Energy and Carbon Reduction Office (ECRO)Consultants
Committee on Energy and Carbon Reduction
Source: BOE,2017

Copyright 2017 ITRI 工業技術研究院 36
Closing Remark

Copyright 2017 ITRI 工業技術研究院 37
Closing Remarks As highly dependent on the imported energy and fossil
energy, Taiwan will encounter serious challenges while
facing the global energy situation and GHG emission in
the future.
For achieving the vision of low carbon and no nuclear,
the government announce the energy transition policy.
In the process of energy transition, Taiwan might face
the challenges of low reserve margin, insufficient
infrastructure, and environmental conflicts.
Great achievement to energy transition would require not
only an total-solution technology, but also a successful
promotion policy.

Copyright 2017 ITRI 工業技術研究院 38
Thank You For Your Attention


