
1
1
Taiyo Nippon Sanso Corporation
Jefferies 2013 Global Industrials Conference August 13, 2013
1
Taiyo Nippon Sanso Corporation (TNSC)
One of the five global gas majors
Global sales > $5 billion
Over 11,000 employees
Founded in 1910
Technology Development
Global network in 17 countries
5th largest industrial gas supplier in the worldLargest in Japan
Portfolio includes space simulation, superconductivity, hydrogen fueling, healthcare, semiconductor manufacturing, and, of course, air separation
5.5% 10-year CAGR
Nippon Sanso (1910) and Taiyo Toyo Sanso (1946) merged in 2004
2
2
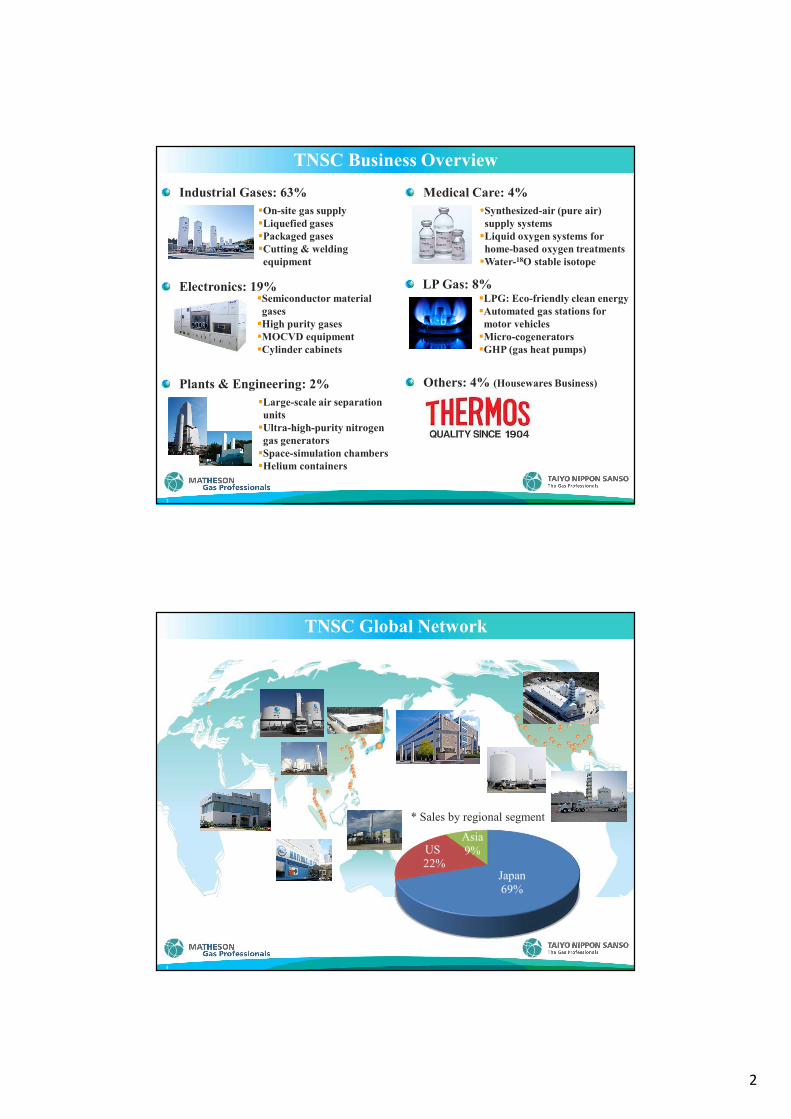
TNSC Business Overview
3
On-site gas supplyLiquefied gasesPackaged gasesCutting & welding equipment
Semiconductor material gasesHigh purity gasesMOCVD equipmentCylinder cabinets
Large-scale air separation unitsUltra-high-purity nitrogen gas generatorsSpace-simulation chambers Helium containers
Synthesized-air (pure air) supply systemsLiquid oxygen systems for home-based oxygen treatmentsWater-18O stable isotope
Industrial Gases: 63%
Electronics: 19%
Plants & Engineering: 2%
Medical Care: 4%
LPG: Eco-friendly clean energyAutomated gas stations for motor vehiclesMicro-cogeneratorsGHP (gas heat pumps)
LP Gas: 8%
Others: 4% (Housewares Business)
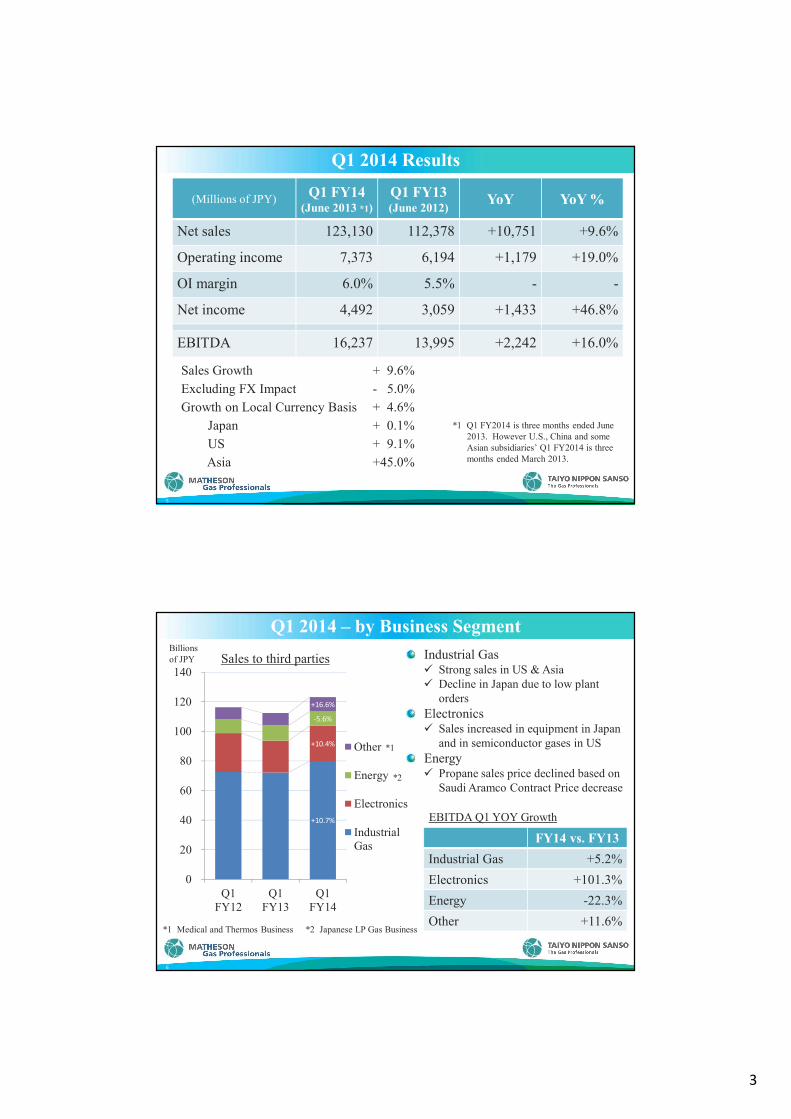
TNSC Global Network
4
Japan 69%
US22%
Asia9%
* Sales by regional segment
3
Q1 2014 Results
(Millions of JPY) Q1 FY14(June 2013 *1)
Q1 FY13(June 2012) YoY YoY %
Net sales 123,130 112,378 +10,751 +9.6%
Operating income 7,373 6,194 +1,179 +19.0%
OI margin 6.0% 5.5% - -
Net income 4,492 3,059 +1,433 +46.8%
EBITDA 16,237 13,995 +2,242 +16.0%
5
Sales Growth + 9.6% Excluding FX Impact - 5.0%Growth on Local Currency Basis + 4.6%
Japan + 0.1%US + 9.1%Asia +45.0%
*1 Q1 FY2014 is three months ended June 2013. However U.S., China and some Asian subsidiaries’ Q1 FY2014 is three months ended March 2013.
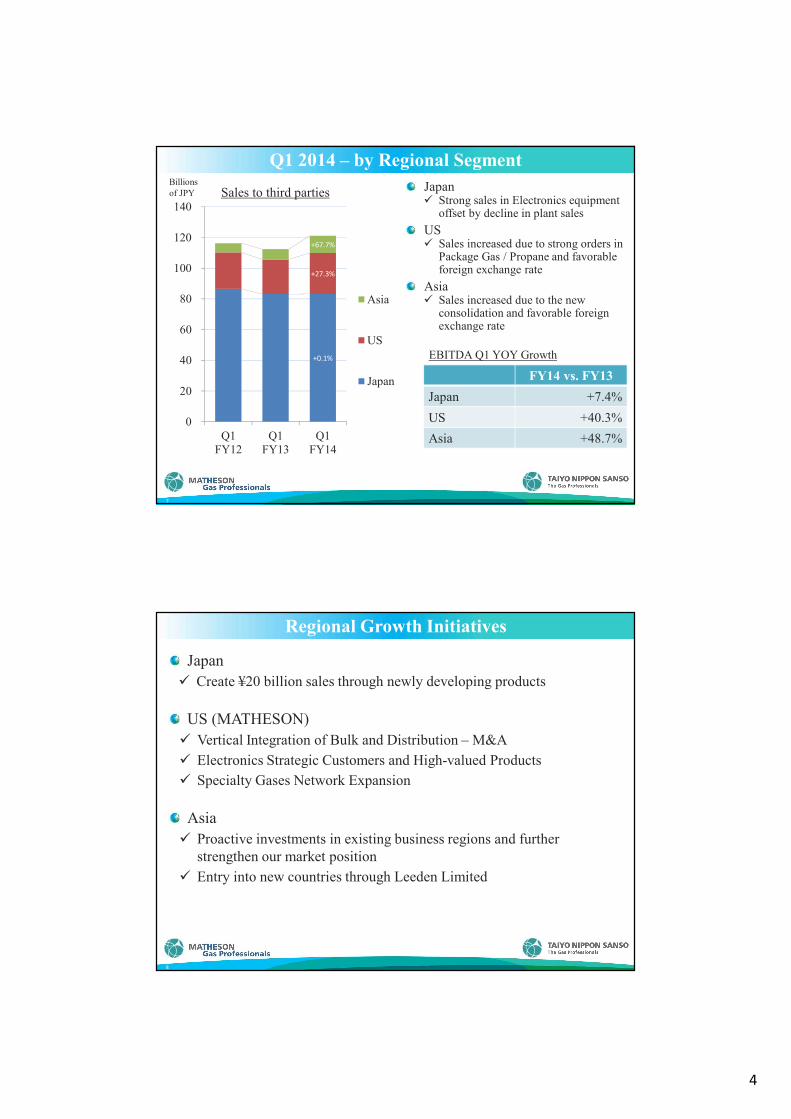
Q1 2014 – by Business Segment
6
+10.7%
+10.4%
-5.6%
+16.6%
0
20
40
60
80
100
120
140
Q1FY12
Q1FY13
Q1FY14
Other
Energy
Electronics
IndustrialGas
Sales to third parties
EBITDA Q1 YOY Growth
FY14 vs. FY13Industrial Gas +5.2%Electronics +101.3%Energy -22.3%Other +11.6%
Billions of JPY
*2
*1
Industrial GasStrong sales in US & AsiaDecline in Japan due to low plant orders
ElectronicsSales increased in equipment in Japan and in semiconductor gases in US
EnergyPropane sales price declined based on Saudi Aramco Contract Price decrease
*1 Medical and Thermos Business *2 Japanese LP Gas Business
4
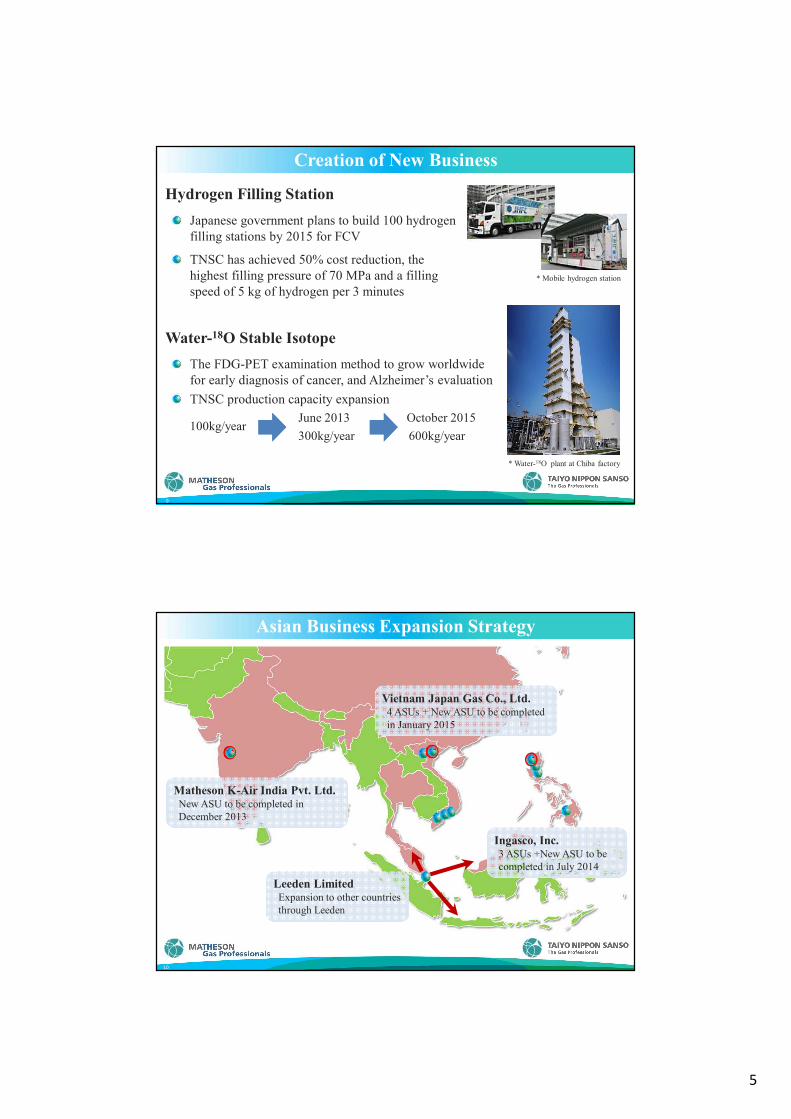
Q1 2014 – by Regional Segment
7
+0.1%
+27.3%
+67.7%
0
20
40
60
80
100
120
140
Q1FY12
Q1FY13
Q1FY14
Asia
US
Japan
Sales to third parties
EBITDA Q1 YOY Growth
FY14 vs. FY13Japan +7.4%US +40.3%Asia +48.7%
Billions of JPY Japan
Strong sales in Electronics equipment offset by decline in plant sales
USSales increased due to strong orders in Package Gas / Propane and favorable foreign exchange rate
AsiaSales increased due to the new consolidation and favorable foreign exchange rate
Regional Growth Initiatives
8
JapanCreate ¥20 billion sales through newly developing products
US (MATHESON)Vertical Integration of Bulk and Distribution – M&AElectronics Strategic Customers and High-valued ProductsSpecialty Gases Network Expansion
AsiaProactive investments in existing business regions and further strengthen our market positionEntry into new countries through Leeden Limited
5
Creation of New Business
9
Hydrogen Filling StationJapanese government plans to build 100 hydrogen filling stations by 2015 for FCV
TNSC has achieved 50% cost reduction, the highest filling pressure of 70 MPa and a filling speed of 5 kg of hydrogen per 3 minutes
The FDG-PET examination method to grow worldwide for early diagnosis of cancer, and Alzheimer’s evaluationTNSC production capacity expansion
June 2013 October 2015300kg/year 600kg/year
Water-18O Stable Isotope
* Water-18O plant at Chiba factory
100kg/year
* Mobile hydrogen station
Asian Business Expansion Strategy
10
Vietnam Japan Gas Co., Ltd.4 ASUs + New ASU to be completed in January 2015
Ingasco, Inc. 3 ASUs +New ASU to be completed in July 2014
Leeden LimitedExpansion to other countries through Leeden
Matheson K-Air India Pvt. Ltd.New ASU to be completed in December 2013
6
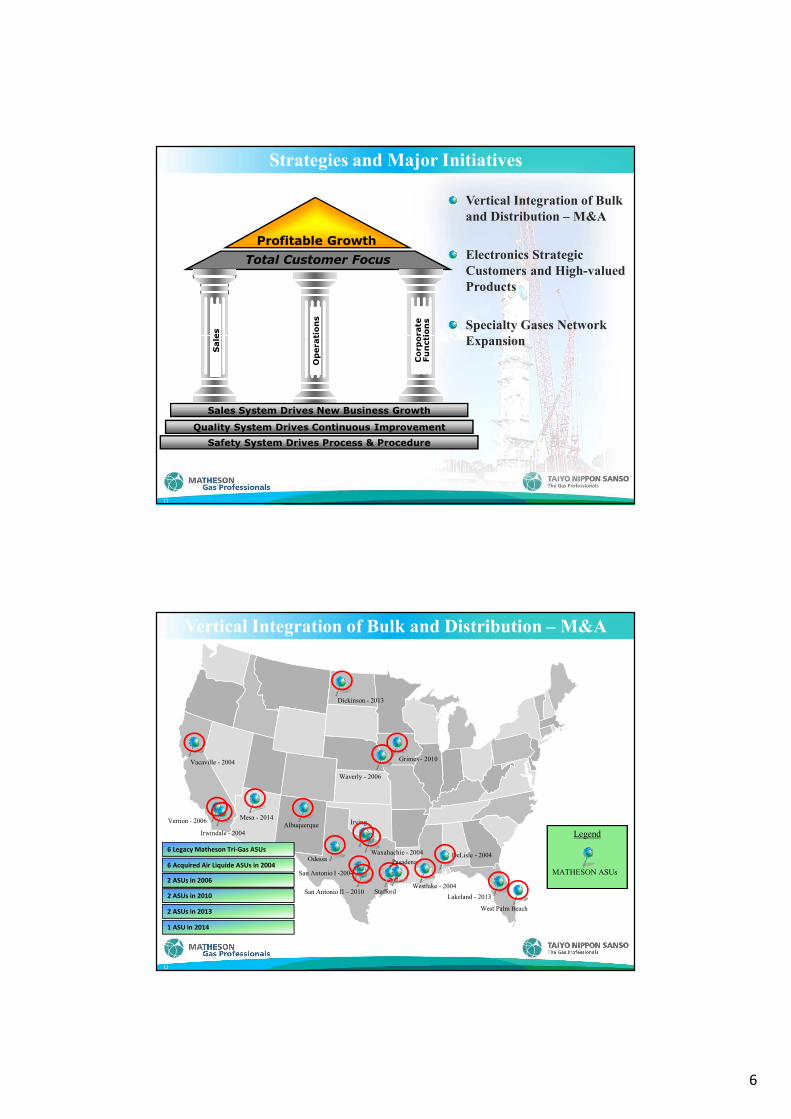
Strategies and Major Initiatives
Quality System Drives Continuous Improvement
Safety System Drives Process & Procedure
Total Customer FocusProfitable Growth
Sale
s
Corp
ora
te
Fu
nct
ion
s
Op
era
tion
s
Sales System Drives New Business Growth
Vertical Integration of Bulk and Distribution – M&A
Electronics Strategic Customers and High-valued Products
Specialty Gases Network Expansion
11
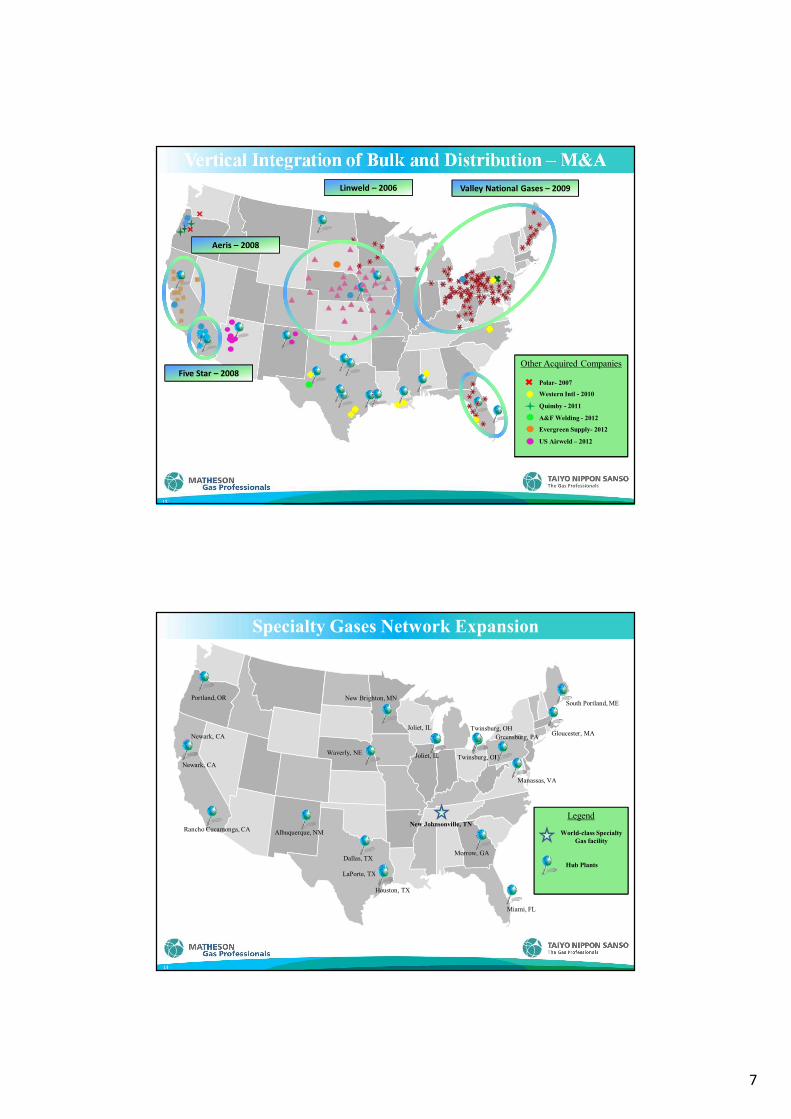
Vertical Integration of Bulk and Distribution – M&A
12
Legend
MATHESON ASUs
Waverly - 2006
Vernon - 2006
San Antonio II – 2010
Grimes - 2010
Waxahachie - 2004 DeLisle - 2004
Westlake - 2004
Irwindale - 2004
Vacaville - 2004
San Antonio I -2004
Mesa - 2014
Lakeland - 2013
Dickinson - 2013
6 Legacy Matheson Tri-Gas ASUs
6 Acquired Air Liquide ASUs in 2004
2 ASUs in 2006
2 ASUs in 2010
2 ASUs in 2013
1 ASU in 2014
West Palm Beach
Stafford
Odessa
Albuquerque Irving
Pasadena
7
Vertical Integration of Bulk and Distribution – M&A
13
Other Acquired Companies
Quimby - 2011
Polar- 2007
Western Intl - 2010
A&F Welding - 2012
Evergreen Supply- 2012
US Airweld – 2012
Linweld – 2006
Aeris – 2008
Five Star – 2008
Valley National Gases – 2009
Specialty Gases Network Expansion
14
Newark, CAJoliet, IL
LaPorte, TX
Morrow, GA
Gloucester, MA
Twinsburg, OH
New Johnsonville, TN
Joliet, ILNewark, CA
Rancho Cucamonga, CA Albuquerque, NM
Dallas, TX
Houston, TX
Miami, FL
Twinsburg, OHGreensburg, PA
Manassas, VA
South Portland, ME
Waverly, NE
New Brighton, MNPortland, OR
Legend
Hub Plants
World-class Specialty Gas facility

8
Full Year FY2014 Outlook
15
(Millions of JPY)FY14
Projection(March 2014)
FY13Actual
(March 2013)YoY YoY %
Net sales 514,000 468,387 +45,613 +9.7%Operating income 31,500 24,884 +6,616 +26.6%OI margin 6.1% 5.3% - -Net income (loss) 17,100 (2,071) +19,171 -
EBITDA 68,600 57,277 +11,323 +19.8%
Sales Growthw/o FX impact
+ 6.6%
Sales Growth with FX impact
+ 9.7 %
Sales by Region (excluding currency effect *)
16
20.6% 19.9% 21.0%
24.9% 23.7% 24.2%25.8% 26.1%
29.6% 30.6%
50.0%
0%
10%
20%
30%
40%
50%
60%
0
2,000
4,000
6,000
FY05 FY08 FY11 FY14Japan US Asia Overseas sales ratio
Millions of USD
* Exchange Rate: USD 1 = JPY 100
9
Thank you!


