Download - TARGET AND NORM CHARTS

September, 2014 • St. Croix River Education District
TARGET AND NORM CHARTS
2014-2015 School Year
St. Croix River Education District
Please discard your “blue packet” from the 2013-2014 school year, and replace it with this current “pink packet”
of targets and norms for our assessments.

2014-15 Targets & Norms 2
September, 2014 • St. Croix River Education District
Highlights What’s new?
Updated norms for 3 year old children are included for IGDI’s and Early Literacy.
Preschool Numeracy Indicators (pg. 9) early numeracy norms have been added.
9th and 10th grade MAP Math targets have been updated.
An appendix has been added, including clarification on the differences between norms and predictive targets.
All norms are listed in italics; predictive targets are in normal print.
What’s the same?
Oral Reading Fluency and MAP Reading data from 2013-14 were analyzed by TIES. Results were nearly identical to those obtained in the previous school year, and the ORF and MAP Reading targets will remain the same in the 2014-15 school year.
Written Expression norms are the same. They are not scheduled to be updated until the 2017-18 school year.
Kindergarten and Grade 1 literacy measures
Kindergarten and Grade 1 numeracy measures
Math Facts
Math Concepts and Applications
A note about goal setting:
Goals for interventions should be ambitious, but realistic. For measures that have multiple benchmarks: individual student goals can be written for students to reach the greatest benchmark target score (labeled as “low risk”) unless an IEP team for a particular student entitled to special education services determines a different goal for that student.
If you have questions contact:
Kindle Perkins-Kabat, Outcomes Manager email: [email protected] Adam Lekwa, Instructional Services Coordinator email: [email protected]

2014-15 Targets & Norms 3
September, 2014
St. Croix River Education District
Preschool Early Literacy Individual Growth and Development Indicators (IGDIs)
Items Correct in Allotted Time
Revised August, 2014
Measure Age Risk Fall Winter Spring
Alliteration
E3
Norms
Low 4
Moderate 2 - 3
High 1
E4, E5
Targets
Low 8
Moderate 5 - 7
High 4
Picture Naming
E3
Norms
Low 26
Moderate 16 - 25
High 15
E4, E5
Targets
Low 26
Moderate 16 - 25
High 15
Rhyming
E3
Norms
Low 7
Moderate 4 - 6
High 3
E4, E5
Targets
Low 12
Moderate 7 - 11
High 6
*E3 scores are normative performance scores for children that are 3 years old by Sept 1st (Norms are based on data from Minnesota Reading Corps.) *E4 & E5 scores are Target Scores for Spring Prior to Entering Kindergarten, and predict Kindergarten Fall LNF success. *Moderate and high risk targets are based on professional judgment distinguishing between students who are near target from those far from target. Note: The spring scores will be set in TIES for each benchmark season (Fall, Win, Spr) so that teachers can see how students are making progress toward the spring norm or predictive target as the year progresses.

2014-15 Targets & Norms 4
September, 2014
St. Croix River Education District
Preschool Early Literacy AIMSweb Tests of Early Literacy (TEL)
Items Correct in One Minute
Revised August, 2014
Measure Age Risk Fall Winter Spring
Letter Naming
(non-timed)
E3
Norms
Low 8
Moderate 5 - 7
High 4
Letter Naming
Fluency
E4, E5
Targets
Low 6 9 14
Moderate 2 - 5 3 - 8 8 - 13
High 1 2 7
Letter Sound
Fluency
E4, E5
Targets
Low 1 4 10
Moderate 2 - 3 5 - 9
High 1 4
*E3 scores are normative performance scores for students that are 3 years old by Sept 1st (Norms are based on data from Minnesota Reading Corps). *E4 & E5 scores are Target Scores for Spring Prior to Entering Kindergarten,
- Fall, Win, Spr LNF predicts Kindergarten Fall LNF success. - Fall, Win, Spr LSF predicts Kindergarten November LSF success.
*Moderate and high risk targets are based on professional judgment distinguishing between students who are near target from those far from target. Note: Only the spring scores will be set in TIES for each benchmark season (Fall, Win, Spr). The Fall and Win targets listed above (for LNF and LSF) should be used as guidance for IEP goals.
2014-15 Targets & Norms 5
Low Risk = at least a 75% chance of passing criterion September, 2014
Moderate Risk = 50% chance of passing criterion St. Croix River Education District
High Risk = at best a 25% chance of passing criterion
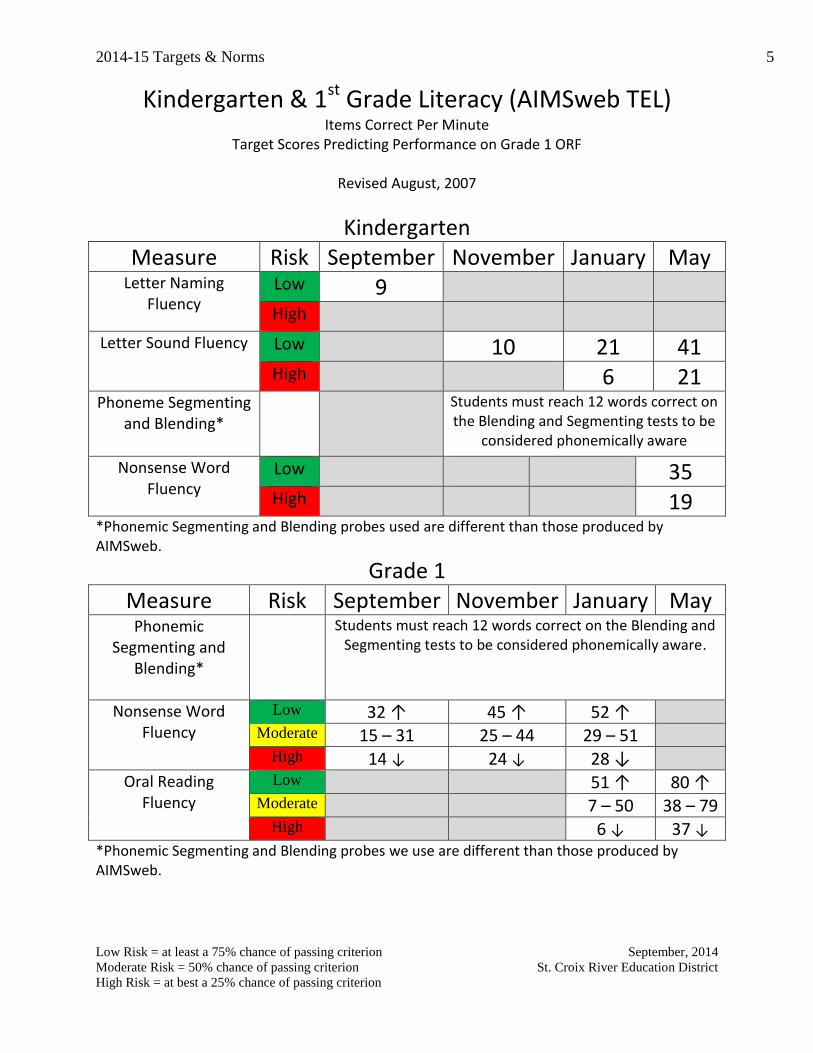
Kindergarten & 1st Grade Literacy (AIMSweb TEL) Items Correct Per Minute
Target Scores Predicting Performance on Grade 1 ORF
Revised August, 2007
Kindergarten Measure Risk September November January May
Letter Naming Fluency
Low 9 High
Letter Sound Fluency Low 10 21 41 High 6 21
Phoneme Segmenting and Blending*
Students must reach 12 words correct on the Blending and Segmenting tests to be
considered phonemically aware
Nonsense Word Fluency
Low 35 High 19
*Phonemic Segmenting and Blending probes used are different than those produced by AIMSweb.
Grade 1 Measure Risk September November January May
Phonemic Segmenting and
Blending*
Students must reach 12 words correct on the Blending and Segmenting tests to be considered phonemically aware.
Nonsense Word Fluency
Low 32 ↑ 45 ↑ 52 ↑ Moderate 15 – 31 25 – 44 29 – 51
High 14 ↓ 24 ↓ 28 ↓ Oral Reading
Fluency
Low 51 ↑ 80 ↑ Moderate 7 – 50 38 – 79
High 6 ↓ 37 ↓ *Phonemic Segmenting and Blending probes we use are different than those produced by AIMSweb.

2014-15 Targets & Norms 6
Low Risk = at least a 75% chance of passing criterion September, 2014
Moderate Risk = 50% chance of passing criterion St. Croix River Education District
High Risk = at best a 25% chance of passing criterion
Oral Reading Fluency (AIMSweb R-CBM) Words Read Correct Per Minute
Target Scores Predicting Performance on AIR MCA-III Reading Revised October, 2013
SPED and ADSIS: monitor students once per week using ORF.
Grade Risk Level Fall Benchmark Winter Benchmark Spring Benchmark
1
Low NA 51 ↑ 80 ↑
Moderate NA 7-50 38-79
High NA 6 ↓ 37 ↓
2
Low 71 ↑ 100 ↑ 118 ↑
Moderate 31-70 64-99 82-117
High 30 ↓ 63 ↓ 81 ↓
3
Low 100 ↑ 123 ↑ 138 ↑
Moderate 59-99 88-122 100-137
High 58 ↓ 87 ↓ 99 ↓
4
Low 123 ↑ 148 ↑ 160 ↑
Moderate 81-122 106-147 118-159
High 80 ↓ 105 ↓ 117 ↓
5
Low 126 ↑ 149 ↑ 161 ↑
Moderate 85-125 106-148 117-160
High 84 ↓ 105 ↓ 116 ↓
6
Low 148 ↑ 168 ↑ 178 ↑
Moderate 106-147 123-167 131-177
High 105 ↓ 122 ↓ 130 ↓
7
Low 175 ↑ 181 ↑ 181 ↑
Moderate 126-174 141-180 160-180
High 125 ↓ 140 ↓ 159 ↓
8
Low 175 ↑ 181 ↑ 181 ↑
Moderate 134-174 144-180 163-180
High 133 ↓ 143 ↓ 162 ↓

2014-15 Targets & Norms 7
Low Risk = at least a 75% chance of passing criterion September, 2014
Moderate Risk = 50% chance of passing criterion St. Croix River Education District
High Risk = at best a 25% chance of passing criterion
Measures of Academic Progress – Reading TIES-Wide Target Scores Predicting Performance on AIR MCA-III Reading
Revised October, 2013
Grade Risk Level Fall Target Score Spring Target Score
2
Low 180 ↑ 195 ↑
Moderate 160-179 181-194
High 159 ↓ 180 ↓
3
Low 194 ↑ 205 ↑
Moderate 180-193 197-204
High 179 ↓ 196 ↓
4
Low 205 ↑ 214 ↑
Moderate 195-204 206-213
High 194 ↓ 205 ↓
5
Low 211 ↑ 217 ↑
Moderate 202-210 209-216
High 201 ↓ 208 ↓
6
Low 218 ↑ 223 ↑
Moderate 209-217 216-222
High 208 ↓ 215 ↓
7
Low 224 ↑ 228 ↑
Moderate 216-223 220-227
High 215 ↓ 220 ↓
8
Low 229 ↑ 231 ↑
Moderate 220-228 224-230
High 219 ↓ 223 ↓
9*
Low 228 ↑ 232 ↑
Moderate 214-227 218-231
High 213 ↓ 217 ↓
10*
Low 232 ↑ 234 ↑
Moderate 220-231 222-233
High 119 ↓ 221 ↓
*Please use caution in interpreting grade 9 and 10 results. Samples are more limited and many districts only assess lower-performing students at these grades, which may have affected the results. NOTE: Scores obtained from administrations of the short version and long versions of the MAP Reading test are not comparable. They cannot be used to show growth.

2014-15 Targets & Norms 8
September, 2014
St. Croix River Education District
Written Expression Norms (AIMSweb WE-CBM)
Correct Word Sequences Written in 3 Minutes SCRED-Wide Norms Revised 2012-13
Grade Percentile
Fall Winter Spring
CWS TWW CWS TWW CWS TWW
1
90th NA NA 13 26 19 31
75th NA NA 8 21 15 26
50th NA NA 6 15 11 18
25th NA NA 2 11 5 13
10th NA NA 1 8 2 9
5th NA NA 1 6 1 8
2
90th 16 29 29 44 34 49
75th 13 24 25 37 25 42
50th 8 18 16 31 19 31
25th 5 13 10 22 12 24
10th 1 9 5 14 5 19
5th 0 3 3 13 4 16
3
90th 36 46 38 49 50 65
75th 29 38 34 44 43 56
50th 20 28 26 37 32 43
25th 11 20 19 30 23 33
10th 4 14 13 24 15 26
5th 2 3 8 20 11 21
4
90th 44 50 64 63 58 65
75th 33 41 48 57 45 52
50th 27 35 36 42 35 41
25th 16 26 24 34 23 33
10th 12 20 19 27 14 21
5th 9 16 8 19 11 17
5
90th 52 62 55 60 77 80
75th 42 50 45 56 63 72
50th 32 39 38 46 48 59
25th 24 29 30 37 39 48
10th 17 23 20 29 24 38
5th 14 20 17 21 13 29
6
90th 60 65 66 68 78 79
75th 50 56 52 56 65 70
50th 41 45 41 48 53 60
25th 27 37 30 37 44 52
10th 20 26 21 28 38 43
5th 14 21 17 22 33 39
7
90th 68 73 74 77 83 84
75th 56 62 63 65 67 71
50th 47 55 52 57 55 62
25th 38 44 38 44 46 53
10th 29 38 32 37 34 40
5th 22 33 27 34 28 34
8
90th 79 84 77 87 89 91
75th 65 73 70 74 78 82
50th 53 61 58 65 63 72
25th 44 50 47 54 53 61
10th 33 44 34 41 42 52
5th 25 33 32 37 37 50
SPED and ADSIS: monitor students once every other week with CWS. Students at less risk can be monitored once per month.

2014-15 Targets & Norms 9
September, 2014
St. Croix River Education District
Preschool Numeracy Indicators (PNI) Early Numeracy Norms
Items Correct in Allotted Time
Revised 10/2013
Measure Age Risk Fall Winter Spring
One to One Correspondence
E3
Norms
Low 12
Moderate 3 -11
High 2
E4, E5 Norms
Low 20
Moderate 8 - 19
High 7
Oral Counting Fluency
E3
Norms
Low 13
Moderate 4 - 12
High 3
E4, E5 Norms
Low 36
Moderate 12 - 35
High 11
Quantity Comparison Measure
E3
Norms
Low 21
Moderate 13 - 20
High 12
E4, E5 Norms
Low 28
Moderate 23 - 27
High 22
Number Naming Fluency
E3
Norms
Low 7
Moderate 1 -6
High 0
E4, E5 Norms
Low 22
Moderate 9 - 21
High 8
*E3, E4 and E5 scores are normative performance scores for students that are 3 years old by Sept 1st. Norms are based on an analysis completed by the University of Minnesota. Note: The spring scores will be set in TIES for each benchmark season (Fall, Win, Spr) so that teachers can see how students are making progress toward the spring norm as the year progresses.

2014-15 Targets & Norms 10
Low Risk = at least a 75% chance of passing criterion September, 2014
Moderate Risk = 50% chance of passing criterion St. Croix River Education District
High Risk = at best a 25% chance of passing criterion
Early Numeracy (AIMSweb TEN) Items Correct Per Minute
Target Scores Predicting Fall Grade 2 MAP Success (174 RIT)
Revised August, 2012
Kindergarten Targets
Measure November January May
Oral Counting Fluency 62 80
Missing Number Fluency 15 18 25
Quantity Discrimination Measure* 26
Grade 1 Targets
Measure Risk September January May
Quantity Discrimination Measure*
Low 12 ↑ 25 ↑ 29 ↑
Med. 1 - 11 9 - 24 15 – 28
High 0 8 ↓ 14 ↓
QDM First Grade: Many students end up in the moderate risk (yellow) category on this measure. Therefore our advice is that you look at other indicators in addition, (in-class work, curriculum tests, and teacher recommendations) to determine who needs supplemental intervention.
QDM First Grade:
About 80% of the students who are at low risk will meet the Fall 2nd Grade MAP target.
About 66% of the students at high risk will not meet the Fall 2nd Grade MAP target. Students who complete the entire probe in less than one minute should be given a score of 41.
*Note: The Oral Counting Fluency and Missing Number Fluency used in this analysis are the same as those available for download on AIMSweb, but the Quantity Discrimination Measure is different: the version used for this analysis was revised to be inclusive of numbers 0-31 in Kindergarten, and 0-100 in Grade 1. Student performance on AIMSweb Quantity Discrimination Fluency probes should not be interpreted relative to the targets provided here.

2014-15 Targets & Norms 11
September, 2014
St. Croix River Education District
Math Fact Fluency Problems Correct Per Minute
Target Scores Predicting Score of 30 in Spring Grade 5 Revised October, 2003
Note for Sp. Ed. and ADSIS: The Math Fact Fluency probes can be given as often as weekly, depending on the level of concern.
GRADE FALL WINTER SPRING
1
7
12
2
8
13
14
3
11
13
16
4
12
17
23
5
19
24
30
Based on a review of prior student data, we have confidence that students scoring ≥ 37 facts correct per minute in the spring of grade 5 are highly unlikely to score below 30 facts correct per minute on math facts assessments in grades 6-8, and as such may be excluded from math facts testing in these grades. Based on a review of prior student data, we have confidence that students scoring ≥ 35 facts correct per minute in the fall of grade 6 are highly unlikely to score below 30 facts correct per minute on math facts assessments in grades 6-8, and as such may be excluded from math facts testing in these grades.
6
30
30
30
Based on a review of prior student data, we have confidence that students scoring ≥ 35 facts correct per minute in the fall of grade 7 are highly unlikely to score below 30 facts correct per minute on math facts assessments in grades 7-8, and as such may be excluded from math facts testing in these grades.
7
30
30
30
8
30
30
30
2014-15 Targets & Norms 12
Low Risk = at least a 75% chance of passing criterion September, 2014
Moderate Risk = 50% chance of passing criterion St. Croix River Education District
High Risk = at best a 25% chance of passing criterion
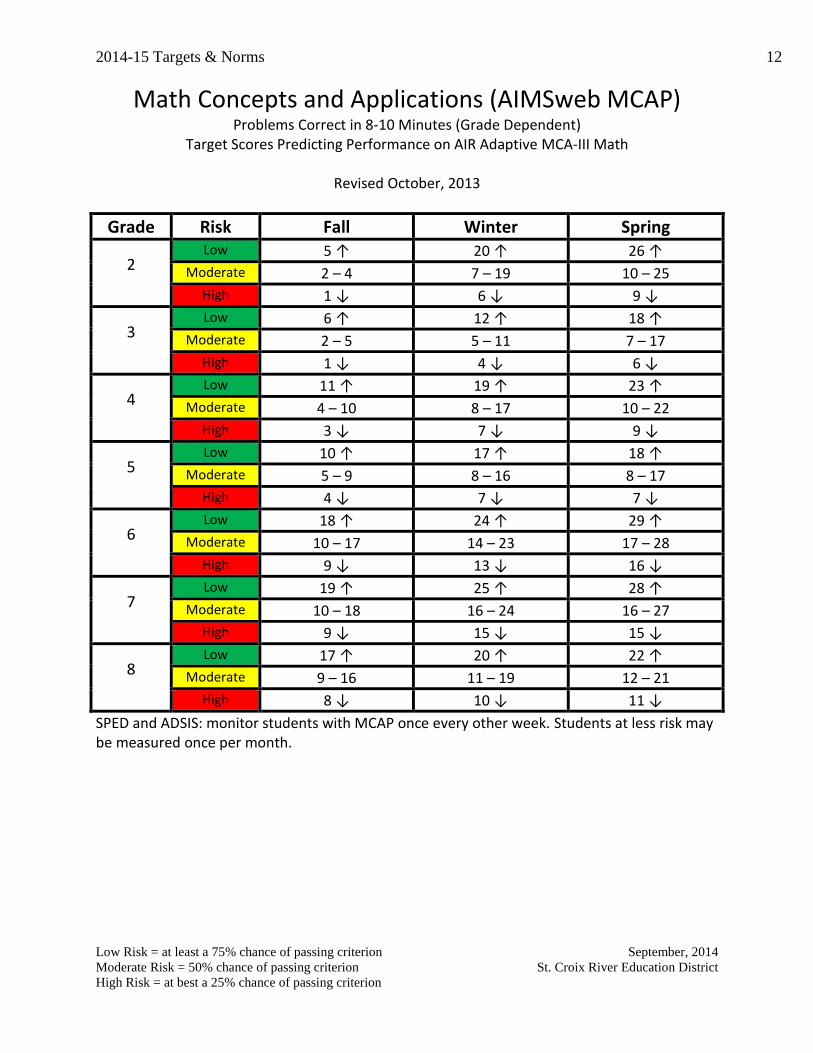
Math Concepts and Applications (AIMSweb MCAP) Problems Correct in 8-10 Minutes (Grade Dependent)
Target Scores Predicting Performance on AIR Adaptive MCA-III Math
Revised October, 2013
Grade Risk Fall Winter Spring
2 Low 5 ↑ 20 ↑ 26 ↑
Moderate 2 – 4 7 – 19 10 – 25
High 1 ↓ 6 ↓ 9 ↓
3 Low 6 ↑ 12 ↑ 18 ↑
Moderate 2 – 5 5 – 11 7 – 17
High 1 ↓ 4 ↓ 6 ↓
4 Low 11 ↑ 19 ↑ 23 ↑
Moderate 4 – 10 8 – 17 10 – 22
High 3 ↓ 7 ↓ 9 ↓
5 Low 10 ↑ 17 ↑ 18 ↑
Moderate 5 – 9 8 – 16 8 – 17
High 4 ↓ 7 ↓ 7 ↓
6 Low 18 ↑ 24 ↑ 29 ↑
Moderate 10 – 17 14 – 23 17 – 28
High 9 ↓ 13 ↓ 16 ↓
7 Low 19 ↑ 25 ↑ 28 ↑
Moderate 10 – 18 16 – 24 16 – 27
High 9 ↓ 15 ↓ 15 ↓
8 Low 17 ↑ 20 ↑ 22 ↑
Moderate 9 – 16 11 – 19 12 – 21
High 8 ↓ 10 ↓ 11 ↓
SPED and ADSIS: monitor students with MCAP once every other week. Students at less risk may be measured once per month.

2014-15 Targets & Norms 13
Low Risk = at least a 75% chance of passing criterion September, 2014
Moderate Risk = 50% chance of passing criterion St. Croix River Education District
High Risk = at best a 25% chance of passing criterion
Measures of Academic Progress - Math RIT Scale Scores
TIES-Wide Target Scores Predicting Performance on AIR MCA-III Math Revised October, 2012
Grade Risk Level Fall Spring
2 Low 174 ↑ 190 ↑
Moderate 162 – 173 181 – 189
High 161 ↓ 180 ↓
3 Low 188 ↑ 201 ↑
Moderate 177 – 187 194 – 200
High 176 ↓ 193 ↓
4 Low 201 ↑ 214 ↑
Moderate 192 – 200 205 – 213
High 191 ↓ 204 ↓
5 Low 216 ↑ 229 ↑
Moderate 207 – 215 221 – 228
High 206 ↓ 220 ↓
6 Low 226 ↑ 234 ↑
Moderate 218 – 225 228 – 233
High 217 ↓ 227 ↓
7 Low 232 ↑ 239 ↑
Moderate 224 – 231 232 – 238
High 223 ↓ 231 ↓
8 Low 238 ↑ 242 ↑
Moderate 228 – 237 234 – 241
High 227 ↓ 233 ↓
9* Low 244 ↑ 249 ↑
Moderate 234 – 243 240 – 248
High 233 ↓ 239 ↓
10* Low 248 ↑ 251 ↑
Moderate 238 – 247 241 – 250
High 237 ↓ 240 ↓
*Please use caution in interpreting grade 9 and 10 results. Samples are more limited and many districts only assess lower-performing students at these grades, which may have affected the results.
NOTE: Scores obtained from administrations of the short version and long versions of the MAP Math test are not comparable. They cannot be used to show growth.

2014-15 Targets & Norms 14
September, 2014
St. Croix River Education District
Appendix - FAQ
What is the difference between the targets and the norms?
The “low risk”, or green category, numbers in this packet are considered to be targets. A
“target” is a specific, meaningful level of performance at a certain time. The targets given in
this packet are predictive—they predict how a student will perform on another test in the
future. These predictive targets help us understand the extent to which a student is likely to
master grade level standards (indicated by passing the MCAs). They can help us evaluate the
effectiveness of core instruction, and can help identify which students require supplemental
or intensive intervention.
“Norms” are numbers that summarize the range of scores that groups of students typically
receive on a measure. These numbers don’t necessarily predict how a student will perform on
some later test, but they can still help us identify which students might be at risk.
For which measures does this packet report predictive targets?
- IGDIs for 4 and 5 year olds
- AIMSweb TEL for 4 and 5 year olds
- ORF
- MAP Reading
- OCF, MNF, QDM
- Math Facts
- MCAP
- MAP Math
For which measures are norms reported in this packet?
- PNIs
- IGDIs for 3 year olds
- Non-timed Letter Naming for 3 year olds
- Written Expression (WE-CBM)
Some of the measures we use were created by SCRED, and are not the same as their
counterparts in AIMSweb. Which ones were created by SCRED?
- QDM
- Math Facts
- Phonemic Segmenting and Blending


