Download - TEACHERS' WORKPLACE: PHYSICAL ACTIVITY AND

TEACHERS’ WORKPLACE:
PHYSICAL ACTIVITY AND SEDENTARY BEHAVIOUR
Marcelo E. Castillo Retamal
A thesis submitted to the Auckland University of Technology in fulfilment of the
degree of Doctor of Philosophy
School of Sport and Recreation
Faculty of Health and Environmental Sciences
Primary Supervisor: Associate Professor Erica A. Hinckson
Secondary Supervisor: Associate Professor Andrew E. Kilding
New Zealand, 2013

ii
Table of Contents
Attestation of authorship ............................................................................................... viii
Research outputs ............................................................................................................. ix
List of tables .................................................................................................................... xi
List of figures ................................................................................................................ xiii
Abbreviations ................................................................................................................ xiv
Acknowledgements ........................................................................................................ xv
Abstract ......................................................................................................................... xvi
CHAPTER 1: Introduction .............................................................................................. 1
1.1. Background ........................................................................................................ 1
1.2. Rationale ............................................................................................................. 4
Why the workplace? .................................................................................................. 4
Why primary school teachers?................................................................................... 5
Why sedentary behaviour? ........................................................................................ 6
Why odds ratios as relative risk? ............................................................................... 6
Why dichotomise data in to lower and higher deciles? ............................................. 7
Why cardiovascular risk profile? ............................................................................... 7
Why productivity? ..................................................................................................... 8
Definitions ................................................................................................................. 8
1.3. Thesis significance and originality ..................................................................... 9

iii
1.4. Thesis question ................................................................................................... 9
1.5. Thesis aims ......................................................................................................... 9
1.6. Overview of the studies undertaken ................................................................. 10
1.7. Thesis organisation ........................................................................................... 13
CHAPTER 2 .................................................................................................................. 15
Literature review I: Measurement of physical activity and sedentary behaviour at the
workplace ....................................................................................................................... 15
2.1. Introduction ...................................................................................................... 15
2.2. Methods ............................................................................................................ 17
2.3. Results .............................................................................................................. 18
Objective measures .................................................................................................. 19
Subjective measures ................................................................................................ 22
Measurement of workplace physical activity with criterion standards ................... 25
Validity and reliability of instruments ..................................................................... 27
2.4. Discussion ........................................................................................................ 31
Gaps in literature ..................................................................................................... 33
Limitations of this review ........................................................................................ 34
2.5. Conclusion ........................................................................................................ 35
CHAPTER 3 .................................................................................................................. 36
Literature review II: Occupational physical activity, sedentary behaviour and
cardiovascular risk in teachers ....................................................................................... 36
3.1. Introduction ...................................................................................................... 36

iv
3.2. Methods ............................................................................................................ 38
3.3. Results and discussion ...................................................................................... 38
Teachers’ occupational physical activity and work environment ........................... 50
Physical activity interventions ................................................................................. 51
School environment ................................................................................................. 51
Teachers’ health ....................................................................................................... 52
Productivity ............................................................................................................. 54
Teachers as role models ........................................................................................... 56
3.4. Limitations ....................................................................................................... 57
3.5. Conclusions ...................................................................................................... 57
3.6. Future directions ............................................................................................... 58
CHAPTER 4: Methods .................................................................................................. 59
4.1. Participants ........................................................................................................... 60
4.2. Study 1: Identifying barriers and facilitators of teachers’ physical activity at
school. ......................................................................................................................... 60
Sample size .............................................................................................................. 60
Recruitment ............................................................................................................. 61
Data collection ......................................................................................................... 61
Measurements and instruments ............................................................................... 62
Analysis ................................................................................................................... 62
4.3. Study 2: Teachers’ physical and sedentary activity patterns at work,
cardiovascular risk and productivity. .......................................................................... 64

v
Sample size .............................................................................................................. 64
Recruitment ............................................................................................................. 65
Data collection ......................................................................................................... 66
Measurements and instruments ............................................................................... 67
Statistical analysis .................................................................................................... 80
4.4. Study 3: Comparison of teachers’ and their students’ physical and sedentary
activity patterns. .......................................................................................................... 81
Sample size .............................................................................................................. 81
Recruitment ............................................................................................................. 82
Data collection ......................................................................................................... 83
Measurements and instruments ............................................................................... 83
Statistical analysis .................................................................................................... 84
CHAPTER 5: Results .................................................................................................... 85
5.1. Teachers’ physical activity and sedentary behaviour at work .............................. 85
Theme 1: School is an active workplace ................................................................. 86
Theme 2: Teaching style and role modelling are linked to physical activity at
school ....................................................................................................................... 93
Theme 3: Different priorities, classroom space and job demands are common
barriers to being active at school ............................................................................. 96
5.2. Teachers’ workplace physical activity, sedentary behaviour patterns and
cardiovascular risk profile ......................................................................................... 102
Teachers’ physical activity and sedentary behaviour levels .................................. 102

vi
Teachers’ physical activity and sedentary behaviour: day-by-day trend............... 104
Physical activity and sedentary behaviour as protective and risk factors .............. 105
Teachers’ cardiovascular disease (CVD) risk........................................................ 108
5.3. Self-reported physical activity and perceived workload and productivity analysis
111
Teachers’ Habitual Physical Activity Index .......................................................... 111
Teachers’ work performance level ........................................................................ 113
Comparative analysis of objective and self-reported data ..................................... 114
5.4. Teachers’ and children’s physical activity and sedentary behaviour patterns at
school. ....................................................................................................................... 118
Children’s physical and sedentary behaviour activity levels ................................. 119
Children’s physical activity and sedentary behaviour: day-by-day trend ............. 121
Teachers’ and children's physical activity and sedentary behaviour comparison . 121
CHAPTER 6: Discussion and conclusion .................................................................... 124
6.1. Overview ............................................................................................................ 124
Work environment and physical activity ............................................................... 125
Quantifying teachers’ physical activity, sedentary behaviour, cardiovascular health,
and work productivity ............................................................................................ 127
Teachers’ and children’s physical activity and sedentary behaviour relationship 131
6.2. Limitations ......................................................................................................... 132
6.3. Future directions ................................................................................................. 134
6.4. Conclusion .......................................................................................................... 136

vii
CHAPTER 7: References ............................................................................................ 138
APPENDICES ............................................................................................................. 152
Appendix 1: Ethical approval by AUTEC ................................................................ 152
Appendix 2: Consent forms for schools, teachers and children ................................ 156
Appendix 3: Teachers’ and children’s log sheets ...................................................... 160
Appendix 4: QHPA and HPQ questionnaires ........................................................... 162
Appendix 5: Interview questions ............................................................................... 174
Appendix 6: Sample size estimation ......................................................................... 176

viii
Attestation of authorship
I hereby declare that this submission is my own work and that, to the best of my
knowledge and belief, it contains no material previously published or written by another
person (except where explicitly defined in the acknowledgements), nor material which
to a substantial extent has been submitted for the award of any other degree or diploma
of a university or other institution of higher learning.
____________________________
Marcelo Castillo
4th
December 2013

ix
Research outputs
Peer review publication
1. Castillo M, Hinckson E. Measurement of physical activity and sedentary
behaviour at work: A review. WORK: A Journal of Prevention, Assessment, &
Rehabilitation. Vol. 4, Issue 40, December 2011. (Accepted on 26 March
2011).
Conference and seminar presentations
1. Castillo M. Measurement of physical activity and sedentary behaviour at the
workplace: A critical review. In: 2009 University Postgraduate Symposium -
'New Directions, Challenges and Applications’; AUT University, Auckland,
New Zealand: 2009. p. 13.
2. Castillo M, Hinckson E. Measurement of physical activity and sedentary
behaviour at the workplace. 11th Annual New Zealand Work Research
Conference for Research Students. Massey University, Rotorua 22 May 2010.
New Zealand.
3. Castillo M. Primary school teachers’ physical activity and sedentary behaviour
profile. 2011 University Postgraduate Symposium; AUT University, Auckland,
New Zealand: September 2011. p. 18.

x
4. Castillo M. IXth
International Research and Development Conference in
Physical Activity Sciences and Health. University of Tarapaca, Arica, Chile.
Presentation: Physical activity and sedentary behaviour at the workplace. 13 –
16 July 2012.
5. Castillo M. Ist International research meeting of Physical Activity Sciences,
Education and Health. Catholic University of Temuco, Temuco, Chile.
Presentation: Physical activity level, sedentary behaviour profile and
cardiovascular risk of primary school teachers. 19 – 21 July 2012.
6. Castillo M. Sport, Health and Quality of Life Seminar. Universidad Autónoma
de Chile, Talca, Chile. Guest Speaker. 6 June 2012. Two presentations: 1)
Health and sport perspective in the physical education teachers’ training and 2)
Health and quality of life concepts associated with physical activity in the Third
Millennium society.
7. Castillo M. The 2nd
Latin American and Caribbean Conference on Global
Health. University of Chile, Santiago, Chile. Presentation: Is teaching a
sedentary occupation? 9 – 11 January 2013.

xi
List of tables
Table 1: Data collection methods and administration ..................................................... 18
Table 2: Objective measurement of physical activity at the workplace ......................... 21
Table 3: Subjective measurement of physical activity at the workplace ........................ 24
Table 4: Criterion standard measurement of physical activity at the workplace ............ 27
Table 5: Validity and reliability of studies included in this review ................................ 29
Table 6: Characteristic of the studies reviewed (n = 19): context of study, type of
measurement, location, and time of publication .............................................. 39
Table 7: Summary of studies included in the review ...................................................... 41
Table 8: Number of schools contacted and their responses ............................................ 65
Table 9: Number of teachers participating ...................................................................... 66
Table 10: QHPA Score Index ......................................................................................... 74
Table 11: The international classification of adult underweight, overweight and obesity
according to BMI ............................................................................................. 78
Table 12: Aged and sex-specific cut-off points for classification of high compared with
low waist-to-hip ratios ..................................................................................... 78
Table 13: Blood pressure categories defined by the AHA.............................................. 79
Table 14: Classification of blood pressure for adults (NHLBI, USA) ........................... 79
Table 15: Classification of serum triglycerides and total cholesterol ............................. 79
Table 16: CV risk classification ...................................................................................... 80
Table 17: Number of children participating .................................................................... 82
Table 18: Teachers’ demographics, anthropometrics, physical activity and sedentary
behaviours and blood parameters. .................................................................. 103
Table 19: Active Behaviours as protector factors (OR) ................................................ 107
Table 20: Sitting and sedentary activity time as a risk factor (OR) .............................. 108

xii
Table 21: Teachers’ risk factor prevalence ................................................................... 109
Table 22: Teachers' habitual physical activity index during various daily activities.... 111
Table 23: Distribution of teachers' physical activity indices by age groups (mean ± SD)
........................................................................................................................ 112
Table 24: Teachers' absenteeism and work performance by gender, decile, and age
group .............................................................................................................. 114
Table 25: Physical activity by questionnaire and accelerometry comparison (mean ±
SD) ................................................................................................................. 115
Table 26: Children's demographic data......................................................................... 118
Table 27: Children's active and sedentary behaviours during school and out-of-school
hours ............................................................................................................... 120
Table 28: Physical activity and sedentary behaviour, adjusted values from 9:00 am to
3:00 pm for teachers and children .................................................................. 122
Table 29: Teachers’ and children’s sitting and MVPA time comparison ..................... 122

xiii
List of figures
Figure 1: Schematic of the thesis structure ..................................................................... 14
Figure 2: Search strategy................................................................................................. 17
Figure 3: HPA Index and active behaviour relationship, according step count (A) and
MVPA time (B) .............................................................................................. 116
Figure 4: HPA Index and sedentary behaviour relationship, according to sitting time (A)
and sedentary activity time (B) ...................................................................... 116
Figure 5: Absenteeism and active behaviour relationship ............................................ 117

xiv
Abbreviations
BMI : Body Mass Index
CVD : Cardiovascular Disease
CVR : Cardiovascular Risk
DLW : Doubly Labelled Water
EE : Energy Expenditure
HDL : High – Density Lipoprotein
HPQ : Health and Work Performance Questionnaire
IPAQ : International Physical Activity Questionnaire
LDL : Low – Density Lipoprotein
MET : Metabolic Equivalent Unit
MVPA : Moderate – to – Vigorous Physical Activity
NCD : Non-communicable disease
NEAT : Non-Exercise Activity Thermogenesis
OD : Odd Ratio
OPA : Occupational Physical Activity
PE : Physical Education
QHPA : Habitual Physical Activity Questionnaire
RSI : Repetitive Strain Injury
SD : Standard Deviation
VLDL : Very Low – Density Lipoprotein
WHR : Waist-Hip Ratio

xv
Acknowledgements
First of all, thanks to my family for believing in me and joining me in this adventure far
away from home. Julian and Isidora, thanks for accepting the challenge of crossing the
world to be better. Trinidad, thanks for giving us a great joy. Patricia, thanks for your
patience and unconditional love, for giving me your strength and encourage me to keep
focus and working hard. Thanks family for allowing me to reach one of my dreams.
I love you.
Thanks to the Catholic University of Maule, Chile, for giving me the opportunity to
grow academically.
Thanks to the Auckland University of Technology for accepting me as one of theirs.
Thanks to my supervisors, Erica and Andrew, for your wise advice, unceasing support,
and for showing me the value of a rigorous work. Thank you both for guiding me into
the exciting world of scientific research and showing that knowledge has no limits.
Thanks to my mates Kara and Erika for your help in data collection. To Saeideh, Felipe,
and Lanre thank you for your unending support and for those long talks about life and
how to be better every day. To Jan Wilson for her support and guide in academic
writing. A special thanks to Les for his friendship, invaluable support and guidance in
this long journey.
Thank you too to all participants for allowing me to learn more about people, their
behaviours and the New Zealand culture.

xvi
Abstract
The high rate of global mortality due to non-communicable diseases has encouraged
researchers to identify the major factors that are associated with increased prevalence of
cardiovascular disease, diabetes and other preventable disorders. Lower levels of
occupational physical activity, as well as other factors associated with modern life have
increased habitual sedentary behaviour, despite the efforts made by governmental and
non-governmental organisations to reverse this trend.
The working population spend nearly a half of their waking hours in the workplace
making occupational settings an ideal environment to study physical activity and
sedentary behaviours. While many occupations have been researched, primary school
teachers’ workplace physical activity has not been examined. Teachers are a large
occupational group with the capacity to influence children, parents and the wider
community’s, medium- and long-term physical activity behaviours. The principle
questions of this thesis included; Are teachers sufficiently active in their daily life? Do
the teaching profession and the work environment allow teachers to be physically
active? Does the work environment affect teacher’s health? Do workplace conditions
affect their work productivity? Does teachers’ sedentary behaviour or physical activity
influence their student’s physical activity? Therefore, the aims of this thesis were: 1) to
identify aspects that facilitate or impede New Zealand primary school teachers’
involvement in physical activity; 2) to quantify physical activity and sedentary
behaviour in teachers, and determine their cardiovascular health status; and 3) to
determine the relationship between physical activity and sedentary behaviour of
teachers and their students.

xvii
A mixed methods approach (qualitative and quantitative) was employed throughout this
thesis, utilising a convenient sample of 103 primary school teachers and 131 of their
students from 21 schools located in a variety of socioeconomic neighbourhoods in
Auckland, New Zealand. Data were collected over two weeks at each school during
February-November in 2011.
A qualitative approach was used to determine teachers’ perception about their workload
and the barriers that exist to being physically active at school. Voice recordings of semi-
structured interviews (n= 8) conducted with teachers and principals from the
participating schools were transcribed and coded using a thematic analysis approach.
Physical activity and sedentary behaviour of teachers and children were measured using
accelerometers (activPALTM
& ActiCalTM
) during 24 hours of monitoring on five
consecutive days. Teachers self-reported their occupational, sport and leisure time
physical activity using the Habitual Physical Activity Questionnaire and teachers’
productivity was self-assessed using the Health and Work Performance Questionnaire.
Teachers’ cardiovascular health-status was determined from blood pressure, heart rate,
anthropometric measures, demographic data and blood cholesterol, triglyceride and
plasma glucose samples. The relationship between active and sedentary behaviour of
the teachers and their student’s time-matched (63-pairs of data) accelerometer-measured
physical activity were also analysed.
The results of this thesis indicated that primary school teachers were more active at
work than during out-of-work hours (65% of the energy expenditure was accumulated
at work) and 57% of their time at work was spent sitting. In our sample, teachers were

xviii
sufficiently physically active during school time to accumulate 30 min of moderate-
vigorous activity daily. Teachers’ cardiovascular health indicators appeared normal and
predicted a low risk of developing cardiovascular disease in the next 10 years (<3%).
Teachers with the lowest cardiovascular risk were those that were both more physically
active and also interrupted their sedentary behaviour more than four times an hour
throughout the day. Although no significant relationship between active and sedentary
behaviours of teachers and their students was found, there was a trend for students of
more active teachers to be more physically active and spend less time in sedentary
behaviour than students of more sedentary teachers.
Using thematic analysis of written transcripts of the principals and teachers interviews it
was determined that the two major barriers to teachers not engaging in physical activity
at work were lack of time and high workload. Other factors such as weather, classroom
space, and the number of children in each classroom, were also identified as barriers to
engaging in workplace physical activity.
In conclusion, the work environment in New Zealand primary schools provided an
opportunity for teachers to accumulate sufficient physically activity during school time
to achieve the minimum daily moderate-vigorous activity recommendation. It is
recommended however, that sedentary behaviour be interrupted more than four times an
hour throughout the day to reduce the risk of cardiovascular disease among teachers.
Further evidence is required to substantiate the recommendation of interrupting
sedentary behaviour in the workplace.

1
CHAPTER 1: Introduction
1.1. Background
The prevalence of non-communicable diseases has been steadily increasing in
developed countries (60% of global mortality) (W.H.O., 2004). In 2004, the World
Health Organisation (W.H.O., 2004) adopted a Global Strategy on Diet, Physical
Activity and Health in response to this public health issue and the goal of decreasing the
prevalence of risk factors associated with non-communicable diseases was instigated.
The global strategy was based on evidence that the justify actions necessary to meet the
challenges and opportunities for achieving World Health Organisation targets and goals
(W.H.O., 2004). The World Health Organisation established a set of principles to
reduce population prevalence of non-communicable disease risk factors by taking a life-
course perspective that promotes physical activity at work, home and school, while
considering the effects of urbanization, city planning, transportation, traffic-safety and
accessibility to physical activity during leisure (W.H.O., 2004).
There is a large body of evidence reporting physical activity levels accumulated in a
variety of occupational settings (Kaleta & Jegier, 2005; Proper & Hildebrandt, 2006;
Ruiz-Tendero, Salinero-Martin, Webster, & Aznar-Lain, 2006; Schofield, Badlands, &
Oliver, 2005; Sobti, Cooper, Inskip, Searle, & Coggon, 1997; Steele & Mummery,
2003; Takao, Kawakami, & Ohtsu, 2003; Tudor-Locke, Burton, & Brown, 2009) and
during leisure-time (Bruce & Katzmarzyk, 2002; Ku, Fox, McKenna, & Peng, 2006;
Laaksonen et al., 2002; Monteiro et al., 2003; Pitsavos, Panagiotakos, Lentzas, &
Stefanadis, 2005; Salmon, Bauman, Crawford, Timperio, & Owen, 2000; Vuillemin et
al., 2005; Wilcox, Castro, King, Housemann, & Brownson, 2000). Differences in

2
occupational physical activity intensity and volume exist between workplace settings
that can influence an individual’s engagement in leisure-time physical activity. Most of
the studies to date investigating workplace physical activity have revealed low levels of
total physical activity engagement and have led researchers to implement various
strategies aimed at reducing physical inactivity for use in specific contexts and settings
(Chan, Ryan, & Tudor-Locke, 2004; Cook, Simmons, Swinburn, & Stewart, 2001;
Epstein & Roemmich, 2001; Healy et al., 2008; Renaud et al., 2008) by increasing
workplace physical activity (Aittasalo & Miilunpalo, 2006; Beers, Roemmich, Epstein,
& Horvath, 2008; Benedict & Arterburn, 2008; Bravata et al., 2007; Campbell et al.,
2002; Cheung & Chow, 2006; Dishman, DeJoy, Wilson, & Vandenberg, 2009;
Dishman, Oldenburg, O'Neal, & Shephard, 1998; Eves & Webb, 2006; Murphy,
Murtagh, Boreham, Hare, & Nevill, 2006; Mutrie et al., 2002; Proper et al., 2006;
Prosser, Thomas, & Darling-Fisher, 2007; Renaud et al., 2008; Thomas & Williams,
2006; White & Ransdell, 2003).
There is an association between physical inactivity and mortality from non-
communicable diseases (Katzmarzyk, Church, Craig, & Bouchard, 2009) and
modifying physical activity behaviours could act as a preventative measure (W.H.O.,
2004). Physical inactivity is the fourth leading cause of death worldwide yet the
protective effects of physical activity are under-utilised and the cost burden of physical
inactivity is mostly ignored by public health officials (Kohl et al., 2012).
It has been demonstrated that sedentary and physical activity behaviours have different
physiological effects and implications for health (Hamilton, Hamilton, & Zderic, 2007).

3
Recent evidence has determined that sedentary behaviour was directly associated with a
higher risk of mortality due to cardiovascular problems, cancer and other causes,
independent of leisure time physical activity (Katzmarzyk et al., 2009). Compliance
with the recommendations of accumulating more than 150 min/week of moderate
aerobic physical activity in 10 min bouts (W.H.O., 2010) may not ensure protection
from non-communicable diseases, which may also depend on a reduction in the time
spent in sedentary activities (Hamilton et al., 2007). Therefore, those who spend many
hours a day sitting during work or leisure time may be at greater risk of developing non-
communicable diseases (Hamilton, Healy, Dunstan, Zderic, & Owen, 2008). To explain
the independent associations of physical activity, sedentary behaviour and physical
inactivity with non-communicable diseases it may be necessary to measure sedentary
behaviour separately from physical activity.
The prerequisite is that researchers understand factors that influence habitual activity
before we can design and implement effective intervention strategies to increase
physical activity levels and reduce sedentary behaviour. The overarching question for
this thesis was “How does the work environment affect physical activity, sedentary
behaviour and cardiovascular health in primary school teachers?” In addition, is there a
relationship between teachers’ physical activity and sedentary behaviour and their
student’s school-based physical activity?

4
1.2. Rationale
Why the workplace?
It is generally accepted that health benefits and quality of life are associated with an
active lifestyle (Salmon, 2001). The workplace is a setting where people spend at least
one-third of the day (Smith, Conway, & Karsh, 1999). In a study of university workers
it was reported that during waking hours, workers spent about 60% of the day in
sedentary activities (Ruiz-Tendero et al., 2006) expending ~80 kcal per hour of
sedentary activity. Levine et al. (Levine, 2002, 2007; Levine et al., 2008), contend that a
change in employees habits in their workplace is required to increase daily energy-
expenditure to either maintain or lose weight or to improve their general state of health.
Adults expend energy through purposeful exercise, changes in postural position and
non-exercise activity thermogenesis (NEAT) described by Levine and colleagues
(Levine et al., 2005), as the physical activity performed during the routines of daily life.
Small increases in the volume of light physical activity throughout the day can increase
non-exercise activity thermogenesis and total daily energy-expenditure (Levine et al.,
2005).
Depending on the occupation, workers may spend long periods of time seated, and a
large proportion of these individuals do not compensate for this inactivity by engaging
in higher intensity activities during leisure time (Jans, Proper, & Hildebrandt, 2007).
Legislators, senior managers, clerks, and those working in scientific and artistic
professions spend more time sitting than the average worker. Hamilton et al. (Hamilton
et al., 2008) identified that people who work in a sitting position for prolonged periods
have double the risk of developing cardiovascular disease compared with those
individuals who have physically active jobs.

5
The workplace has been recognized as an excellent research setting for the study of
physical activity, sedentary behaviour, physical inactivity and health (Dishman et al.,
1998) as well as a convenient site to implement intervention strategies to increase
habitual physical activity (Plotnikoff, McCargar, Wilson, & Loucaides, 2005). In this
thesis work-related physical activity of teachers and time spent sitting during work
hours were quantified.
Why primary school teachers?
Currently, half of the adult population in New Zealand do not meet the 150 min per
week moderate activity guideline, nearly two thirds are overweight or obese and there
are greater proportions of overweight individuals in the working population (Ministry of
Health, 2012). According to LaMaster et al. (LaMaster, McKenzie, Marshall, & Sallis,
1998), primary school teachers from the United States were identified as an at risk
group with 68% of the teacher’s school-day energy expenditure accrued during non-
school hours indicating that work hours are predominantly sedentary. There is little
information regarding teachers physical and sedentary behaviours during school hours,
whereas there is ample descriptive data of children’s activity at school (Berkey,
Rockett, Gillman, & Colditz, 2003; Cale & Harris, 2006; Fox, Cooper, & McKenna,
2004; Salmon et al., 2005; St Leger, 2004), activity of educators or non- academic staff
in university settings (Castillo, Cruz, Garcia, Jaque, & Morales, 2010; Cerecero,
Hernández, Aguirre, Valdés, & Huitrón, 2009; Roldán Aguilar, Lopera Zapata,
Londoño Giraldo, Cardeño Tejada, & Zapata Vidales, 2008; Ruiz-Tendero et al., 2006;
Uribe Velez et al., 2010) and tertiary students physical activity (Lee, 1992; Salmon,
Owen, Crawford, Bauman, & Sallis, 2003). Teachers occupational physical activity
behaviours has received scant attention from researchers (St Leger, 2004; Till, Ferkins,

6
& Handcock, 2011). The studies in this thesis were designed to provide a
comprehensive profile of primary school teachers’ work-related physical activity and
sedentary behaviours.
Why sedentary behaviour?
The study of sedentary behaviour and its implications for health is an emerging area of
research. More research is required to understand how sedentary behaviour affects
population health (Hamilton et al., 2008). What has become clear in recent research is
that sedentary behaviour requires special consideration owing to its unique
characteristics, which are distinct from the benefits of physical activity (Hamilton et al.,
2007). In this thesis, the effects of occupational physical activity, sedentary behaviours
and the physical activity of primary school teachers on their health were examined.
Why odds ratios as relative risk?
Odds ratios are a measure of the size of an effect, allowing examination of the factors
that influence the magnitude of an effect, which is determined by the quotient between
the numbers of times that an event occurs versus how often it does not occur (Martin &
Altman, 2000). An aim of this thesis is to estimate the effect of physical activity and
sedentary behaviours on teachers’ cardiovascular-risk factors. Odds ratios have been
shown to be good measure of the size of an effect (Davies, Crombie, & Tavakoli, 1998).
Unfortunately, the odds ratios do not approximate well the relative risk when the initial
risk is high and therefore odds ratios should not be interpreted as equivalent to relative
risk (Davies et al., 1998). Nevertheless for this cohort study, odds ratios were an

7
appropriate method to investigate factors that influence cardiovascular risk in primary
school teachers (Davies et al., 1998).
Why dichotomise data in to lower and higher deciles?
Dichotomising the teachers’ data into higher or lower decile schools may be
problematic because the socio-economic status of the mid-decile schools 5 and 6 are not
very different. According to Altman & Royston (Altman & Royston, 2006)
dichotomising is a common approach for use in studies with small sample sizes.
Discarding data from the mid-decile schools is not recommended as the statistical
power to detect a relationship is reduced (Altman & Royston, 2006). Nevertheless, there
was only one school from each 5 and 6 decile schools and removing that data would
have made no difference to the results.
Why cardiovascular risk profile?
Cardiovascular diseases (CVD) are one of the main causes of death in New Zealand
(Ministry of Health, 2003). The teaching profession is considered as an occupation of
low physical demand (LaMaster et al., 1998). It is well documented that low levels of
habitual physical activity and high proportions of sedentary behaviour contribute
significantly to an increased risk of developing cardiovascular and other non-
communicable diseases (W.H.O., 2010). In this thesis, the effects of teachers’ work-
related physical activity and sedentary behaviours on cardiovascular risk factors were
examined.

8
Why productivity?
Health status is one of the main variables that affect workers’ productivity (Kessler et
al., 2003). Teachers productivity was scored with self-reported absenteeism in hours
lost over the school week and presenteeism using a 10-point Likert scale, which is a
self-assessed measure of job performance where 1 = worst and 10 = top performance
(Kessler, Petukhova, & McInnes, 2007). The aim of this study was to determine
teachers’ presenteeism and absenteeism, and assess whether accelerometer measured
physical activity and sedentary behavior influence productivity using the Health and
Work Performance Questionnaire (Kessler et al., 2007).
Definitions
Physical activity, according to Caspersen et al (Caspersen, Powell, &
Christenson, 1985), is “any bodily movement produced by skeletal muscles that
resulting in energy expenditure above the resting level”, usually over 1.6
metabolic equivalent units (MET) (Pate, O'Neill, & Lobelo, 2008).
Active living is a way of life that integrates physical activity into daily routines
(Cavill, Kahlmeier, & Racioppi, 2006).
Physical inactivity is defined as an absence of physical activity or exercise
(W.H.O., 2010).
Sedentary behaviours are those activities involving low energy expenditure
above resting level (Biddle, Gorely, Marshall, Murdey, & Cameron, 2004), >1.0
to ≤1.5 MET (Pate et al., 2008). In this work, the definition of sedentary
behaviour proposed by the Sedentary Behaviour Research Network was adopted
for all analysis: “sedentary behaviour is defined as any waking behaviour

9
characterized by an energy expenditure ≤1.5 MET while in a sitting or reclining
posture” (SBRN, 2012).
1.3. Thesis significance and originality
This is the first study to quantify New Zealand primary school teachers’ physical
activity and sedentary behaviour in the workplace. This is also the first study to use
objective measures (accelerometers and activity monitors) to assess teacher’s workplace
physical activity, self-report their occupational, sport and leisure time physical activity
using the Habitual Physical Activity Questionnaire and assess their productivity using
the Health and Work Performance Questionnaire. In addition, this is the first study that
examined the relationship between teachers’ and their student’s physical activity.
1.4. Thesis question
Does the work environment affect the cardiovascular risk profile, physical activity and
sedentary behaviours of primary school teachers, which may affect their students’
school-based physical activity?
1.5. Thesis aims
Aim 1: To determine teachers’ perceptions of barriers and facilitators of physical
and sedentary activity levels at work.
Aim 2: To assess teachers’ physical and sedentary activity levels at work using
both objective and subjective measures.

10
Aim 3: To evaluate associations between physical activity and sedentary behaviour
and cardiovascular risk factors.
Aim 4: To examine the relationship between teachers’ activity levels and their
students’ activity levels.
1.6. Overview of the studies undertaken
Study 1 determined teachers’ perceptions of barriers and facilitators to physical activity
at school. Study 2 quantified teachers’ physical and sedentary activity and examined
their productivity at school. In addition, blood samples were drawn to determine the
cardiovascular risk of teachers. Study 3 matched teachers’ and their student’s
accelerometer measured physical activity behaviours to determine whether physical
activity of teachers influences their student’s activity levels during school time.
A summary of each study is provided below:
Study 1: Identifying barriers and facilitators of teachers’ physical activity at school.
In this qualitative study, semi-structured interviews with school principals and primary
school teachers were conducted to gain insight into teachers’ perceptions of facilitators
and barriers to physical activity at school, and to understand workplace routines, the
internal culture of schools, individual teaching styles and role modelling.
In order to achieve Aim 1 of the thesis Study 1 was designed to answer the following
questions:

11
1. What do teachers think and know about physical activity in their
workplace?
2. What are the routines and organisational culture in primary schools that
support workplace physical activity?
3. What are the facilitators and barriers to altering the volume and intensity
of teachers’ occupational sedentary behaviour and physical activity?
Study 2: Effect of teachers’ work-related sedentary and physical activity on
cardiovascular risk and productivity
In Study 2 primary school teachers’ physical activity and time spent in sedentary
activity during school days were measured objectively using ActiCalTM
accelerometers
and activPALTM
activity monitors. Anthropometric data and blood profiles were also
collected to determine cardiovascular risk.
In order to achieve Aim 2 and Aim 3 of the thesis Study 2 was designed to answer the
following questions:
1. What are the teachers’ physical and sedentary activity levels as determined
by the accelerometer and step count data?
2. Do teachers meet the physical activity recommendations?
3. What is the amount of time spent in sedentary, light, moderate and vigorous
activity during the day?
4. What percentage of sedentary activity is spent sitting versus standing?

12
5. What is the relationship between teachers’ cardiovascular risk and their
physical activity and sedentary behaviours?
6. What are teachers’ perceived work productivity and occupational, sport and
leisure time physical activity levels?
Study 2 provided quantitative data on teachers’ actual sedentary and physical activity
during school hours. Previous research identified that teachers’ energy expenditure
during work hours is low, but recent changes in teaching styles may have increased
workplace physical activity. Presently, there is no information on the magnitude of
primary school teachers’ occupational physical activity and sedentary behaviours.
Study 3: Comparison of teachers’ and their students’ physical and sedentary activity
patterns
In Study 3 comparisons were made of teachers and their student’s objectively measured
sedentary and physical activity during school hours using ActicalTM
accelerometers and
activPALTM
activity monitors. The aim of this study was to investigate the relationship
between sedentary and physical activity behaviour of teachers and their students.
In order to achieve Aim 4 of the thesis Study 3 was designed to answer the following
questions:
1. Is there a relationship between teachers’ and their students’ physical and
sedentary activity patterns?

13
2. Do teachers’ sedentary activities influence their students’ physical and
sedentary activity patterns at school?
1.7. Thesis organisation
This thesis was structured in seven chapters (Figure 1), following a traditional format.
The preliminary chapters of the thesis consist of an overview of occupational physical
activity and sedentary behaviours related to health (Chapter 1) and two reviews
(Chapter 2 and 3). The first review evaluated measurement techniques and instruments
to assess physical activity and sedentary behaviour in the workplace and informed the
best measurement strategy to use in this thesis. The second review examined the
existing literature on active and sedentary behaviours and the health status of teachers to
identify future research directions. The evidence presented in Chapter 1-3 identified that
teachers daily energy-expenditure was low owing to the fact that workplace hours are
predominantly sedentary, which potentially increase their risk of developing
cardiovascular diseases. The following Chapters (4-6) consist of the methods, results
and discussion of three studies that provide an in depth analysis of the teachers’ work-
related sedentary and physical activity behaviours and the effect on teachers’
cardiovascular health and their students’ school-based physical activity.
Chapter 4 of the thesis details all methodological aspects, including the selection of
participants, the data collection process, a description of measurements, instruments,
and the analysis of the information and data collected in Studies 1-3. Chapters 5 and 6
of the thesis are devoted to reporting the results of Studies 1-3, and discussion of the
findings presented as recommendations and conclusions. Additional information,

14
related to official documents, information and invitation letters and copies of
measurement instruments (questionnaires) are included at the end of this thesis in the
appendices.
Teachers’ workplace: physical and sedentary behaviour
Figure 1: Schematic of the thesis structure
Chapter 2: Literature Review Measurement of physical
activity and sedentary behaviour at the workplace
Chapter 3: Literaure Review Occupational physical
activity, sedentary behaviour and cardiovascular risk in
teachers
Chapter 4: Methods: Studies 1 - 3
Chapter 6: Discussion and conclusions
Chapter 7: References
Chapter 1: Introduction
Appendices
Chapter 5: Results: Studies 1 - 3

15
CHAPTER 2
Literature review I: Measurement of physical activity and
sedentary behaviour at the workplace
This chapter was published in WORK: A Journal of Prevention, Assessment, &
Rehabilitation. Vol. 4, Issue 40, December 2011. (Accepted on 26 March 2011)
2.1. Introduction
Adults spend at least one-half of their waking hours working, and occupational activity
is becoming more sedentary (Smith et al., 1999). Marshall (2004) reported that there
was a linear relationship between sedentary behaviour and absenteeism. The main
reason for absenteeism was the presence and prevalence of metabolic disorders and
mental illness associated with work-related sedentary activity. Modern work
environments are both more competitive and stressful with less physical activity and
more sedentary behaviour during work hours.
Workplace sedentary behaviour is not simply the absence of physical activity but
generally involves intellectual processing that requires little movement and low energy
expenditure (Jamner & Cooper, 2002; Reilly et al., 2008). In several studies significant
relationships were identified between less habitual physical activity and more sedentary
behaviour with obesity and cardiovascular risk-factors or disease (Blair & Brodney,
1999; Eves, Webb, & Mutrie, 2006; Healy et al., 2008; Mummery, Schofield, Steele,
Eakin, & Brown, 2005; Schneider, Crouter, Lukajic, & Bassett, 2003).

16
The impact of occupation on lifestyle diseases is an emerging field of research.
Independent of time spent in physical activity, there were significant negative
associations of mean activity intensity, and time spent in sedentary and light intensity
activity associated with waist circumference and the clustering of metabolic risk factors
(Healy et al., 2008). Too much time sitting is a health risk (Hamilton et al., 2007)
independent of whether the individual is engaging in the recommended levels of daily
physical activity (Healy et al., 2008) and interrupting sedentary time could improve
health (Beers et al., 2008; Healy et al., 2008; McAlpine, Manohar, McCrady, Hensrud,
& Levine, 2007). The workplace has been recognised as an important setting for the
promotion of physical activity among adults (Plotnikoff, Prodaniuk, Fein, & Milton,
2005) owing to the proportion of time spent at work and the importance of work to an
individual’s identity, social status, health and economic well-being (Batt, 2009). The
workplace may play an important role in the prevention of obesity and other lifestyle
diseases if an appropriate physical activity intervention can be implemented at work
sites (Eves et al., 2006; Mummery et al., 2005).
In order to assess the effectiveness of intervention strategies to prevention chronic
disease, the tools and techniques used to measure physical activity and sedentary
behaviour must be valid, reliable, and practical (Sirard & Pate, 2001). Therefore, the
main aim of this review was to identify methods used to measure physical activity and
sedentary behaviour in the workplace and determine the strengths and limitations of the
different tools. We report on studies that use objective, subjective and criterion standard
approaches to measure workplace physical activity and sedentary behaviour.

17
2.2. Methods
Databases were searched for relevant published articles including MEDLINE via
PubMed, SPORT Discus, ProQuest and Google Scholar. Keywords and combinations
of them were used for the search including physical activity, workplace, sedentary
behaviour, measurement and questionnaire. To meet inclusion criteria journal articles
had to be written in English, published between 1990 and 2009 that measured both
workplace physical activity and sedentary behaviour using motion sensors, indirect
calorimetry or validated questionnaire. After applying the inclusion criteria, eleven
studies were selected (Figure 2) and data were extracted according to the methods
identified by Hartvigsen et al. (2000) (Tables 2-4): year of publication, name of the
authors, title of article, source, testing methods, intervention context, data collection
method and occupational groups or type of work under study.
* PA: physical activity, SB: sedentary behaviour, WP: workplace, MES: measurement,
Q: questionnaire.
Figure 2: Search strategy
Databases
MEDLINE Google Scholar SPORTDiscus ProQuest
PA, SB, WP, MES * PA, SB, WP, MES * PA, WP, MES * PA, Q, WP *
13 802 5 42
6
3
2
120
24
7
3
3
1
28
6
1
11
Results
Full articles
reviewed
Articles
selected
Abstracts
reviewed

18
The analysis was conducted according to the classification of measurement techniques
developed by Sirard & Pate (Sirard & Pate, 2001) into objective measures (motion
sensors: accelerometers, pedometers), subjective measures (self-reports: interviews,
surveys and questionnaires) and criterion standard measures (indirect calorimetry).
2.3. Results
Searches of databases identified 862 potentially relevant articles. Of these, 157 full
articles were downloaded based on the information provided in the abstracts and 36
articles were identified for a detailed review. From these, 11 articles were selected
based on the inclusion criteria. All articles included in the review measured physical
activity and sedentary behaviour at a real or simulated workplace. Questionnaires were
the most common tool used to measure physical activity at work followed by motion
sensors, and indirect calorimetry (Table 1).
Table 1: Data collection methods and administration
Measurement Mode Articles (%) References
Motion sensors Accelerometers 9 Ruiz-Tendero et al, 2006
Pedometers 18 Gilson, 2008; Schofield et al., 2005
Questionnaires
Face to face 9 Kaleta et al., 2007
Telephone 18 Mummery et al., 2005; Kruger et al., 2006
Self report 18 Spittaels et al., 2007; Steele and Mummery, 2003
Indirect
calorimetry Laboratory 28
McAlpine et al., 2007; Levine and Miller, 2007;
Beers et al., 2008
Studies were grouped into three categories (Tables 2-4): workplace activity measured
with motion sensors, workplace activity estimated with questionnaires and laboratory
settings with simulated work activities measured using indirect calorimetry.

19
Objective measures
Researchers frequently use objective measures, accelerometers and pedometers, in
physical activity studies. Accelerometers are electronic devices that measure
accelerations produced by body movement. Piezoelectric transducers and
microprocessors in accelerometers convert recorded accelerations into a quantifiable
digital signal referred to as ‘counts’ (a numerical value proportional to the magnitude of
the accelerations) (Sirard & Pate, 2001). Pedometers are simple electronic devices used
to estimate the number of steps accumulated by detecting vertical displacement of the
pelvis at each stride during walking or running.
Recent research has established a link between health-risk factors, physical activity and
sedentary behaviour (Gilson, 2008; Healy et al., 2008). For example, accelerometers are
able to assess incidental physical activity to provide information about the volume and
intensity of physical activity associated with beneficial effects on metabolic risk factors
(insulin, leptin, glucose, triglycerides) (Gilson, 2008; Healy et al., 2008).
Data from accelerometers can be used to assess difficult-to-capture light intensity
physical activity, which is typically incidental in nature and rarely assessed when self-
report instruments are used (Sirard & Pate, 2001). Motion sensors do not always detect
arm and some upper body movements as the devices are generally worn on the waist
(Trost, McIver, & Pate, 2005). Low cost pedometers provide real-time information of
step counts to participants, which may motivate them to be physically active (Tudor-
Locke et al., 2004). Accelerometers are a more sophisticated version of the pedometer
but generally do not provide participants with real time activity data but information on

20
intensity, duration and frequency of activity can be downloaded with manufacturer
software (Trost et al., 2005). Overall, motion sensors are widely used in research and
offer good reliability and validity when validated against criterion standards (see Table
5).
Two of the three studies shown in Table 2 measured 3-7 days of physical activity in
workplace settings using pedometers. There was a significant inverse relationship
between workday step counts and sitting time associated with waist circumference and
blood pressure (Gilson, 2008). Blue-collar workers (mechanics, green keepers, dry
cleaners) accumulated more steps (70%) than other occupations studied (Schofield et
al., 2005). The steps university academics took during work hours were 4,400 ± 1,400
(mean ± SD) compared with 10,300 ± 5,500 steps for blue-collar workers (Schofield et
al., 2005).

21
Table 2: Objective measurement of physical activity at the workplace
Author Sample Measure Instrument Method Results
Gilson,
(Gilson, 2008)
n = 216
(20%
men)
Steps /
day for 7
days
Pedometer
Yamax SW
200
Record
consecutive step
counts for five
working days,
also at the
weekend.
Daily step counts were inversely
associated with sitting time (p <
0.05)
Barcelona employees sat less (p <
0.001), men’s and women’s waist
circumference (p < 0.01) and
women’s diastolic blood pressure
(p < 0.001) were lower.
Ruiz –Tendero
et al.,
(Ruiz-Tendero
et al., 2006)
n = 47
(36%
men)
Min light,
moderate
and
vigorous
physical
activity
MTI
Actigraph
The monitor was
worn during
waking hours for
7 consecutive
days, with a
minimum of 10
hours of data per
day.
Mean accelerometer counts
registered on workdays was
450,000 counts/day
Sitting during working hours was
20% (cleaners), 60%
(researchers), and 60%
(administration and services
staff)
Schofield et al.,
(Schofield et
al., 2005)
n = 181
workers
(33%
men)
Steps /
day at
work and
non- work
settings
Pedometers
Digiwalker
SW-700
Participants used
a pedometer over
a consecutive 3-
day working
period, during
work and non-
work time.
Women had higher non-work
steps, men had higher work steps.
43% achieved 10,000 steps/day.
Large difference in pedometer
steps by occupational category,
Blue-collar workers accumulated
70% more steps than other
occupations studied.
Spittaels et al.
(Spittaels, De
Bourdeaudhuij,
Brug, &
Vandelanotte,
2007)
n = 526 Job
related
physical
activity
MTI
Actigraph
Measured at
baseline and at 6
months follow up,
in one of six
worksites.
Accelerometer moderate and
vigorous physical activity
(min/week) at baseline 330 ±170
(mean ± SD); 6 months follow up
340 ±160
30 min of physical activity on
65% of days
Steele &
Mummery
(Steele &
Mummery,
2003)
n = 90 Job
related
physical
activity
Yamax
Digiwalker
SW-700
Average steps of
3 working days
Mean daily pedometer step
counts for professional (2,800 ±
950), white-collar (3,600 ± 1500
) and blue-collar workers (8,800
± 2500)
Ruiz-Tendero et al. (2006) used accelerometers (MTI Actigraph) found that
approximately 50% of the university workers attained moderate-to-vigorous intensity
(MVPA, >1953 counts/min) for at least 30 min on five or more days of the week and
steps taken during weekdays were 14,300 ± 4,300 (mean ± SD). Typical total
accelerometer counts of approximately 450,000 were accumulated on workdays, and
cleaners, researchers and administration and service staff sitting time during working

22
hours was 20%, 60% and 60% respectively. (Ruiz-Tendero et al., 2006). Overall, in the
studies reviewed nearly 60% of adults waking hours were spent in sedentary activities.
Subjective measures
The most common method used to measure physical activity was subjective, which
relies on participants recalling previous physical activity participation (Blair &
Brodney, 1999). In this review, subjective measures include self-reports via interviews,
surveys and questionnaires. A survey is a “technique of descriptive research that seeks
to determine present practices or opinions of a specified population; can take the form
of a questionnaire, interview, or normative survey”, whereas a questionnaire is a “type
of paper-and-pencil survey used in descriptive research in which information is
obtained by asking participants to respond to questions rather than by observing their
behaviour” (Thomas, Nelson, & Silverman, 2005). An interview is a survey technique
similar to the questionnaire except that participants are questioned and respond orally
rather than in writing (Thomas et al., 2005).
Subjective assessments of physical activity are an efficient method for large population
studies and have been used in the workplace without significant disruption to work
duties (Mummery et al., 2005). Researchers have used subjective measures to provide
information about the behavioural and psychological variables related to occupational
physical activity and sitting time. Self-reported physical activity research has allowed
large-scale trends in active and inactive behaviours in the workplace to be analysed
(Cooper et al., 2009).

23
The studies shown in Table 3 report physical activity and sedentary behaviour in terms
of mean occupational sitting time, estimated energy expenditure (expressed in MET)
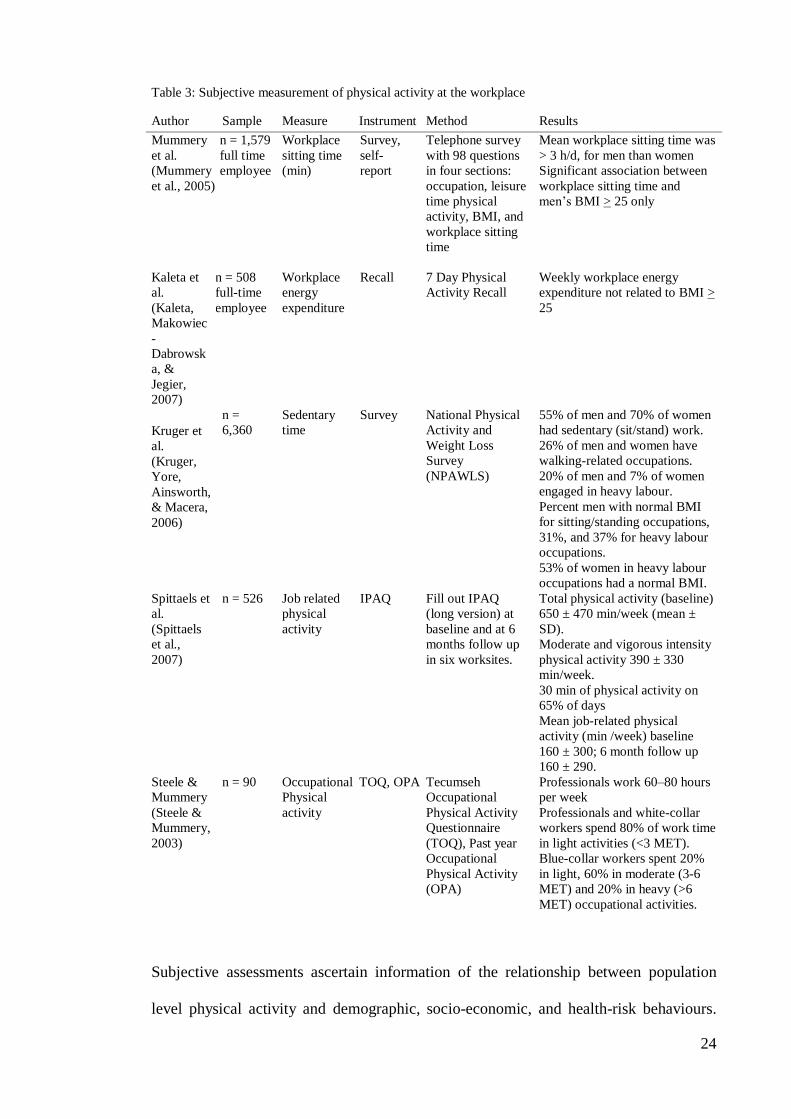
and time spent being physically active at work and during leisure time. Mummery et al.
(2005) used a survey of workers in two Australian regional communities and
determined that mean occupational sitting time was >3 h/d and that men spent more
time sitting than women (210, 190 min respectively; p= 0.026). There was a significant
association between occupational sitting time and BMI > 25 for men but not women. In
contrast, Kaleta et al. (2007), using a questionnaire (Seven Day Physical Activity
Recall) determined that weekly energy expenditure of occupational physical activity
(<4,000 kcal/week) was not related to BMI > 25. Spittaels et al. (Spittaels et al., 2007)
used the International Physical Activity Questionnaire (IPAQ) to determine that work-
related physical activity was 160 ± 300 min/week (mean ± SD).
A comparison of occupational physical activity (OPA) at light, moderate and heavy
intensity within different work-sectors determined that white-collar workers (clerical
salesmen and service workers) spent an average 80% of work hours performing “light”
activities (< 3 MET) (Steele & Mummery, 2003). Blue-collar workers spent 20% in
“light”, 60% in “moderate” (3-6 MET) and 20% in heavy (>6 MET) intensity
occupational activities.
24
Subjective assessments ascertain information of the relationship between population
level physical activity and demographic, socio-economic, and health-risk behaviours.
Table 3: Subjective measurement of physical activity at the workplace
Author Sample Measure Instrument Method Results
Mummery
et al.
(Mummery
et al., 2005)
n = 1,579
full time
employee
Workplace
sitting time
(min)
Survey,
self-
report
Telephone survey
with 98 questions
in four sections:
occupation, leisure
time physical
activity, BMI, and
workplace sitting
time
Mean workplace sitting time was
> 3 h/d, for men than women
Significant association between
workplace sitting time and
men’s BMI > 25 only
Kaleta et
al.
(Kaleta,
Makowiec
-
Dabrowsk
a, &
Jegier,
2007)
n = 508
full-time
employee
Workplace
energy
expenditure
Recall 7 Day Physical
Activity Recall
Weekly workplace energy
expenditure not related to BMI >
25
Kruger et
al.
(Kruger,
Yore,
Ainsworth,
& Macera,
2006)
n =
6,360
Sedentary
time
Survey National Physical
Activity and
Weight Loss
Survey
(NPAWLS)
55% of men and 70% of women
had sedentary (sit/stand) work.
26% of men and women have
walking-related occupations.
20% of men and 7% of women
engaged in heavy labour.
Percent men with normal BMI
for sitting/standing occupations,
31%, and 37% for heavy labour
occupations.
53% of women in heavy labour
occupations had a normal BMI.
Spittaels et
al.
(Spittaels
et al.,
2007)
n = 526 Job related
physical
activity
IPAQ Fill out IPAQ
(long version) at
baseline and at 6
months follow up
in six worksites.
Total physical activity (baseline)
650 ± 470 min/week (mean ±
SD).
Moderate and vigorous intensity
physical activity 390 ± 330
min/week.
30 min of physical activity on
65% of days
Mean job-related physical
activity (min /week) baseline
160 ± 300; 6 month follow up
160 ± 290.
Steele &
Mummery
(Steele &
Mummery,
2003)
n = 90 Occupational
Physical
activity
TOQ, OPA Tecumseh
Occupational
Physical Activity
Questionnaire
(TOQ), Past year
Occupational
Physical Activity
(OPA)
Professionals work 60–80 hours
per week
Professionals and white-collar
workers spend 80% of work time
in light activities (<3 MET).
Blue-collar workers spent 20%
in light, 60% in moderate (3-6
MET) and 20% in heavy (>6
MET) occupational activities.
25
Kruger et al. (2006) contacted a nationwide sample of 6,360 workers by telephone
whom completed the National Physical Activity and Weight Loss Survey and
determined that over half the working population described their work as sedentary
(55% of men and 70% of women) and 19% of men and 7% of women performed heavy
manual-labour. The researchers also observed that men and women employed in
occupations involving heavy labour were twice as likely to engage in regular leisure-
time moderate intensity activity compared to those who were mostly sedentary at work.
Kaleta et al. (2007) analysed the relationship between BMI > 25 in men and
demographic variables and identified that age (> 45 years), lack of recreational physical
activity, low educational qualifications, low income and a history of smoking were
associated with high BMI.
Measurement of workplace physical activity with criterion standards
Criterion standards include direct observation, doubly labelled water (DLW), and
indirect calorimetry. Direct observation involves witnessing physical activity behaviour
and simultaneously recording activity in a written coded format or entering activity
codes into a portable computer (Kohl, Fulton, & Caspersen, 2000). Doubly labelled
water is a technique that assesses total caloric expenditure by calculating carbon dioxide
production using isotope (2H2
18O) dilution measured in urine samples for a minimum of
3 days. Open-circuit indirect calorimetry measures energy expenditure (EE) from
oxygen consumption (VO2) and carbon dioxide (CO2) production. Criterion standard
measures provide valid, reliable and highly accurate information about energy
expenditure sufficient to detect small changes in the variables studied. The
disadvantages of criterion standards are that measurements are either only practical for
small samples of the population, measured over a short timeframe or are impractical for
use in free-living conditions. Criterion measures are more costly in terms of

26
implementation and time, for both the investigators and participants because equipment
is either expensive or requires sophisticated analyses (Ainslie, Reilly, & Westerterp,
2003). Measurement of activity using indirect or direct calorimetry is only feasible in
certain occupations because the measurement equipment could disrupt productivity or
modify work-related activity (Ainslie et al., 2003).
The three studies, shown in table 4, measured workplace energy expenditure with
indirect calorimetry. At an experimental office facility it was demonstrated that office
workers could perform office duties while performing a workout on a stepper, which
increased office-work energy expenditure while sitting from 90 ± 20 kcal/h (mean ±
SD) to 380 ± 120 while simultaneously using the stepper (p< 0.001) (McAlpine et al.,
2007). Beers et al. (Beers et al., 2008) measured energy expenditure while performing
clerical work using indirect calorimetry and reported a trivial increase in energy
expenditure between participants sitting on a therapy ball or standing compared with
sitting on an office chair. The increase in energy expenditure of stationary workplace-
walking while performing office duties ranged from 120 ± 25 kcal/h (Levine & Miller,
2007), (walking on a treadmill while working) to 290 ± 100 kcal/h (McAlpine et al.,
2007) (using stepping device while working) compared to sitting. Levine and Miller
(Levine & Miller, 2007) suggested that the increase in energy expenditure of walking
on a treadmill while doing office work, if other components of energy balance remain
constant, could translate into body weight loss of 20-30 kg in 12 months.

27
Table 4: Criterion standard measurement of physical activity at the workplace
Author Sample Measure Equipment Setting / Tests Results
McAlpine et
al.
(McAlpine et
al., 2007)
n=19
10 obese;
9 normal
weight
healthy
sedentary
volunteers
Office-work
Energy
Expenditure
Indirect
Calorimetry
Experimental
office facility.
Energy
expenditure 20
min in each
condition: lying
and standing
motionless,
Office-work
sitting,
Office-work
walking on
OPSDa stepper
Resting energy expenditure
less in the normal weight
than in the obese volunteers
(r= 0.78%; p< 0.001)
Linear relationship between
walking speed and energy
expenditure (r2 = 0.99)
Using OPSD stepper while
working associated with 290
+ 100 kcal/h (mean + SD; p<
0.001) increase in energy
expenditure
Beers et al.
(Beers et al.,
2008)
n = 24
(50% men)
sedentary
clerical
occupation
Office-work
Energy
Expenditure
Indirect
calorimetry
Office workplace
Energy
expenditure 20
minutes in each
condition: word
processing;
sitting in an office
chair, sitting on a
therapy ball and
standing.
Energy expenditure
increased 4 kcal/h (p < 0.05)
while sitting on a therapy
ball
No difference in energy
expenditure between sitting
on a therapy ball or standing
postures (p = 0.48)
Levine &
Miller
(Levine &
Miller,
2007)
n = 15 obese
sedentary
individuals
Office-work
Energy
Expenditure
Indirect
calorimetry
Experimental
office facility
Energy
expenditure 20
min in each
condition: lying
and standing
motionless,
office-work
sitting, office-
work while
treadmill walking
The energy expenditure
while seated at work in an
office chair was 70 + 10
kcal/h.
The energy expenditure
while walking and working
on a self-selected velocity of
1.1+ 0.4 mph was 190 + 30
kcal/h.
aOPSD = Office Place Stepping Device
Validity and reliability of instruments
The reviewed studies did not report on the validity of the instruments used. However,
most instruments shown in Table 5 had acceptable levels of validity with a range of r =
0.50 to r = 0.96. Most of these instruments demonstrated adequate validity against a
gold standard in both laboratory and field conditions. Surveys, questionnaires and / or
interviews with acceptable levels of reliability were the measurement instrument most

28
used by researchers (Kaleta et al., 2007; Kruger et al., 2006; Mummery et al., 2005;
Spittaels et al., 2007). Motion sensors showed the best validity and reliability over
subjective measures, highlighting the accelerometer’s accuracy and reliability (98.5 +
1.0 % of accuracy and reliability of 98.8 + 1.2 %). The most measured occupational
physical activity behaviours were sedentary time, occupational sitting time, workplace
physical activity and walking.

29
Table 5: Validity and reliability of studies included in this review
Method Study Authors Validity of instruments a Reliability References
Measurement tool Validation tool Finding Test – retest
period
Finding
Indirect
calorimetry
McAlpine et al.
(McAlpine et al.,
2007)
Indirect calorimeter
Columbus
N/Ab N/A
N/A N/A
N/A Levine & Miller
(Levine &
Miller, 2007)
Indirect calorimeter
Columbus
Beers et al. (Beers et al.,
2008)
Indirect calorimeter Vmax 29, Metabolic Cart
vs. Deltatrac Metabolic Monitor (DTC)
t-test ∆ 0.06 (p = 0.8)
1 day Coefficient of variation 8.0%
Cooper et al. (Cooper et al., 2009)
Motion sensors
Ruiz-Tendero et al.
(Ruiz-Tendero et
al., 2006)
MTI Actigraph vs. EEc vs. VO2
vs. Treadmill speed
r = 0.82 r = 0.89
r = 0.92
Melanson & Freedson (Melanson & Freedson,
1995)
3 trials of treadmill
walking (3 mph)
Not given CVd 8.9%
ICCe 0.80
Welk et al.
(Welk, Schaben, &
Morrow, 2004)
Schofield et al. (Schofield et al.,
2005)
Yamax Digiwalker SW 700
Treadmill walking at various speeds – EE by
indirect calorimetry
% accuracy ±99% p<0.05
Crouter et al. (Crouter, Schneider,
Karabulut, & Bassett,
2003)
400-m walk 1 – 4 days Error scores -0.1±8.4 95%
prediction interval
(16.7 – 16.9)
Schneider et al. (Schneider et al., 2003)
3DPAR, steps/
occupational category
Correlated with VO2max r = 0.50 p
< 0.001
7 days test
retest
r 0.75 p< 0.001 Jamner & Cooper
(Jamner & Cooper, 2002)
Gilson
(Gilson, 2008)
Yamax SW 200 Pedometer versus direct
observation
r = 0.96 p =
0.001
Kilanowski et al.
(Kilanowski, Consalvi, & Epstein, 1999)
1 week
measuring
period
ICC 0.96 (95% CIf,
0.94 – 0.97)
Barfield et al.
(Barfield, Rowe, &
Michael, 2004)

30
Questionnaires Mummery et al. (Mummery et al.,
2005)
Active Australia Survey 14 days ICC (95% CI) 0.86 (0.80-0.90)
Booth et al. (Booth, Owen, Bauman, &
Gore, 1996)
Cross validated vs.
PSFAg
Total time of:
Moderate activity r=0. 97
Vigorous
activity r=0.
89
Australian Institute of
Health and Welfare, (AIHW, 2003)
Kaleta et al.
(Kaleta et al.,
2007)
7 Day Physical Activity
Recall (SDPAR)
Relationship between
SDPAR and VO2 max
r = 0.61 p <
0.05
5 weeks
2 – 9 weeks
5 – 9 weeks
r = 0.58 p < 0.05
r = 0.42 p < 0.05
r = 0.63 p < 0.05
Dishman and Steinhardt
(Dishman & Steinhardt,
1988)
Kruger et al. (Kruger et al.,
2006)
National Physical Activity and Weight Loss
Survey (NPAWLS)
vs. accelerometer k=0.19 CI 0.04, 0.34
1 – 5 days k = 0.84 CI = 0.69, 0.99
Yore et al. (Yore et al., 2007)
vs. Physical activity log k = 0.40 CI 0.15, 0.65
Spittaels et al.
(Spittaels et al.,
2007)
International Physical
Activity Questionnaire
(IPAQ)
Criterion validity
CSA accelerometer)
Long form:
p=0.33, 95% CI
0.26-0.39 Short form:
p=0.30, 95%
CI=0.23-0.36
test – retest
between 8 and
10 days
Long form
repeatability
coefficient p=0.81 (95% CI 0.79 –
0.82);
Short form p=0.76
(95% CI 0.73-0.77)
Craig et al.
(Craig et al., 2003)
Steele &
Mummery
(Steele & Mummery, 2003)
Tecumseh Occupational
physical activity
Questionnaire (TOQ)
Against Cardiorespiratory
fitness and tri-axial
accelerometer
EE during
work 0.91
Work index 0.86 ,
p<0.05
1 month R = 0.80 Philippaerts et al.
(Philippaerts, Westerterp,
& Lefevre, 2001)
aData from these studies show the instruments reported validity and an assessment of the validity is not included as part of this review bN/A = Not applicable cEE = Energy expenditure dCV = Coefficient of variation eICC = Intra-class correlation fCI = Confidence Interval gPSFA = Pilot Survey Fitness of Australians

31
2.4. Discussion
The aim of this review was to summarise methods used to measure workplace physical
activity and sedentary behaviour and identify the associated strengths and limitations of
different measurement techniques. The world-wide increase in non-communicable
diseases affecting working adults (W.H.O., 2010) related to increases in occupational
sedentary behaviour (Cook et al., 2001) highlight the need for accurate, valid and
reliable measurement instruments (Trost et al., 2005). Evidence from studies in this
review identified that: (1) Most workplace research measured physical activity rather
than sedentary behaviour; (2) the majority of studies on occupational sedentary
behaviour used self-reported assessments; (3) and workplace sedentary activity was
considered disproportionate with occupational physical activity.
In studies that measured office-work physical activity using a criterion standard it
would appear that being physically active while carrying out office duties is an effective
strategy to increase energy expenditure (Beers et al., 2008; Levine & Miller, 2007;
McAlpine et al., 2007). All participants tolerated walking on steppers or treadmills at
“active” workstations, which may be an effective weightloss approach, and were able to
perform all the typical clerical functions including answering phone calls, reading
documents, reception duties and typing (Levine & Miller, 2007; McAlpine et al., 2007).
Longitudinal studies of the effectiveness of active workstations using treadmills and
steppers in a variety of occupational settings are required to ascertain the usefulness of
active workstations as a weightloss tool.

32
Objective measurement using motion sensors are highly reliable method for collecting
physical activity information in workplace settings (Cook, Simmons, Swinburn, &
Stewart, 2001). Accelerometers allow activity data collection for long periods, and
store large amounts of activity information without the presence of a researcher, saving
on time and cost (Trost et al., 2005). Another advantage of using objective measures is
to reduce error from recall bias (Ainsley et al., 2003) and participants can wear motion
sensors in the workplace without interfering with productivity. Only one study assessed
the relationship of physical activity with health-risk (Gilson, 2008), therefore further
studies that combine measurement of metabolic risk-factors and objectively assessed
sedentary behaviours at work are required to determine associations between workplace
activity and health. While objective measures are the best option for estimating physical
activity and sedentary time, when choosing accelerometers, there is still no consensus
around equations used to interpret accelerometer data and decisions made during data
reduction and cleaning.
In the studies reviewed, self-report was the most common method for collecting
workplace activity data because of the ease of collecting data on large populations and
the cost effectiveness of this research method (Ainsley et al., 2003). Self-reports of
daily occupational sitting were under reported (3 hours) compared with objective
measures of sitting time at work (~5 hours a day). Comparison of physical activity
between studies that self-reported minutes spent in occupational physical activity per
week and studies that objectively measured activity as steps counts during work hours
were not practical. All of the subjectively assessed physical activity studies reviewed
measured physical activity patterns at work in relation to BMI, only two assessed

33
sedentary behaviour measured as sitting time and no studies assessed the relationship of
workplace activity with work performance or health outcomes.
Gaps in literature
Studies rarely integrate a both quantitative and qualitative research method, which is
necessary to improve our understanding of barriers and facilitators to workplace
physical activity behaviours (Proper, Staal, Hildebrandt, van der Beek, & van
Mechelen, 2002). Objective and subjective activity measurement techniques combined
with measurement of metabolic risk factors would provide researchers with more
comprehensive information necessary to develop effective intervention strategies. The
relationship between physical activity and sitting time at work with hypertension,
dyslipidemia, hyperglycaemia, cardiovascular disease and obesity associated with high
health-risk occupations requires further investigation (Welk et al., 2004).
Although using criterion standards to measure activity are not suitable for many work
sites, studies in this review verified that simulating work conditions combined with
potential intervention strategies could provide important information about potential
ways to increase workplace energy-expenditure. The next step is to perform workplace
research of strategies that are effective at increasing energy expenditure using objective
and subjective measures to validate the long-term worth of the intervention strategies.
The measurement error of self-reported physical activity; type, setting, intensity,
frequency and duration resulting from participant recall bias, testing, and scoring
produce low reliability and validity values for some questionnaires (Macko et al., 2002;
Melanson & Freedson, 1995). Therefore, objective tools are recommended to accurately
quantify workplace sedentary behaviour and physical activity. However, objectively
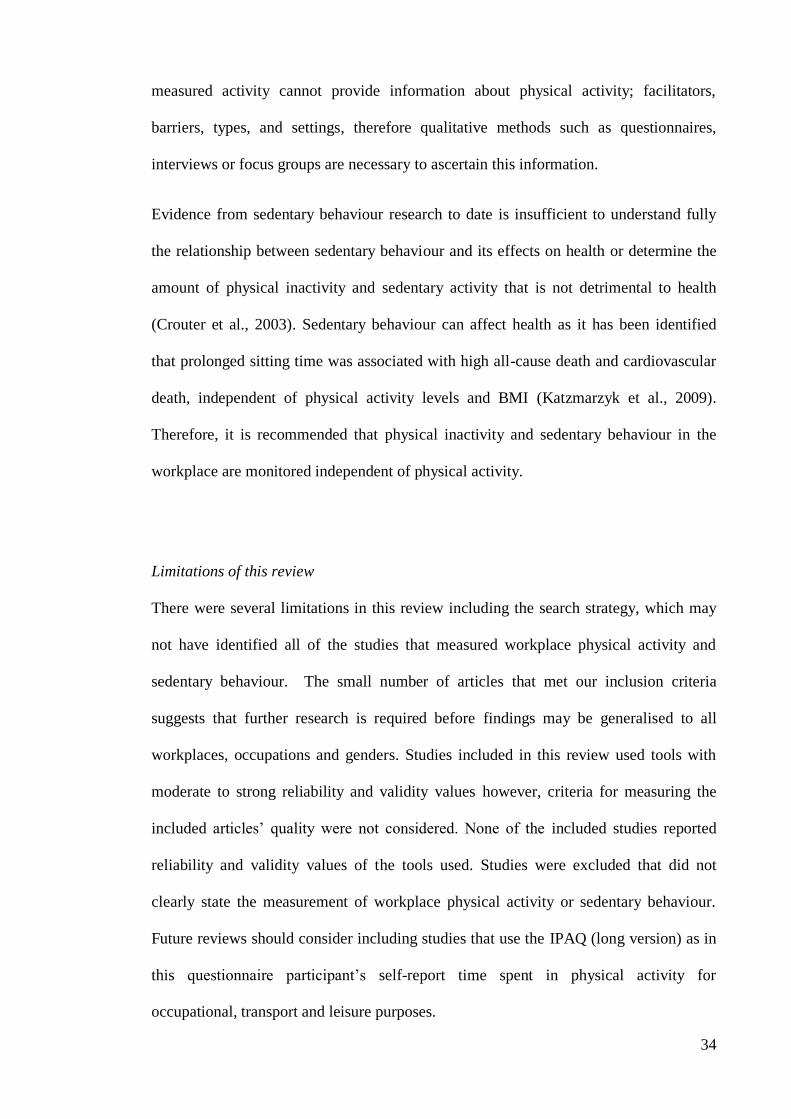
34
measured activity cannot provide information about physical activity; facilitators,
barriers, types, and settings, therefore qualitative methods such as questionnaires,
interviews or focus groups are necessary to ascertain this information.
Evidence from sedentary behaviour research to date is insufficient to understand fully
the relationship between sedentary behaviour and its effects on health or determine the
amount of physical inactivity and sedentary activity that is not detrimental to health
(Crouter et al., 2003). Sedentary behaviour can affect health as it has been identified
that prolonged sitting time was associated with high all-cause death and cardiovascular
death, independent of physical activity levels and BMI (Katzmarzyk et al., 2009).
Therefore, it is recommended that physical inactivity and sedentary behaviour in the
workplace are monitored independent of physical activity.
Limitations of this review
There were several limitations in this review including the search strategy, which may
not have identified all of the studies that measured workplace physical activity and
sedentary behaviour. The small number of articles that met our inclusion criteria
suggests that further research is required before findings may be generalised to all
workplaces, occupations and genders. Studies included in this review used tools with
moderate to strong reliability and validity values however, criteria for measuring the
included articles’ quality were not considered. None of the included studies reported
reliability and validity values of the tools used. Studies were excluded that did not
clearly state the measurement of workplace physical activity or sedentary behaviour.
Future reviews should consider including studies that use the IPAQ (long version) as in
this questionnaire participant’s self-report time spent in physical activity for
occupational, transport and leisure purposes.
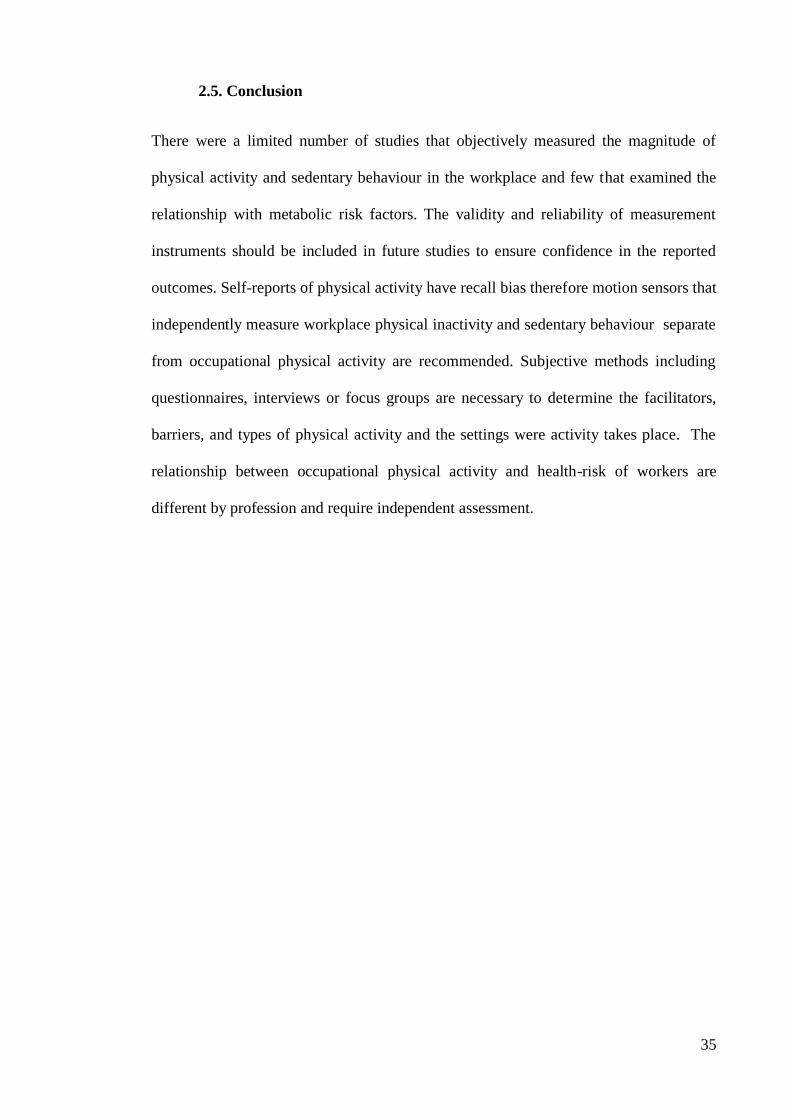
35
2.5. Conclusion
There were a limited number of studies that objectively measured the magnitude of
physical activity and sedentary behaviour in the workplace and few that examined the
relationship with metabolic risk factors. The validity and reliability of measurement
instruments should be included in future studies to ensure confidence in the reported
outcomes. Self-reports of physical activity have recall bias therefore motion sensors that
independently measure workplace physical inactivity and sedentary behaviour separate
from occupational physical activity are recommended. Subjective methods including
questionnaires, interviews or focus groups are necessary to determine the facilitators,
barriers, and types of physical activity and the settings were activity takes place. The
relationship between occupational physical activity and health-risk of workers are
different by profession and require independent assessment.
36
CHAPTER 3
Literature review II: Occupational physical activity, sedentary
behaviour and cardiovascular risk in teachers
3.1. Introduction
There is a growing concern about physical inactivity and sedentary behaviours
associated with a decline in health globally (AIHW, 2003; Cavill et al., 2006;
Department of Health and Children, 2009; Livingstone, Robson, Wallace, & McKinley,
2003; Ministry of Health, 2007; Services, 1996). International recommendations for
physical activity advocate that adults and children should participate in a minimum of
30 and 60 minutes respectively of moderate-to-vigorous intensity physical activity
(W.H.O., 2010) daily during work, transportation, leisure time to prevent chronic
disease (Pate et al., 2005). Low physical activity levels are related to the development
of chronic diseases (Hamilton et al., 2008; Warren et al., 2010), and the increasingly
sedentary lifestyle of population worldwide is associated with considerable economic
costs (Bauman et al., 2003). Sitting time is associated with mortality from all causes
including cardiovascular disease, independent of leisure-time physical activity
(Katzmarzyk et al., 2009), which suggests that the effects of sedentary behaviours on
health require further research.
Adults spend more than half of their waking day at work in occupations that require
long periods of sedentary activity, which could negatively impact on health, increasing
obesity, hypertension, and impaired blood lipids that are associated with cardiovascular

37
diseases (Grundy, Pasternak, Greenland, Smith, & Fuster, 1999). Other factors such as
the environment, socioeconomic status, mood, smoking and alcohol consumption can
increase the negative effect on health (Prokosch, Dalleck, & Pettit, 2011).
Teaching is a complex, often stressful and challenging profession, which requires
teachers to develop tailored learning and classroom management strategies for a
diverse group of students while meeting learning expectations of the curricula and
parents (Kent, 2000). Indeed the New Zealand Curriculum seeks to develop key
competencies for lifelong learning, based on values and principles that demand from
teachers effective pedagogies to promote student learning (Ministry of Education,
2007). Teachers are required to engage with the student as a mentor and guide in the
learning process, and be more than a provider of knowledge, which places intellectual,
mental and physical demands on teachers. Although teachers’ occupational physical
activity data is limited other workplace stressors have been identified, including poor
working conditions, limited classroom space, poor lighting, noise, and the multiple task
requirements of the job (Easthope & Easthope, 2000; Smith & Bourke, 1992). To
ensure that the workplace environment does not negatively interfere with student
learning teachers’ have responded by adapting their teaching style from a sedentary to a
more active approach, which may have increased teachers’ occupational energy
expenditure (LaMaster et al., 1998; Pihl, Matsin, & Jurimae, 2002).
The purpose of this review was to examine the physical and social environmental
factors at school that affect teacher’s workplace physical activity and sedentary
behaviours that may influence their health and their student’s physical activity
behaviour.

38
3.2. Methods
CINAHL, EBSCO, Google Scholar, MEDLINE, OSH References, ProQuest, Scopus,
Web of Sciences, PsycInfo, Science Direct, and SPORT Discus databases were
searched for relevant published articles using the following terms or combinations of
the terms; primary, elementary, school teachers, staff, personnel, occupational physical
activity, physical fitness, health behaviour, wellness, and role modelling. The criteria
for including journal articles were those written in English or Spanish, published 1982-
2012 that examined teachers' occupational physical activity, workload, cardiovascular
status, or well-being. Articles were excluded that were reviews, meta-analysis or those
that were focused on students.
.
After applying inclusion criteria, 19 studies were selected and data were extracted
according to the criteria identified by Hartvigsen et al. (2000): year of publication, name
of the author(s), title of article, source, testing methods, context and focus of study, data
collection method and study findings. One study on children's perception of the good
teacher was included in the review (Jules & Kutnick, 1997), to obtain information about
the teacher as a role model.
3.3. Results and discussion
Searches of databases identified 3,883 potentially relevant articles. Of these, 76 full
articles were downloaded based on the information provided in the abstracts and 36
articles were identified for a detailed review. From these, 19 articles shown in Table 6
met inclusion criteria.
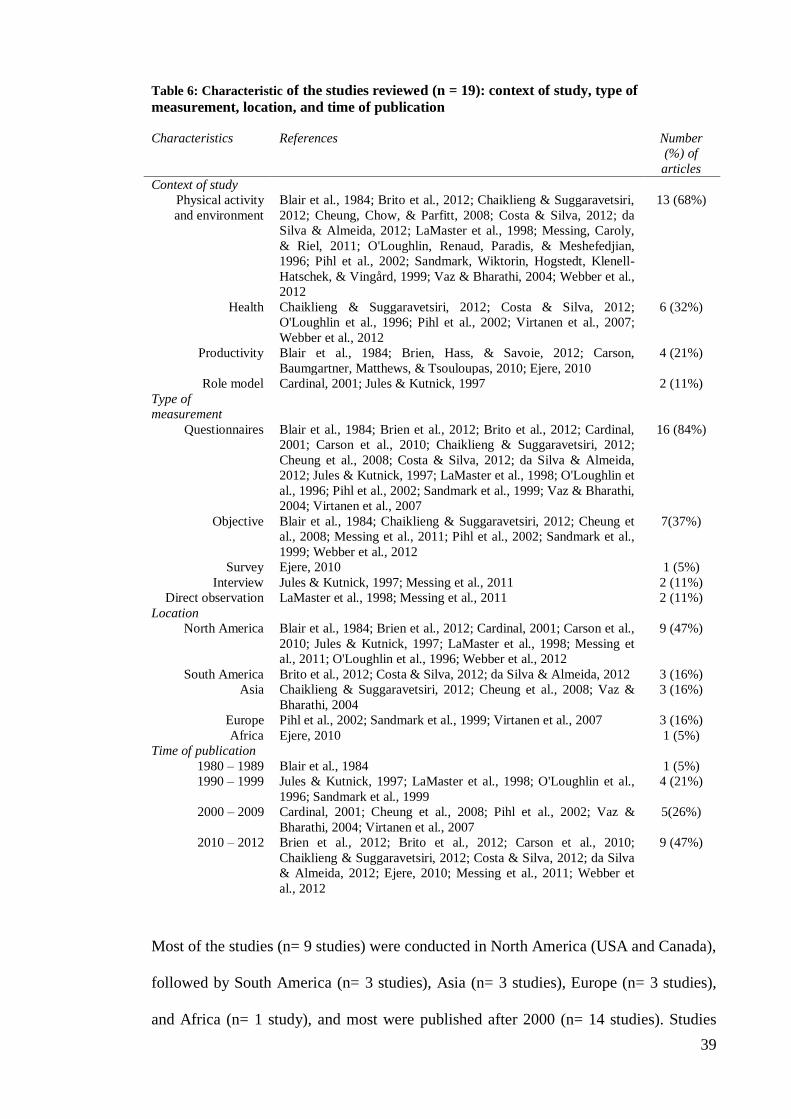
39
Table 6: Characteristic of the studies reviewed (n = 19): context of study, type of
measurement, location, and time of publication
Characteristics References Number
(%) of
articles
Context of study
Physical activity
and environment
Blair et al., 1984; Brito et al., 2012; Chaiklieng & Suggaravetsiri,
2012; Cheung, Chow, & Parfitt, 2008; Costa & Silva, 2012; da
Silva & Almeida, 2012; LaMaster et al., 1998; Messing, Caroly,
& Riel, 2011; O'Loughlin, Renaud, Paradis, & Meshefedjian,
1996; Pihl et al., 2002; Sandmark, Wiktorin, Hogstedt, Klenell-
Hatschek, & Vingård, 1999; Vaz & Bharathi, 2004; Webber et al.,
2012
13 (68%)
Health Chaiklieng & Suggaravetsiri, 2012; Costa & Silva, 2012;
O'Loughlin et al., 1996; Pihl et al., 2002; Virtanen et al., 2007;
Webber et al., 2012
6 (32%)
Productivity Blair et al., 1984; Brien, Hass, & Savoie, 2012; Carson,
Baumgartner, Matthews, & Tsouloupas, 2010; Ejere, 2010
4 (21%)
Role model Cardinal, 2001; Jules & Kutnick, 1997 2 (11%)
Type of
measurement
Questionnaires Blair et al., 1984; Brien et al., 2012; Brito et al., 2012; Cardinal,
2001; Carson et al., 2010; Chaiklieng & Suggaravetsiri, 2012;
Cheung et al., 2008; Costa & Silva, 2012; da Silva & Almeida,
2012; Jules & Kutnick, 1997; LaMaster et al., 1998; O'Loughlin et
al., 1996; Pihl et al., 2002; Sandmark et al., 1999; Vaz & Bharathi,
2004; Virtanen et al., 2007
16 (84%)
Objective Blair et al., 1984; Chaiklieng & Suggaravetsiri, 2012; Cheung et
al., 2008; Messing et al., 2011; Pihl et al., 2002; Sandmark et al.,
1999; Webber et al., 2012
7(37%)
Survey Ejere, 2010 1 (5%)
Interview Jules & Kutnick, 1997; Messing et al., 2011 2 (11%)
Direct observation LaMaster et al., 1998; Messing et al., 2011 2 (11%)
Location
North America Blair et al., 1984; Brien et al., 2012; Cardinal, 2001; Carson et al.,
2010; Jules & Kutnick, 1997; LaMaster et al., 1998; Messing et
al., 2011; O'Loughlin et al., 1996; Webber et al., 2012
9 (47%)
South America Brito et al., 2012; Costa & Silva, 2012; da Silva & Almeida, 2012 3 (16%)
Asia Chaiklieng & Suggaravetsiri, 2012; Cheung et al., 2008; Vaz &
Bharathi, 2004
3 (16%)
Europe Pihl et al., 2002; Sandmark et al., 1999; Virtanen et al., 2007 3 (16%)
Africa Ejere, 2010 1 (5%)
Time of publication
1980 – 1989 Blair et al., 1984 1 (5%)
1990 – 1999 Jules & Kutnick, 1997; LaMaster et al., 1998; O'Loughlin et al.,
1996; Sandmark et al., 1999
4 (21%)
2000 – 2009 Cardinal, 2001; Cheung et al., 2008; Pihl et al., 2002; Vaz &
Bharathi, 2004; Virtanen et al., 2007
5(26%)
2010 – 2012 Brien et al., 2012; Brito et al., 2012; Carson et al., 2010;
Chaiklieng & Suggaravetsiri, 2012; Costa & Silva, 2012; da Silva
& Almeida, 2012; Ejere, 2010; Messing et al., 2011; Webber et
al., 2012
9 (47%)
Most of the studies (n= 9 studies) were conducted in North America (USA and Canada),
followed by South America (n= 3 studies), Asia (n= 3 studies), Europe (n= 3 studies),
and Africa (n= 1 study), and most were published after 2000 (n= 14 studies). Studies
40
were classified into four groups for review: physical activity and environment; health;
productivity; and role modelling. Questionnaires were most commonly used to gather
information (n= 16 studies), followed by objective measures (n= 6 studies) including
motion sensors, anthropometric, physical activity, and blood tests. Few articles reported
the validity of the instruments used (Blair et al., 1984; Brito et al., 2012; Carson et al.,
2010; Messing et al., 2011; Sandmark et al., 1999; Webber et al., 2012). A summary of
the results of these studies that were included in the review is shown in Table 7.

41
Table 7: Summary of studies included in the review
Author Sample Purpose Measures Instruments Context Results
Blair et al., 1984 117 volunteer
teachers (87 in the
treatment school and
30 in the control
school)
To determine the
impact on health
behaviours,
satisfaction, and
general well-
being of
educators
Physical fitness and
health concepts
Self concept and job
satisfaction
BMIb and body
composition
7-day PAa recall
treadmill, sit-and
reach test, cable
tensiometer
anthropometric
questionnaire
stress management
scale
10-week intervention
program, Aerobic
Personalized
Wellness Process.
50-minute class
weekly before work,
55-minute supervised
exercise session
weekly, 5 evening
seminars
Treatment school increases
their fitness knowledge,
exercise participation,
treadmill time, and physical
fitness, and decreases their
body fat and weight
At baseline, 7% of teachers
reported vigorous exercise,
post intervention 40% of
teachers reported vigorous
exercise and 8% of controls.
All of the General Well-
Being, Job satisfaction, and
Self-Concept Scales,
indicated an improvement in
the treatment school.
At treatment school, 44%
overall lifestyle changed for
better, 68% diet changed for
better, 18% quitting smoking.
Brien et al., 2012 292 teachers from
elementary (27.4%),
high (72.2%), and
vocational training
(0.4%) schools in
Canada
To test a self –
determination
model of
teachers’ self –
perception of
performance
Psychological health
at work
Need Satisfaction
Performance
Well-being
manifestations
measure scale,
distress
manifestation
measure scale,
basic psychological
need at work scale,
teachers’ Task
performance
questionnaire
School-based study,
completing
questionnaires
Competence need satisfaction
had a statistically significant
direct link to performance (p=
0.001)
For total effects, the need for
competence was related to
both psychological health and
performance, the need for
relatedness was related to
psychological health, and
psychological health was
related to performance.

42
Brito et al., 2012 1681 public school
teachers from Sao
Paulo Brazil.
To assess the PA
in public school
teachers
Physical activity, time
spent in different
activity intensities.
IPAQ, short version Interview-
administered
questionnaire
Lower prevalence of low PA
among teachers 55- 66 y
compared with teachers 19-36
y (p < 0.05)
High PA was greater among
men than women (p<0.01)
Cardinal, 2001 551 teachers To describe the
PA and fitness
promoting
behaviours of
HPERDc
professionals,
and their
attitudes toward
role modelling
Physical activity level
BMI status
Attitudes toward role
modelling
Demographic
questionnaire
dichotomous
question about PA
behaviour,
weekly leisure-time
exercise
questionnaire,
BMI, attitude
toward role
modelling
questionnaire.
Consultation to
professionals
associated to HPERD
by mail
questionnaires
61.5% female respondents
83% active, 17% inactive
6.8% underweight, 52.6%
normal weight, 32.1%
overweight, 8.5% obese
The active respondents had
more favourable attitudes
toward role modelling
compared to inactive
respondents (p < 0.05; d=
0.59)
Underweight and normal
weight had more favourable
attitudes toward role
modelling compared to
overweight and obese
participants (p < 0.05; d=
0.35)
Carson et al.,
2010
189 child care
teachers from 28
private licensed early
care and education
centres in the USA.
To test a model
that permits the
examination of the
associations
between PA
behaviours across
work & non work
domains &
adverse outcomes
in early childcare
teachers
Physical activity
behaviour
Emotional exhaustion
Absenteeism
Turnover intentions
Questionnaires:
BHPAQd and MBI-
ESe
One-item global
rating
Cross-sectional study
about PA as a buffer
against experiences of
emotional exhaustion,
absenteeism, and
turnover intentions
The work and leisure-time
physical activity indices were
correlated negatively with
emotional exhaustion.
Absenteeism correlated
negatively with the work and
leisure-time physical activity
indices
Workplace PA behaviour had
a significant indirect effect on
both teachers’ migration and
attrition intentions (-0.07).

43
Chaiklieng &
Suggaravetsiri,
2012
452 (primary and
secondary) school
teachers from 54
schools in
Thatphanom,
Thailand
To investigate
the prevalence
and risk factors
of Repetitive
Strain Injuries
(RSIs)
Health status
Work characteristics
Questionnaire
Light meter
Physical fitness test
Personal health
behaviours and work
characteristics at
school.
WHRf: 31.4% obese
BMI: 43% obese, 49%
normal, 8% underweight
Chronic diseases: asthma &
diabetes 19%, high blood
pressure 16%
Regular exercise or more than
twice a week 38%
Most teachers had the
physical function of muscle
lower than standard
recommended
standing + sitting 79% of the
teaching time.
Teachers had complained of
getting back pain from using
computers (42%), and to
stretch to write on boards
(36%)
81% of teachers’ office and
classrooms had light intensity
lower than the standard.
Poor physical fitness was
correlated with developing
repetitive strain injury.
Costa & Silva,
2012
100 teachers from 5th
to 8th grade and High
School public
schools of
Umuarama, Brazil
Analyse the
work
environment
factors that affect
the quality of life
of public school
teachers
Relation between
work environment
and quality of life
Questionnaires: one
demographic and
school related.
Another about
burnout, Maslach
Burnout Inventory
School environment Teachers 20-30 y have high
levels of emotional exhaustion.
54% of teachers don't suffer
any verbal abuse, while 46%
said yes, from their students
Teachers with more
experience and age are less
vulnerable to the onset of
burnout
51% of teachers work
between 40 – 60 h/week.

44
da Silva &
Almeida, 2012
120 teachers from
municipal
elementary schools
of Sao Paulo, Brazil.
To describe the
physical and
postural aspects
concerning the
work of
elementary
school teachers
Frequency of postural
change
Questionnaire Daily life of teachers “No physical activity” as
physically tired at work.
55% do not have regular
physical activity.
Postural aspect such us
writing on the board,
correction of homework,
standing up for a long time
were pointed as responsible
for the job being physically
tiring
Physical discomfort
occurred in the upper and
lower limbs,
Pain was the most prevalent
complaint
Standing up is the most
frequent posture by teachers.
Ejere, 2010 200 primary school
teachers from 10
schools in Uyo,
Nigeria
To explore the
relationship
between
absenteeism and
job satisfaction,
meaningfulness
of work, and job
stress
Absenteeism
job satisfaction
perception of
meaningfulness of
work, job stress
Survey In determining the
negative impact on
student academic
achievement, repeated
absence of teachers
was assessed
40% had low level of
absenteeism.
21% had high job
satisfaction
30% had high job value or
worth
25% perceived low job stress
Strong positive relationship
between absenteeism and job
satisfaction.
A relationship exists between
absenteeism and the
perception of
meaningfulness of work
A relationship exists between
absenteeism and stress.

45
Jules & Kutnick,
1997
1756 students, aged
8 to 16 years, in
Trinidad and Tobago
To explore
similarities and
differences
between boys
and girls in their
perceptions of a
good teacher
Concepts and
characteristics
Essays,
Interviews
Examine differences
in concepts from a
society where girls
achieve superior
academic
performance
All of the children identified
physical appearance and
regular attendance as main
physical and personal
characteristics of a good
teacher.
In addition, educational
background, dedication to the
job and professional
responsibilities are identified.
Children expected care and
kindness.
Boys of all ages emphasized a
desire for the teacher to
demonstrate assertive control,
and sensitivity to students'
needs
The good teachers encourage
students learning through
inclusive, participatory
activities.
LaMaster et al.,
1998
18 fourth and fifth
grade elementary
school teachers from
California, USA
Determine the
relationship
between PEg
teachers HPAh to
the way they
conduct PE
classes
Leisure-time physical
activity
Time spent in
different intensities of
physical activity
Self-report: Godin
Leisure-time
Exercise
questionnaire,
direct observation:
SOFIT (System for
Observing Fitness
Instruction Time)
Physical education
classes provided by
classroom teachers
68% of teachers’ energy
expenditure from PA
occurred before or after
school on weekdays.
No significant relationships
between teachers’ habitual
PA and the lesson context
provided
Significant correlation
between teachers’ habitual
PA and how they behave
during class time (r=0.51,
p<0.014).

46
Messing et al.,
2011
35 school teachers of
grades 7 to 11 from
Montreal, Canada
Characterise the
teachers’
workload.
Identify working
conditions that
could be a source
of difficulty and
discouragement
for teachers
Work activity,
environmental
parameters,
working postures
Interview,
direct observation,
physical
environment
measurement by
thermometer,
sonometer and
luxmeter.
School environment,
staff room and
classroom conditions
67% of the time spent in
academic subject teaching,
9% in discipline,
34% in academic support,
20% in preparation and
organisation, 10% in
administrative tasks, and 16%
adjusting the physical
environment.
77% of the time was standing.
Temperature, noise and
lighting at the workplace were
greater than the normal
parameters.
O'Loughlin et
al., 1996
260 elementary
school teachers (125
intervention and 135
controls) from 16
schools in Montreal,
Canada.
To evaluate the
impact of school-
based screening
on smoking,
leisure time
exercise, and fat
consumption of
personnel
working in
schools offered
CVD risk factors
screening.
Teachers’
perception about
their role in
promoting heart
health with
students.
Cardiovascular risk
factors
Questionnaires:
-Sociodemographic
and health condition
-Fat consumption
Intervention by
screening
cardiovascular risk
factors and
counseling versus
only screening
At baseline, 51% elevated
cholesterol, 26% obese, 14%
high blood pressure, 40% had
2 or more cardiovascular risk
factors,
42% were advised to reduce
fat consumption, and 46%
were advised to increase PA
Post intervention, 62%
increase PA versus 47% in
the control group (p= 0.02)
Teachers exposed to
screening increased the
frequency of discussions
related to heart health with
their students.
Intervention teachers
increased their role in heart
health promotion at school
(p= 0.04)

47
Cheung et al.,
2008
52 volunteer primary
school teachers from
4 schools in Hong
Kong
To examine the
effectiveness of a
6-week
intervention that
aimed to
promote
teachers’ PA
levels during
working hours
Number of steps (to
work – at work – off
work)
Stage of changes
classification
Pedometer,
questionnaire,
anthropometric
measures
Pilot study school-
based 6-week
intervention on
teacher active
behaviour changes
using environmental
stimuli
Stage of change classification
baseline: action 25%,
preparation 12.5%, inactive
62.5%; Post intervention 22%
action, 39% preparation, 39%
inactive.
Post intervention steps at
work increased in
intervention group (p<0.001).
68% teacher reported
spending over 11 h/d on
school work
Pedometer was most effective
post intervention (3.29 ±
1.39) in a 1 to 5 scale for
awareness and effectiveness.
SMS and poster scored above
3.2 for awareness and 2.5 for
effectiveness.
Pihl et al., 2002 188 full time male
teachers (86 physical
education teachers,
and 102 teachers of
other subjects) in
Tartu, Estonia
To evaluate the
importance of
leisure-time PA
on physical
working capacity
and some health
risk factors in
older PE
teachers.
BMI - WHR
Body composition
Lipid profiles
Physical working
capacity
Exercise heart rate
Questionnaires
Anthropometric
Bioelectrical
impedance
Blood test
Cycle Ergometer
test
Sport tester Vantage
NV
A case-control study,
comparing PE
teachers with their
colleagues of other
subjects
PE teachers had a moderate
intensity PA, controls had low
PA
59% of PE teachers considered
themselves regularly
physically active, controls
were 12%.
Energy expenditure among PE
teachers 1370 kcal/week,
controls 322 kcal/week.
Physically active PETs had a
significantly lower risk of all
musculoskeletal disorder (OR
0.52; 0.29 – 0.94), lower risk of
hypertension (OR 0.25; 0.13 –
0.47), lower risk of overweight
(OR 0.63; 0.21 - 0.94).
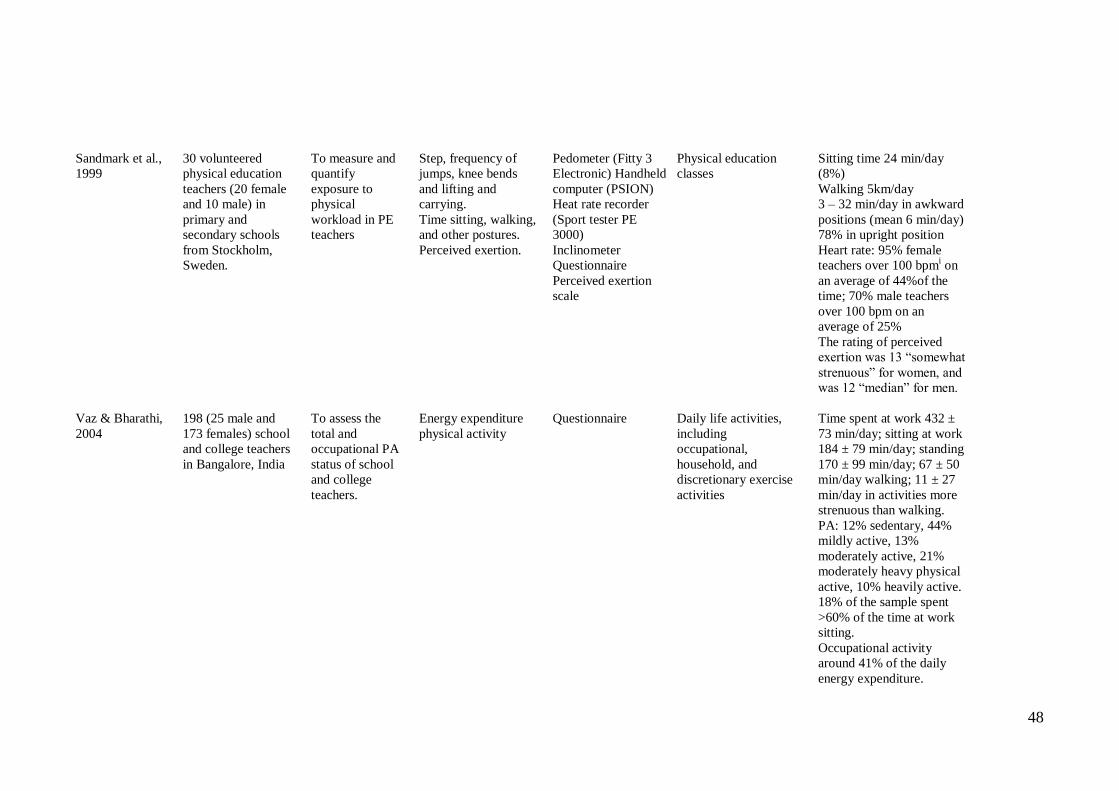
48
Sandmark et al.,
1999
30 volunteered
physical education
teachers (20 female
and 10 male) in
primary and
secondary schools
from Stockholm,
Sweden.
To measure and
quantify
exposure to
physical
workload in PE
teachers
Step, frequency of
jumps, knee bends
and lifting and
carrying.
Time sitting, walking,
and other postures.
Perceived exertion.
Pedometer (Fitty 3
Electronic) Handheld
computer (PSION)
Heat rate recorder
(Sport tester PE
3000)
Inclinometer
Questionnaire
Perceived exertion
scale
Physical education
classes
Sitting time 24 min/day
(8%)
Walking 5km/day
3 – 32 min/day in awkward
positions (mean 6 min/day)
78% in upright position
Heart rate: 95% female
teachers over 100 bpmi on
an average of 44%of the
time; 70% male teachers
over 100 bpm on an
average of 25%
The rating of perceived
exertion was 13 “somewhat
strenuous” for women, and
was 12 “median” for men.
Vaz & Bharathi,
2004
198 (25 male and
173 females) school
and college teachers
in Bangalore, India
To assess the
total and
occupational PA
status of school
and college
teachers.
Energy expenditure
physical activity
Questionnaire Daily life activities,
including
occupational,
household, and
discretionary exercise
activities
Time spent at work 432 ±
73 min/day; sitting at work
184 ± 79 min/day; standing
170 ± 99 min/day; 67 ± 50
min/day walking; 11 ± 27
min/day in activities more
strenuous than walking.
PA: 12% sedentary, 44%
mildly active, 13%
moderately active, 21%
moderately heavy physical
active, 10% heavily active.
18% of the sample spent
>60% of the time at work
sitting.
Occupational activity
around 41% of the daily
energy expenditure.

49
Virtanen et al.,
2007
1862 teachers (1471
female and 391
male) from 216
public schools in
Finland
To investigate
the association of
workplace
neighbourhood
socioeconomic
status with health
behaviours,
health and
working
conditions
among school
teachers
Neighbourhood and
social status relation
Health indicator
Working
conditions
Questionnaire
Official
Government
statistics
Part of a large
research project on
health of government
personnel
Teachers working in
schools in the poorest areas
had a 2.3 fold risk of heavy
alcohol use, 1.4 times
greater risk of any chronic
disease, 1.2 times greater
risk of cardiovascular
disease, 1.3 greater risk of
musculoskeletal disease,
and 1.5 times greater risk of
mental disorders.
Teachers working in the
high socioeconomic areas
reported higher
participation in
occupational training,
higher teaching efficacy
and lower mental workload.
Webber et al.,
2012
745 female public
elementary school
personnel in
Louisiana, USA
To reduce
overweight and
obesity among
school
employees by
altering the
school
environment to
increase healthy
eating and PA
BMI and % of fat,
blood pressure,
lipid profiles and
glycemia,
PA
Anthropometry,
blood test,
accelerometry
A group randomised
controlled trial
72% obese or overweight
Lipid profile in normal
values
No one achieved 1 minute
of MVPAj during the day
21 min/day of light
intensity activities
aPA = physical activity;
bBMI = body mass index;
cHPERD = Health, physical education, recreation, and dance;
dBHPAQ = Baecke’s Habitual Physical Activity
Questionnaire; eMBI-ES = Maslach Burnout Inventory – Educators Survey;
fWHR = waist to hip ratio;
gPE = physical education;
hHPA = Habitual physical activity
ibpm = beats per min;
jMVPA = moderate to vigorous physical activity

50
Teachers’ occupational physical activity and work environment
Physical education teachers’ habitual physical activity mostly occurred before or after
school on weekdays and accounted for approximately 70% of their energy expenditure
on weekdays (LaMaster et al., 1998). The energy expenditure of physical education
teachers’ is greater as 90% of physical education class time is spent standing (Sandmark
et al., 1999). Physical education teachers in Estonia were categorised as moderately
active at work in comparison with teachers of other subjects (Pihl et al., 2002).
Teachers working in public schools in Brazil had physical activity levels that were
described as low, which varied according to age, gender, and city area (Brito et al.,
2012). Da Silva and colleagues (da Silva & Almeida, 2012), observed that a
contributing factor to a decrease in teachers’ physical activity was fatigue in the upper
limbs resulting from writing on classroom whiteboards. Approximately 70% of the
time, teachers were engaged in standing and walking, which may have contributed to
the finding that 55% of teachers reported not engage regular leisure time physical
activity (da Silva & Almeida, 2012). Primary school and college teachers from South
India spent 430 ± 70 min/day at work and for 40% of work time teachers were seated
(Vaz & Bharathi, 2004) whereas teachers in Thailand spent 80% of their teaching time
in sitting postures (Chaiklieng & Suggaravetsiri, 2012) and Canadian teachers’ spent
~80% of classroom time standing (Messing et al., 2011). In a recent study conducted in
a large population of North American teachers it was reported that the average time
spent in light intensity activities was 22 min/d and time spent in moderate to vigorous
activity was less than 1 min/d (Webber et al., 2012). In summary, the physical activity
and sedentary behaviours of teachers were inconsistent between physical education

51
teachers and teachers of other subjects and by country, which may be a reflection of
different cultures, socio-economic conditions and teaching styles.
Physical activity interventions
In a study carried out in Hong Kong (Cheung et al., 2008), it was found that
promotional stimuli increased teachers’ physical activity at work. Following a six-week
intervention where teachers received a pedometer, SMS messages, posters and
information leaflets about exercise benefits, teachers workplace steps increased to 7,200
(p< 0.0001) from 6,300 at baseline (Cheung et al., 2008). Based on the Trans
Theoretical Model approach (Marcus et al., 1992), a change from inactive to active
behaviour was reported post intervention for the teachers (Cheung et al., 2008). In an
earlier study (Blair et al., 1984), after a 10-week health promotion programme that
emphasized exercise, stress management, and nutrition, teachers lost weight, their blood
pressure was lower, and their physical fitness, general well-being and ability to cope
with job stress improved.
School environment
The physical and the social environment at school affect teachers’ physical activity
behaviour negatively when work conditions are poor, and / or the number of students to
be supervised is high, which subsequently contribute to a greater workload (Messing et
al., 2011). Primary school teachers are involved in multiple work-related tasks teaching,
supporting student learning, organising activities, and managing the classroom
environment (Messing et al., 2011), which increase the feeling of lack of time to
achieve curriculum goals. Difficulties in balancing work-related activities and family

52
time are another factor that contributes to teachers’ tension and frustration at work
(Messing et al., 2011). The stresses of the teaching environment is high, which can lead
to emotional exhaustion among younger teachers (20-30 y) compared with more
experienced teachers, which are less vulnerable to the onset of psychological exhaustion
(Costa & Silva, 2012).
In Canadian classrooms often the temperature was hotter than recommended (21 -24⁰
C), the noise level was higher than the World Health Organisation recommendations
(35 dBA), and the lighting was sub-standard (Messing et al., 2011). The uncomfortable
classroom environment affected children’s concentration and the teachers’ ability to
teach (Messing et al., 2011). In summary, providing a physically comfortable
environment for teaching and intervening to increase workplace physical activity may
improve teacher’s ability to cope with job-related stress.
Teachers’ health
The earliest study to investigate teacher’s health reported that 25% of teachers had no
indication of cardiovascular risk, 40% had two or more risk factors and the rates of
obesity were 26%, smoking 18%, and hypertension 14% (O'Loughlin et al., 1996).
More recent studies have reported that there was an increase in the prevalence of
cardiovascular risk factors overweight 72% (Webber et al., 2012), obesity 43%,
hypertension 16%, and asthma or diabetes diagnosed for 19% of teachers (Chaiklieng &
Suggaravetsiri, 2012). The increased health-risk were associated with low amounts of
daily physical activity for normal weight, overweight and obese teachers (light
intensity; 24, 24, 21 min/d and moderate to vigorous intensity; 0.8, 0.7, 0.5 min/d
53
respectively) (Webber et al., 2012). The main reason teachers provided for not being
involved in physical activity on school days was that they were very busy (Webber et
al., 2012). Obese teachers had poor metabolic profiles high blood pressure, plasma
glucose, and triglycerides, and low HDL cholesterol (Webber et al., 2012). Physical
education teachers showed a statistically significant lower risk of musculoskeletal
disorders (OR: 0.52; CI: 0.29 – 0.94), and lower risk of being overweight (OR: 0.63; CI:
0.21 – 0.94) compared with teachers of other subjects, suggesting benefits to health by
being physically active (Pihl et al., 2002).
Teachers working in schools located in the poorest neighbourhoods were found to have
greater risk of developing chronic disease (1.4 times), cardiovascular disease (1.2
times), musculoskeletal (1.3 times) and mental disorders (1.5 times) than teachers
working at schools in higher socioeconomic neighbourhoods (Virtanen et al., 2007).
There was also a 2.3 times greater prevalence of teachers being a smoker or heavy user
of alcohol when working in schools from low rather than high socioeconomic
neighbourhoods (Virtanen et al., 2007).
Teachers with lower muscle function had poor physical fitness (p = 0.045), and if there
was a history of trauma, and / or chronic disease the risk of developing repetitive strain
injuries were two times greater (Chaiklieng & Suggaravetsiri, 2012). Wearing high heel
shoes (> 2 inches) (OR: 1.6; CI: 1.03 – 2.51; p = 0.037) and stretching to write on the
whiteboard (OR: 1.7; CI: 1.06 – 1.60; p = 0.028) was found to be associated with the
development of repetitive strain injuries (Chaiklieng & Suggaravetsiri, 2012).

54
In summary, the most recent research indicates that teachers’ habitual physical activity
is low and obesity rates are high, which may increase the cardiovascular risk of this
occupational group (Webber et al., 2012). Teachers are susceptible to exhaustion and
stress (Costa & Silva, 2012), and those working in schools from low socio-economical
areas may have greater heath-risk than teachers working in high socio-economic
schools (Virtanen et al., 2007).
Productivity
Many factors affect work productivity including environment, salary, workload,
absenteeism, motivation, and job satisfaction (Harvey, 1978; Milkman, 1997). Teachers
assess their productivity in terms of their ability to; encourage student learning, to relate
well with parents and students, to receive positive recognition from peers and
supervisors and to perform normal teaching tasks successfully (Brien et al., 2012).
Teachers productivity are generally scored with self-reported absenteeism in hours lost
over the school week and presenteeism using a 10-point Likert scale, which is a self-
assessed measure of job performance where 1 = worst and 10 = top performance
(Kessler et al., 2007). Canadian teachers needed to experience job satisfaction in order
to increase the quality of education they provided to students, which was dependent on
a positive state of psychological health (p < 0.001) (Brien et al., 2012). Autonomy was
not related to teachers' work performance (p = 0.42) but better psychological health
allowed teachers to concentrate on their teaching-related tasks rather than on negative
psychological states (such as depression), thereby improving their productivity at school
(Brien et al., 2012).

55
The socioeconomic status of the neighbourhood where the school is located may affect
teachers’ work performance that was related to health status, which was negatively
affected when teachers were employed in schools located in poor neighbourhoods
(Virtanen et al., 2007). A study of 200 primary school teachers in Uyo, Nigeria,
explored the relationship between absenteeism and job satisfaction (the meaningfulness
of a job) and job stress (Ejere, 2010). Teachers that were regularly absent reported low
job satisfaction (79%), perceived that their job was stressful (75%) and only 30%
thought that their work was very meaningful (Ejere, 2010). Absenteeism is indicative of
employee dissatisfaction, due mainly to poor working conditions, low job satisfaction
and few career prospects (Ejere, 2010). General well-being, job satisfaction, and self-
concept were improved during a 10-week physical activity and counselling intervention,
suggesting that physical activity can modify psychological health (Blair et al., 1984).
Preschool teachers absenteeism correlated negatively with their work and leisure-time
physical activity, whereas regular physical activity, such as a walk during or after
school is a key strategy for alleviating occupational stress (Carson et al., 2010).
In summary, a range of factors affects teachers’ productivity including personal and
professional competency, the socioeconomic status of the school neighbourhood,
absenteeism, and perceived occupational stress. Increasing teachers’ leisure-time and
workplace physical activity can improve psychological health (Blair et al., 1984; Carson
et al., 2010), which may increase teachers productivity and student learning (Brien et
al., 2012).

56
Teachers as role models
In a study of primary school student’s perceptions of a good teacher, physical
appearance and regular attendance emerged as the main characteristics of a good
teacher, followed by educational background, dedication, and acceptance of
professional responsibilities (Jules & Kutnick, 1997). All the students surveyed
expected care and kindness, similar to parental nurturing of younger children, and
security, educational support, trust and non-discrimination from the teacher (Jules &
Kutnick, 1997). Female students expected the teacher to maintain good interpersonal
relationships and use classroom-teaching strategies that facilitate student participation
(Jules & Kutnick, 1997). Male students expected that the teacher should be more
assertive and maintain control over student behaviour (Jules & Kutnick, 1997).
Teachers that were physically active, promoted physical fitness, and limited their
general instructions and management of students were more likely to have students
involved in moderate-vigorous physical activity (Martin & Kulinna, 2005), illustrating
that role modelling is important for developing student’s active behaviours. The New
Zealand school curriculum recognises that physical activity plays an important part in
children’s learning processes (Ministry of Education, 2007). Teachers in the United
States that were normal weight and physically active had more favourable attitudes
toward role modelling active behaviours to their students (p < 0.05; d = 0.59) than
overweight and obese teachers (p < 0.05; d = 0.35) (Cardinal, 2001). When teachers
assumed responsibility to increase their habitual physical activity during school-based
interventions, these teachers were more likely to discuss heart health with their students
(Cheung et al., 2008; O'Loughlin et al., 1996). Teachers recognised the value of being a
role model of physical activity for students and were in the preparation stage of the

57
Trans Theoretical Model, but few teachers were willing to adopt the active behaviour
model (Cheung et al., 2008).
In summary, teachers are generally willing to be active role models (Cardinal, 2001)
and when teachers engage in an active lifestyle and model this for students, they
provide a better learning environment.
3.4. Limitations
There were several limitations in this review including the search strategy, which may
not have identified all of the studies. In general, data were obtained from teachers
working in urban schools, which may not reflect the experiences of teachers from rural
settings. The inclusion criteria excluded studies that did not classify the workplace
physical activity of teachers.
3.5. Conclusions
Teachers that have a positive state of psychological health are able to provide quality
education for their students. Factors that influence teachers’ psychological health
include the ability to accrue sufficient workplace and leisure-time physical activity, a
comfortable teaching environment, and job satisfaction. Teachers’ productivity, job
satisfaction, habitual physical activity, weight status, metabolic and psychological
health are interdependent, and when all these variable are positive this allows teachers
to better cope with job-related stress and achieve curriculum goals. Physically active
teachers in the workplace provide a good role model for students’ physical activity,

58
which is beneficial to student learning. Future studies need to determine the hierarchy of
factors that are critical for teachers’ psychological health that are beneficial to their
productivity and thereby encourage student learning and physical activity.
3.6. Future directions
From the studies included in this review, the variability in the magnitude of teachers’
workplace physical activity and sedentary behaviour and the relationship with teachers’
productivity and health are unclear. Teachers from different countries spent different
proportions of time sitting, standing and walking in the classroom and more research is
required to understand which teaching style is beneficial to teachers’ health and student
physical activity.
The following Chapters (4-6) consist of the methods, results and discussion of three
studies that provide an in-depth analysis of the teachers’ work-related sedentary and
physical activity behaviours and the effect on teachers’ cardiovascular health and their
students’ school-based physical activity. Chapter 4 details all methodological aspects of
Studies 1-3. Chapters 5 and 6 of the thesis are devoted to reporting the results of Studies
1-3, and discussion of the findings presented as recommendations and conclusions.

59
CHAPTER 4: Methods
In this doctoral research, a mixed method approach was adopted. A mixed method
approach highlights the strengths and minimises the weaknesses of solely qualitative
and solely quantitative approaches (Johnson & Onwuegbuzie, 2004) making it an
appropriate method when studying human behaviour. Recent investigation into physical
activity and sedentary behaviour is carried out based on this multidisciplinary approach,
which groups different perspectives together and is considered optimal for
understanding aspects of human behaviour (Babakus & Thompson, 2012; Brownson,
Brennan, Evenson, & Leviton, 2012; Davey, Hurst, Smith, Grogan, & Kurth, 2011;
Poobalan, Aucott, Clarke, & Smith, 2012; Quarmby, Dagkas, & Bridge, 2011; Ribera,
McKenna, & Riddoch, 2005; Willenberg et al., 2010; Withall, Jago, & Fox, 2011). The
quantitative approach was used to collect data on teachers’ physical activity, sedentary
behaviour and health status, and analyses were conducted to determine whether there
were any effects of teachers’ physical activity and sedentary behaviour on their
students’ physical activity behaviours. The qualitative approach was used to understand
the school environment in terms of policy, plans and strategies as well as teachers’
perceptions of their physical activity and sedentary behaviour.
In compliance with the key principles from Auckland University of Technology Ethics
Committee (AUTEC), respect, confidentiality and privacy of participants’ information
were assured. The ethical approval for this study was granted by the AUTEC on
November 2, 30 2010 (Appendix 1).

60
4.1. Participants
Teachers and their students from primary schools across the Auckland Metropolitan
Area were invited to participate in the three studies of this thesis. Only public schools
were invited to participate because they utilised standard educational programmes and
followed the New Zealand National Curriculum.
4.2. Study 1: Identifying barriers and facilitators of teachers’ physical activity at
school.
Sample size
Qualitative research is not useful for making inferences from large population samples,
therefore participants were recruited according to predetermined characteristics
(Thomas et al., 2005). A non-probabilistic purposeful criterion sample (Pitney &
Parker, 2009) was used to select eight teachers and / or principals from schools across
the Auckland Metropolitan Area to participate in face to face interview. Four high
decile schools and four low decile schools were selected (Deciles classification:
Highest, deciles 6 to 10; lowest, deciles 1 to 5). The Ministry of Education in New
Zealand uses the decile classification system to allocate funding to schools. Decile 1
schools include the highest proportion of children from low socioeconomic
backgrounds. Schools in decile 10 include the highest proportion of students from high
socioeconomic backgrounds (Education Review Office, 2013).

61
The main inclusion criterion for schools was that they did not participate in health
promotion programmes, and that recruited teachers had more than three years of
teaching experience.
Recruitment
Eight teachers and six principals, from different areas of Auckland City (to ensure a
range of diversity of experiences and perspectives), were invited to be interviewed. Ten
accepted (6 and 4 respectively). Due to data saturation after eight interviews, only four
principals’ and four teachers’ interviews were considered in the final analysis, and the
recruitment process was stopped. The interview data from one of the teachers was used
as a pilot to refine the questions so data from that interview was excluded from the
analysis as was an additional interview that did not have a full transcript owing to a
recording system error.
Data collection
The candidate according to an individual arrangement with participants carried out the
interviews during the week following physical activity and sedentary behaviour
measurements. The setting for the interview was agreed with participants to protect
their privacy, to ensure that the interview was conducted in a familiar and comfortable
place and to avoid the need for the participants to travel. Generally, the interviews with
the teachers took place in the school staff room, and for the principals in their offices.
The interviews length was 20 to 60 minutes in duration, and were recorded and
transcribed for later analysis. The interviews followed a semi-structured format, with

62
key questions and complementary questions asked when necessary to clarify or glean
information that is more detailed.
Measurements and instruments
Interview questions in Appendix 5 were formulated to guide the conversation. General
questions were asked first so that the interviewee could provide details of the usual
workplace activities at school, school routines and internal organisational culture. Next,
the discussion was focused on an evaluation of the context in terms of variables of
analysis (physical activity and sedentary behaviour), and identifying barriers and
facilitators of workplace physical activity. Finally, the last questions focused on the
teachers’ suggestions of school-based facilitators of physical activity and practical
approaches to integrate additional physical activity into teachers and their students’
school routine.
Analysis
All interviews were transcribed and then analysed using a thematic analysis approach
identified by Braun and Clarke (Braun & Clarke, 2006):
First, the investigator should read and re-read the transcripts to gain familiarity
with the data, and make notes or thoughts during the reading.
Transcript data should be coded in a systematic process across the entire dataset.
Investigators are encouraged to list interesting features of the transcript text.
Investigators should allocate similar data by codes and then identify themes
from the codes.

63
From the identified themes, investigators should define and name the themes to
explore the essence of each theme.
Finally, the data set should be compiled with reference to the themes, and when
the final analysis is completed, the findings should be organised into a written
report.
To ensure rigor a systematic method was used:
A professional transcriber transcribed the voice recordings of the teachers.
To ensure that the written account was word for word correct with the voice
recording, the researcher checked the voice recordings against the written
transcripts.
Student (MC) and supervisor (EH) then coded the themes independently.
Codes were compared and any differences were discussed until an agreement
was reached.
Where there was a difference MC and EH would re-read the transcript and
decide on an appropriate code.
Once agreement was reached on the coding, codes were organised into three
themes.

64
4.3. Study 2: Teachers’ physical and sedentary activity patterns at work,
cardiovascular risk and productivity.
Sample size
Sample size was determined a-priori using daily step count as the main outcome
measure. Step count is widely reported in the physical activity literature (Bravata et al.,
2007; Chen, Acra, Donahue, Sun, & Buchowski, 2004; Mutrie et al., 2002; Okamoto et
al., 2010; Tudor-Locke & Bassett, 2004; Tudor-Locke, Williams, Reis, & Pluto, 2002;
Williams, Matthews, Rutt, Napolitano, & Marcus, 2008) and is often the dependant
variable reported in studies measuring physical activity in the workplace (Chan et al.,
2004; Dishman et al., 2009; Eves & Webb, 2006; Faghri et al., 2008; Gilson, 2008;
Levine & Miller, 2007; Miller & Brown, 2004; Puig-Ribera, McKenna, Gilson, &
Brown, 2008; Schofield et al., 2005; Shaw, Alfonso, Howat, & Corben, 2007;
Thompson, Foster, Eide, & Levine, 2008; Tudor-Locke, Burton, et al., 2009). This
study used a sample size estimation spreadsheet (Hopkins, 2006) to arrive at a sample
size for statistical significance. The smallest worthwhile difference of 1,000 pedometer
steps and a between-subject standard deviation of 1,700 pedometer steps was reported
in a previous study by Steele & Mummery (Steele & Mummery, 2003) and from the
maximum rates of statistical error (Type I: 5% and Type II: 20%), the estimated sample
size of 93 participants was determined (see Appendix 6 for details). To allow for a
dropout rate of 10% due to unforeseen circumstances, it was decided to recruit an
additional 9 subjects increasing the required sample size to 102.

65
Recruitment
To meet the sample size requirements for adequate statistical significance, teachers
from 167 schools (68%) were contacted to take part in this study (there are currently
246 primary schools in Auckland City). A stratified random selection process selected
42 schools and each was contacted by email, with only one positive reply. In order to
recruit the required sample size, Auckland was divided into four geographical regions
and school principals from each region were visited in person to explain the study in
detail.
Schools from each region were recruited into the study to form a convenient sample of
teachers shown in Table 8. Twenty-one schools agreed to participate, 54 declined and
92 never responded, despite being contacted at least three times after the initial visit.
The main reasons Principals provided for declining were high workload at school and
previous commitments, and some schools were already participating in other research
(sometimes more than one project).
Table 8: Number of schools contacted and their responses
Total Central North West South
Contacted 167 54 25 40 48
Accepted 21 12 5 2 2
Declined 54 14 10 15 15
No answer 92 28 10 23 31
After schools agreed to participate, an invitation was extended to teachers, the
principals, and deputy principals. The invitation to take part in the study was accepted
by 103 teachers from high and low decile schools shown in Table 9, whom provided
informed consent at explanatory meetings where the study details and data collection-

66
processes were described. Copies of consent and assent forms are presented in
Appendix 2.
Table 9: Number of teachers participating
Total Higher deciles Lower deciles
Teachers
Male
Female
103
12 (11.7%)
91 (88.3%)
71 (69%)
8
63
32 (31%)
4
28
Data collection
Data collection was carried out February to November 2011 during school terms, with a
scheduled time of two weeks for measurement at each school. During the first week,
teachers’ anthropometric and blood parameters were measured, and in the second week,
physical activity and sedentary behaviour were monitored. Physical activity and
sedentary behaviour were measured over 24 hours for five consecutive days during the
school week, from Monday morning (before the start of the school day) to Friday
afternoon (after the end of the school day), using two types of accelerometer (ActiCalTM
and activPALTM
). Only data collected Tuesday, Wednesday, and Thursday were
included in the analysis, to ensure that 24 hours of data were collected (excluding
logged monitor not worn time). Each participant received the devices on Monday
morning and the accelerometers were worn throughout the school week. Participants
were asked to wear the devices at all times including sleep, except when bathing or
swimming to increase compliance. Teachers completed a log sheet to record sleeping
times, school arrival and departure times, times the devices were not worn, and times
spent in unusual activities that were school or work-related (e.g., school trip, sports day)
(see Appendix 3).

67
Teachers completed two questionnaires, the Questionnaire of Habitual Physical Activity
to determine perceived habitual physical activity and the Health and Work Performance
Questionnaire to determine productivity. Copies of questionnaires are shown in
Appendix 4.
Measurements and instruments
Anthropometric measurements
Trained researchers measured anthropometric data of participants using the
International Society for the Advancement of Kinanthropometry (ISAK, 2001)
protocols.
Weight
Weight was measured in fasting conditions, barefoot, and with as little clothing as
possible, using a digital scale (Model Seca 770, Seca, Hamburg, Germany). Participants
stood on the centre of the scales without support and with the weight distributed evenly
on both feet.
Height
Height was measured using a portable stadiometer (Design No. 1013522, Surgical and
Medical Products, Seven Hills, Australia). The participant stood with feet and heels
together and the buttocks and upper part of the back touching the scale. The head was
placed in the Frankfort plane and did not touch the scale. The researcher placed his
hands far enough along the line of the jaw of the participant to ensure that upward

68
pressure was transferred through the mastoid process. The participant was instructed to
take and deep breath and hold while keeping the head in the Frankfort plane. A
measurement was taken at the end of the deep inward breath.
Waist
This girth is taken at the level of the narrowest point between the lower costal (10th rib)
border and the iliac crest. The researcher stood in front of the participant who abducted
the arms slightly to allow the tape to be passed around the abdomen. The stub of the
tape and the housing were then both held in the right hand while the researcher used the
left hand to adjust the level of the tape at the back to the adjudged level of the narrowest
point. The researcher resumed control of the stub with the left hand and using the cross-
hand technique positioned the tape in front at the target level. The participant was
instructed to lower their arms to the relaxed position. The tape was then readjusted as
necessary to ensure it had not slipped and did not excessively indent the skin. The
participant breathed normally and the measurement was taken at the end of a normal
expiration (end tidal). If there was no obvious narrowing the measurement was taken at
the mid-point between the lower costal (10th rib) border and the iliac crest.
Hip circumference
This girth was taken at the level of the greatest posterior protuberance of the buttocks,
which usually corresponded interiorly to about the level of the symphysis pubis. The
researcher passed the tape around the hips from the side. The stub of the tape and the
housing were then both held in the right hand while the researcher used the left hand to
adjust the level of the tape at the back to the adjudged level of the greatest posterior
69
protuberance of the buttocks. The researcher resumed control of the stub with the left
hand, and using the cross-hand technique, positioned the tape in front and the sides so
that the tape was held in a horizontal plane at the target level. The tape was then
readjusted as necessary to ensure it had not slipped and did not excessively indent the
skin.
Three measurements were made and recorded and the mean was used to calculate Body
Mass Index (body weight in kg divided by the height2 in cm) and Waist-to-Hip Ratio
(waist measurement divided by the hip measurement shown as a ratio).
Blood parameters
In order to determine participants’ health status, several blood parameters were
measured in fasting conditions before the start of work at school.
Blood pressure
Blood pressure was measured twice with participants sitting in a relaxed position with
the cuff on the right arm at the level of the heart. The manometer was placed above the
elbow and a stethoscope was used to find the brachial pulse. The cuff was inflated to the
peak inflation level and then deflated at rate of 2 mmHg per second. The first sound
after inflating the cuff was recorded as the systolic blood pressure and the last sound
was recorded as the diastolic blood pressure (Pickering et al., 2005). Portable mercury
ALP K2 Sphygmomanometer (Japan) was used for the measurement.

70
Blood glucose
The glucose level was assessed using the Accu-Check Performa (Roche Diagnostic
GmbH, Germany). Using a lancing device to pierce the skin of the index finger, a
hanging drop of blood was obtained from the participants’ finger to apply immediately
test strip inserted in the meter. The result appeared on the screen after a few seconds.
According to Karon (Karon et al., 2007), the Accu- Chek has very good validity (r =
0.92).
Total cholesterol
The Accutrend Plus (Roche Diagnostic GmbH, Germany) was used to assess the total
cholesterol. The blood sample for analysis was obtained using the same method as
described for the blood glucose assessment. The result appeared on the meter screen
after 180 seconds. According to Moses (Moses, Calvert, & Storlien, 1996), the
Accutrend PlusTM
has a very good validity (r = 0.935).
Triglycerides
Triglycerides concentration in the blood stream was assessed by the Accutrend Plus
(Roche Diagnostic GmbH, Germany), using the same procedure described above. The
result appeared on the screen after 120 seconds. The Accutrend PlusTM
validity (r =
0.972) was reported by Luley (Luley et al., 2000).

71
Cardiovascular risk
Cardiovascular risk (CVR) was assessed by the Framingham formula (Anderson, Odell,
Wilson, & Kannel, 1991) and the adjustments as suggested by the Joint British
Societies’ paper (Society et al., 2005) and the Cardiovascular Risk Assessor, from blood
pressure measurement, glucose level, total cholesterol and triglycerides concentration in
the blood stream. HDL-cholesterol was not measured and the standard value of 1.0
mmol/L was inserted to the equation.
Physical activity and sedentary behaviour measurement
Accelerometry
The time spent in sedentary, light, moderate and vigorous activities was measured by
ActiCalTM
accelerometer (Mini-Mitter, Sunriver, OR). The ActiCalTM
was attached to
participants’ waists with an elastic band, and teachers were asked to wear them 24 hours
per day. Energy expenditure was estimated for teachers only.
ActiCalTM
accelerometers are electronic devices that measure accelerations produced by
body movement. They use piezoelectric transducers and microprocessors that convert
recorded accelerations to a quantifiable digital signal referred to as ‘counts’ (Sirard &
Pate, 2001). The reported validity for ActiCalTM
accelerometer is high (r = 0.73)
(Esliger et al., 2007).
Actical accelerometer data were exported from the manufacturer spreadsheets using 15
second epochs, which define activity into sedentary, light, moderate and vigorous

72
intensities using regression equations from a calibration study performed by Heil (Heil,
2006).
Accelerometers were delivered on Monday morning before school and picked
up on Friday after school was finished.
Participants were instructed to wear the monitors at all times including sleep but
to remove the devices when bathing or swimming.
Logs were kept of times the monitor was removed for bathing or swimming and
the accuracy of the logs was checked against the accelerometer data.
The average time the accelerometer was removed for bathing was 20 minutes.
A valid day was 24 hours of data collected less any logged times when the
accelerometer was removed to be sure of the actual time spent in sedentary
activity.
Participants had to have 3 days of continuous data to be included in the study.
Only 4 teachers and 11 students data were removed from the study for non-
compliance or because the non-wear time logs and accelerometer data were not
matched.
The compliance rate for teachers was 96% and 92% for students.
A day was analysed as waking hours only and time spent in moderate to
vigorous activity was minutes per day. Hours per day was used in the tables so
that the same unit of time was used for sedentary and other activity intensities.

73
The time spent in sitting/lying and standing positions, was measured by activPALTM
accelerometer (PAL Technologies Ltd, Glasgow, UK), worn on the front of the thigh
attached with a hypoallergenic strap. The number of transitions from sitting to standing
and vice versa, the steps count and time spent stepping were recorded by the
activPALTM
. The activPALTM
professional is a small electronic device designed to
quantify free-living daily activities. The device contains a microprocessor, sensing
element, recording element, associated electronics and power supply. The
microprocessor controls the processing and recording of the sensor signal and the
communication with a host PC. The activPALTM
is highly correlated (r = 0.99) with
direct observation (video recording) in children (Aminian & Hinckson, 2012), and in
adults (r= 0.99) (Ryan, Grant, Tigbe, & Granat, 2006).
For the activPALTM
was used the same procedure, the sedentary cut-point was 100
counts and steps, sitting time and transitions from sitting to standing data in were used
into the analysis
Questionnaire
There are several methods to assess habitual physical activity using standardised
questionnaires in different contexts (Paffenbarger, Blair, Lee, & Hyde, 1993). In the
present thesis, teachers’ habitual physical activity was determined using the QHPA
(Questionnaire of Habitual Physical Activity) or Baecke questionnaire (Baecke,
Burema, & Frijters, 1982). The QHPA in paper form was given to the participants at the
same time as the steps and collected back at the end of the physical activity and
sedentary behaviour measurement week.

74
This questionnaire considers in total 16 questions (see Appendix 4), eight for
occupational physical activity, four related to sport leisure activities, and four related to
non-sport leisure activities and locomotion. The total score is obtained by adding the
individual score of each dimension (work + sport + leisure). Once the total score is
obtained, it is classified into three categories: low, moderate, and high index (Table 10).
Baecke et al. (Baecke et al., 1982) reported a high level of test-retest reliability (0.80
work index, 0.90 sport index, 0.74 leisure-time index).
Table 10: QHPA Score Index
Score Index Low Moderate High
Work activity 1.5 – 2.4 2.5 – 3.4 3.5 – 4.5
Sport activity 0.8 – 2.3 2.4 – 3.7 3.8 – 5.0
Leisure time activity 0.3 – 1.8 1.9 – 3.4 3.5 – 5.0
Total 2.5 – 6.5 6.6 – 10.5 10.6 – 14.5
Productivity measurement
The Health and Work Performance Questionnaire (HPQ) (Kessler et al., 2003) was used
in this study to determine the teachers’ work performance. Traditionally, three
outcomes are studied regarding work productivity: absenteeism, work performance, and
job-related accidents. The HPQ questionnaire was designed to determine the work
productivity in a wide number of jobs assessing these three aspects (Kessler et al.,
2003).
75
The Health and Work Performance Questionnaire is a short self-report instrument
(which takes no more than 15 minutes to complete) that filters the occurrence of the
most common health problems and their treatment. The Health and Work Performance
Questionnaire is capable of gathering a large amount of data and seems an appropriate
tool to use in a work health and productivity survey.
Absenteeism
In the Health and Work Performance Questionnaire, absenteeism is assessed
according to the number of hours missed on sickness absence days, the number
of hours missed on workdays, extra hours of work, differentiating between
sickness absence and other types of absences. To quantify the absolute
absenteeism, actual worked hours in the past seven days were subtracted from
the expected worked hours by the employer in the same period. Relative
absenteeism was calculated by dividing the absolute absenteeism score by the
expected hours of work (Kessler et al., 2007)
Presenteeism
The Health and Work Performance Questionnaire assesses work performance
(or presenteeism) using a simple self-report global rating scale, and the
participants are asked to rate their work performance from 0 to 10, where 0 is
considered as the worst performance and 10 the best. Before the participants rate
their work performance, a series of four questions are asked in order to get an
understanding of critical aspects. These questions focus on the quantity of work,
quality of work, interpersonal aspects of work, special work successes, special

76
work failures and accidents-injuries. A second set of five questions is focused on
determining the participants’ work performance, based on a separate rating of
their own usual performance, and comparing their own performance with other
workers in the same job. To measure absolute work performance, participants
reported their own performance over the past seven days, as described above,
which was converted into percentages. Relative work performance was
calculated dividing the actual performance by the performance of most workers
in the same position, ranging from 0.25 to 2.00 (Kessler et al., 2007).
Job-related accidents
Job-related accidents in the Health and Work Performance Questionnaire were
assessed by a single open-ended question. This question sought information
about incidents that led to breakage or other loss of property, delays in
production or other decreases in work performance, physical injury, and serious
risk of loss, delay, or injury. After that, the information is contrasted with the
company to obtain the monetary cost of the accident.
Originally, the Health and Work Performance Questionnaire was designed to estimate
the cost of health problems at the workplace in terms of reduction in work performance,
absenteeism due to illness and work related injuries. The clinical version has questions
relating to the past seven days in these three aspects. It is a short instrument, which
takes no more than 10 minutes to complete.

77
Absenteeism was measured as hours missing from work, focusing on total hours missed
for all causes (sickness, holidays, other) not just illness. Information about the incidents
of absenteeism was collected by open questions that report the number and nature of
these incidents. The Health and Work Performance Questionnaire presents a significant
association (r= 0.61 to 0.87) of work hours assessments with payroll records (Kessler et
al., 2003), and work performance assessments with supervisor rating (r= 0.52) (Kessler
et al., 2003).
Only were analysed data for the absenteeism and presenteeism questions, we should
have removed the additional questions as Kessler suggested in 2007 (Kessler et al.,
2007).
Benchmarks
To determine the nutritional status (BMI) of the participants the WHO classification
was used (Daniel, Marion, Sheps, Hertzman, & Gamble, 1999).

78
Table 11: The international classification of adult underweight, overweight and obesity according to
BMI
Classification BMI(kg/m2)
Principal cut-off points Additional cut-off points
Underweight <18.50 <18.50
Severethinness <16.00 <16.00
Moderatethinness 16.00 - 16.99 16.00 - 16.99
Mildthinness 17.00 - 18.49 17.00 - 18.49
Normal range 18.50 - 24.99 18.50 - 22.99
23.00 - 24.99
Overweight ≥25.00 ≥25.00
Pre-obese 25.00 - 29.99 25.00 - 27.49
27.50 - 29.99
Obese ≥30.00 ≥30.00
Obese class I 30.00 - 34.99 30.00 - 32.49
32.50 - 34.99
Obese class II 35.00 - 39.99 35.00 - 37.49
37.50 - 39.99
Obese class III ≥40.00 ≥40.00
Source: Adapted from WHO, 1995, WHO, 2000 and WHO 2004.
Cardiovascular risk was assessed using the Health Canada Waist-to-Hip Ratio (WHR),
the Health Canada classification was used (Daniel et al., 1999).
Table 12: Aged and sex-specific cut-off points for classification of high compared with low waist-to-hip
ratios
Waist-to-hip ratio
Age (y) Men Women
18–34 0.89 0.79
35–49 0.95 0.82
50–64 0.98 0.84
≥65 0.99 0.86
Based on age- and sex-specific norms from the Canada Fitness Survey.
The American Heart Association (AHA) categorisation was used as the reference for
blood pressure (National Heart, 2002).

79
Table 13: Blood pressure categories defined by the AHA
Blood pressure category Systolic
mm Hg (upper #)
Diastolic
mm Hg (lower #)
Normal Less than 120 and Less than 80
Pre hypertension 120 – 139 or 80 – 89
High blood pressure
(Hypertension) Stage 1 140 – 159 or 90 – 99
High Blood Pressure
(Hypertension) Stage 2 160orhigher or 100orhigher
Hypertensive crisis
(Emergency care needed) Higher than 180 or Higher than 110
For blood pressure cut point, the National Heart, Lung and Blood Institute (US) was
used (Chobanian et al., 2003).
Table 14: Classification of blood pressure for adults (NHLBI, USA)
Blood pressure Systolic Diastolic
Classification mmHg mmHg
Normal <120 and <80
Pre hypertension 120–139 or 80–89
Stage 1 Hypertension 140–159 or 90–99
Stage 2 Hypertension ≥160 or ≥100
Total cholesterol and triglycerides cut point were based on the Third Report of the
National Cholesterol Education Program (NCEP) Expert Panel (National Heart, 2002).
Table 15: Classification of serum triglycerides and total cholesterol
Triglycerides
mmol/L
Total cholesterol
mmol/L
Acceptable/optimal 0.45 - 1.69 < 5.17
Borderline high 1.69 - 2.26 5.18 - 6.18
High 2.26 - 5.65 ≥ 6.19
Very high ≥ 5.65 *
Adapted from the NCEP Expert Panel (2002)
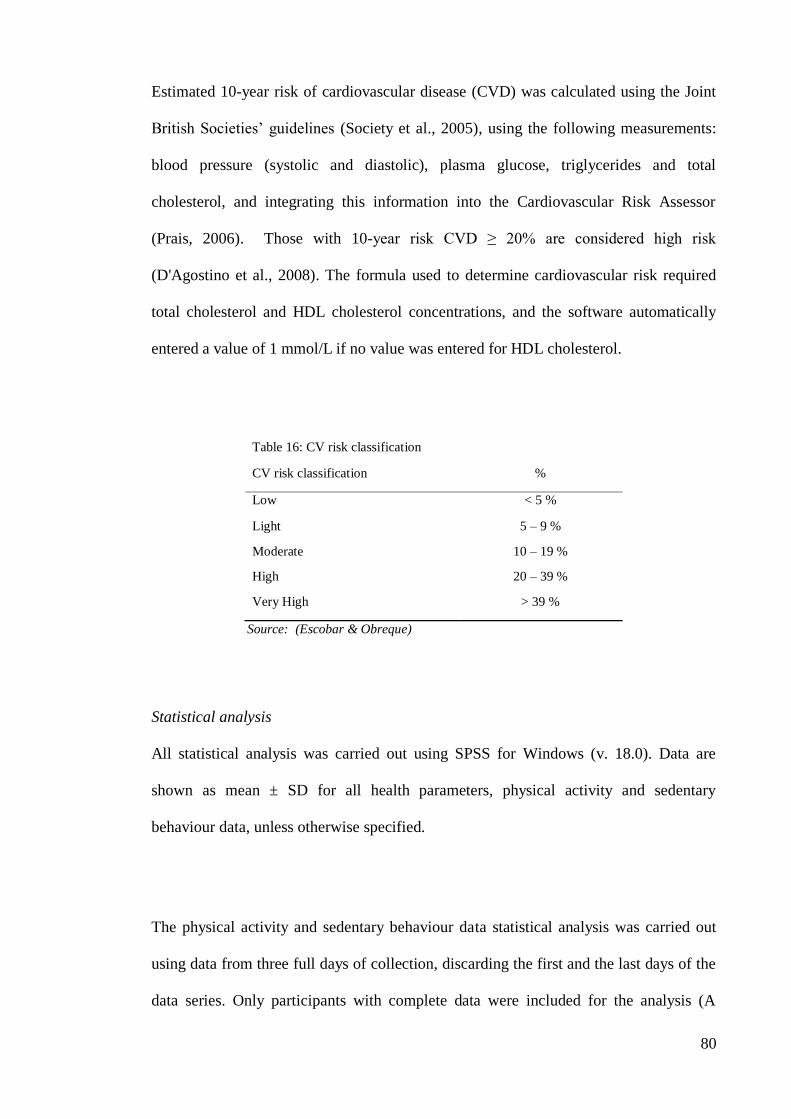
80
Estimated 10-year risk of cardiovascular disease (CVD) was calculated using the Joint
British Societies’ guidelines (Society et al., 2005), using the following measurements:
blood pressure (systolic and diastolic), plasma glucose, triglycerides and total
cholesterol, and integrating this information into the Cardiovascular Risk Assessor
(Prais, 2006). Those with 10-year risk CVD ≥ 20% are considered high risk
(D'Agostino et al., 2008). The formula used to determine cardiovascular risk required
total cholesterol and HDL cholesterol concentrations, and the software automatically
entered a value of 1 mmol/L if no value was entered for HDL cholesterol.
Table 16: CV risk classification
CV risk classification %
Low < 5 %
Light 5 – 9 %
Moderate 10 – 19 %
High 20 – 39 %
Very High > 39 %
Source: (Escobar & Obreque)
Statistical analysis
All statistical analysis was carried out using SPSS for Windows (v. 18.0). Data are
shown as mean ± SD for all health parameters, physical activity and sedentary
behaviour data, unless otherwise specified.
The physical activity and sedentary behaviour data statistical analysis was carried out
using data from three full days of collection, discarding the first and the last days of the
data series. Only participants with complete data were included for the analysis (A

81
maximum of one hour of missing data was acceptable). Include criteria to determine
valid day of data, and why bouts were not considered.
Student t-test was carried out to determine differences on the means when quantitative
variables were compared, with α=0.05 and 95% of CI.
To calculate the effect size of each correlation and to determine the clinical
interpretation of the data, the Hopkins’ “combining means and other t-distributed or
normally distributed statistics” spreadsheet was used (Hopkins, Marshall, Batterham, &
Hanin, 2009).
The odds ratio was calculated to determine the risk level of exposure to physical activity
and sedentary behaviour on teachers’ cardiovascular risk factors. The median of each
variable was used as the threshold to calculate the odds ratio. The odds are the ratio of
the probability that the event of interest occurs to the probability that it does not (Bland,
2000).
4.4. Study 3: Comparison of teachers’ and their students’ physical and sedentary
activity patterns.
Sample size
Considering a classroom as a unit with a roll average of 20 children, 10% of the class
rolls, two children per class from year 1 to year 6, were asked to participate. The

82
children were from the classes of the teachers participating in Study 2. The minimum
sample size of 123 children was based on detecting a statistically significant correlation
of 0.25 between sedentary behaviours (sitting time) of teachers and children, with a
power of 0.80 at significance level of p= 0.05 (Hopkins et al., 2009). Assuming a 15%
drop out (children are more variable than adults, thus it was expected that the dropout
rate would be higher) 140 children were selected to ensure 123 participants remained in
the study.
Recruitment
At the meeting with teachers in Study 2, one to four children from their classes were
asked to participate in the research. The inclusion criteria for children was that they
were responsible enough, as assessed by the teacher, to ensure that they could complete
the requirements of the study. Teachers were asked to select only children who attended
school regularly. An information sheet and consent and assent forms were then sent to
parents to consider and sign and return if they were interested in their children being
part of the study. The first four children to return signed consent and assent forms were
selected to take part in the study. In total, 131 children participated in the research.
Copies of consent and assent forms are presented in Appendix 2.
Table 17: Number of children participating
Total Highest deciles Lowest deciles
Children
Male
Female
131
61 (46.6%)
70 (53.4%)
84 (64%)
41
43
47 (36%)
20
27

83
Data collection
Children’s data were collected at the same time as the teachers’ data in Study 2, during
the 2011 school year.
Physical activity and sedentary behaviour were measured over five consecutive days
during the whole day, from Monday morning (from start of the school day) to Friday
afternoon (at end of the school day). Only data collected in the middle days (Tuesday,
Wednesday and Thursday) were considered in the analysis to ensure that complete days
of data were collected.
Each child received the accelerometers on Monday morning and wore them throughout
the school week, 24 hours per day. Participants were also asked to complete a log sheet
which recorded all related relevant information, such as the time and activity performed
when they were not wearing the devices, time spent in unusual activities, wake up time
and bed time, and time spent in after school activities (see Appendix 3).
Measurements and instruments
Physical activity and sedentary behaviour were measured using two different
accelerometers, ActiCalTM
and activPALTM
(see Study 2).

84
Statistical analysis
Descriptive statistics were used preliminarily. Mean, standard deviation, median and
percentage were calculated in order to characterise the participants’ physical activity
and sedentary behaviour. In a sample of 63 paired data the Pearson’s correlation test
was conducted to make a comparison between sedentary behaviour and physical
activity of teachers and children. The Student t-test was carried out to determine if there
were any differences in the mean of teachers’ and children’s behaviours.
85
CHAPTER 5: Results
Brief description of New Zealand public schools
The “Health and physical education curriculum in New Zealand” provides guidelines to
develop children’s skills for use in play, games, formal exercise, dance, sport and daily
life. Schools are equipped with basketball and netball hoops, tennis, volleyball and
badminton nets on play courts for teaching physical education modules. There are large
grass playgrounds at each school for athletics, cricket, baseball, rugby, soccer and hockey
that are used for seasonal sport programs. Most schools have playground equipment,
indoor gymnasiums, asphalt courts and covered outdoor play areas.
New Zealand schools provide three 30 min physical education classes per week, Jump-
jam dancing classes also occur once or twice a week comprising of aerobics for 10-15
min, and 20 min morning play and 60 min lunch breaks.
5.1. Teachers’ physical activity and sedentary behaviour at work
In this section qualitative data on teachers’ physical activity and sedentary behaviours at
work, including the identification of barriers, facilitators, patterns of activity and
inactivity, and practical solutions to increasing physical activity and reducing sedentary
behaviour are reported.
School culture and physical and social environments were also considered to better
understand teachers’ perspectives. School culture, defined as a set of values, beliefs,
86
customs, rituals, symbols and language shared by a group of people (Hargreaves, 1995),
is an element that determines the actions within the organisation. It is important to
explore these aspects in order to better understand the behaviour and practices of
teachers at the school environment. In addition, the physical environment (buildings,
neighbourhood, and space) impacts on the person's behaviour, and may facilitate or
limit the opportunities to be active. Three themes emerged from the teachers’
interviews:
1. school is an active workplace,
2. teaching style and role modelling are linked to physical activity at
school, and
3. different priorities, classroom space and job demands are common
barriers to being active at school.
Theme 1: School is an active workplace
Teachers recognised that there were numerous opportunities to be active while working.
The job demands, particularly, often required a physical involvement by the teachers.
Being part of children’s activities was recognised as a good opportunity to move as well
as develop a sense of closeness with the children. Sharing learning responsibilities
generates a feeling of acceptance, trust, belonging and commitment. The school
environment (generally a large space) and personal aspects (awareness of the benefits of
being active) were also key factors to increasing physical activity while working.
Job demands and work-related activities provided an opportunity for teachers to be
active while working. Many activities were integrated in the formal curriculum, and

87
other extracurricular activities, such as clubs and sports, offered a great opportunity to
engage in physical activity. The physical activity school programmes, or physical
education classes, provided further opportunities for teachers to move, as did duty
responsibilities at break times where teachers reported walking for the duration:
“Yeah, well our programmes are set up to umm…. for the classes to be active
because of the way we have aerobics or fitness in the morning and we have a
sports programme, we have lunch time sports. We have a special physical
education session in the afternoon so in terms of the children there is plenty of
ways for them to move around a bit and the teachers are with them doing that so
yeah…”
“...when you are on duty at lunch time, that’s the chance for you to walk for 25
minutes because you should be walking all the time...”
Ideas from teachers in relation to being more active at work included a walk at
lunchtime, “the walking club”, or taking a sports group, and ensuring that in each block
of class time some sort of physical activity was performed to get everyone moving. In
terms of personal commitment, teachers reported that “to force themselves to go and do
something and move”, could get them moving.
Teachers’ work demands
Primary school teaching is a highly demanding occupation, both physically and
mentally, though this can vary depending on teaching style, job demands and

88
expectations. Interestingly teachers perceived that they move more today than they did
in the past, primarily because current teaching practices require them to be increasingly
involved physically while teaching. However, there was variability in the responses
with respect to how physically demanding nature of primary teaching. Some of the
teachers interviewed viewed teaching as less physically demanding:
“Umm…teaching…...physically, teaching is not a tiring, I don’t think teaching is
a tiring job but it is mentally tiring and stressful so at the end of the day, you feel
physically tired, … , I think physical activity is greater than an office job
because very rarely will a teacher be sitting the whole day. Up down, moving
around but it is not, I would say it is mid range for a job”
“I guess we don't have that hard level of physical activity, but we must move a
fair bit ... I think people move around inside the classroom a lot more than what
people think we do, you're constantly up and down, and moving around, but
you're not doing any heavy lifting, you're not moving for great distances at a
time, you're just going from one part of the room to the other pretty much“
Teachers are constantly moving as part of the teaching requirements, especially in the
junior school, where teachers must be close to the children to ensure that they are safe
and to show them what to do. Unlike senior school teachers to stay in one place is much
more difficult for junior school teachers, because small children move around a lot more
and teachers have to move with them.

89
“...every teacher is required to teach the children swimming, and I would say,
the teachers' participation in that is limited, because they're not in the water, but
they still have to move around the pool and things...
But they [children] do have swimming with their class teacher, and athletics
with their class teacher, and fitness with their class teacher, so the class teacher
is still providing some PE [Physical Education], but they don't provide the
specialist PE”
“... according to the levels, I think as you go further up the school, teachers are
able to sit more, but with the younger children you're sort of dealing with lots of
issues that come up and you're sort of fighting fires and helping children and
rushing over there, so to me that makes quite the difference, the level you
teach.”
Class organisation provides a good opportunity for teachers to be active. While
generally, the first part of the morning block class is devoted to sitting and explaining
activities, in the second part teachers are moving around the classroom assisting the
children.
“you’re in your classroom teaching so you’ll probably spend the first portion of
the morning sitting because you’re explaining what the children are doing so
…and then the 2nd
part of that morning block , you’ll probably be moving
around the classroom helping and assisting the children.”

90
In order to ensure better learning, most of the more difficult subjects, such as
mathematics, English and sciences, are taught in the morning leaving the later part of
the day for subjects that are less mentally demanding, but involve more physical
activity:
“... the last block is more of a movement thing in the afternoon, that last hour of
school is … umm …we would do singing or dancing or sport on a Wednesday so
it’s more of a movement session…”
Teachers provide children with learning tasks and opportunities for all subjects,
including physical education and scheduled physical activities such as morning fitness
sessions. It is the responsibility of each classroom teacher to provide opportunities for
children to be involved in movement.
“...junior school children have fitness in the morning, which is about... can be
about 10 to 15 minutes a day and the teachers are participating in that as
well...”
“…with the aerobics, well definitely the aerobics, in the junior schools the
teachers lead it and they do it.”
Lunchtime activities also allow teachers to be active. Coaching sports or leading a club
requires teachers to move. Duty hours are another important opportunity for teachers to
move. Teachers commonly are asked to do complete school ground duties three to four

91
times a week for a half hour, during each they supervise children at lunchtime and other
breaks. This necessarily involves walking and standing.
“...when you are on duty at lunch time, that’s the chance for you to walk for 25
minutes because you should be walking all the time”.
“So when you have a duty, you’re just walking around the playground the
whole time.”
“...they have duties so actually if they are on duties, they are walking around
anyway.”
Physical school environment
The school environment per se further opportunities for teachers to be active. The
physical dimensions of schools favour displacement, for example walking between the
classroom and other school facilities (staff room, office, sport field).
“I think there was no physical features of our school, of the environment that
stops teachers from being active”
“Ummm I think more so because the classes are out of their rooms a lot so if
you’re in the classroom as a teacher, you’re taking the children out to PE or to
library sessions or to ICT so you’re moving between rooms a lot and then you’ve
got the morning tea break and then little…there is another short little break for

92
kids to get up and run around and so I think..yeah there is plenty of opportunity
to move around”
Personal options
Physical activity and its benefits are recognised as an important aspect of the children’s
growth and development. Children are encouraged to participate in sport clubs, have
active breaks, and be conscious about the physical activity benefits and strategies that
can increase physical activity. Teachers recognise that being active themselves can
influence the children’s behaviour.
“Depends…depends on how you approach it…I will I…..personally…I mean this
class, we do, we do pretty much PE , we do a lot of…so I…I…say, on …it will be
on average…average…average…yeah”
“Because it’s really important for our kids…yeah especially when they’re
working. Have a bit of break…...a bit of physical break and then come back and
work again. So it is highly encouraged and …but not everyone is a 100% buying
in.”
“Umm…I think it depends on the style of teaching that a teacher does.
Umm…some children…some teachers might engage more times with the
children at their point of learning and that involves moving around the
classroom.”

93
Theme 2: Teaching style and role modelling are linked to physical activity at school
Teaching style
Teaching style certainly determines the level of movement of teachers. For example,
older styles of teaching are often associated with a rather sedentary outlook (teachers
teaching from behind the desk), whereas most modern day teaching styles require an
intellectual, physical and emotional commitment by the teachers.
“We here are not encouraged to sit in the chair all day because that is not
teaching... there is a couple who probably I would say sit at their table for
longer than they need to sit at a table… its the old style. That is the old way of
teaching”
“I think the way that teaching is now, you do more interaction with the children
where, especially with the little ones… well now with all the children while you
are walking around the room constantly”
Teachers who become aware of the benefits of physical activity and who incorporate
physical activity into their teaching routine, give children more opportunities to be
active.
“Because it’s really important for our kids…yeah especially when they’re
working. Have a bit of break…...a bit of physical break and then come back and
94
work again. So it is highly encouraged and …but not everyone is a 100% buying
in.”
Regarding personal commitment, some teachers teach by sitting down and children
come to them, usually at senior school where an instruction is given and the students act
on it. Having sedentary breaks appears as a practicing behaviour for teachers when they
are not on duty.
“If we're not on duty we are in the staff room drinking coffee and talking, and
then at lunch time we supervise the children’s eating time and then we, well,
may be going to the staff room and prepare lunch. I usually work through my
lunch time, I go back to my room and work normally, ... if you're not up on duty,
you can escape. Sounds terrible!! You can have a break, if you just close your
classroom door or sit in the staff room”
Teaching style is determined by personal preferences, priorities, self-confidence level
and gender. Sometimes teachers feel that they do not have the confidence to teach
physical education because they do not have any specific training. When workload
increases, the first thing most teachers would do is drop physical activity, particularly if
they are busy or worried about children’s academic performance.
“I think for a lot of teachers, female teachers especially, it is sad to say, they
don't often enjoy going out to take PE, and I think, as a teacher, you need to

95
have a lot of energy to take... to teach PE with young children, … for a lot of
teachers they all just think: “No, I can't face PE today”.
Role modelling
As teaching is a giving profession, personal commitment is all important. Teachers
recognise themselves as role models who play an integral part in teaching children and
shaping their knowledge and understanding on an active lifestyle. Engaging children in
different activities, motivating them and reinforcing the benefits of physical activity, are
part of the teacher’s role. Teachers are aware that they themselves must move to
motivate children to move.
“Well we do jump jam and we do it with the children because if the children see
us doing it then they want to do it... I think…you know the thing is that you need
to be able to do it with the children because…I mean you’re role modelling to
them that it is not scary because a lot of them found it really overwhelming so if
you’re prepared to do it with the children then it’s not so hard for them”
At early ages, children learn more by imitation, especially from teachers, coaches or
older peers, so role modelling at this stage is a vital tool to stimulate student learning.
Teachers understand that having an active and healthy lifestyle can result in a feeling of
happiness and life balance, which is reflected in their everyday activities and which can
then influence children’s behaviours and learning.

96
“So we’re involved in that and with where I teach , we always start with a song
in the mornings, you know a movement song and in the afternoons we do that
again so for me, in the classroom actually do , we do more movement then
sitting down. It’s probably half and half but the movement side is really
important and I do that with all the children”
“...because we have to stand up the front model at a level, so I think we are
talking more about getting children moving and not having them sit on the mat
for very long...”
“Ummm…..so it’s better that teachers have a really well rounded balanced life
and part of that is being healthy and exercising”
Theme 3: Different priorities, classroom space and job demands are common barriers
to being active at school
The teachers interviewed recognised some aspects of their teaching roles that make it
difficult to be active at work, such as school policies on physical activity, curriculum
obligations, weather, technology, teaching style, and the built environment.
Barriers of physical activity at work
The barriers of physical activity at work that were reported by the teachers studied can
be summarised into three categories: personal, environment, and job demands. In
isolation, these barriers can be addressed, but where there is a combination of barriers,

97
the task is more difficult. The teachers studied identified lack of interest, priorities and
laziness as personal barriers to partaking in physical activity at work:
“most of the teachers would say that if their day is busy, the first thing they
would drop off would be the PA [Physical Activity] because is ... to be more
important that they have their reading or their math or their writing”
“Time (laughs). Having to do everything is really hard…yeah very hard. You’ve
got to cover so many things that …that…and generally, physical activity is the
first thing a teacher would drop”
“My normal hours are about 7.30 until... probably the earliest I leave is five, but
then I go home and I do more work at home, a lot of computer work in the
evenings and also at the weekends. I think a lot of teachers would do a few hours
at the weekend as well”
“...we have meetings twice a week so I am here till 4.30 twice a week . And in
that…so the day we have meetings, you will be sitting the whole time
…generally.”
A confined and cluttered classroom appears to be a barrier to teachers and their children
engaging in movement. A spacious classroom would allow teachers to be more creative,
move around more freely and encourage the children to move more. Cumbersome
furniture is not conducive to this:
98
“I suppose the chairs…I mean you look at the size of the chairs….there is not
much room to be free. I mean if I was going to do dance or drama or I wanted
“oh, lets all get up and lets do something”…you’ve got to move the furniture out
of the way to create the space. …..the furniture is restricting but what can you
do at the moment. There is not a lot you can do”
Work demands, including contact teaching time, lesson preparation, marking, and
lesson improvements, consume the majority of teachers’ time. And technology, which is
a tool designed to assist teachers in new work functions, has exacerbated, rather than
alleviated, the barriers to teachers becoming more active. The new school curriculum
demands and national standard quota meant that teachers need more time to prepare and
feel the pressure to perform well in their tasks.
“I think technology doesn't help obviously, with computers, ... , probably I save
myself time by having the printer there, and I think, probably who saves
ourselves time, obviously using technology, but this means we're moving less”
“I think the only difficulty we have is an overcrowded curriculum, teachers are
busy, teachers are stressed”
Teachers spend additional time sedentary before and after teaching time and even in the
weekends when they are involved with meetings and preparation for class.

99
“...the hour between you would arrive and you would start school, you would
“flatting” on your computer or you would be organizing things in your
classroom...we have meetings twice a week so I am here till 4.30 twice a week .
And in that… so the day we have meetings, you will be sitting the whole time …
generally”
Some class activities and the teaching of some subjects are performed while seated, for
example explaining tasks to individual children.
“...you’re in your classroom teaching so you’ll probably spend the first portion
of the morning sitting because you’re explaining what the children are doing so
… and then the 2nd
part of that morning block , you’ll probably be moving
around the classroom helping and assisting the children”
The requirements of the national standards affect teachers’ active behaviour too; the
increase in workload, due to assessment procedures and reporting, means teachers have
less time to be active:
“I think things that are national standards have caused a lot of professional
development that caused us to change a lot of systems in the school, a lot of
assessment procedures, a lot of reporting for parents procedures, and all of
those things have meant having meetings, and having discussions, drafting
reports and getting them approved by staff, and changing them again, and
100
getting them approved by parents, and changing them again. It's all just this
cycle of change”
Teachers’ commitment to providing high levels of education so children learn and
achieve to the expected level for each year is extremely demanding in terms of time.
Add to this high class numbers and the demands are greater. To meet the demands and
it this continual need to change and adapt, teachers adopt various strategies:
“I think it's the high... we place a lot of the work on ourselves to be honest. ...
Teaching has got a huge amount of change. Nothing ever stays the same in
teaching and it's because of that it's extremely stressful stuff.”
In summary, teachers identified eleven ways that they could be physically active during
school hours. Some were very obvious like joining in jump-jam and physical education
classes, providing playground supervision for students, and being active with children at
lunch time.
Teachers also identified facilitators that they would like to use like changing classroom
layout, allowing children to be active during class lessons, changing their teaching style
to encourage physical activity and having a personal commitment to role model active
behaviours.

101
Teachers also identified 16 practical ways to increase their activity and students’
activity including sports clubs, coaching, and active breaks during class lessons, using
active breaks as a reward for good student behaviour, and involving parents by
providing physical activity as homework for parents and their children.

102
5.2. Teachers’ workplace physical activity, sedentary behaviour patterns and
cardiovascular risk profile
The first part of this section reports on teachers’ workplace physical activity and
sedentary behaviour patterns, teachers’ occupational wellness, physiological aspects of
sedentary behaviour, the school environment and job requirements. Here the
relationships between the physical activity level and sedentary behaviours of teachers
while at work are described. Also the trends of active and sedentary behaviours while at
work are shown. The second part reports on the teachers’ cardiovascular risk profile,
showing how physical activity may be protective and sedentary behaviours may be
harmful regarding cardiovascular diseases. Teachers’ demographic, anthropometric,
physical activity, sedentary behaviour and blood data are shown in Table 18.
Teachers’ physical activity and sedentary behaviour levels
Teachers’ physical activity level (Table 18), categorised according to intensity, showed
that teachers spent more time in moderate to vigorous physical activity (MVPA), at
work (18%) than out-of-work (11%). A similar trend was observed for light activity
time. The difference between the time at-work and the time out-of-work was also
significant (p<0.0001).
Teachers were more active at-work than out-of-work (p<0.001), performing more steps
(609 steps/h at-work, 546 steps/h out-of-work) and expending more energy (44.4
kcal/hour at-work, 31.1 kcal/h out-of-work) (Table 18). On average, interruptions in
sitting time were significantly higher (p<0.0001) during work-time (42 times/day) than
out-of-work (24 times/day).

103
In our sample of teachers, 100% met the physical activity recommendation of greater
than 150 min of moderate to vigorous activity per week. The 150 min was achieved in
three working days. The moderate intensity activity was not calculated in 10 min bouts.
Table 18: Teachers’ demographics, anthropometrics, physical activity and sedentary behaviours and
blood parameters.
Male (n = 12) Female (n=91) Total (n = 103)
Variable Mean SD Min-Max Mean SD Min-Max Mean SD Min-Max
Age (years) 41.8 9.6 26 - 61 42.6 12.2 22 – 63 42.5 11.9 22 - 63
Years Working 11.8 9.1 1 - 29 13.1 10.3 1 - 40 12.9 10.1 1 - 40
Anthropometric
Weight (kg)
Height (cm)
BMI (kg/m2)
Waist (cm)
Hip (cm)
WHR
84.8
1.78
26.6
88.0
102.9
0.85
14.4
0.06
4.4
11.8
6.6
0.06
60-110
1.71-1.89
20.3–35.3
70-110
91-113
0.75-0.97
69.8
1.66
25.4
77.7
102.6
0.76
14.6
0.07
5.4
12.6
11.0
0.07
48-115
1.53-1.82
19.1-44.4
55-122
85-138
0.54-0.98
71.5
1.67
25.6
78.9
102.7
0.77
15.3
0.08
5.3
12.9
10.5
0.07
48-115
1.53-1.89
19.1-44.4
55-122
85-138
0.54–0.98
Physical activity and sedentary
behaviours
At-work Out-of-work Total
Mean SD Median Mean SD Median Mean SD Median p value
Awake time (h/d)
Sitting time** (h/d)
Standing time** (h/d)
Sedentary time*(h/d)
9.22
5.05
3.97
5.40
0.96
1.43
1.10
1.23
9.22
5.19
3.99
5.22
6.78
3.89
2.46
4.61
1.42
1.30
1.07
1.29
6.79
3.87
2.50
4.69
16.00
8.94
6.43
10.01
0.79
1.76
1.63
1.49
16.00
9.08
6.38
10.09
0.001
0.001
0.001
0.001
Steps counts*(steps/d)
Stepping time**(h/d)
EE *(kcal/d)
Transition count**(times/d)
Light activity time* (h/d)
MVPA time* (h/d)
5619
1.10
409
42
2.72
1.65
1970
0.42
158
14
0.67
0.59
5616
1.12
392
44
2.77
1.63
3701
0.72
211
24
1.50
0.77
2592
0.42
157
10
0.68
0.53
3110
0.62
176
24
1.42
0.69
9320
1.82
630
66
4.22
2.42
3192
0.60
218
17
0.91
0.76
8697
1.75
601
66
4.17
2.42
0.001
0.001
0.001
0.001
0.001
0.001
Blood parameters (mmol/L))
Glucose
Triglycerides
Total Cholesterol
5.4
1.32
4.92
0.5
0.96
0.49
4.6-6.20
0.85-4.17
4.03-5.92
5.2
1.40
5.23
1.1
0.80
0.76
3.8-13.9
0.80-5.83
4.08-7.36
5.3
1.39
5.17
1.1
0.82
0.72
3.8-13.9
0.80-5.83
4.03-7.36
Blood pressure (mmHg)
Systolic
Diastolic
Heart rate (bpm)
127
82
65
10
15
9
110-142
60-100
52-81
120
78
68
13
11
9
100-160
56 – 100
46 - 90
121
78
67
13
11
9
100-160
56 – 100
46 - 90
Assessed by: *ActiCal, **activPAL
p value: significantly different at-work from out-of-work activities
Teachers spent nearly 58% of their work time sedentary, as measured by the ActiCalTM
accelerometer, which does not differentiate between sitting and standing (Table 18).
The majority of this sedentary time was spent sitting (55%), as measured by the
activPALTM
accelerometer. A comparison of the at-work and out-of-work data revealed

104
that teachers were significantly (p<0.01) more sedentary out-of-work (68% of the time)
in comparison with at-work (59%).
When comparing activity data between deciles, teachers who worked at the lower decile
schools were marginally more sedentary (63% of their awake time) than those who
worked at the higher decile schools (62%). The latter spent marginally more time in
light activities (27%, 26% respectively), but both spent 15% of their time in MVPA. In
the lower decile group, a greater number of steps were taken (9,328 vs. 9,316 step/day)
and EE (640 vs. 625 kcal/day) than in the higher decile group. However, no significant
differences were found in physical activity parameters between the groups (data not
shown).
Teachers’ physical activity and sedentary behaviour: day-by-day trend
Physical activity and sedentary behaviour levels were consistent between days (p>0.05).
The average daily time spent stepping at-work was 7% of total awake time, in light
intensity activities was 17%, and in MVPA was 11%.
Day 3 appeared least active, with the highest percentage of sitting time (57%), followed
by Day 2 with a 63% in sedentary activity. In contrast, the most active day was Day 1,
with the highest percentage of MVPA time (16%), stepping time (12%), step counts
(10,064 ± 4,377 steps/day) and more energy expended (637 ± 248 kcal/day). Transitions
from sitting to standing were the highest on Day 3 (69 ± 20 times/day).

105
Physical activity and sedentary behaviour as protective and risk factors
Teachers who stood more during the day showed lower probability of developing high
cholesterol and lower probability of developing CVD than those who accumulated less
standing time during the day (Table 19). Moreover, this research showed that those
teachers who accumulated more standing time at-work had lower probability of
developing cardiovascular diseases in the next 10 years than teachers who accumulated
less standing time. Cardiovascular risk for the next 10 years was calculated based on the
teacher’s blood parameters measured using the Cardiovascular Risk Assessor (Society
et al., 2005).
Teachers who accumulated greater transitions from sitting to standing and vice versa
along the day showed lower probability of developing high triglycerides and high total
cholesterol than those who accumulated a lesser number of transitions across the day.
Furthermore, teachers who accumulated more stepping time during the day showed
lower probability of developing high total cholesterol than those who accumulated less
stepping time. Teachers who spent more time walking at-work showed lower
probability of developing cardiovascular diseases than those who spent less time
walking at-work.
Teachers who accumulated more time in light activities showed lower risk of
developing cardiovascular disease, systolic and diastolic, than teachers who
accumulated less light physical activity during the day. Those teachers who
accumulated more light activity time at-work showed 0.9 times lower probability of
developing high triglycerides concentration than those teachers who accumulated less

106
light physical activity time at-work, with 95% confidence that the true value of the
mean for high triglycerides was located in the interval from 0.01 to 0.98.
Teachers who accumulated more MVPA time showed lower probability of overweight-
obesity and cardiovascular risk than teachers who accumulated less MVPA time during
the day. It was also found that teachers who accumulated more MVPA time at-work
showed lower risk of overweight-obesity, cardiovascular risk, and hypertension
(diastolic) than teachers who accumulated less MVPA time at-work.

107
Table 19: Active Behaviours as protector factors (OR)
Total At-work Out-of-work
Standing Time Risk 95% CI Risk 95% CI Risk 95% CI
High cholesterol 0.477 0.112 2.033 0.500 0.117 2.132 0.236 0.046 1.204
% CVD systolic 0.551 0.241 1.260 0.784 0.345 1.779 0.530 0.231 1.217
% CVD diastolic 0.554 0.244 12.59 0.784 0.348 1.768 0.641 0.283 1.451
Stepping Time
Hypertension systolic 0.976 0.315 3.030 1.075 0.346 3.337 0.976 0.315 3.030
High cholesterol 0.763 0.191 3.040 0.880 0.221 3.508 0.433 0.102 1.849
% CVD systolic 0.840 0.370 1.905 0.731 0.322 1.661 0.530 0.231 1.217
% CVD diastolic 1.000 0.444 2.251 0.730 0.323 1.647 0.641 0.283 1.451
Transitions
High triglycerides 0.364 0.066 2.016 0.879 0.182 4.255 1.376 0.285 6.658
High cholesterol 0.800 0.201 3.188 0.880 0.221 3.508 0.800 0.201 3.188
Steps Count
Hypertension systolic 0.977 0.316 3.022 0.733 0.235 2.289 0.700 0.224 2.186
High cholesterol 0.365 0.088 1.504 1.023 0.276 3.788 0.365 0.088 1.504
% CVD systolic 0.905 0.406 2.015 0.476 0.211 1.075 0.765 0.343 1.708
% CVD diastolic 0.909 0.411 2.013 0.480 0.214 1.077 0.771 0.48 1.710
Light activity time
Hypertension diastolic 0.792 0.306 2.046 1.263 0.489 3.264 0.792 0.306 2.046
High triglycerides 2.143 0.387 11.857 0.111* 0.013 0.977 1.375 0.285 6.635
% CVD systolic 0.739 0.330 1.654 1.717 0.763 3.863 0.875 0.392 1.953
% CVD diastolic 0.878 0.395 1.949 1.443 0.648 3.214 1.036 0.467 2.299
MVPA time
Overweight-obesity 0.864 0.388 1.924 0.576 0.256 1.292 0.730 0.327 1.631
CVRisk 0.695 0.275 1.761 0.525 0.205 1.348 1.083 0.432 2.717
Hypertension diastolic 1.219 0.464 3.199 0.555 0.207 1.489 0.957 0.365 2.511
% CVD systolic 1.089 0.483 2.456 0.696 0.308 1.573 0.917 0.407 2.066
% CVD diastolic 0.910 0.406 2.039 0.587 0.260 1.323 0.910 0.406 2.039
* Significantly protective factor of getting high triglycerides concentration
The odds of developing hypertension was higher in teachers who accumulated more
sitting time (measured with the activPALTM
accelerometer) than those who accumulated
less sitting time during the day (Table 20). This probability increased in those teachers
who accumulated more sitting time out-of-work than those who spent less time sitting
out-of-work. Moreover, it was found that teachers who accumulated more sitting time
during the day increased their probability of developing cardiovascular disease in the
next 10 years than those teachers who accumulated less sitting time. These values were
increased in teachers who remained seated for longer periods during the day. For

108
percentage of getting a cardiovascular disease, systolic and diastolic, their CI were over
OR=1, indicating that the probability is significant.
It was found that teachers who accumulated more time in sedentary activities showed
greater risk of developing hypertension (systolic and diastolic) than teachers who
accumulated less time in sedentary activities over the day. Likewise, teachers who
accumulated more sedentary activity time at-work showed greater risk of developing a
CVD than those who accumulated less sedentary activity time at-work.
Table 20: Sitting and sedentary activity time as a risk factor (OR) Total At-work Out-of-work
Sitting Time# Risk 95% CI Risk 95% CI Risk 95% CI
Hypertension diastolic 1.800 0.662 4.897 0.840 0.313 2.255 2.008 0.723 5.578
Overweight-obesity 1.018 0.452 2.293 1.209 0.536 2.724 1.167 0.517 2.631
% CVD systolic 2.538* 1.087 5.928 1.473 0.646 3.360 2.805* 1.204 6.537
% CVD diastolic 2.476* 1.071 5.724 1.453 0.642 3.290 2.778* 1.201 6.422
Sedentary Activity Time&
CV Risk 1.640 0.648 4.150 2.471 0.944 6.463 0.643 0.254 1.626
Hypertension systolic 2.070 0.641 6.686 1.000 0.323 3.095 1.000 0.323 3.095
Hypertension diastolic 2.773* 1.018 7.558 2.042 0.769 5.419 1.263 0.489 3.264
High triglycerides 1.462 0.303 7.058 0.684 0.142 3.300 0.875 0.181 4.224
% CVD systolic 1.143 0.512 2.554 2.431* 1.066 5.543 0.624 0.278 1.401
% CVD diastolic 0.966 0.435 2.143 2.402* 1.061 5.439 0.531 0.237 1.192
*p<0.05;
#Sitting time was measured by activPAL and considered only when the participant was in a sitting/lying position;
&Sedentary Activity time was measured by ActiCal and considered all activities less than 1.5 MET and can include sitting and
standing positions.
Teachers’ cardiovascular disease (CVD) risk
To determine the risk of developing cardiovascular disease, anthropometric, blood, and
behavioural factors were analysed. The three most prevalent risk factors of developing

109
cardiovascular disease (Table 21) were obesity, impaired blood lipids, and high blood
pressure. The study group was between 8% and 13% at risk of developing a CVD in the
next 10 years.
Table 21: Teachers’ risk factor prevalence
Parameters n of cases % p
Blood pressure Optimal
Hypertension
92
11
89
11 0.001
BMI Optimal
Overweight
Obesity
60
25
18
58
24
17
0.001
Smoker Yes
Not
5
98
5
95 0.001
Blood lipids Total cholesterol (n = 99)
Optimal
Borderline
High
Triglycerides (n=75)
Optimal
Borderline
High
Very High
Blood glucose (n=102)
Optimal
Early diabetes
Diabetes
57
32
10
62
5
7
1
85
15
2
58
32
10
83
7
9
1
83
15
2
0.001
0.001
0.001
CV Risk
Systolic High (> 10%)
Low (< 10%)
8
95
8
92 0.001
Diastolic High (> 10%)
Low (< 10%)
13
90
13
87 0.001
p< 0.01
In summary, teachers spent more time in MVPA at work than out of work, and they
were more sedentary out of work than while at work. Despite that more than half of the
time at school was seated, teachers were able to accumulate more energy expenditure
while at work than out of work. Physical activity and sedentary behaviours shown
constant values during the measurement time determining a trend for this sample of
teachers.

110
It was identified that accumulating more time standing and interrupting sedentary
behaviours constantly the cardiovascular risk for the next 10 years is reduced.
Accumulating more light intensity activity time at work emerged as a significant
protective factor to do not get harmful concentration of triglycerides in the blood
stream. Teachers who showed highest levels of sedentary behaviours presented a trend
to increase their cardiovascular risk.

111
5.3. Self-reported physical activity and perceived workload and productivity
analysis
This section reports the teachers’ perception of the impact of their workload on habitual
physical activity, which was assessed through two questionnaires: the Questionnaire for
the measurement of Habitual Physical Activity (QHPA) and the World Health
Organisation Health and Work Performance Questionnaire (HPQ). The report includes
a descriptive analysis of both questionnaires followed by a comparative analysis of
objective and self-reported data.
Teachers’ Habitual Physical Activity Index
The habitual physical activity index was calculated using the Baecke questionnaire,
determining three different dimensions related to occupational physical activity, sport
activities, and non-sport leisure activities.
Teachers were classified into the moderate habitual physical activity index categories
according to their score in each of the three dimensions, as shown in Table 22.
Table 22: Teachers' habitual physical activity index during various daily activities
Index n Work Activity Sport Activity Leisure
Activity
Total Score
Means 101 2.74 2.71 2.65 8.05
SD 0.31 0.94 0.62 1.29
Classification Moderate Moderate Moderate Moderate
Significant differences in the sport index were found between the youngest and oldest
teachers (p=0.006), and in the total HPA index (p=0.03). Among the youngest and
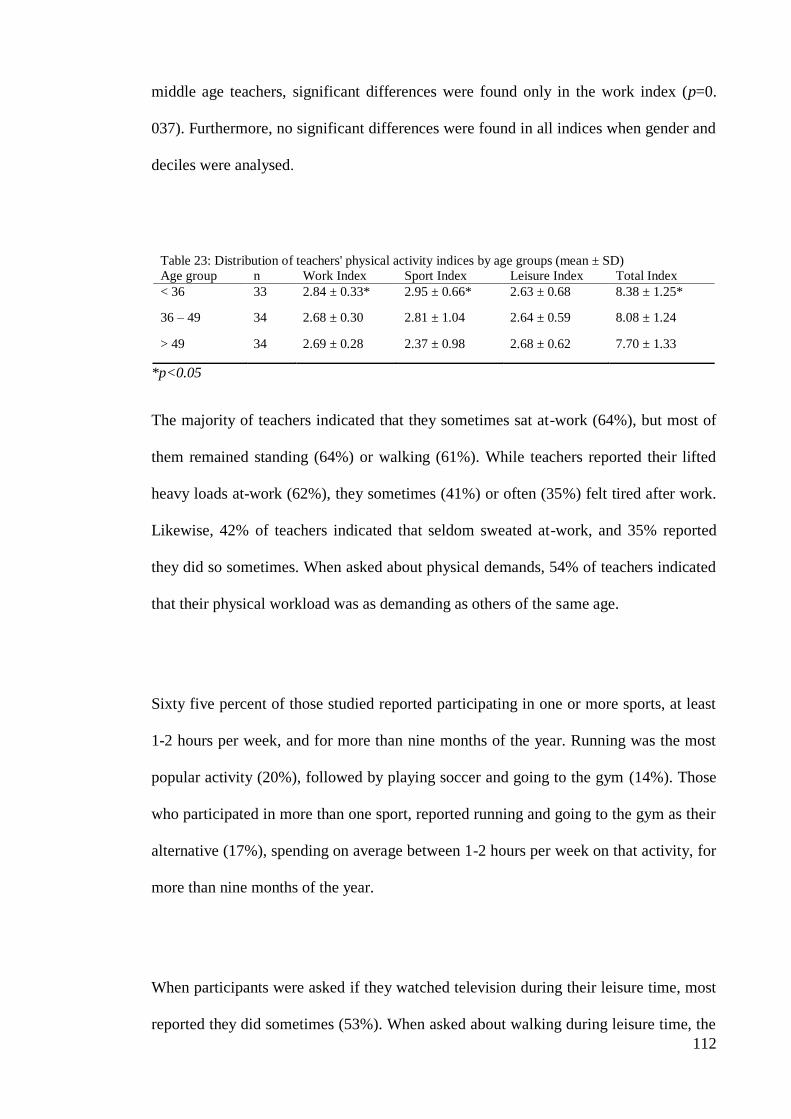
112
middle age teachers, significant differences were found only in the work index (p=0.
037). Furthermore, no significant differences were found in all indices when gender and
deciles were analysed.
Table 23: Distribution of teachers' physical activity indices by age groups (mean ± SD)
Age group n Work Index Sport Index Leisure Index Total Index
< 36 33 2.84 ± 0.33* 2.95 ± 0.66* 2.63 ± 0.68 8.38 ± 1.25*
36 – 49 34 2.68 ± 0.30 2.81 ± 1.04 2.64 ± 0.59 8.08 ± 1.24
> 49 34 2.69 ± 0.28 2.37 ± 0.98 2.68 ± 0.62 7.70 ± 1.33
*p<0.05
The majority of teachers indicated that they sometimes sat at-work (64%), but most of
them remained standing (64%) or walking (61%). While teachers reported their lifted
heavy loads at-work (62%), they sometimes (41%) or often (35%) felt tired after work.
Likewise, 42% of teachers indicated that seldom sweated at-work, and 35% reported
they did so sometimes. When asked about physical demands, 54% of teachers indicated
that their physical workload was as demanding as others of the same age.
Sixty five percent of those studied reported participating in one or more sports, at least
1-2 hours per week, and for more than nine months of the year. Running was the most
popular activity (20%), followed by playing soccer and going to the gym (14%). Those
who participated in more than one sport, reported running and going to the gym as their
alternative (17%), spending on average between 1-2 hours per week on that activity, for
more than nine months of the year.
When participants were asked if they watched television during their leisure time, most
reported they did sometimes (53%). When asked about walking during leisure time, the

113
most frequent answer was sometimes (40%). More than 60% of teachers indicated that
they never rode a bike in their leisure time.
The average time spent performing locomotion activities (walking and/or cycling to
work and shopping) was less than five minutes (28%), followed by the period between
5 to 15 minutes a day (25%).
Teachers’ work performance level
Table 24 presents the mean values for absolute and relative absenteeism, and absolute
and relative presenteeism. These data reveal that the teachers studied had high work
productivity compared to others in the same occupation (88%), and a high percentage
(63%) of extensionism (working longer hours than expected), represented by negative
values of relative absenteeism. The reported actual hours worked in a week was 49.2±
8.1 hours that was 5.7 hours over the work hours expected by the employer (43.7±
6.5hours). Over half of the sample of teachers reported working for more than 50 hours
per week (57.6%).

114
Table 24: Teachers' absenteeism and work performance by gender, decile, and age group
N
Absolute
absenteeism*
(mean ± SD)
Relative
absenteeism▪
(mean ± SD)
Absolute work
performance◊
(mean ± SD)
Relative work
performanceⱡ
(mean ± SD)
Total 92 -5.6 ± 8.3 -0.1 ± 0.2 79.9 ± 11.0 1.0 ± 0.1
Male 12 -5.0 ± 7.5 -0.1 ± 0.2 74.2± 9.0 1.0 ± 0.1
Female 80 -5.7 ± 8.4 -0.1 ± 0.2 79.6 ±11.2 1.0 ± 0.1
Lowest decile 30 -5.3± 8.5 -0.1 ± 0.2 81.3 ± 11.4 1.1± 0.2
Highest ecile 62 -5.8± 8.3 -0.2± 0.2 77.7 ± 10.8 1.0 ± 1.4
< 36 y.o. 33 -6.3± 8.4 -0.2± 0.2 76.4± 12.5 1.0 ± 0.2
36 – 49 y.o. 31 -4.7± 9.1 -0.1 ± 0.2 77.4 ± 10.0 1.0 ± 0.1
> 49 y.o. 28 -5.9± 7.3 -0.1 ± 0.2 83.6± 9.1** 1.0 ± 0.1
* Absolute absenteeism: actual worked hours - the expected worked hours
▪ Relative absenteeism: absolute absenteeism/expected worked hours
◊ Absolute work performance: reported own performance converted into percentages
ⱡ Relative work performance: reported performance/average performance in the same job
** p<0.05
Significant differences in the absolute work performance were found between the oldest
and youngest teachers (p=0.012). Differences were also found between the oldest
teachers and middle age teachers in terms of absolute work productivity (p=0.017).
Subgroups according to gender, age or decile were similar for other indices.
With respect to absenteeism, only 7% of the teachers reported that they had missed an
entire day of work because of physical or mental health problems, and 4% had missed a
work day for other reasons. A small number reported that they had missed a part of a
work day because of physical or mental health problems (1%). Work-related accidents
were not reported as a cause of absenteeism.
Comparative analysis of objective and self-reported data
A comparison of data obtained from accelerometers with data from self-report
questionnaires was performed. Using either of these methods, accelerometry and self-

115
report, it was possible to classify teachers as moderately active subjects, both in general
and when they were at-work (Table 25).
Table 25: Physical activity by questionnaire and accelerometry comparison (mean ± SD)
Self report data Objective data
HPA
Index*
Work
Index*
Daily
MVPA
time#
MVPA
time at-
work#
Daily Steps
count&
Steps at-
work&
Total 8.07 ± 1.29 2.74 ± 0.31 2.42 ± 0.76 1.65 ± 0.59 9320 ± 3192 5619 ± 1970
Male 8.32 ± 1.14 2.73 ± 0.33 2.74 ± 0.95 2.02 ± 0.77 9721 ± 3909 6754 ± 3023
Female 8.04 ± 1.31 2.74 ± 0.31 2.37 ± 0.72 1.62 ± 0.55 9264 ± 3103 5598 ± 1756
Lowest decile 8.01 ± 1.47 2.69 ± 0.29 2.42 ± 0.62 1.68 ± 0.48 9329 ± 3232 5728 ± 1612
Highest decile 8.10 ± 1.21 2.76 ± 0.32 2.42 ± 0.82 1.67 ± 0.64 9316 ± 3199 5745 ± 2127
< 36 y.o. 8.38 ± 1.25 2.84 ± 0.33 2.26 ± 0.60 1.56 ± 0.57 8459 ± 2452 5133 ± 1531
36-49 y.o. 8.14 ± 1.20 2.66 ± 0.29 2.61 ± 0.79 1.80 ± 0.58 9843 ± 3295 6121 ± 2271
> 49 y.o. 7.68 ± 1.35 2.70 ± 0.28 2.39 ± 0.87 1.67 ± 0.63 9750 ± 3697 6027 ± 1962
* Score index;# hours/day, &counts/day
Investigating the association between absenteeism, work performance (both gathered by
questionnaires), physical activity and sedentary behaviour (gathered by accelerometer),
indicated that a person who spent more steps a day, and accumulated more MVPA
presented higher habitual physical activity index (Figure 3), in contrast those who
presented more time accumulated in sitting and sedentary activity (Figure 4).

116
R2= 0.059 R
2= 0.050
Figure 3: HPA Index and active behaviour relationship, according step count (A) and
MVPA time (B)
R2 = 0.004 R
2= 0.031
Figure 4: HPA Index and sedentary behaviour relationship, according to sitting time (A)
and sedentary activity time (B)
Teachers who accumulated higher MVPA time showed low levels of absolute
absenteeism (Figure 5). For work performance, no significant association was found
with physical activity and sedentary behaviour.
A B
A B

117
Negative values mean lower levels of absenteeism
R2= 0.010
Figure 5: Absenteeism and active behaviour relationship
Measured through self-reports, teachers are recognised as moderately active in all areas
assessed (work, sport, and leisure time).
In summary, teachers showed low levels of absenteeism and high levels of
presenteeism. There were no significant differences by gender, but the oldest teachers
showed significantly higher levels of work performance than their youngest counterpart.
A significant relationship between physical activity, sedentary behaviour and
productivity was not found.

118
5.4. Teachers’ and children’s physical activity and sedentary behaviour patterns at
school.
This section reports on children’s physical activity and sedentary behaviour profiles,
during school time and the whole day. The report begins with a general description,
followed by sedentary and physical activity data patterns and trends throughout the
school week. This is followed by, a comparison of teachers’ and children’s physical
activity and sedentary patterns at school.
Participants were children enrolled at public and integrated schools in the Auckland
Metropolitan Area aged 5 and 11 years (years 0 – 6) with an average of 7.9±1.8 years
(from 5 to 11 years old) ranging from the year 0 to the year 6. The participating schools
were divided into high and low decile groups (see Table 26).
Table 26: Children's demographic data
N Male Female Decile
Low High
Gender 131 62 69 47 84
Age (years) 129
5 13 9 4 4 9
6 19 11 8 8 11
7 22 11 11 4 18
8 24 11 13 11 13
9 24 12 12 7 17
10 16 3 13 8 8
11 11 4 7 5 6
School grade 129
NE 2 1 1 2 0
1 22 14 8 8 14
2 24 14 10 6 18
3 22 10 12 7 15
4 23 12 11 9 14
5 18 4 14 7 11
6 18 6 12 8 10
NE: New Entrants

119
Children’s physical and sedentary behaviour activity levels
To determine the children’s physical activity and sedentary behaviour profile,
measurement of five consecutive days of activity during a normal school week was
undertaken. Three full school days of data were used for data analysis (Tuesday to
Thursday).
The children’s sedentary behaviour pattern showed (Table 27) that they spent on
average 48% of their waking time at-school during which most of their time was spent
sitting (59%). During out-of-school hours, children were seated for 61% of the time.
Children were significantly (p<0.01) more sedentary out-of-school (56% of the time) in
comparison with at-school (44%).
In our sample of children 100% meet the physical activity recommendation of greater
than 60 min of moderate to vigorous activity per day. The 60 min was achieved on each
of the three school days. The moderate intensity activity was calculated in 1 min bouts.

120
Table 27: Children's active and sedentary behaviours during school and out-of-school hours
Total At-school Out-of-school
N Mean SD Median Mean SD Median % Mean SD Median % p
value***
Awake(h/d) 131 12.35 0.88 12.26 5.98 0.08 6.00 48 6.37 0.87 7.17 52 0.001
Sitting time**(h/d) 130 7.41 1.44 7.53 3.53 0.71 3.54 48 3.88 1.04 3.96 52 0.001
Standing time**(h/d) 130 2.99 0.96 2.95 1.46 0.54 1.38 49 1.52 0.57 1.86 51 0.202
Sedentary time*(h/d) 129 5.55 1.13 5.53 2.49 0.54 2.49 45 3.06 0.83 3.83 55 0.001
Steps count* 131 10724 2932 10015 5759 1780 5439 54 4965 1724 5526 46 0.001
Stepping time**(h/d) 130 1.83 0.49 1.83 0.98 0.29 1.00 54 0.85 0.31 1.05 46 0.001
Transitions count** 130 88 19 88 49 12 49 56 39 12 48 44 0.001
Light activity time*(h/d) 129 4.19 0.70 4.16 2.11 0.38 2.14 50 2.08 0.53 2.60 50 0.555
MVPA time*(h/d) 129 2.48 0.62 2.45 1.38 0.33 1.38 56 1.14 0.39 1.35 44 0.000
Assessed by: *ActiCal, **activPAL :
p value*** at-school and out-of-school comparisons
Table 27, which report the children’s physical activity levels, categorised according to
intensity, shows that the children spent a similar amount of time in light physical
activity at-school and out-of-school (50%).
Children were more active at-school than out-of-school (p<0.01), performing more
steps (966 steps/h at-school versus 779 steps/h out-of-school (see Table 23)). On
average, interruptions in sitting time was significantly higher (p<0.0001) during school
time (49 times/d) than out-of-school (39 times/d).
The physical activity levels of children (Table 27) indicated that they spent 20% of their
waking hours performing MVPA, most of it at school. Light intensity activities
constituted a greater percentage (34%) of active behaviour during waking hours.
Children from the lower decile schools showed a slightly more active pattern at school
(58%) than their counterparts from higher decile schools (57%), walking similarly (54%
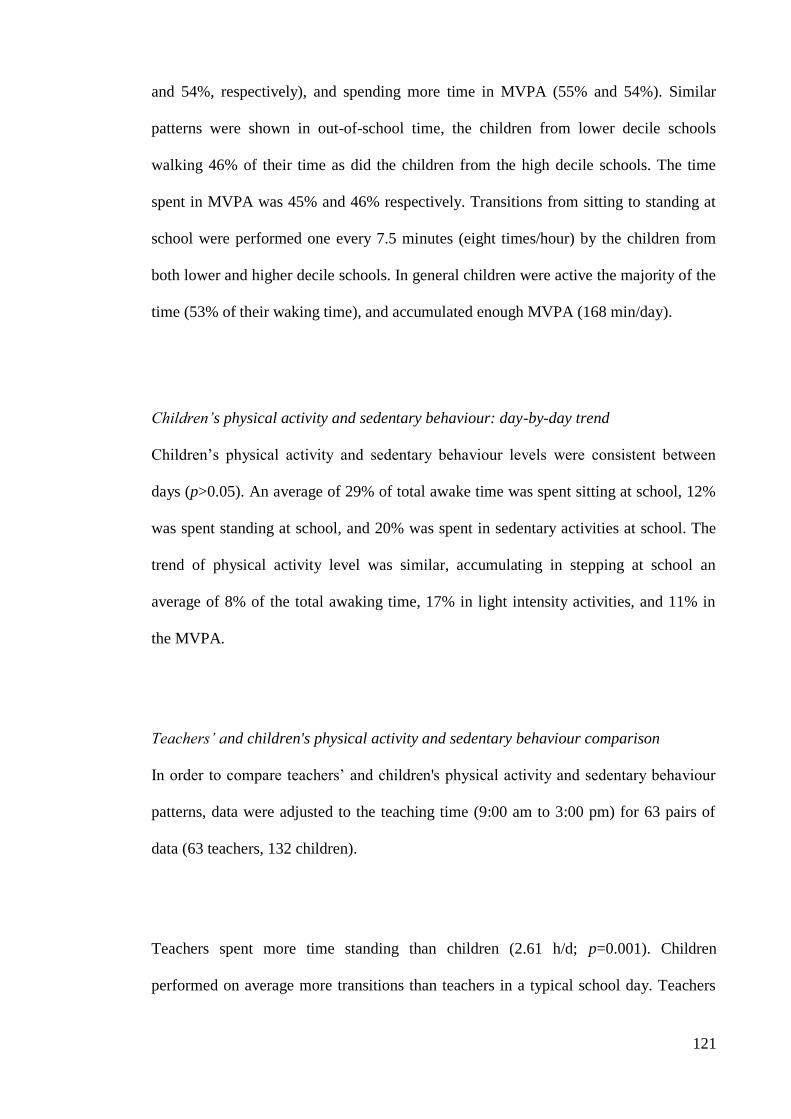
121
and 54%, respectively), and spending more time in MVPA (55% and 54%). Similar
patterns were shown in out-of-school time, the children from lower decile schools
walking 46% of their time as did the children from the high decile schools. The time
spent in MVPA was 45% and 46% respectively. Transitions from sitting to standing at
school were performed one every 7.5 minutes (eight times/hour) by the children from
both lower and higher decile schools. In general children were active the majority of the
time (53% of their waking time), and accumulated enough MVPA (168 min/day).
Children’s physical activity and sedentary behaviour: day-by-day trend
Children’s physical activity and sedentary behaviour levels were consistent between
days (p>0.05). An average of 29% of total awake time was spent sitting at school, 12%
was spent standing at school, and 20% was spent in sedentary activities at school. The
trend of physical activity level was similar, accumulating in stepping at school an
average of 8% of the total awaking time, 17% in light intensity activities, and 11% in
the MVPA.
Teachers’ and children's physical activity and sedentary behaviour comparison
In order to compare teachers’ and children's physical activity and sedentary behaviour
patterns, data were adjusted to the teaching time (9:00 am to 3:00 pm) for 63 pairs of
data (63 teachers, 132 children).
Teachers spent more time standing than children (2.61 h/d; p=0.001). Children
performed on average more transitions than teachers in a typical school day. Teachers
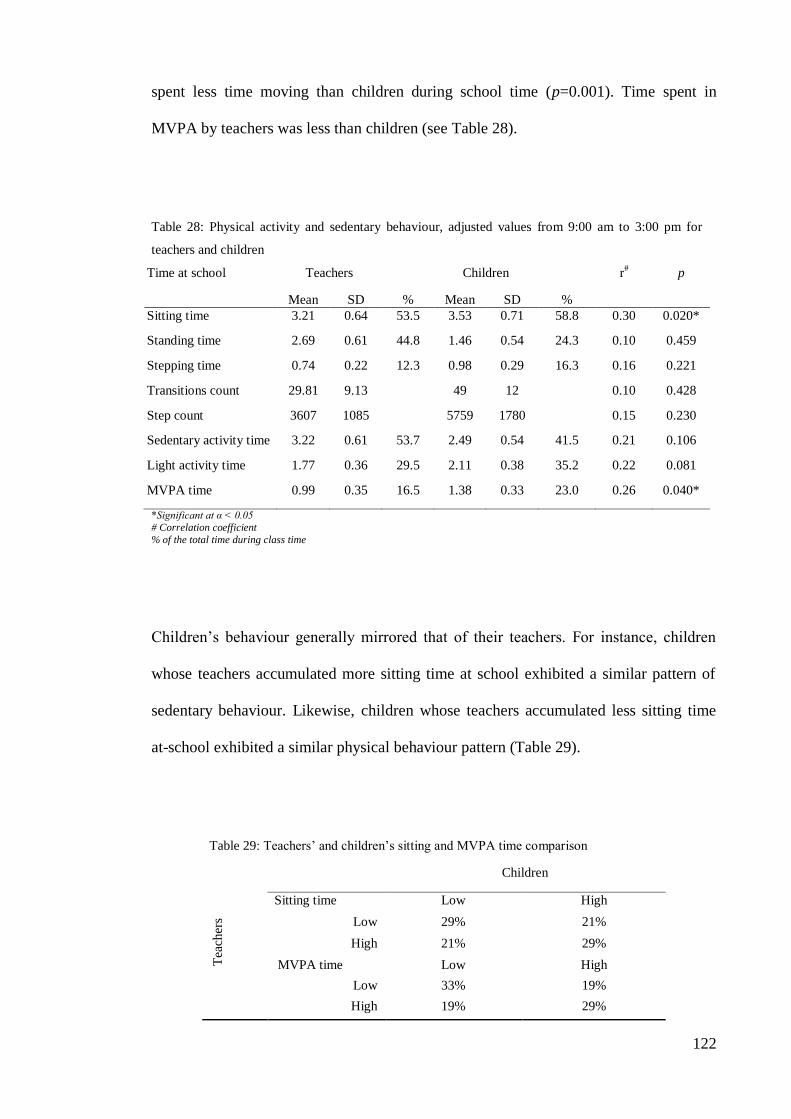
122
spent less time moving than children during school time (p=0.001). Time spent in
MVPA by teachers was less than children (see Table 28).
Table 28: Physical activity and sedentary behaviour, adjusted values from 9:00 am to 3:00 pm for
teachers and children
Time at school Teachers Children r# p
Mean SD % Mean SD %
Sitting time 3.21 0.64 53.5 3.53 0.71 58.8 0.30 0.020*
Standing time 2.69 0.61 44.8 1.46 0.54 24.3 0.10 0.459
Stepping time 0.74 0.22 12.3 0.98 0.29 16.3 0.16 0.221
Transitions count 29.81 9.13 49 12 0.10 0.428
Step count 3607 1085 5759 1780 0.15 0.230
Sedentary activity time 3.22 0.61 53.7 2.49 0.54 41.5 0.21 0.106
Light activity time 1.77 0.36 29.5 2.11 0.38 35.2 0.22 0.081
MVPA time 0.99 0.35 16.5 1.38 0.33 23.0 0.26 0.040*
*Significant at α < 0.05
# Correlation coefficient
% of the total time during class time
Children’s behaviour generally mirrored that of their teachers. For instance, children
whose teachers accumulated more sitting time at school exhibited a similar pattern of
sedentary behaviour. Likewise, children whose teachers accumulated less sitting time
at-school exhibited a similar physical behaviour pattern (Table 29).
Table 29: Teachers’ and children’s sitting and MVPA time comparison
Tea
cher
s
Children
Sitting time Low High
Low 29% 21%
High 21% 29%
MVPA time Low High
Low 33% 19%
High 19% 29%

123
There were no significant differences in behaviour observed between children and
teachers from lower or higher decile schools. The socioeconomic status of the school
did not significantly affect the participants’ physical activity and sedentary behaviour
levels.
In summary, children participating in this study met the physical activity
recommendations of accumulating at least 60 minutes per day of MVPA. These
children were more active while at school, as well as their teachers.
Children showed a trend of physical activity and sedentary behaviour levels similar to
their teachers. Those children whose teachers accumulated more physical activity time
at school were more active in comparison with children who spent more time with less
physically active teachers.

124
CHAPTER 6: Discussion and conclusion
6.1. Overview
Non-communicable diseases remain the largest cause of death (W.H.O., 2004). In New
Zealand, four out of ten deaths are caused by cardiovascular diseases (Ministry of
Health, 2003). There are many factors that increase the risk of cardiovascular disease
(environment, genetic, behaviours, etc.). Physical inactivity increases the probability of
deterring health (Hamilton et al., 2008), and sedentary occupations exacerbate this
condition. Physical inactivity is pandemic, a leading cause of death in the world (Kohl
et al., 2012). People in different professions exhibit different health behaviours, because
of either occupational requirements or personal choices.
On average, the working population, including teachers, spends around one third of the
day at work (Smith et al., 1999). There is growing evidence about the association
between sedentary behaviour at the workplace, absenteeism and chronic disease (Chan
et al., 2004; Hamilton et al., 2007; Murphy et al., 2006). Previous studies suggest that
interrupting sitting time could reduce both absenteeism and chronic diseases (Beers et
al., 2008; Healy et al., 2008; McAlpine et al., 2007). To date, there has been little
investigation into primary school teachers’ health behaviours, and the effect these
behaviours could have on the academic results of their students. This piece of work is
the first Australasian study focusing, on teachers’ physical activity and sedentary
behaviour and their cardiovascular health status as well as the relationship between
teachers’ physical activity and sedentary behaviour and that of their students. These
findings provide some initial evidence for public health policy makers to consider when

125
making school-based policy interventions to promote physical activity not only for
teachers but also for children.
The aim of this thesis was to determine how the work environment affects physical
activity and sedentary behaviour and health in primary school teachers in New Zealand.
The study attempted to identify aspects that facilitate or prevent teachers involvement in
physical activity at work was the first component of the thesis. As cardiovascular health
is influenced by physical and sedentary activity, these behaviours were investigated to
quantify the amount of time teachers spending these behaviours while at-work and out-
of-work. Additionally, teachers’ and children’s physical activity and sedentary
behaviour were compared to determine if there was a correlation between them.
Work environment and physical activity
The school environment influences the lifestyle of all those who are associated with it.
Aspects of that environment both favour and hinder certain behaviours associated with
physical activity. The results of this study indicate the school is an active working
environment, offering numerous opportunities for teachers to move while working. The
new curriculum demands, the dimensions of the schools, and the extracurricular
activities engaged in by teachers all enable the acquisition and development of active
behaviours in teachers. New Zealand school environment could serve as model for other
countries to provide school environments that facilitate teachers’ occupational physical
activity.

126
However, the study also identified there were some factors that hindered the acquisition
and development of these active lifestyles. The primary teachers in this study echoed
the cries of the general population (Salmon et al., 2003) that lack of time is the main
barrier to engaging in physical activity. When time is at a premium, physical activity is
often relegated to make way for other perceived priorities. The participants explained
that they spent long hours in work-related activities, both at school and out of school
time, and this was reported as a probable cause of discouraging teachers' participation or
engage in physical activity (Resnicow et al., 1998). In the general population, the most
declared barriers of being involved in physical activity were: lack of self-motivation,
bad weather, busy social schedule, busy home or family schedule, busy work schedule
(Bowles, Morrow, Leonard, Hawkins, & Couzelis, 2002), not unlike the findings in this
study.
Previous studies have shown that in line with the general population, the barriers to
teachers engaging in physical activity are lack of interest, other priorities and laziness.
In their study, Reichert et al. (Reichert, Barros, Domingues, & Hallal, 2007) reported
lack of time, dislike of exercising, feeling too tired, lack of company and lack of money
as barriers faced by the general population. A further personal reason identified by the
teachers in this study was their lack of training in subjects such as physical education.
This lack of training meant they did not feel confident teaching physical education type
classes to students.
The teachers' perception about their own workload is different from that reported in the
literature, and current demands seemed greater than in the past (LaMaster et al., 1998).

127
The movement requirements of teachers in junior schools and senior schools differ. In
junior school teachers generally move a lot more than their senior school counterparts
most likely because of the nature of learning at this early stage. Nurturing and
motivating their young charges and generally dealing with young children’s active
learning needs require primary school teachers to move more. New Zealand literature
(Bridges & Searle, 2011) reports that teachers perceived an increase in their workload in
the last 10 years, with attendant implications on their well-being, including fewer
opportunities to engage in physical activity, increased stress, fatigue and depression.
Quantifying teachers’ physical activity, sedentary behaviour, cardiovascular health,
and work productivity
Data from this thesis showed that primary school teachers spend many hours sitting at
work (33%) similar to the finding reported by Smith et al., (Smith et al., 1999). That
said, the teachers in this study accumulated the majority of their physical activity at
work (2.72 h/d of light activity, and 1.65 h/d of MVPA). Physical activity was higher
than the levels recommended for a healthy lifestyle (Pate, 1995) although a 10 minutes
bout assessment was not performed. Moreover, in the studied sample, the
cardiovascular disease risk was lower (ranging between < 0.5 and 20%) compared with
the literature reviewed (> 20% (D'Agostino et al., 2008)). This group is therefore less
likely to develop a CVD in the next 10 years.
Teaching is considered to be at the lower end of the spectrum in terms of physically
demanding professions (Bergström et al., 1999). The new curriculum demands
(Ministry of Education, 2007) have increased the level of burden for teachers and

128
students, bringing about changes in pedagogical practice. In a sample of teachers from
India, (Vaz & Bharathi, 2004) it was found that the teachers’ occupational physical
activity was around 41% of the total daily energy expenditure, classifying this
professional group as moderately physically active. This would seem to suggest that the
participants in this study fall into a moderate profile rather than a sedentary one, despite
the fact that the teachers’ physical activity levels tend to decrease when teachers work
in the higher school grades.
This study observed in teachers frequent changes from a sedentary position to an active
position while working (around 5 times/h). These transitions showed a protective
association on teachers’ health parameters. The contribution of interrupting sedentary
behaviour, and the balance between active and sedentary behaviours, could be
important in determining the percentage of cardiovascular diseases in the studied
population, and in confirming the protective value of these activities (Beers et al., 2008;
Healy et al., 2008; McAlpine et al., 2007). In addition, data from this study suggest that
it is possible to reach the recommended values (45 to 60 min/d) of MVPA to prevent the
transition from overweight to obesity (Saris et al., 2003).
In general teachers were sedentary the majority of the time, but nonetheless
accumulated enough MVPA (145 min/d) to compensate for this sedentary behaviour.
There was an average energy expenditure (EE) of 409 kcal/d, despite the fact that the
steps taken by the teachers did not reach recommended levels (Tudor-Locke & Bassett,
2004). The physical activity and sedentary behaviour ratios in this study suggest that
primary school teachers were more active during working hours than when they were

129
out-of-work. This is in contrast with earlier data suggesting that teachers were more
active out-of-work (LaMaster et al., 1998). No significant differences were observed to
suggest teachers had more or less active days during the week, confirming a clear
pattern of behaviour.
The results indicated that sitting increased the development of hypertension and
increased the chances of developing a cardiovascular disease by about 2.5 times, similar
to the results reported by Hamilton et al. (Hamilton et al., 2008). However,
accumulating time in non-sedentary activity, such as standing or walking, as well as
interrupting continuous sedentary behaviours, decreased (although not statistically
significantly) cardiovascular risk factors between 5% to 65%, concordant with the
Healy study (Healy et al., 2008), which found that independent of the time spent in
sedentary and moderate-to-vigorous activities, interrupting sedentary time was
beneficial to health status.
The cardiovascular risk factor prevalence indicates that obesity was determined as the
largest component in this group of workers (17%), well below what was presented in a
study of primary school teachers in the USA where obesity prevalence was reported at
42% (Webber et al., 2012).
Self reported physical activity and perceived workload and productivity analysis
The perception that teachers had about their workload was assessed using two
questionnaires. In the three areas assessed, physical activity was determined as

130
moderate level of activity, a little bit different from the classification proposed by
Bergstrӧm et al. (Bergström et al., 1999), who considered teaching as a low demanding
physical activity profession.
Younger teachers showed significantly higher levels of physical activity, both at work
and in sport, but older teachers exhibited higher levels of leisure time physical activity.
As expected, most of the teachers were sitting and/or standing (64%) or walking (61%)
while they were at work, consistent with the active teaching model promoted by the
New Zealand educational authorities (Ministry of Education, 2007), as well as the
current educational trends (Bandura, 1977). These data are contrasted with those
reported in a study from Thailand (Chaiklieng & Suggaravetsiri, 2012) where teachers
were found to spend 79% of their teaching time in sitting and standing postures, and a
study of teachers in the USA (Webber et al., 2012), which reported those teachers
engaged in less than 1 min/d of MVPA. New Zealand teachers spend an average of 99
min/d MVPA at-work. The sample of teachers in this study were arguable physically
active because 65% of them reported participating in at least one sporting activity per
week on a regular basis.
The data revealed that the teachers in this study had high productivity levels (measured
by rates of absenteeism and presenteeism), worked for long hours and had low rates of
absenteeism compared with others in the same occupation (Table 24). The middle-aged
participants, 36 to 49 years, showed the lowest values of absenteeism, compared with
the youngest and the oldest teachers. In terms of productivity, participants older than 49
years had significantly better values than younger teachers. Recent studies have shown

131
that absenteeism correlated negatively with the work and leisure-time physical activity
index (Carson et al., 2010). The studied group showed a good level in both indices,
which explains their high level of productivity.
Comparing the data obtained objectively (accelerometry) with those reported
subjectively (questionnaires) corroborated the teachers’ perception that their workload
is more moderate than light, and that they are active rather than sedentary subjects.
Surprisingly, the oldest and middle-aged teachers showed higher values of MVPA and
step count than their younger counterparts.
Teachers’ and children’s physical activity and sedentary behaviour relationship
This thesis indicates that there was a trend (though not statistically significant) for
children to mimic the behaviour of their teachers; children of sedentary teachers had
higher sitting time during the day and children of active teachers showed elevated
MVPA time. According to Cardinal and colleagues (Cardinal, 2001), active teachers are
more willing to be role models and are more aware about the benefits of regular active
behaviour and readily transmit those messages to their children.
Children are expected to be more active than adults. The recommended steps/day for
adults is 10,000 in contrast to 12,000 steps/day for children (Tudor-Locke, Johnson, &
Katzmarzyk, 2009). In this study, a moderate physical activity level for both teachers
and children was observed when compared to the international recommendations for
health (W.H.O., 2010), which state that adults must accumulate 150 min/week and
children must accumulate 60 min/day of moderate to vigorous physical activity to keep

132
healthy. Teachers and children in this study accumulated on average more than 55 and
90 min/day respectively while at school, reaching the recommended values.
An interesting aspect regarding active and sedentary behaviours of teachers and
children during class time (9 am to 3 pm), was that teachers had higher values of
standing time than their children, but children were much more active in general,
walking more and accumulating more time in MVPA.
It was observed that younger children were more active and coupled with the current
teaching style, teachers were more involved in movement. Moreover, teachers’ role
modelling appeared as a relevant variable of being active at school for both teachers and
children. For teachers, role modelling gave them the opportunity to create new
strategies for learning using their awareness of the benefits of physical activity as well
as integrating physical activity into their own lives. For children, mimicking active role
models may have increased their engagement in physical activity.
The current educational model facilitates a closer relationship between teachers and
students requiring greater involvement by teachers in various activities during school
time, consistently interrupting their sedentary behaviour and being more active.
6.2. Limitations
While the findings of this thesis provide new data related to the protective value of
increasing time in physical activity and reducing time in sedentary behaviour, the
133
sample size could be considered a limitation. The major limitation of the thesis was that
a convenient sample was used because of the difficulty with recruiting teachers already
experiencing a high workload at work, which meant that normal assumptions required
for using sophisticated statistical modelling were not met. Had we been able to use
more advanced modelling the analysis would have allowed for adjustment of clustering
in schools, repeated measures, socio-economic status, age and gender.
The sample was comprised mainly of women (88%), a little higher than the New
Zealand rate (82%) (Demographic and Statistical Analysis Unit, 2005), and though
several of those sampled were considered overweight or obese (17%), the sample was
also biased by healthy individuals, with none reporting diabetes and tobacco
consumption. The participants’ personal attitudes to an active lifestyle made it
impossible to know what happens to individuals who have one or more risk factors for
health.
All measurements were collected in urban setting in the Auckland Metropolitan Area. It
was therefore not possible to know the extent of the occupational physical activity
demand in rural environments where distance to work, access to facilities, pollution,
quality of life and type of food could be different.
The cost of measuring HDL cholesterol separately in this study was prohibitive. If cost
were not an issue actual HDL cholesterol levels could have been entered and the
protective effect of high levels of HDL (moderately active group) could have produced
an even lower percentage of cardiovascular risk.

134
Another limitation was the inability to observe behaviours for a longer period, for both
teachers and students, due primarily to the limited number of measuring instruments
and the limited time available to conduct the research. A longer observation period
would have allowed a more in depth analysis of the relationship between the sedentary
and active behaviours of the two groups.
6.3. Future directions
To further our knowledge and understanding of teachers’ physical activity and
sedentary behaviour, and to further develop the findings of this thesis, standards for
assessing sedentary behaviour in various social, economic and cultural contexts, from
childhood to old age, need to be established.
Since it is known that there are several factors that affect teachers’ health and
productivity, more studies are needed to investigate ways to increase occupational
physical activity and reduce sedentary behaviour to improve health. An opportunity
exists to validate a sedentary behaviour questionnaire against the objective
measurement.
Furthermore, a more in depth observation about the influences active and sedentary
behaviours of teachers have on the active and sedentary behaviours of their students is
needed, since this study reported a trend that children exhibit similar behaviours to their
teachers. Conducting more sophisticated statistical analysis (linear modelling), account
for clustering, adjusting for known confounders, and conducting analysis for 10-min
bouts of physical activity also are required.

135
It was recognised that reducing sedentary behaviours at an early age is a priority,
because behaviour patterns developed early on to follow individuals into adulthood.
Implementing a comprehensive strategy, involving the whole school community
including teachers, should be the focus of future interventions. These interventions
should consider both environmental and social aspects as these impact physical activity
behaviour.
As practical recommendations, the design of promotion and/or intervention strategies
must be comprehensive and multidisciplinary encompassing all aspects that can
influence lifestyle. This will increase the likelihood of improving the physical activity
habits of the general population.
As teachers identified several facilitators that could allow to be active at school, for
both teachers and children, it is possible to recommend actions like changing the
classroom layout, changing teaching style, participating in school sport clubs, and using
active breaks as a reward for good student behaviours.
In order to reduce cardiovascular risk for this professional group and others similar,
increasing the total time of being physically active is needed. As most of the working
population spend more than half of their awake time at work, interrupting sedentary
behaviours throughout the working day is required, in addition to the current physical
activity recommendations.

136
6.4. Conclusion
Primary school teachers from the Auckland Metropolitan Area met the recommended
levels to be classified as physically active individuals since they met the daily and
weekly times involved in MVPA, most of this time being accumulated at work.
Furthermore, they demonstrated a low percentage of cardiovascular risk, regardless of
whether they taught at a higher or lower decile school.
When considering time spent in sedentary behaviours, teachers were more sedentary
out-of-work, and teachers from the lower deciles schools, were more sedentary than
their higher decile counterparts. However, there were no significant differences in the
means between these two groups.
Based on the evidence from this study, the level of occupational physical activity
indicates that the teaching profession could be reclassified as moderately physically
demanding, at least with respect to primary school teachers. The study also showed that
the more active teachers (most time accumulated MVPA) showed lower rates of
absenteeism than those less active.
Regarding the methodology used to assess the level of physical activity, the
combination of objective and subjective measures, allowed the generation of more
complete and comprehensive information about with the behaviours studied.
137
Barriers to not engaging in regular physical activity were confirmed, as lack of time and
work demands, despite “School” appearing to be an active workplace, offering
numerous opportunities to become or stay active. The work environment in New
Zealand public primary schools provides a replicable model for other countries in
similar settings to facilitate teachers the increase of their occupational physical activity.
Meeting the activity guideline may not guarantee good health if sedentary behaviour is
not interrupted throughout the working days. Future research and more evidence to
support interrupting sedentary behaviour throughout the working day is required so that
it may become an additional health recommendation.

138
CHAPTER 7: References
AIHW. (2003). The Active Australia Survey: a guide and manual for implementation,
analysis and reporting. Canberra.
Ainsley, J. A., Pettus, J. M., Bosenko, D., Gerstein, C. E., Zinkevich, N., Anderson, M.
G., ... Johnson, W. A. (2003). Enhanced locomotion caused by loss of the
Drosophila DEG/ENaC protein Pickpocket1 [Comparative Study Research
Support, Non-U.S. Gov't Research Support, U.S. Gov't, P.H.S.]. Current biology
: CB, 13(17), 1557-1563.
Ainslie, P. N., Reilly, T., & Westerterp, K. R. (2003). Estimating human energy
expenditure. Sports Medicine, 33(9), 683-698.
Aittasalo, M., & Miilunpalo, S. (2006). Offering physical activity counselling in
occupational health care -- does it reach the target group? Occupational
Medicine (London), 56(1), 55-58.
Altman, D. G., & Royston, P. (2006). The cost of dichotomising continuous variables.
BMJ, 332(7549), 1080. doi:10.1136/bmj.332.7549.1080
Aminian, S., & Hinckson, E. A. (2012). Examining the validity of the ActivPAL
monitor in measuring posture and ambulatory movement in children.
International Journal of Behavioral Nutrition and Physical Activity, 9(1), 119.
Anderson, K., Odell, M., Wilson, P., & Kannel, W. (1991). Cardiovascular disease risk
profiles. American Heart Journal, 121, 6.
Babakus, W., & Thompson, J. (2012). Physical activity among South Asian women: a
systematic, mixed-methods review. International Journal of Behavioral
Nutrition and Physical Activity, 9(1), 150.
Baecke, J., Burema, J., & Frijters, J. (1982). A short questionnaire for the measurement
of habitual physical activity in epidemiological studies. The American journal of
clinical nutrition, 36(5), 936-942.
Bandura, A. (1977). Social learning theory. Orrville Ohio: Prentice Hall.
Barfield, J. P., Rowe, D. A., & Michael, T. J. (2004). Interinstrument Consistency of the
Yamax Digi-Walker Pedometer in Elementary School-Aged Children.
Measurement in Physical Education and Exercise Science, 8(2), 109 - 116.
Batt, M. E. (2009). Physical activity interventions in the workplace: the rationale and
future direction for workplace wellness. British Journal of Sports Medicine
43(1), 47-48.
Bauman, A., Armstrong, T., Davies, J., Owen, N., Brown, W., Bellew, B., & Vita, P.
(2003). Trends in physical activity participation and the impact of integrated
campaigns among Australian adults, 1997-99. Australian and New Zealand
journal of public health, 27(1), 76-79.
Beers, E. A., Roemmich, J. N., Epstein, L. H., & Horvath, P. J. (2008). Increasing
passive energy expenditure during clerical work. European Journal of Applied
Physiology 103(3), 353-360.
Benedict, M. A., & Arterburn, D. (2008). Worksite-based weight loss programs: a
systematic review of recent literature. American Journal of Health Promotion,
22(6), 408-416.
Bergström, A., Moradi, T., Lindblad, P., Nyrén, O., Adami, H.-O., & Wolk, A. (1999).
Occupational physical activity and renal cell cancer: A nationwide cohort study
in Sweden. International Journal of Cancer, 83(2), 186-191.
doi:10.1002/(sici)1097-0215(19991008)83:2<186::aid-ijc7>3.0.co;2-6

139
Berkey, C. S., Rockett, H. R. H., Gillman, M. W., & Colditz, G. A. (2003). One-year
changes in activity and in inactivity among 10- to 15-year-old boys and girls:
relationship to change in body mass index. Pediatrics, 111(4), 836-843.
Biddle, S. J., Gorely, T., Marshall, S. J., Murdey, I., & Cameron, N. (2004). Physical
activity and sedentary behaviours in youth: issues and controversies. J R Soc
Promot Health, 124(1), 29-33.
Blair, S. N., & Brodney, S. (1999). Effects of physical inactivity and obesity on
morbidity and mortality: current evidence and research issues. Medicine and
Science in Sports and Exercise, 31(11 Suppl), S646-662.
Blair, S. N., Collingwood, T. R., Reynolds, R., Smith, M., Hagan, R. D., & Sterling, C.
L. (1984). Health promotion for educators: impact on health behaviors,
satisfaction, and general well-being [Comparative Study]. American journal of
public health, 74(2), 147-149.
Booth, M. L., Owen, N., Bauman, A. E., & Gore, C. J. (1996). Retest reliability of
recall measures of leisure-time physical activity in Australian adults. Int J
Epidemiol, 25(1), 153-159.
Bowles, H. R., Morrow, J. R., Jr., Leonard, B. L., Hawkins, M., & Couzelis, P. M.
(2002). The association between physical activity behavior and commonly
reported barriers in a worksite population. Research Quarterly for Exercise and
Sport, 73(4), 464-470.
Braun, V., & Clarke, V. (2006). Using thematic analysis in psychology. Qualitative
Research in Psychology, 3(2), 77-101.
Bravata, D., Smith-Spangler, C., Sundaram, V., Gienger, A., Lin, N., Lewis, R., ...
Sirard, J. R. (2007). Using pedometers to increase physical activity and improve
health. JAMA, 298(19), 10. doi:10.1001
Bridges, S., & Searle, A. (2011). Changing workloads of primary school teachers: ‘I
seem to live on the edge of chaos’. School Leadership & Management, 31(5),
413-433. doi:10.1080/13632434.2011.614943
Brien, M., Hass, C., & Savoie, A. (2012). Psychological Health as a Mediator Between
Need Satisfaction at Work and Teachers' Self-Perceptions of Performance.
Canadian Journal of Behavioural Science, 44(4), 288-299.
doi:10.1037/a0028056
Brito, W. F., Santos, C. L., Marcolongo Ado, A., Campos, M. D., Bocalini, D. S.,
Antonio, E. L., ... Serra, A. J. (2012). Physical activity levels in public school
teachers [Research Support, Non-U.S. Gov't]. Revista de saude publica, 46(1),
104-109.
Brownson, R. C., Brennan, L. K., Evenson, K. R., & Leviton, L. C. (2012). Lessons
from a Mixed-Methods Approach to Evaluating Active Living by Design.
American journal of preventive medicine, 43(5, Supplement 4), S271-S280.
doi:http://dx.doi.org/10.1016/j.amepre.2012.07.002
Bruce, M. J., & Katzmarzyk, P. T. (2002). Canadian population trends in leisure-time
physical activity levels, 1981-1998. Canadian Journal of Applied Physiology,
27(6), 681-690.
Cale, L., & Harris, J. (2006). School-based physical activity interventions:
effectiveness, trends, issues, implications and recommendations for practice.
Sport, Education and Society, 11(4), 401-420. doi:10.1080/13573320600924890
Campbell, M. K., Tessaro, I., DeVellis, B., Benedict, S., Kelsey, K., Belton, L., &
Sanhueza, A. (2002). Effects of a tailored health promotion program for female
blue-collar workers: health works for women. Preventive Medicine, 34(3), 313-
323. doi:10.1006/pmed.2001.0988 S0091743501909880 [pii]

140
Cardinal, B. J. (2001). Role modeling attitudes and physical activity and fitness
promoting behaviors of HPERD professionals and preprofessionals. Research
Quarterly for Exercise and Sport, 72(1), 84-90.
Carson, R. L., Baumgartner, J. J., Matthews, R. A., & Tsouloupas, C. N. (2010).
Emotional exhaustion, absenteeism, and turnover intentions in childcare
teachers: examining the impact of physical activity behaviors [Research
Support, Non-U.S. Gov't]. Journal of health psychology, 15(6), 905-914.
doi:10.1177/1359105309360697
Caspersen, C. J., Powell, K. E., & Christenson, G. M. (1985). Physical activity,
exercise, and physical fitness: definitions and distinctions for health-related
research. Public Health Rep, 100(2), 126-131.
Castillo, M., Cruz, C., Garcia, P., Jaque, J., & Morales, V. (2010). Aplicacion de un
programa de pausas laborales activas en funcionarios universitarios chilenos
[Original]. Ciencias de la Actividad Fisica UCM, 11, 8.
Cavill, N., Kahlmeier, S., & Racioppi, F. (2006). Physical activity and health in
Europe: evidence for action. Denmark.
Cerecero, P., Hernández, B., Aguirre, D., Valdés, R., & Huitrón, G. (2009). Estilos de
vida asociados al riesgo cardiovascular global en trabajadores universitarios del
Estado de México. Salud Pública de México, 51, 465-473.
Chaiklieng, S., & Suggaravetsiri, P. (2012). Risk factors for repetitive strain injuries
among school teachers in Thailand. Work: A Journal of Prevention, Assessment
and Rehabilitation, 41(0), 2510-2515. doi:10.3233/wor-2012-0491-2510
Chan, C. B., Ryan, D. A., & Tudor-Locke, C. (2004). Health benefits of a pedometer-
based physical activity intervention in sedentary workers. Preventive Medicine,
39(6), 1215-1222.
Chen, K. Y., Acra, S. A., Donahue, C. L., Sun, M., & Buchowski, M. S. (2004).
Efficiency of walking and stepping: relationship to body fatness [Research
Support, U.S. Gov't, P.H.S.]. Obesity research, 12(6), 982-989.
doi:10.1038/oby.2004.120
Cheung, P. P. Y., & Chow, B. C. (2006). Intervention to increase school teachers'
occupational physical activity level. Research Quarterly for Exercise and Sport,
77(1), A85-A85.
Cheung, P. Y., Chow, B. C., & Parfitt, G. (2008). Using environmental stimuli in
physical activity intervention for school teachers: a pilot study. International
Electronic Journal of Health Education, 11, 47-56.
Chobanian, A. V., Bakris, G. L., Black, H. R., Cushman, W. C., Green, L. A., Izzo, J.
L., ... Committee, t. N. H. B. P. E. P. C. (2003). Seventh Report of the Joint
National Committee on Prevention, Detection, Evaluation, and Treatment of
High Blood Pressure. Hypertension, 42(6), 1206-1252.
doi:10.1161/01.HYP.0000107251.49515.c2
Cook, C., Simmons, G., Swinburn, B., & Stewart, J. (2001). Changing risk behaviours
for non-communicable disease in New Zealand working men--is workplace
intervention effective? New Zealand Medical Journal, 114(1130), 175-178.
Cooper, J. A., Watras, A. C., O'Brien, M. J., Luke, A., Dobratz, J. R., Earthman, C. P.,
& Schoeller, D. A. (2009). Assessing validity and reliability of resting metabolic
rate in six gas analysis systems. J Am Diet Assoc, 109(1), 128-132. doi:S0002-
8223(08)01881-6 [pii] 10.1016/j.jada.2008.10.004
Costa, B., & Silva, N. (2012). Analysis of environmental factors affecting the quality of
teacher's life of public schools from Umuarama. Work, 41, 8.
doi:10.3233/WOR-2012-0673-3693

141
Craig, C. L., Marshall, A. L., Sjostrom, M., Bauman, A. E., Booth, M. L., Ainsworth, B.
E., ... Oja, P. (2003). International physical activity questionnaire: 12-country
reliability and validity. Medicine and Science in Sports and Exercise, 35(8),
1381-1395.
Crouter, S. E., Schneider, P. L., Karabulut, M., & Bassett, D. R., Jr. (2003). Validity of
10 electronic pedometers for measuring steps, distance, and energy cost. Med
Sci Sports Exerc, 35(8), 1455-1460.
doi:10.1249/01.MSS.0000078932.61440.A2
D'Agostino, R. B., Sr., Vasan, R. S., Pencina, M. J., Wolf, P. A., Cobain, M., Massaro,
J. M., & Kannel, W. B. (2008). General cardiovascular risk profile for use in
primary care: the Framingham Heart Study [Research Support, N.I.H.,
Extramural Research Support, Non-U.S. Gov't]. Circulation, 117(6), 743-753.
doi:10.1161/CIRCULATIONAHA.107.699579
da Silva, N. R., & Almeida, M. A. (2012). Physical and postural aspects of teachers
during work activity. Work-a Journal of Prevention Assessment &
Rehabilitation, 41, 3657-3662. doi:10.3233/wor-2012-0005-3657
Daniel, M., Marion, S. A., Sheps, S. B., Hertzman, C., & Gamble, D. (1999). Variation
by body mass index and age in waist-to-hip ratio associations with glycemic
status in an aboriginal population at risk for type 2 diabetes in British Columbia,
Canada. The American journal of clinical nutrition, 69(3), 455-460.
Davey, R., Hurst, G., Smith, G., Grogan, S., & Kurth, J. (2011). The impact and process
of a community-led intervention on reducing environmental inequalities related
to physical activity and healthy eating - a pilot study. BMC public health, 11(1),
697.
Davies, H. T. O., Crombie, I. K., & Tavakoli, M. (1998). When can odds ratios
mislead? BMJ, 316(7136), 989-991. doi:10.1136/bmj.316.7136.989
Demographic and Statistical Analysis Unit. (2005). 2004 Teacher Census. Report on the
findings of the 2004 teachers census. Wellington - New Zealand: Ministry of
Education.
Department of Health and Children, H. S. E. (2009). The National Guidelines on
Physical Activity for Ireland.
Dishman, R. K., DeJoy, D. M., Wilson, M. G., & Vandenberg, R. J. (2009). Move to
Improve: a randomized workplace trial to increase physical activity. American
Journal of Preventive Medicine, 36(2), 133-141.
Dishman, R. K., Oldenburg, B., O'Neal, H., & Shephard, R. J. (1998). Worksite
physical activity interventions. American Journal of Preventive Medicine, 15(4),
344-361.
Dishman, R. K., & Steinhardt, M. (1988). Reliability and concurrent validity for a 7-d
re-call of physical activity in college students. Med Sci Sports Exerc, 20(1), 14-
25.
Easthope, C., & Easthope, G. (2000). Intensification, Extension and Complexity of
Teachers' Workload. British Journal of Sociology of Education, 21(1), 43-58.
doi:10.1080/01425690095153
Education Review Office. (2013). What is a decile ranking or rating? Retrieved
20/03/2013, 2013, from http://www.ero.govt.nz/Help/FAQs
Ejere, E. I. (2010). Absence from Work: A Study of Teacher Absenteeism in Selected
Public Primary Schools in Uyo, Nigeria. International Journal of Business and
Management, 5(9), 115-123.
Epstein, L. H., & Roemmich, J. N. (2001). Reducing sedentary behavior: role in
modifying physical activity. Exercise and Sport Sciences Reviews, 29(3), 103-
108.

142
Escobar, M., & Obreque, A. Implementación del enfoque de riesgo en el programa de
salud cardiovascular. Ministerio de Salud, Gobierno de Chile. Retrieved from
http://www.minsal.gob.cl/portal/url/item/787e4765248bc9e0e04001011f0172b5.
Esliger, D. W., Probert, A., Gorber, S. C., Bryan, S., Laviolette, M., & Tremblay, M. S.
(2007). Validity of the Actical accelerometer step-count function [Validation
Studies]. Medicine and science in sports and exercise, 39(7), 1200-1204.
doi:10.1249/mss.0b013e3804ec4e9
Eves, F. F., & Webb, O. J. (2006). Worksite interventions to increase stair climbing;
reasons for caution. Preventive Medicine, 43(1), 4-7.
Eves, F. F., Webb, O. J., & Mutrie, N. (2006). A workplace intervention to promote
stair climbing: greater effects in the overweight. Obesity (Silver Spring), 14(12),
2210-2216.
Faghri, P. D., Omokaro, C., Parker, C., Nichols, E., Gustavesen, S., & Blozie, E.
(2008). E-technology and pedometer walking program to increase physical
activity at work. The Journal of Primary Prevention, 29(1), 73-91.
Fox, K. R., Cooper, A., & McKenna, J. (2004). The school and promotion of children's
health-enhancing physical activity: perspectives from the United Kingdom.
Journal of Teaching in Physical Education, 23(4), 338-358.
Gilson, N. (2008). The international universities walking project: employee step counts,
sitting times and health status. [Journal]. International Journal of Workplace
Health Management, 1(3), 152-161.
Grundy, S. M., Pasternak, R., Greenland, P., Smith, S., Jr., & Fuster, V. (1999).
Assessment of cardiovascular risk by use of multiple-risk-factor assessment
equations: a statement for healthcare professionals from the American Heart
Association and the American College of Cardiology [Review]. Circulation,
100(13), 1481-1492.
Hamilton, M. T., Hamilton, D. G., & Zderic, T. W. (2007). Role of low energy
expenditure and sitting in obesity, metabolic syndrome, type 2 diabetes, and
cardiovascular disease. Diabetes, 56(11), 2655-2667. doi:db07-0882 [pii]
10.2337/db07-0882
Hamilton, M. T., Healy, G. N., Dunstan, D. W., Zderic, T. W., & Owen, N. (2008). Too
Little Exercise and Too Much Sitting: Inactivity Physiology and the Need for
New Recommendations on Sedentary Behavior. Current cardiovascular risk
reports, 2(4), 292-298. doi:10.1007/s12170-008-0054-8
Hargreaves, D. H. (1995). School Culture, School Effectiveness and School
Improvement. School Effectiveness and School Improvement, 6(1), 23-46.
doi:10.1080/0924345950060102
Hartvigsen, J., Leboeuf-Yde, C., Lings, S., & Corder, E. H. (2000). Is sitting-while-at-
work associated with low back pain? A systematic, critical literature review.
Scandinavian Journal of Public Health 28(3), 230-239.
Harvey, R. A. (1978). Factors Affecting Productivity. Journal of Applied Statistics,
5(1), 95-110. doi:10.1080/768371051
Healy, G. N., Dunstan, D. W., Salmon, J., Cerin, E., Shaw, J. E., Zimmet, P. Z., &
Owen, N. (2008). Breaks in sedentary time: beneficial associations with
metabolic risk [Research Support, Non-U.S. Gov't]. Diabetes care, 31(4), 661-
666. doi:10.2337/dc07-2046
Healy, G. N., Wijndaele, K., Dunstan, D. W., Shaw, J. E., Salmon, J., Zimmet, P. Z., &
Owen, N. (2008). Objectively measured sedentary time, physical activity, and
metabolic risk: the Australian Diabetes, Obesity and Lifestyle Study (AusDiab)

143
[Multicenter Study Research Support, Non-U.S. Gov't]. Diabetes Care, 31(2),
369-371. doi:10.2337/dc07-1795
Heil, D. P. (2006). Predicting activity energy expenditure using the Actical activity
monitor [Research Support, Non-U.S. Gov't]. Research Quarterly for Exercise
and Sport, 77(1), 64-80.
Hopkins, W. (2006). Estimating Sample Size for Magnitude-Based Inferences.
Sportsciences, 10, 8.
Hopkins, W. G., Marshall, S. W., Batterham, A. M., & Hanin, J. (2009). Progressive
statistics for studies in sports medicine and exercise science [Review]. Medicine
and science in sports and exercise, 41(1), 3-13.
doi:10.1249/MSS.0b013e31818cb278
ISAK. (2001). International Standards for Anthropometric Assessment (First ed.): The
International Society for the Advancement of Kinanthropometry.
Jamner, M. S., & Cooper, D. M. (2002). Reliability and Validity of the 3-Day Physical
Activity Recall (Sdpar) Among Low-Active Adolescent Females. Medicine &
Science in Sports & Exercise, 34(5), S143.
Jans, M. P., Proper, K. I., & Hildebrandt, V. H. (2007). Sedentary behavior in Dutch
workers: differences between occupations and business sectors. American
Journal of Preventive Medicine, 33(6), 450-454.
Johnson, R. B., & Onwuegbuzie, A. J. (2004). Mixed Methods Research: A Research
Paradigm Whose Time Has Come. Educational Researcher, 33(7), 14-26.
doi:10.3102/0013189x033007014
Jules, V., & Kutnick, P. (1997). Student perceptions of a good teacher: the gender
perspective [Article]. British Journal of Educational Psychology, 67(4), 497-
511.
Kaleta, D., & Jegier, A. (2005). Occupational energy expenditure and leisure-time
physical activity. International Journal of Occupational Medicine and
Environmental Health, 18(4), 351-356.
Kaleta, D., Makowiec-Dabrowska, T., & Jegier, A. (2007). Occupational and leisure-
time energy expenditure and body mass index. International Journal of
Occupational Medicine and Environmental Health 20(1), 9-16.
Karon, B., Gandhi, G., Nuttal, G., Bryant, S., Schaff, H., McMahon, M., & Santrach, P.
(2007). Accuracy of Roche Accu-Chek inform whole blood capillary, arterial,
and venous glucose values in patients receiving intensive intravenous insulin
therapy after cardiac surgery. American Journal of Clinical Pathology, 127, 8.
doi:10.1309/6RFQCKAAJGKWB8M4
Katzmarzyk, P. T., Church, T. S., Craig, C. L., & Bouchard, C. (2009). Sitting time and
mortality from all causes, cardiovascular disease, and cancer [Research Support,
Non-U.S. Gov't]. Medicine and Science in Sports and Exercise, 41(5), 998-1005.
doi:10.1249/MSS.0b013e3181930355
Kent, S. I. (2000). Problems of beginning teachers: Comparing graduates of bachelor's
and master's level teacher preparation programs. The Teacher Educator, 35(4),
83-96. doi:10.1080/08878730009555239
Kessler, R., Barber, C., Beck, A., Berglund, P., Cleary, P., McKenas, D., ... Wang, P.
(2003). The World Health Organization Health and Work Performance
Questionnaire (HPQ). Journal of Occupational and Environmental Medicine,
45, 19.
Kessler, R., Petukhova, M., & McInnes, K., &. (2007). Content and scoring rules for
the WHO HPQ absenteeism and presenteeism questions: Harvard Medical
School.
144
Kessler, R. C., Barber, C., Beck, A., Berglund, P., Cleary, P. D., McKenas, D., ...
Ustun, T. B. (2003). The world health organization health and work
performance questionnaire (HPQ). Journal of Occupational and Environmental
Medicine, 45(2), 156-174.
Kilanowski, C. K., Consalvi, A. R., & Epstein, L. H. (1999). Validation of an electronic
pedometer for measurement of physical activity in children. Pediatric Exercise
Science, 11(1), 63-68.
Kohl, H., Fulton, J., & Caspersen, C. (2000). Assessment of Physical Activity among
Children and Adolescents: A Review and Synthesis. Preventive Medicine, 31,
S54 - S76. doi:10.1006/pmed.1999.0542
Kohl, H. W., Craig, C. L., Lambert, E. V., Inoue, S., Alkandari, J. R., Leetongin, G., &
Kahlmeier, S. (2012). The pandemic of physical inactivity: global action for
public health. The Lancet.
Kruger, J., Yore, M. M., Ainsworth, B. E., & Macera, C. A. (2006). Is participation in
occupational physical activity associated with lifestyle physical activity levels?
Journal of Occupational and Environmental Medicine 48(11), 1143-1148.
Ku, P.-W., Fox, K. R., McKenna, J., & Peng, T.-L. (2006). Prevalence of leisure-time
physical activity in Taiwanese adults: Results of four national surveys, 2000–
2004. Preventive Medicine, 43(6), 454-457.
doi:http://dx.doi.org/10.1016/j.ypmed.2006.04.011
Laaksonen, D. E., Lakka, H.-M., Lakka, T. A., Niskenen, L. K., Rauramaa, R., &
Salonen, J. T. (2002, 2002/09//). Low levels of leisure-time physical activity and
cardiorespiratory fitness predict development of the metabolic syndrome.
(Pathophysiology/Complications) [Article]. Diabetes care, 25(9), 1612+.
Retrieved 2013/3/23/ Retrieved from
http://go.galegroup.com/ps/i.do?id=GALE%7CA91485352&v=2.1&u=aut&it=r
&p=EAIM&sw=w
LaMaster, K., McKenzie, T. L., Marshall, S., & Sallis, J. F. (1998). Habitual Physical
Activity of Classroom Teachers: Does It Relate to Their Conduct of Physical
Education Classes? [Report - Research]. Non-Journal, 7.
Lee, C. (1992). Getting fit: A minimal intervention for aerobic ecercise. Behaviour
change, 9(4), 6.
Levine, J. A. (2002). Non-exercise activity thermogenesis (NEAT). Best Pract Res Clin
Endocrinol Metab, 16(4), 679-702. doi:S1521690X02902277 [pii]
Levine, J. A. (2007). Nonexercise activity thermogenesis--liberating the life-force. J
Intern Med, 262(3), 273-287.
Levine, J. A., Lanningham-Foster, L. M., McCrady, S. K., Krizan, A. C., Olson, L. R.,
Kane, P. H., ... Clark, M. M. (2005). Interindividual variation in posture
allocation: possible role in human obesity. Science, 307(5709), 584-586.
Levine, J. A., McCrady, S. K., Lanningham-Foster, L. M., Kane, P. H., Foster, R. C., &
Manohar, C. U. (2008). The role of free-living daily walking in human weight
gain and obesity. Diabetes, 57(3), 548-554.
Levine, J. A., & Miller, J. M. (2007). The energy expenditure of using a "walk-and-
work" desk for office workers with obesity. British Journal of Sports Medicine,
41(9), 558-561.
Livingstone, M. B. E., Robson, P. J., Wallace, J. M. W., & McKinley, M. C. (2003).
How active are we? Levels of routine physical activity in children and adults.
Proceedings of the Nutrition Society, 62(03), 681-701.
doi:doi:10.1079/PNS2003291

145
Luley, C., Ronquist, G., Reuter, W., Paal, V., Gottshling, H., Westphal, S., ... Hattemer,
A. (2000). Point-of-Care testing of triglycerides: Evaluation of the Accutrend
Triglycerides System. Clinical Chemistry, 46(2), 4.
Macintyre, S., Ellaway, A., & Cummins, S. (2002). Place effects on health: how can we
conceptualise, operationalise and measure them? [Research Support, Non-U.S.
Gov't Review]. Social science & medicine, 55(1), 125-139.
Macko, R. F., Haeuber, E., Shaughnessy, M., Coleman, K. L., Boone, D. A., Smith, G.
V., & Silver, K. H. (2002). Microprocessor-based ambulatory activity
monitoring in stroke patients. Med Sci Sports Exerc, 34(3), 394-399.
Marcus, B. H., Banspach, S. W., Lefebvre, R. C., Rossi, J. S., Carleton, R. A., &
Abrams, D. B. (1992). Using the stages of change model to increase the
adoption of physical activity among community participants [Research Support,
U.S. Gov't, P.H.S.]. American journal of health promotion : AJHP, 6(6), 424-
429.
Marshall, A. L. (2004). Challenges and opportunities for promoting physical activity in
the workplace. Journal of Science and Medicine in Sport 7(1 Suppl), 60-66.
Martin, J., & Altman, D. (2000). The odds ratio. BMJ(320).
Martin, J. J., & Kulinna, P. H. (2005). A social cognitive perspective of physical-
activity-related behavior in physical education. Journal of Teaching in Physical
Education, 24(3), 265-281.
McAlpine, D. A., Manohar, C. U., McCrady, S. K., Hensrud, D., & Levine, J. A.
(2007). An office-place stepping device to promote workplace physical activity.
British Journal of Sports Medicine 41(12), 903-907.
Melanson, E. L., Jr., & Freedson, P. S. (1995). Validity of the Computer Science and
Applications, Inc. (CSA) activity monitor. Med Sci Sports Exerc, 27(6), 934-
940.
Messing, K., Caroly, S., & Riel, J. (2011). Counting the minutes: Administrative control
of work schedules and time management of secondary school teachers in
Québec. Work, 40, 59-70.
Milkman, M. (1997). Teachers' Unions, Productivity, and Minority Student
Achievement. Journal of Labor Research, 18(1), 137-150.
Miller, R., & Brown, W. (2004). Steps and sitting in a working population.
International Journal of Behavioral Medicine, 11(4), 219-224.
Ministry of Education, N. Z., &. (2007). The New Zealand Curriculum.
Ministry of Health. (2003). Nutrition and the Burden of Disease: New Zealand 1997 -
2011. Wellington: Ministry of Helath. Retrieved from
http://www.moh.govt.nz/notebook/nbbooks.nsf/0/A8D85BC5BAD17610CC256
D970072A0AA/$file/nutritionandtheburdenofdisease.pdf
Ministry of Health. (2012). The Health of New Zealand Adults 2011/12: Key findings of
the New Zealand Health Survey. . Wellington: Ministry of Health.
Ministry of Health, R. o. S. (2007). National Health Enhancing Physical Activity
Programme 2007 - 2012. Ljubljana.
Monteiro, C. A., Conde, W. L., Matsudo, S. M., Matsudo, V. R., Bonseñor, I. M., &
Lotufo, P. A. (2003). A descriptive epidemiology of leisure-time physical
activity in Brazil, 1996-1997. Revista Panamericana de Salud Pública, 14, 246-
254.
Moses, R. G., Calvert, D., & Storlien, L. H. (1996). Evaluation of the accutrend GCT
with respect to triglyceride monitoring (letter). Diabetes Care, 19(11), 1.
Mummery, W. K., Schofield, G. M., Steele, R., Eakin, E. G., & Brown, W. J. (2005).
Occupational sitting time and overweight and obesity in Australian workers.
American Journal of Preventive Medicine 29(2), 91-97.

146
Murphy, M. H., Murtagh, E. M., Boreham, C. A., Hare, L. G., & Nevill, A. M. (2006).
The effect of a worksite based walking programme on cardiovascular risk in
previously sedentary civil servants [NCT00284479]. BMC Public Health, 6,
136.
Mutrie, N., Carney, C., Blamey, A., Crawford, F., Aitchison, T., & Whitelaw, A.
(2002). "Walk in to Work Out": a randomised controlled trial of a self help
intervention to promote active commuting. Journal of Epidemiology and
Community Health, 56(6), 407-412.
National Heart, L., and Blood Institute. (2002). Detection, evaluation, and treatment of
high blood and cholesterol in adults (Adults Treatment Panel III): National
Institutes of Health.
O'Loughlin, J., Renaud, L., Paradis, G., & Meshefedjian, G. (1996). Screening school
personnel for cardiovascular disease risk factors: short-term impact on behavior
and perceived role as promoters of heart health. Preventive Medicine, 25(6),
660-667.
Okamoto, N., Nakatani, T., Okamoto, Y., Iwamoto, J., Saeki, K., & Kurumatani, N.
(2010). Increasing the number of steps walked each day improves physical
fitness in Japanese community-dwelling adults [Randomized Controlled Trial].
International journal of sports medicine, 31(4), 277-282. doi:10.1055/s-0029-
1234057
Paffenbarger, R. S., Jr., Blair, S. N., Lee, I. M., & Hyde, R. T. (1993). Measurement of
physical activity to assess health effects in free-living populations [Research
Support, U.S. Gov't, P.H.S.]. Medicine and science in sports and exercise, 25(1),
60-70.
Pate, R. e. a. (1995). Physical activity and public health. A recoomendation from the
centers for disease control and prevention and the american college of sport
medicine. JAMA, 273(5), 6.
Pate, R. R., O'Neill, J. R., & Lobelo, F. (2008). The evolving definition of "sedentary".
Exercise and sport sciences reviews, 36(4), 173-178.
doi:10.1097/JES.0b013e3181877d1a
Pate, R. R., Ward, D. S., Saunders, R. P., Felton, G., Dishman, R. K., & Dowda, M.
(2005). Promotion of physical activity among high-school girls: a randomized
controlled trial [Clinical Trial Randomized Controlled Trial Research Support,
N.I.H., Extramural Research Support, U.S. Gov't, P.H.S.]. American Journal of
Public Health, 95(9), 1582-1587. doi:10.2105/AJPH.2004.045807
Philippaerts, R. M., Westerterp, K. R., & Lefevre, J. (2001). Comparison of two
questionnaires with a tri-axial accelerometer to assess physical activity patterns.
Int J Sports Med, 22(1), 34-39. doi:10.1055/s-2001-11359
Pickering, T. G., Hall, J. E., Appel, L. J., Falkner, B. E., Graves, J., Hill, M. N., ...
Roccella, E. J. (2005). Recommendations for Blood Pressure Measurement in
Humans and Experimental Animals: Part 1: Blood Pressure Measurement in
Humans: A Statement for Professionals From the Subcommittee of Professional
and Public Education of the American Heart Association Council on High Blood
Pressure Research. Hypertension, 45(1), 142-161.
doi:10.1161/01.HYP.0000150859.47929.8e
Pihl, E., Matsin, T., & Jurimae, T. (2002). Physical activity, musculoskeletal disorders
and cardiovascular risk factors in male physical education teachers. Journal of
Sports Medicine and Physical Fitness, 42(4), 466-471.
Pitney, W. A., & Parker, J. (2009). Qualitative research in physical activity and the
health professions: Human Kinetics.

147
Pitsavos, C., Panagiotakos, D., Lentzas, Y., & Stefanadis, C. (2005). Epidemiology of
leisure-time physical activity in socio-demographic, lifestyle and psychological
characteristics of men and women in Greece: the ATTICA Study. BMC public
health, 5(1), 37.
Plotnikoff, R. C., McCargar, L. J., Wilson, P. M., & Loucaides, C. A. (2005). Efficacy
of an E-mail intervention for the promotion of physical activity and nutrition
behavior in the workplace context. American Journal of Health Promotion,
19(6), 422-429.
Plotnikoff, R. C., Prodaniuk, T. R., Fein, A. J., & Milton, L. (2005). Development of an
ecological assessment tool for a workplace physical activity program standard.
Health Promotion Practice, 6(4), 453-463.
Poobalan, A., Aucott, L., Clarke, A., & Smith, W. C. (2012). Physical activity attitudes,
intentions and behaviour among 18-25year olds: A mixed method study. BMC
public health, 12(1), 640.
Prais, D. (2006). JBS2 CV risk assessor [UK: Univerisity of Manchester.
Prokosch, A., Dalleck, L., & Pettit, R. (2011). Cardiac risk factors between farmenrs
and non-farmers. Journal of Exercise Physiology on line, 14(3), 10.
Proper, K. I., Heymans, M. W., Chin, A. P. M. J., van Sluijs, E. M., van Poppel, M. N.,
& van Mechelen, W. (2006). Promoting physical activity with people in
different places--a Dutch perspective. Journal of Science and Medicine in Sport
/ Sports Medicine Australia, 9(5), 371-377.
Proper, K. I., & Hildebrandt, V. H. (2006). Physical activity among Dutch workers--
differences between occupations. Preventive Medicine, 43(1), 42-45.
Proper, K. I., Staal, B. J., Hildebrandt, V. H., van der Beek, A. J., & van Mechelen, W.
(2002). Effectiveness of physical activity programs at worksites with respect to
work-related outcomes. Scandinavian Journal of Work, Environment & Health,
28(2), 75-84.
Prosser, R. A., Thomas, A. C., & Darling-Fisher, C. S. (2007). Physical activity
intervention in an academic setting: focus group results. AAOHN Journal,
55(11), 448-453.
Puig-Ribera, A., McKenna, J., Gilson, N., & Brown, W. J. (2008). Change in work day
step counts, wellbeing and job performance in Catalan university employees: a
randomised controlled trial. Promotion & Education, 15(4), 11-16.
Quarmby, T., Dagkas, S., & Bridge, M. (2011). Associations between children's
physical activities, sedentary behaviours and family structure: a sequential
mixed methods approach. Health Education Research, 26(1), 63-76.
doi:10.1093/her/cyq071
Rani, M., Figueroa, M. E., & Ainsle, R. (2003). The psychosocial context of young
adult sexual behavior in Nicaragua: looking through the gender lens
[Comparative Study Research Support, U.S. Gov't, Non-P.H.S.]. International
family planning perspectives, 29(4), 174-181. doi:10.1363/ifpp.29.174.03
Reichert, F. F., Barros, A. J., Domingues, M. R., & Hallal, P. C. (2007). The role of
perceived personal barriers to engagement in leisure-time physical activity
[Research Support, Non-U.S. Gov't]. American journal of public health, 97(3),
515-519. doi:10.2105/AJPH.2005.070144
Reilly, J. J., Penpraze, V., Hislop, J., Davies, G., Grant, S., & Paton, J. Y. (2008).
Objective measurement of physical activity and sedentary behaviour: review
with new data [Review]. Archives of Disease in Childhood, 93(7), 614-619.
doi:10.1136/adc.2007.133272

148
Renaud, L., Kishchuk, N., Juneau, M., Nigam, A., Tereault, K., & Leblanc, M. C.
(2008). Implementation and outcomes of a comprehensive worksite health
promotion program. Canadian Journal of Public Health, 99(1), 73-77.
Resnicow, K., Davis, M., Smith, M., Baranowski, T., Lin, L. S., Baranowski, J., ...
Wang, D. T. (1998). Results of the TeachWell worksite wellness program
[Clinical Trial Randomized Controlled Trial Research Support, U.S. Gov't,
P.H.S.]. American journal of public health, 88(2), 250-257.
Ribera, A. P., McKenna, J., & Riddoch, C. (2005). Attitudes and practices of physicians
and nurses regarding physical activity promotion in the Catalan primary health-
care system. The European Journal of Public Health, 15(6), 569-575.
doi:10.1093/eurpub/cki045
Roldán Aguilar, E. E., Lopera Zapata, M. H., Londoño Giraldo, F. J., Cardeño Tejada,
J. L., & Zapata Vidales, S. A. (2008). Análisis descriptivo de las variables: nivel
de actividad física, depresión y riesgos cardiovasculares en empleados y
docentes de una institución universitaria en Medellín (Colombia) [Trabajo
Original]. APUNTS, Medicina de L'Esport, 43(158), 7.
Ruiz-Tendero, G., Salinero-Martin, J. J., Webster, A. L., & Aznar-Lain, S. (2006).
Measurement of physical activity levels of workers on a Spanish university
campus using accelerometry technology. Journal of Human Movement Studies,
51(5), 15.
Ryan, C. G., Grant, P. M., Tigbe, W. W., & Granat, M. H. (2006). The validity and
reliability of a novel activity monitor as a measure of walking. British journal of
sports medicine, 40(9), 779-784. doi:10.1136/bjsm.2006.027276
Salmon, J., Ball, K., Crawford, D., Booth, M., Telford, A., Hume, C., ... Worsley, A.
(2005). Reducing sedentary behaviour and increasing physical activity among
10-year-old children: overview and process evaluation of the 'Switch-Play'
intervention. Health promotion international, 20(1), 7-17.
Salmon, J., Bauman, A., Crawford, D., Timperio, A., & Owen, N. (2000). The
association between television viewing and overweight among Australian adults
participating in varying levels of leisure-time physical activity [Article].
International Journal of Obesity & Related Metabolic Disorders, 24(5), 600.
Salmon, J., Owen, N., Crawford, D., Bauman, A., & Sallis, J. F. (2003). Physical
activity and sedentary behavior: a population-based study of barriers,
enjoyment, and preference [Research Support, Non-U.S. Gov't]. Health
psychology : official journal of the Division of Health Psychology, American
Psychological Association, 22(2), 178-188.
Salmon, P. (2001). Effects of physical exercise on anxiety, depression, and sensitivity to
stress: a unifying theory. Clin Psychol Rev, 21(1), 33-61. doi:S0272-
7358(99)00032-X [pii]
Sandmark, H., Wiktorin, C., Hogstedt, C., Klenell-Hatschek, E.-K., & Vingård, E.
(1999). Physical work load in physical education teachers. Applied Ergonomics,
30(5), 435-442. doi:http://dx.doi.org/10.1016/S0003-6870(98)00048-9
Saris, W. H., Blair, S. N., van Baak, M. A., Eaton, S. B., Davies, P. S., Di Pietro, L., ...
Wyatt, H. (2003). How much physical activity is enough to prevent unhealthy
weight gain? Outcome of the IASO 1st Stock Conference and consensus
statement [Consensus Development Conference Research Support, Non-U.S.
Gov't Review]. Obesity reviews : an official journal of the International
Association for the Study of Obesity, 4(2), 101-114.
SBRN. (2012). Standardized use of the terms “sedentary” and “sedentary behaviours”.
Applied Physiology, Nutrition and Metabolism 37, 3.

149
Schneider, P. L., Crouter, S. E., Lukajic, O., & Bassett, D. R., Jr. (2003). Accuracy and
reliability of 10 pedometers for measuring steps over a 400-m walk. Med Sci
Sports Exerc, 35(10), 1779-1784. doi:10.1249/01.MSS.0000089342.96098.C4
Schofield, G., Badlands, H., & Oliver, M. (2005). Objectively-measured physical
activity in New Zealand workers. Journal of Science and Medicine in Sport /
Sports MEdicine Australia, 8(2), 143-151.
Services, U. S. D. o. H. a. H. (1996). Physical Activity and Health: A report of the
surgeon general. Atlanta.
Shaw, G., Alfonso, H., Howat, P., & Corben, K. (2007). Use of pedometers in a
workplace physical activity program. Australasian Journal of Podiatric
Medicine, 41(2), 6.
Sirard, J. R., & Pate, R. R. (2001). Physical activity assessment in children and
adolescents. Sports Medicine (Auckland, NZ), 31(6), 439-454.
Smith, M., & Bourke, S. (1992). Teacher stress: Examining a model based on context,
workload, and satisfaction. Teaching and Teacher Education, 8(1), 31-46.
doi:http://dx.doi.org/10.1016/0742-051X(92)90038-5
Smith, M., Conway, F., & Karsh, B. (1999). Occupational stress in human computer
interaction. Industrial Health, 37(2), 157-173.
Sobti, A., Cooper, C., Inskip, H., Searle, S., & Coggon, D. (1997). Occupational
physical activity and long-term risk of musculoskeletal symptoms: a national
survey of post office pensioners. American Journal of Industrial Medicine,
32(1), 76-83.
Society, B. C., Society, B. H., UK, D., UK, H., Society, P. C. C., & Association, T. S.
(2005). JBS 2: Joint British Societies' Guidelines on Prevention of
Cardiovascular Disease in Clinical Practice. HEART and Education in Heart,
91(suppl 5), 51. doi:10.1136/hrt.2005.079988
Spittaels, H., De Bourdeaudhuij, I., Brug, J., & Vandelanotte, C. (2007). Effectiveness
of an online computer-tailored physical activity intervention in a real-life
setting. Health Education Research, 22(3), 385-396.
St Leger, L. (2004). What's the place of schools in promoting health? Are we too
optimistic? Health promotion international, 19(4), 405-408.
doi:10.1093/heapro/dah401
Steele, R., & Mummery, K. (2003). Occupational physical activity across occupational
categories. Journal of Science and Medicine in Sport / Sports Medicine
Austtralia, 6(4), 398-407.
Takao, S., Kawakami, N., & Ohtsu, T. (2003). Occupational class and physical activity
among Japanese employees. Social Sciences and Medicine, 57(12), 2281-2289.
Thomas, J., Nelson, J., & Silverman, S. (2005). Research methods in physical activity:
Human Kinetics.
Thomas, L., & Williams, M. (2006). Promoting physical activity in the workplace:
using pedometers to increase daily activity levels. Health Promotion Journal of
Australia, 17(2), 97-102.
Thompson, W. G., Foster, R. C., Eide, D. S., & Levine, J. A. (2008). Feasibility of a
walking workstation to increase daily walking. British Journal of Sports
Medicine, 42(3), 225-228; discussion 228.
Till, J., Ferkins, L., & Handcock, P. (2011). Physical activity based professional
development for teachers: The importance of whole school environment. Health
Education Journal, 70(2), 225-235. doi:10.1177/0017896910396218
Trost, S. G., McIver, K. L., & Pate, R. R. (2005). Conducting accelerometer-based
activity assessments in field-based research [Comparative Study Review].
Medicine and science in sports and exercise, 37(11 Suppl), S531-543.

150
Tudor-Locke, C., & Bassett, D. R., Jr. (2004). How many steps/day are enough?
Preliminary pedometer indices for public health [Review]. Sports medicine,
34(1), 1-8.
Tudor-Locke, C., Burton, N. W., & Brown, W. J. (2009). Leisure-time physical activity
and occupational sitting: Associations with steps/day and BMI in 54-59 year old
Australian women [Research Support, Non-U.S. Gov't]. Preventive Medicine,
48(1), 64-68. doi:10.1016/j.ypmed.2008.10.016
Tudor-Locke, C., Ham, S. A., Macera, C. A., Ainsworth, B. E., Kirtland, K. A., Reis, J.
P., & Kimsey, C. D., Jr. (2004). Descriptive epidemiology of pedometer-
determined physical activity [Research Support, Non-U.S. Gov't Research
Support, U.S. Gov't, P.H.S.]. Medicine and science in sports and exercise, 36(9),
1567-1573.
Tudor-Locke, C., Johnson, W. D., & Katzmarzyk, P. T. (2009). Accelerometer-
determined steps per day in US adults. Medicine and Science in Sports and
Exercise, 41(7), 1384-1391. doi:10.1249/MSS.0b013e318199885c
Tudor-Locke, C., Williams, J. E., Reis, J. P., & Pluto, D. (2002). Utility of pedometers
for assessing physical activity: convergent validity [Research Support, Non-U.S.
Gov't Review]. Sports medicine, 32(12), 795-808.
Uribe Velez, Y., Dosman Gonzalez, V., Trivino Quintero, L., Agredo Zuniga, R., Jerez
Valderrama, A., & Ramirez-Velez, R. (2010). Relacion entre la capacidad fisica
y la calidad de vida en trabajadores de una institucion universitaria [Original].
Revista Andaluza de Medicina del Deporte, 3(2), 57-61.
Vaz, M., & Bharathi, A. V. (2004). How sedentary are people in "sedentary"
occupations? The physical activity of teachers in urban South India.
Occupational Medicine (Oxford, England), 54(6), 369-372.
Virtanen, M., Kivimaki, M., Elovainio, M., Linna, A., Pentti, J., & Vahtera, J. (2007).
Neighbourhood socioeconomic status, health and working conditions of school
teachers [Research Support, Non-U.S. Gov't]. Journal of epidemiology and
community health, 61(4), 326-330. doi:10.1136/jech.2006.052878
Vuillemin, A., Boini, S., Bertrais, S., Tessier, S., Oppert, J.-M., Hercberg, S., ...
Briançon, S. (2005). Leisure time physical activity and health-related quality of
life. Preventive Medicine, 41(2), 562-569.
doi:http://dx.doi.org/10.1016/j.ypmed.2005.01.006
W.H.O. (2004). Global Strategy on Diet, Physical Activity and Health. Geneva: World
Health Organization.
W.H.O. (2010). Global recommendations on physical activity for health. Geneva:
World Health Organization.
Warren, T. Y., Barry, V., Hooker, S. P., Sui, X., Church, T. S., & Blair, S. N. (2010).
Sedentary behaviors increase risk of cardiovascular disease mortality in men
[Research Support, N.I.H., Extramural Research Support, Non-U.S. Gov't].
Medicine and science in sports and exercise, 42(5), 879-885.
doi:10.1249/MSS.0b013e3181c3aa7e
Webber, L. S., Rice, J. C., Johnson, C. C., Rose, D., Srinivasan, S. R., & Berenson, G.
S. (2012). Cardiovascular risk factors and physical activity behavior among
elementary school personnel: baseline results from the ACTION! worksite
wellness program. The Journal of school health, 82(9), 410-416.
doi:10.1111/j.1746-1561.2012.00716.x
Welk, G. J., Schaben, J. A., & Morrow, J. R., Jr. (2004). Reliability of accelerometry-
based activity monitors: a generalizability study. Med Sci Sports Exerc, 36(9),
1637-1645. doi:00005768-200409000-00026 [pii]

151
White, J. L., & Ransdell, L. B. (2003). Worksite intervention model for facilitating
changes in physical activity, fitness, and psychological parameters. Perceptual
and Motor Skills, 97(2), 461-466.
Wilcox, S., Castro, C., King, A. C., Housemann, R., & Brownson, R. C. (2000).
Determinants of leisure time physical activity in rural compared with urban
older and ethnically diverse women in the United States. Journal of
epidemiology and community health, 54(9), 667-672. doi:10.1136/jech.54.9.667
Willenberg, L. J., Ashbolt, R., Holland, D., Gibbs, L., MacDougall, C., Garrard, J., ...
Waters, E. (2010). Increasing school playground physical activity: A mixed
methods study combining environmental measures and children's perspectives.
Journal of Science and Medicine in Sport, 13(2), 210-216.
doi:http://dx.doi.org/10.1016/j.jsams.2009.02.011
Williams, D. M., Matthews, C. E., Rutt, C., Napolitano, M. A., & Marcus, B. H. (2008).
Interventions to increase walking behavior [Research Support, N.I.H.,
Extramural Research Support, Non-U.S. Gov't Review]. Medicine and science
in sports and exercise, 40(7 Suppl), S567-573.
doi:10.1249/MSS.0b013e31817c7006
Withall, J., Jago, R., & Fox, K. (2011). Why some do but most don't. Barriers and
enablers to engaging low-income groups in physical activity programmes: a
mixed methods study. BMC public health, 11(1), 507.
Yore, M. M., Ham, S. A., Ainsworth, B. E., Kruger, J., Reis, J. P., Kohl, H. W., 3rd, &
Macera, C. A. (2007). Reliability and validity of the instrument used in BRFSS
to assess physical activity. Med Sci Sports Exerc, 39(8), 1267-1274.
doi:10.1249/mss.0b013e3180618bbe 00005768-200708000-00009 [pii]

152
APPENDICES
Appendix 1: Ethical approval by AUTEC
M E M O R A N D U M
Auckland University of Technology Ethics Committee
(AUTEC)
To: EricaHinckson
From: Madeline Banda Executive Secretary, AUTEC
Date: 2 November 2010
Subject: Ethics Application Number 10/220Teachers' workplace: physical activity
and sedentary behaviour.
Dear Erica
Thank you for providing written evidence as requested. I am pleased to advise that it satisfies
the points raised by the Auckland University of Technology Ethics Committee (AUTEC) at
their meeting on 13 September 2010 and that I have approved your ethics application. This
delegated approval is made in accordance with section 5.3.2.3 of AUTEC’s Applying for Ethics
Approval: Guidelines and Procedures and is subject to endorsement at AUTEC’s meeting on 13
December 2010.
Your ethics application is approved for a period of three years until 2 November 2013.
I advise that as part of the ethics approval process, you are required to submit the following to
AUTEC:
A brief annual progress report using form EA2, which is available online through
http://www.aut.ac.nz/research/research-ethics/ethics. When necessary this form may
also be used to request an extension of the approval at least one month prior to its
expiry on 2 November 2013;
A brief report on the status of the project using form EA3, which is available online
through http://www.aut.ac.nz/research/research-ethics/ethics. This report is to be
submitted either when the approval expires on 2 November 2013 or on completion of
the project, whichever comes sooner;

153
It is a condition of approval that AUTEC is notified of any adverse events or if the research
does not commence. AUTEC approval needs to be sought for any alteration to the research,
including any alteration of or addition to any documents that are provided to participants. You
are reminded that, as applicant, you are responsible for ensuring that research undertaken under
this approval occurs within the parameters outlined in the approved application.
Please note that AUTEC grants ethical approval only. If you require management approval
from an institution or organisation for your research, then you will need to make the
arrangements necessary to obtain this.
When communicating with us about this application, we ask that you use the application
number and study title to enable us to provide you with prompt service. Should you have any
further enquiries regarding this matter, you are welcome to contact Charles Grinter, Ethics
Coordinator, by email at [email protected] or by telephone on 921 9999 at extension 8860.
On behalf of the AUTEC and myself, I wish you success with your research and look forward to
reading about it in your reports.
Yours sincerely
Madeline Banda
Executive Secretary
Auckland University of Technology Ethics Committee
Cc: Marcelo Castillo [email protected]

154
M E M O R A N D U M
Auckland University of Technology Ethics Committee
(AUTEC)
To: EricaHinckson
From: Madeline Banda Executive Secretary, AUTEC
Date: 30 November 2010
Subject: Ethics Application Number 10/221The effect of interrupting teachers'
sedentary behaviour on children's activity levels at school.
Dear Erica
Thank you for providing written evidence as requested. I am pleased to advise that it satisfies
the points raised by the Auckland University of Technology Ethics Committee (AUTEC) at
their meeting on 13 September 2010 and that I have approved your ethics application. This
delegated approval is made in accordance with section 5.3.2.3 of AUTEC’s Applying for Ethics
Approval: Guidelines and Procedures and is subject to endorsement at AUTEC’s meeting on 13
December 2010.
Your ethics application is approved for a period of three years until 30 November 2013.
I advise that as part of the ethics approval process, you are required to submit the following to
AUTEC:
A brief annual progress report using form EA2, which is available online through
http://www.aut.ac.nz/research/research-ethics/ethics. When necessary this form may
also be used to request an extension of the approval at least one month prior to its
expiry on 30 November 2013;
A brief report on the status of the project using form EA3, which is available online
through http://www.aut.ac.nz/research/research-ethics/ethics. This report is to be
submitted either when the approval expires on 30 November 2013 or on completion of
the project, whichever comes sooner;
It is a condition of approval that AUTEC is notified of any adverse events or if the research
does not commence. AUTEC approval needs to be sought for any alteration to the research,
including any alteration of or addition to any documents that are provided to participants. You
are reminded that, as applicant, you are responsible for ensuring that research undertaken under
this approval occurs within the parameters outlined in the approved application.

155
Please note that AUTEC grants ethical approval only. If you require management approval
from an institution or organisation for your research, then you will need to make the
arrangements necessary to obtain this.
When communicating with us about this application, we ask that you use the application
number and study title to enable us to provide you with prompt service. Should you have any
further enquiries regarding this matter, you are welcome to contact Charles Grinter, Ethics
Coordinator, by email at [email protected] or by telephone on 921 9999 at extension 8860.
On behalf of the AUTEC and myself, I wish you success with your research and look forward to
reading about it in your reports.
Yours sincerely
Madeline Banda
Executive Secretary
Auckland University of Technology Ethics Committee
Cc: Marcelo Castillo [email protected]

156
Appendix 2: Consent forms for schools, teachers and children
Permission to Access Form
Project title: Teachers’ workplace: physical activity and sedentary behaviour
Project Supervisors: Dr Erica Hinckson
Researcher: Marcelo Castillo
I have read and understood the information provided about this research project
contained in the Information Sheet dated 7 February 2011.
I have had an opportunity to ask questions and to have them answered.
All necessary authorisations have been sought and approval granted for this
research project to take place at ________________________________ School.
All signatories are authorised to grant approval for
_____________________________ School to participate in this research.
_______________________________ School wishes to receive ___ copies of
any report and journal articles submitted for publication as a result of this
research.
School Name: ...........................................................................
School Address:
Street Address: .......................................................................................
Suburb: ...................................................................................................
City: .........................................................................................................
Principal Signature: .........................................……………
Name (print): …………………………………
Approved by the Auckland University of Technology Ethics Committee on 2
November 2010 AUTEC Reference number 10/220 and on 30 November 2010
AUTEC Reference number 10/221
Note: The School Principal should retain a copy of this form.

157
Consent Form
Project title: Teachers’ workplace sedentary and physical activity
patterns
Project Supervisor: Dr. Erica Hinckson
Researcher: Marcelo Castillo
I have read and understood the information provided about this research project
in the Information Sheet dated 7 February 2011
I have had an opportunity to ask questions and to have them answered.
I understand that I may withdraw myself or any information that I have provided
for this project at any time prior to completion of data collection, without being
disadvantaged in any way.
I understand that I may to complete short questionnaires about physical activity
at work
I understand that I may wear two motion sensors for one week.
I agree to provide blood samples to determine cardiovascular risk.
If I withdraw, I understand that all the information provided or/and related with
my participation will be destroyed.
I agree to take part in this research.
I wish to receive a copy of the report from the research (please tick one): Yes
No
Participant’s signature: ..........................…………………………………………………
Participant’s name: ....................................………………………………………………
Participant’s Contact Details (if
appropriate):…………………………………………………………………
Date:
Approved by the Auckland University of Technology Ethics Committee on 2
November 2010 AUTEC Reference number AUTEC 10/220

158
Parent/Guardian Consent
Form
Project title: Relationship between teachers’ and children’s physical and
sedentary activity patterns
Project Supervisor: Dr Erica Hinckson
Researcher: Marcelo Castillo
I have read and understood the information provided about this research project
in the Information Sheet dated 7 February 2011
I have had an opportunity to ask questions and to have them answered.
I understand that the researchers will compare sedentary and physical activities
by collecting from the motion sensors (ActivPAL monitor, ActiCal
accelerometer) with their teachers.
I understand that I may withdraw my child and/or myself or any information that
we have provided for this project at any time prior to completion of data
collection, without being disadvantaged in any way.
If my child and/or I withdraw, I understand that all relevant information will be
destroyed.
I agree to my child taking part in this research.
I wish to receive a copy of the report from the research (please tick one): Yes
No
Child’s name : ………………………………………………………………………
Parent/Guardian’s signature: .....................………………………………………………
Parent/Guardian’s name: ...........................………………………………………………
Parent/Guardian’s Contact Details (if
appropriate):……………………………………………………………..
Date:
Approved by the Auckland University of Technology Ethics Committee on 30
November 2010 AUTEC Reference number 10/221

159
Assent Form
Project title: Relationship between teachers’ and children’s physical and
sedentary activity patterns
Project Supervisor: Dr Erica Hinckson
Researcher: Marcelo Castillo
I have read and understood the sheet telling me what will happen in this study
and why it is important.
I have been able to ask questions and to have them answered.
I understand that data will be collected by motion sensors (small computers)
attached to the child waistline and thigh.
I understand that while the information is being collected, I can stop being part
of this study whenever I want and that it is perfectly ok for me to do this.
If I stop being part of the study, I understand that all information about me will
be destroyed.
I agree to take part in this research.
Participant’s signature: ..........................…………………………………………………
Participant’s name: ............................……………………………………………………
Participant Contact Details (if appropriate):
………………………………………………………………………………………..…
Date:
Approved by the Auckland University of Technology Ethics Committee on 30
November 2010 AUTEC Reference number 10/221
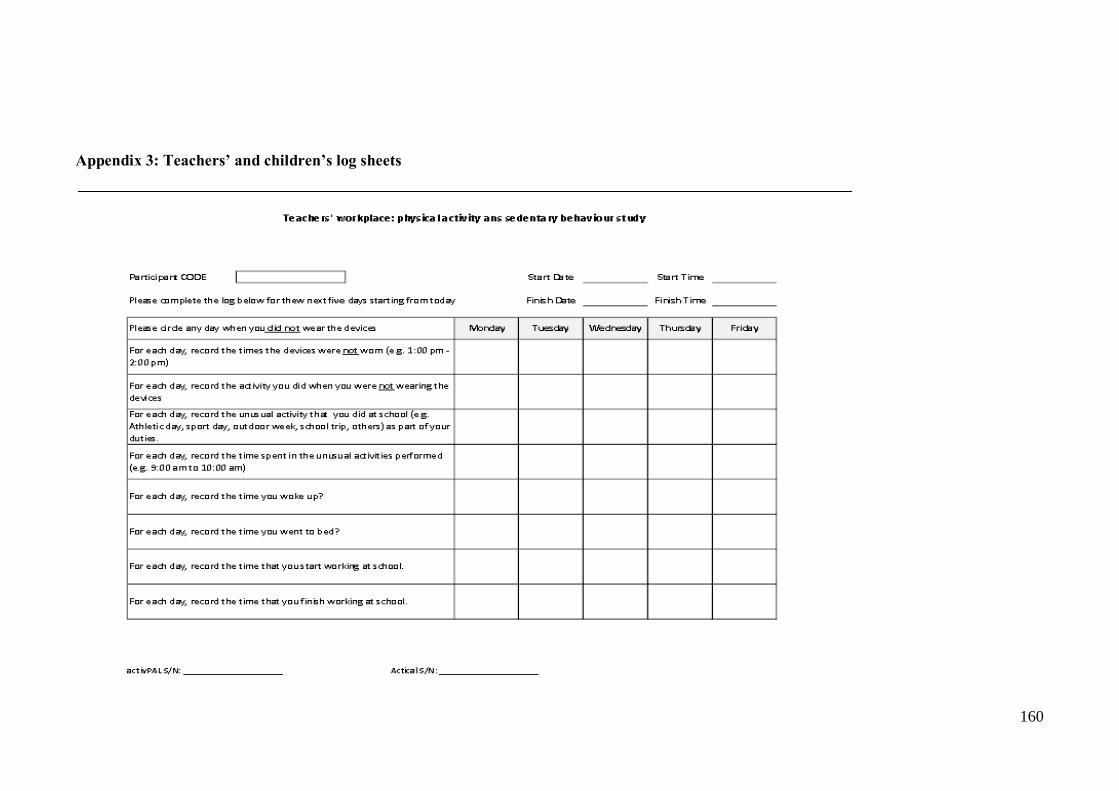
160
Appendix 3: Teachers’ and children’s log sheets

161

162
Appendix 4: QHPA and HPQ questionnaires

163

164

165

166

167

168

169

170

171

172

173

174
Appendix 5: Interview questions
IDENTIFYING MEDIATORS AND MODERATORS OF TEACHERS’
PHYSICAL ACTIVITY AT SCHOOL
Principals’ Interview questions
1. What is the school policy on Physical Activity and how does it relate to the new
Physical Activity curriculum?
2. Have you had any difficulty implementing the new Physical Activity
curriculum? Have you been able to solve these difficulties? Please explain.
3. How would you classify teachers’ physical requirements at work? Why?
4. Understanding physical activity as any bodily movement by muscles, What are
the barriers to physical activity for teachers while at school?
5. Can you identify any facilitators to physical activity for teachers while they are
at school?
6. In which way do you think teachers can be more active at work?
7. Do you think is a good idea encouraging teachers to be active at work? What
sort of physical activity do you think is suitable to include while working or
staying at school?
Approved by the Auckland University of Technology Ethics Committee on 2 November
2010 AUTEC Reference number 10/220

175
IDENTIFYING MEDIATORS AND MODERATORS OF TEACHERS’
PHYSICAL ACTIVITY AT SCHOOL
Teachers’ Interview questions
1. Could you describe a normal day in this school for teachers and for children?
Start and finish time, breaks, and events. Do you have Free Time at School
during the week?
2. What do you do during breaks?
3. Do children have chances to interact with you out of the class time? Give
examples.
4. Is children’s play time supervised? By who? For how long? Every day?
5. Are organized activities and loose equipment offered during children’s play
time? How often? What kind? For how long?
6. How would you classify your work in terms of physical requirements? Why?
7. If we understand physical activity as any bodily movement produced by
muscles, what are the barriers to physical activity for teachers while at school?
8. Can you identify any facilitators to physical activity for teachers while they are
at school?
9. In which way do you think your work can be more active?
10. Are you willing to include some physical activity while working or staying at
school? What sort of physical activity do you think is suitable to include while
working or staying at school?
Approved by the Auckland University of Technology Ethics Committee on 2 November
2010 AUTEC Reference number 10/220

176
Appendix 6: Sample size estimation, extracted from Hopkins’ spreadsheet (Hopkins, 2006)
Differences in means in a cross-sectional study Outcomes in a subsequent study
Smallest difference
Between-subject
SD
Proportion in Group
A (%)
Maximum rates of statistical errors (%)
Choose an
observed change
Sample size 95 % conf. limits
Type I Type
II Total Group
A Group
B lower upper "±"
1000 1700 50 5 20 93 46 46 701.43 0.00 1402.87 701.43
very
unlikely unlikely


