
Technical Advisory
Committee (TAC)
August 15, 2018 CareerSource Heartland
Sebring, FL

1) Roll Call
2) Public Comment

3) Approval of Minutes*
May 16, 2018 Meeting

4) FDOT Update
a.US 27 Speed Studyb.SR 31 Extension Alternative Corridor
Evaluation (ACE) Feasibility Study c.SR 70 Corridor Study

FLORIDA DEPARTMENT OF TRANSPORTATION
TRAFFICOPERATIONS
FLORIDA DEPARTMENT OF TRANSPORTATION
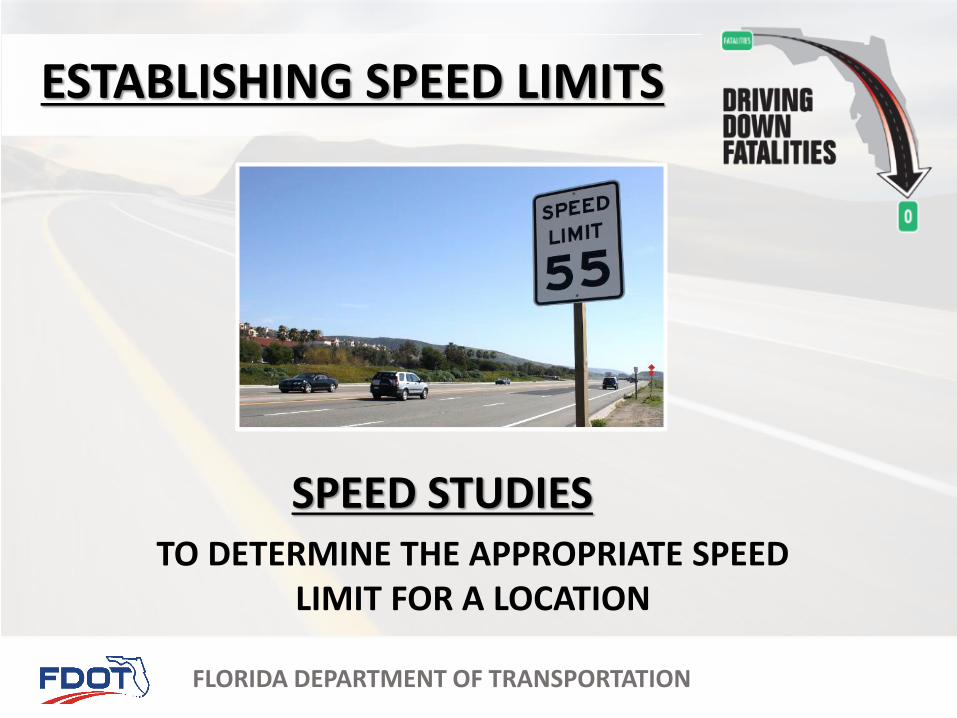
SPEED STUDIESTO DETERMINE THE APPROPRIATE SPEED
LIMIT FOR A LOCATION
ESTABLISHING SPEED LIMITS

FLORIDA DEPARTMENT OF TRANSPORTATION
TOPICS OF DISCUSSION
• FLORIDA STATUTE 316
• FDOT SPEED ZONING MANUAL
• DATA COLLECTION
• DATA ANALYSIS
• POSTED SPEED LIMIT
• US 27 SPEED STUDY, SEBRING
FLORIDA DEPARTMENT OF TRANSPORTATION
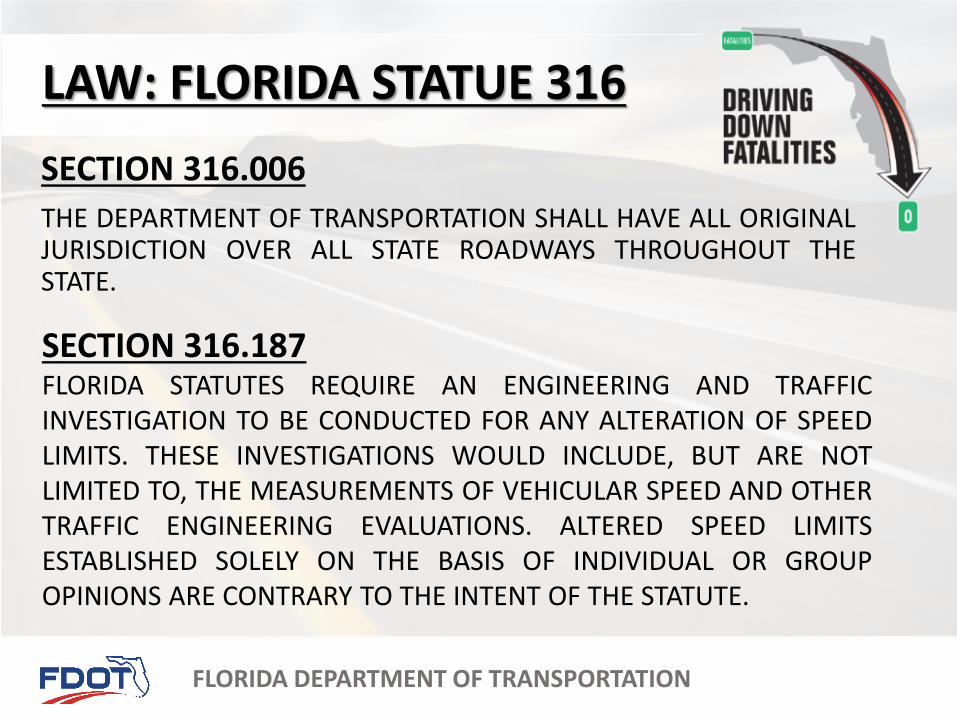
SECTION 316.006
THE DEPARTMENT OF TRANSPORTATION SHALL HAVE ALL ORIGINALJURISDICTION OVER ALL STATE ROADWAYS THROUGHOUT THESTATE.
SECTION 316.187FLORIDA STATUTES REQUIRE AN ENGINEERING AND TRAFFICINVESTIGATION TO BE CONDUCTED FOR ANY ALTERATION OF SPEEDLIMITS. THESE INVESTIGATIONS WOULD INCLUDE, BUT ARE NOTLIMITED TO, THE MEASUREMENTS OF VEHICULAR SPEED AND OTHERTRAFFIC ENGINEERING EVALUATIONS. ALTERED SPEED LIMITSESTABLISHED SOLELY ON THE BASIS OF INDIVIDUAL OR GROUPOPINIONS ARE CONTRARY TO THE INTENT OF THE STATUTE.
LAW: FLORIDA STATUE 316

FLORIDA DEPARTMENT OF TRANSPORTATION
MANUALS
• THE SPEED ZONINGMANUAL
• MANUAL ON UNIFORMTRAFFIC STUDIES
ESTABLISHING SPEED LIMITS

FLORIDA DEPARTMENT OF TRANSPORTATION
PURPOSE AND INTENT• THE PRIMARY INTENT IN THE ESTABLISHMENT OF A SPEED ZONE IS TO
PROVIDE IMPROVED VEHICULAR AND PEDESTRIAN SAFETY BY
REDUCING THE PROBABILITY AND SEVERITY OF CRASHES.
• FDOT ENCOURAGES THE CONSIDERATION AND IMPLEMENTATION OF
FACILITIES THAT ARE DESIGNED AND OPERATED TO ENABLE SAFE
ACCESS FOR ALL USERS, INCLUDING PEDESTRIANS, BICYCLISTS,
MOTORISTS AND TRANSIT RIDERS OF ALL AGES AND ABILITIES.
ESTABLISHING SPEED LIMITS

FLORIDA DEPARTMENT OF TRANSPORTATION
SPEED DATA COLLECTION
THE LOCATION OF A SPEED STUDY IS CHOSEN SO THATSPEEDS REFLECT HOW VEHICLES TYPICALLY TRAVELUNDER FREE FLOW CONDITIONS
PNEUMATIC ROAD TUBES SPEED GUNS
ESTABLISHING SPEED LIMITS
FLORIDA DEPARTMENT OF TRANSPORTATION
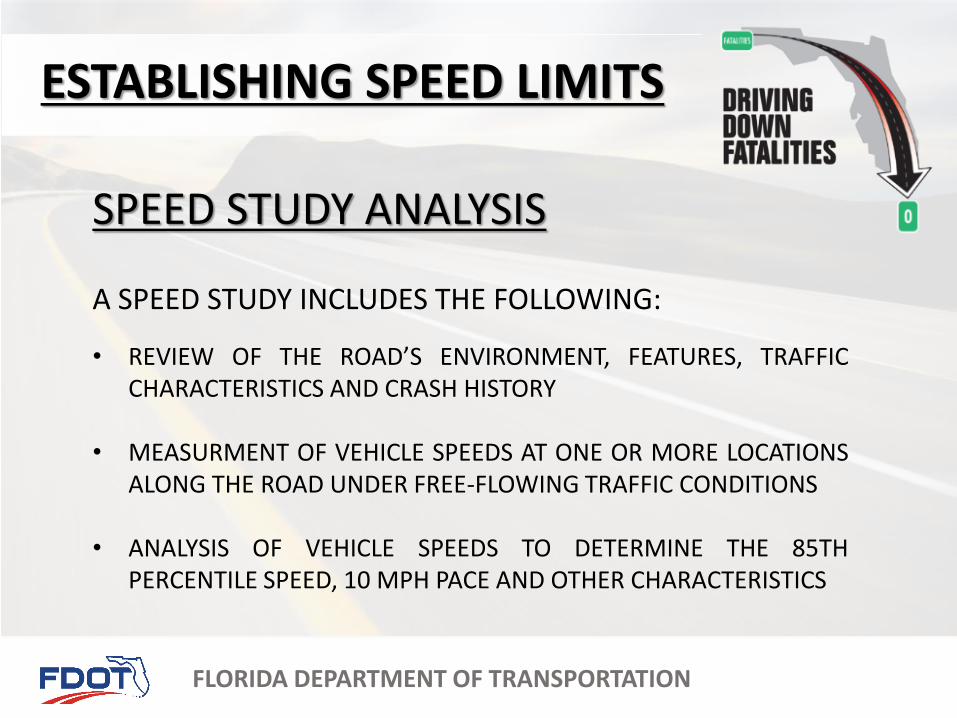
SPEED STUDY ANALYSIS
A SPEED STUDY INCLUDES THE FOLLOWING:
• REVIEW OF THE ROAD’S ENVIRONMENT, FEATURES, TRAFFICCHARACTERISTICS AND CRASH HISTORY
• MEASURMENT OF VEHICLE SPEEDS AT ONE OR MORE LOCATIONSALONG THE ROAD UNDER FREE-FLOWING TRAFFIC CONDITIONS
• ANALYSIS OF VEHICLE SPEEDS TO DETERMINE THE 85THPERCENTILE SPEED, 10 MPH PACE AND OTHER CHARACTERISTICS
ESTABLISHING SPEED LIMITS
FLORIDA DEPARTMENT OF TRANSPORTATION
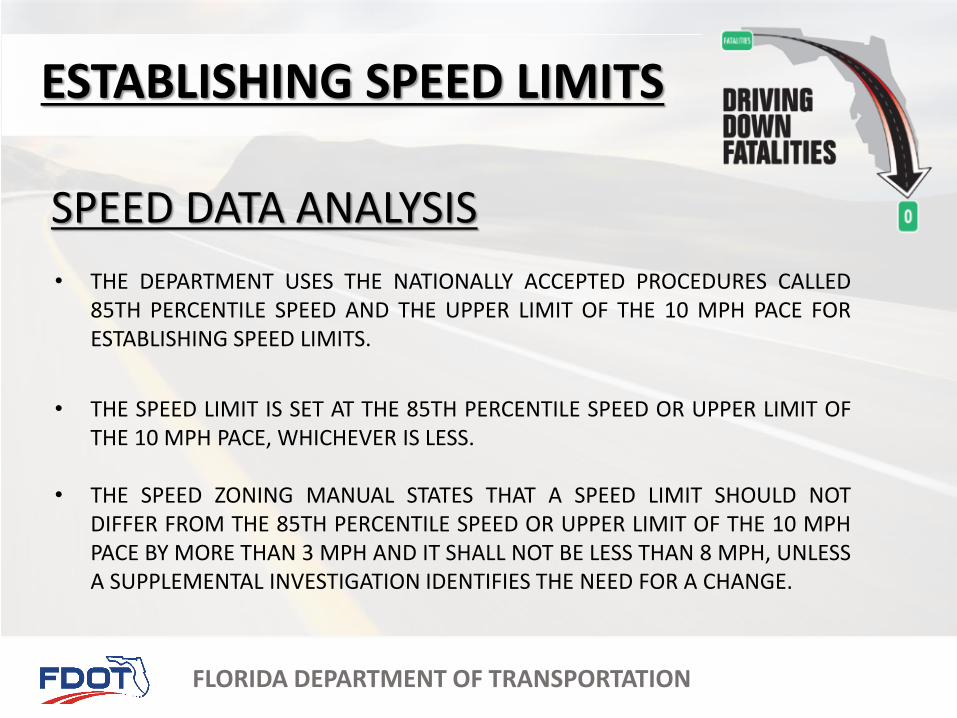
• THE DEPARTMENT USES THE NATIONALLY ACCEPTED PROCEDURES CALLED85TH PERCENTILE SPEED AND THE UPPER LIMIT OF THE 10 MPH PACE FORESTABLISHING SPEED LIMITS.
• THE SPEED LIMIT IS SET AT THE 85TH PERCENTILE SPEED OR UPPER LIMIT OFTHE 10 MPH PACE, WHICHEVER IS LESS.
• THE SPEED ZONING MANUAL STATES THAT A SPEED LIMIT SHOULD NOTDIFFER FROM THE 85TH PERCENTILE SPEED OR UPPER LIMIT OF THE 10 MPHPACE BY MORE THAN 3 MPH AND IT SHALL NOT BE LESS THAN 8 MPH, UNLESSA SUPPLEMENTAL INVESTIGATION IDENTIFIES THE NEED FOR A CHANGE.
SPEED DATA ANALYSIS
ESTABLISHING SPEED LIMITS
FLORIDA DEPARTMENT OF TRANSPORTATION
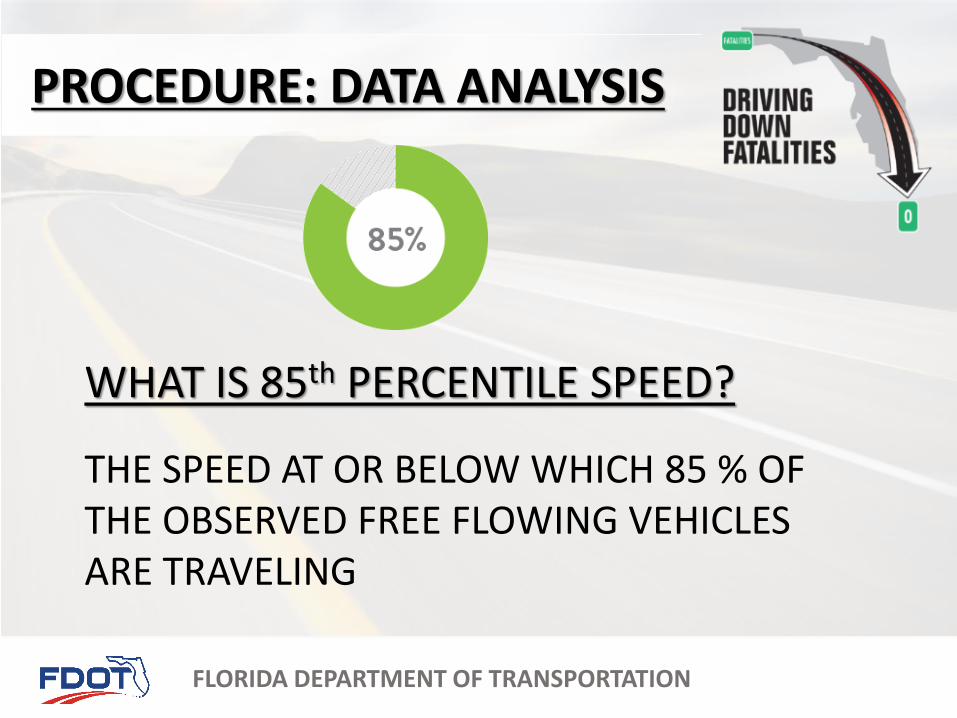
WHAT IS 85th PERCENTILE SPEED?
THE SPEED AT OR BELOW WHICH 85 % OF THE OBSERVED FREE FLOWING VEHICLES ARE TRAVELING
PROCEDURE: DATA ANALYSIS

FLORIDA DEPARTMENT OF TRANSPORTATION
IN OTHER WORDS…..
85TH
PERCENTILE SPEED
85% TRAVELING AT OR SLOWER
15% TRAVELING FASTER
PROCEDURE: DATA ANALYSIS
FLORIDA DEPARTMENT OF TRANSPORTATION
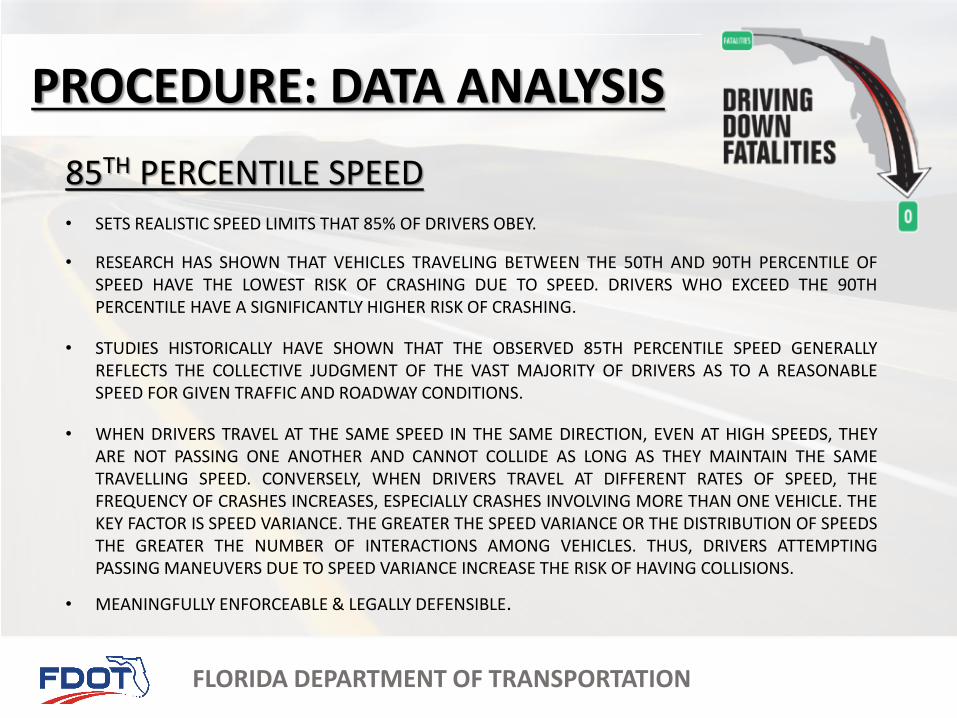
• STUDIES HISTORICALLY HAVE SHOWN THAT THE OBSERVED 85TH PERCENTILE SPEED GENERALLYREFLECTS THE COLLECTIVE JUDGMENT OF THE VAST MAJORITY OF DRIVERS AS TO A REASONABLESPEED FOR GIVEN TRAFFIC AND ROADWAY CONDITIONS.
• RESEARCH HAS SHOWN THAT VEHICLES TRAVELING BETWEEN THE 50TH AND 90TH PERCENTILE OFSPEED HAVE THE LOWEST RISK OF CRASHING DUE TO SPEED. DRIVERS WHO EXCEED THE 90THPERCENTILE HAVE A SIGNIFICANTLY HIGHER RISK OF CRASHING.
• WHEN DRIVERS TRAVEL AT THE SAME SPEED IN THE SAME DIRECTION, EVEN AT HIGH SPEEDS, THEYARE NOT PASSING ONE ANOTHER AND CANNOT COLLIDE AS LONG AS THEY MAINTAIN THE SAMETRAVELLING SPEED. CONVERSELY, WHEN DRIVERS TRAVEL AT DIFFERENT RATES OF SPEED, THEFREQUENCY OF CRASHES INCREASES, ESPECIALLY CRASHES INVOLVING MORE THAN ONE VEHICLE. THEKEY FACTOR IS SPEED VARIANCE. THE GREATER THE SPEED VARIANCE OR THE DISTRIBUTION OF SPEEDSTHE GREATER THE NUMBER OF INTERACTIONS AMONG VEHICLES. THUS, DRIVERS ATTEMPTINGPASSING MANEUVERS DUE TO SPEED VARIANCE INCREASE THE RISK OF HAVING COLLISIONS.
• SETS REALISTIC SPEED LIMITS THAT 85% OF DRIVERS OBEY.
• MEANINGFULLY ENFORCEABLE & LEGALLY DEFENSIBLE.
85TH PERCENTILE SPEED
PROCEDURE: DATA ANALYSIS

FLORIDA DEPARTMENT OF TRANSPORTATION
WHAT IS THE TEN MPH PACE?
THE 10 MPH PACE IS THE 10 MPH RANGECONTAINING THE HIGHEST NUMBER OF SUCHVEHICLES CONTAINED IN THE STUDY SAMPLEDATA
PROCEDURE: DATA ANALYSIS

FLORIDA DEPARTMENT OF TRANSPORTATION
TEN MPH PACE ……..
< 52 mph 52 - 61 mph > 61 mph
PROCEDURE: DATA ANALYSIS
FLORIDA DEPARTMENT OF TRANSPORTATION
REVIEW:
• FLORIDA STATUTES SET MAXIMUM SPEED LIMITS.
• DRIVERS SET THEIR OWN SPEED BASED ON CURRENT ROADWAY CONDITIONS.
• DRIVER’S WILL NOT OBEY ARBITRARILY SET (LOW) SPEED LIMITS.
• SPEED DIFFERENTIALS CONTRIBUTE TO CRASHES. INDIVIDUAL SPEEDS AT THE 85TH PERCENTILE LEVEL ARE BY DEFINITION THE SAFES SPEED FOR TRAVEL.

FLORIDA DEPARTMENT OF TRANSPORTATION
US 27 SPEED STUDY SEBRINGFROM US 98 TO POLK COUNTY LINE

FLORIDA DEPARTMENT OF TRANSPORTATION

FLORIDA DEPARTMENT OF TRANSPORTATION
FLORIDA DEPARTMENT OF TRANSPORTATION
ESTABLISHING SPEED LIMITS

FLORIDA DEPARTMENT OF TRANSPORTATION
US 27 SPEED LIMIT QUESTIONS
A COMPARISON OF DIFFERENT SITUATIONS.
FLORIDA DEPARTMENT OF TRANSPORTATION
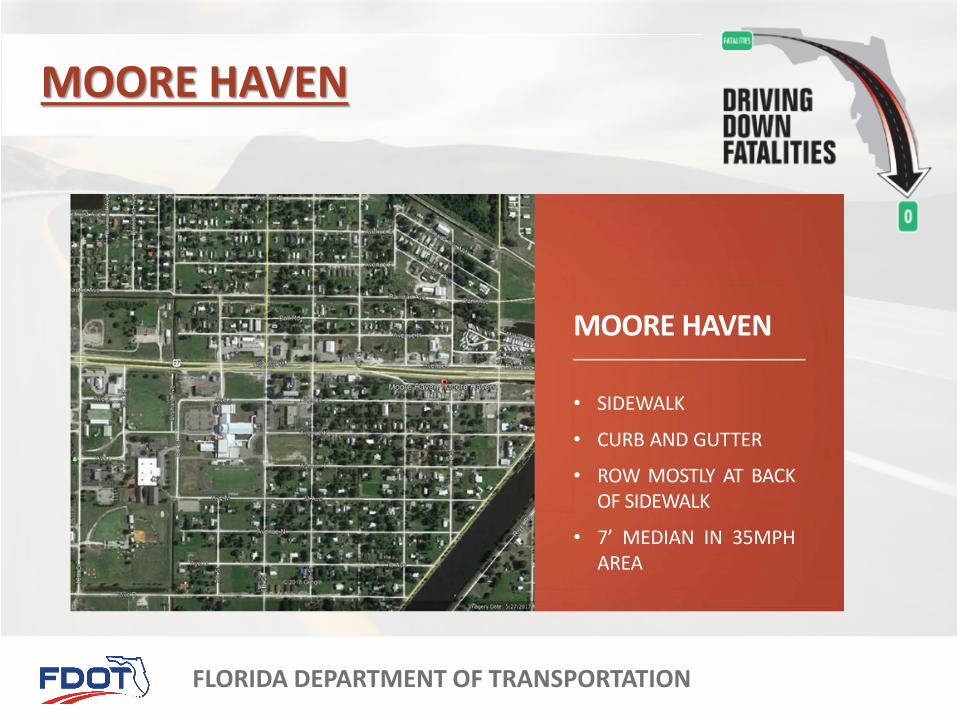
MOORE HAVEN
• SIDEWALK
• CURB AND GUTTER
• ROW MOSTLY AT BACKOF SIDEWALK
• 7’ MEDIAN IN 35MPHAREA
MOORE HAVEN

FLORIDA DEPARTMENT OF TRANSPORTATION
MOORE HAVEN (LOOKING EAST)

FLORIDA DEPARTMENT OF TRANSPORTATION
MOORE HAVEN (LOOKING WEST)

FLORIDA DEPARTMENT OF TRANSPORTATION
MOORE HAVEN SPEED LIMITS
FLORIDA DEPARTMENT OF TRANSPORTATION
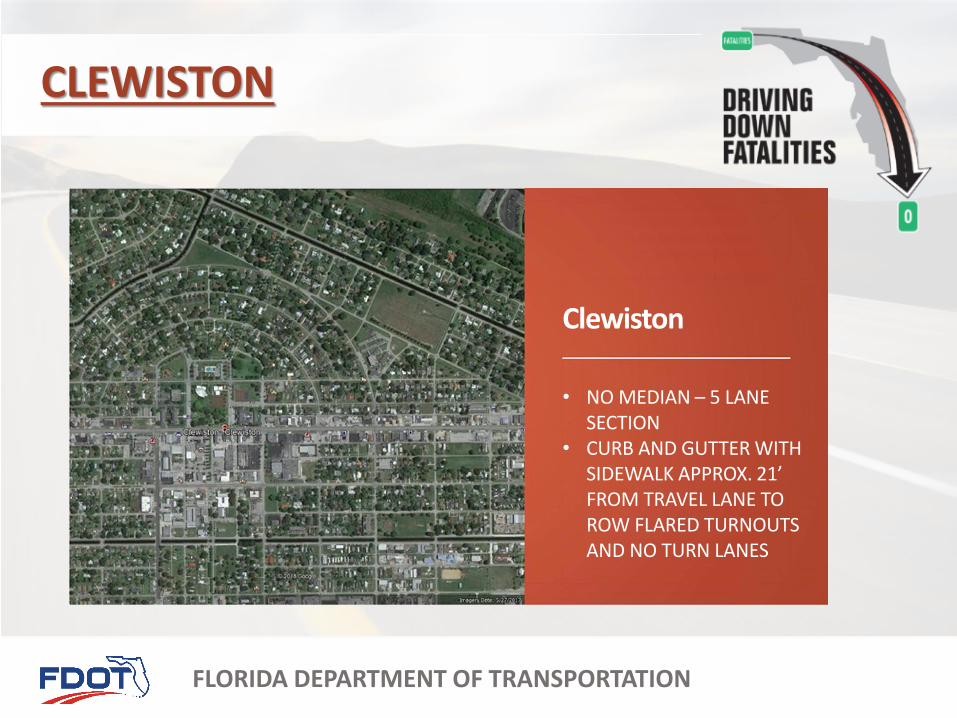
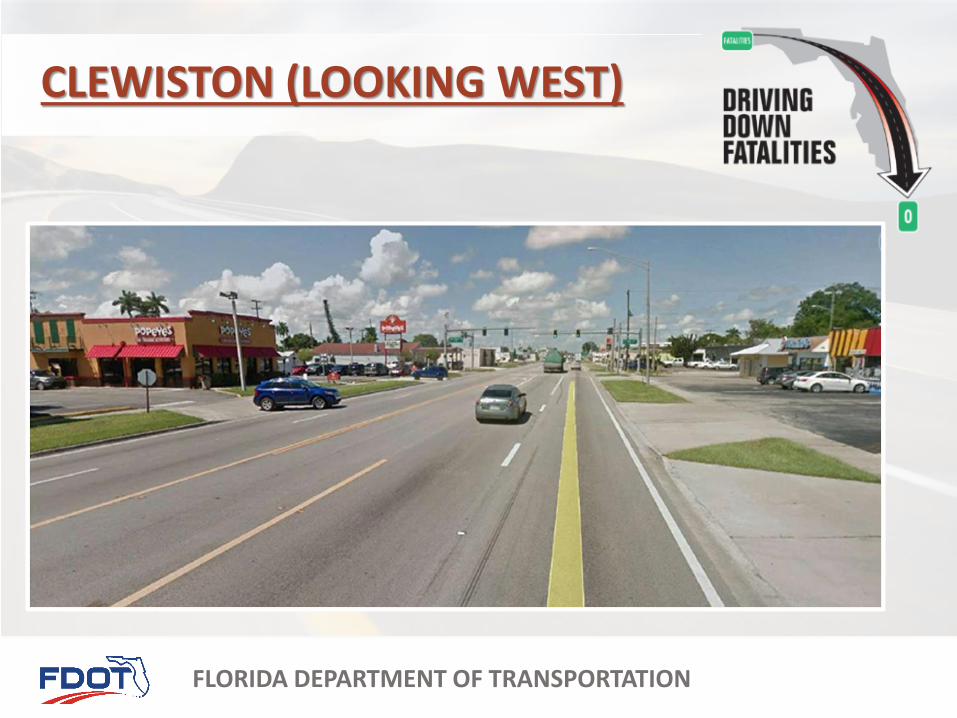
Clewiston
• NO MEDIAN – 5 LANE SECTION
• CURB AND GUTTER WITH SIDEWALK APPROX. 21’ FROM TRAVEL LANE TO ROW FLARED TURNOUTS AND NO TURN LANES
CLEWISTON

FLORIDA DEPARTMENT OF TRANSPORTATION
CLEWISTON (LOOKING EAST)
FLORIDA DEPARTMENT OF TRANSPORTATION
CLEWISTON (LOOKING WEST)

FLORIDA DEPARTMENT OF TRANSPORTATION
CLEWISTON SPEED LIMITS

FLORIDA DEPARTMENT OF TRANSPORTATION
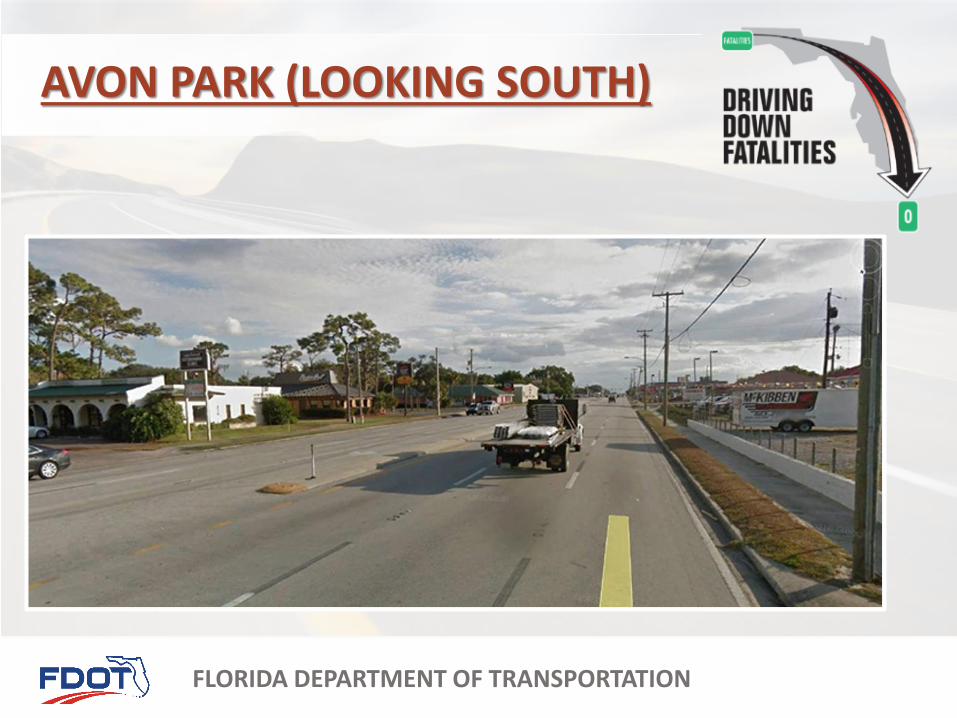
AVON PARK
AVON PARK
• VERY LITTLE 14’ MEDIAN,MOSTLY LEFT TURN LANESWITH 4’ SEPARATOR
• WIDER MEDIAN LEADING INTO CITY CURB AND GUTTER WITH SIDEWALK APPROX. 13’ FROM TRAVEL LANE TO ROW FEW RIGHT TURN LANES

FLORIDA DEPARTMENT OF TRANSPORTATION
AVON PARK (LOOKING NORTH)
FLORIDA DEPARTMENT OF TRANSPORTATION
AVON PARK (LOOKING SOUTH)

FLORIDA DEPARTMENT OF TRANSPORTATION
AVON PARK SPEED LIMITS

FLORIDA DEPARTMENT OF TRANSPORTATION
SOUTH BAY
SOUTH BAY
• VERY LITTLE 14’ MEDIAN,MOSTLY LEFT TURN LANESWITH 4’ SEPARATOR
• WIDER MEDIAN LEADING INTO CITY CURB AND GUTTER WITH SIDEWALK APPROX. 15’ FROM TRAVEL LANE TO ROW FEW RIGHT TURN LANES

FLORIDA DEPARTMENT OF TRANSPORTATION
SOUTH BAY (LOOKING NORTH)

FLORIDA DEPARTMENT OF TRANSPORTATION
SOUTH BAY (LOOKING SOUTH)
FLORIDA DEPARTMENT OF TRANSPORTATION
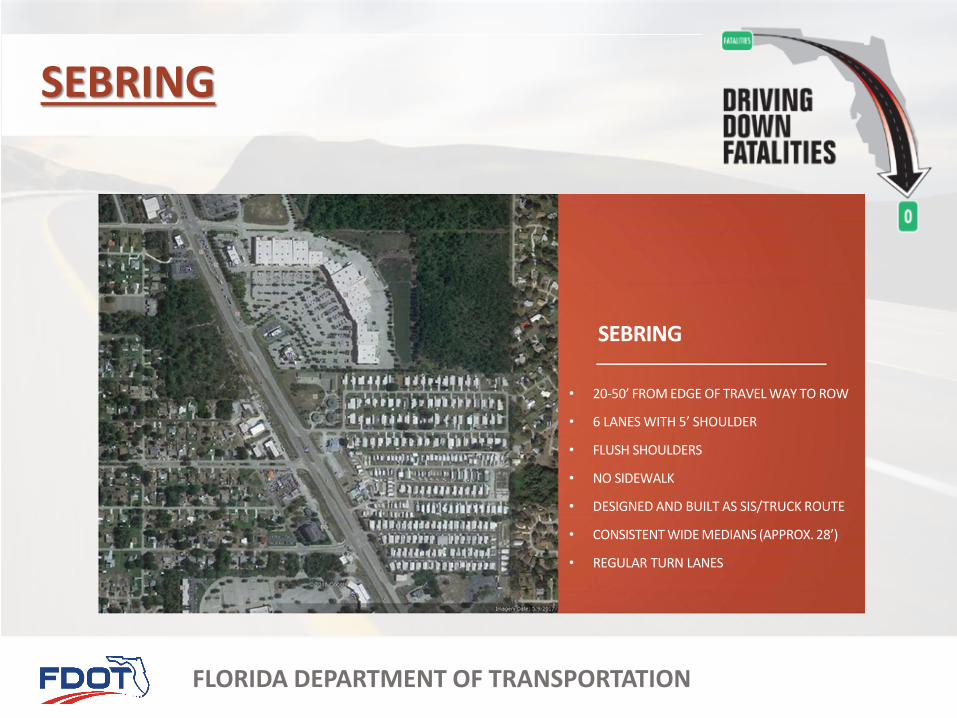
SEBRING
SEBRING
• 20-50’ FROM EDGE OF TRAVEL WAY TO ROW
• 6 LANES WITH 5’ SHOULDER
• FLUSH SHOULDERS
• NO SIDEWALK
• DESIGNED AND BUILT AS SIS/TRUCK ROUTE
• CONSISTENT WIDE MEDIANS (APPROX. 28’)
• REGULAR TURN LANES

FLORIDA DEPARTMENT OF TRANSPORTATION
SEBRING (LOOKING NORTH)

FLORIDA DEPARTMENT OF TRANSPORTATION
SEBRING (LOOKING SOUTH)

FLORIDA DEPARTMENT OF TRANSPORTATION
SEBRING SPEED LIMITS

FLORIDA DEPARTMENT OF TRANSPORTATION
THANK YOU
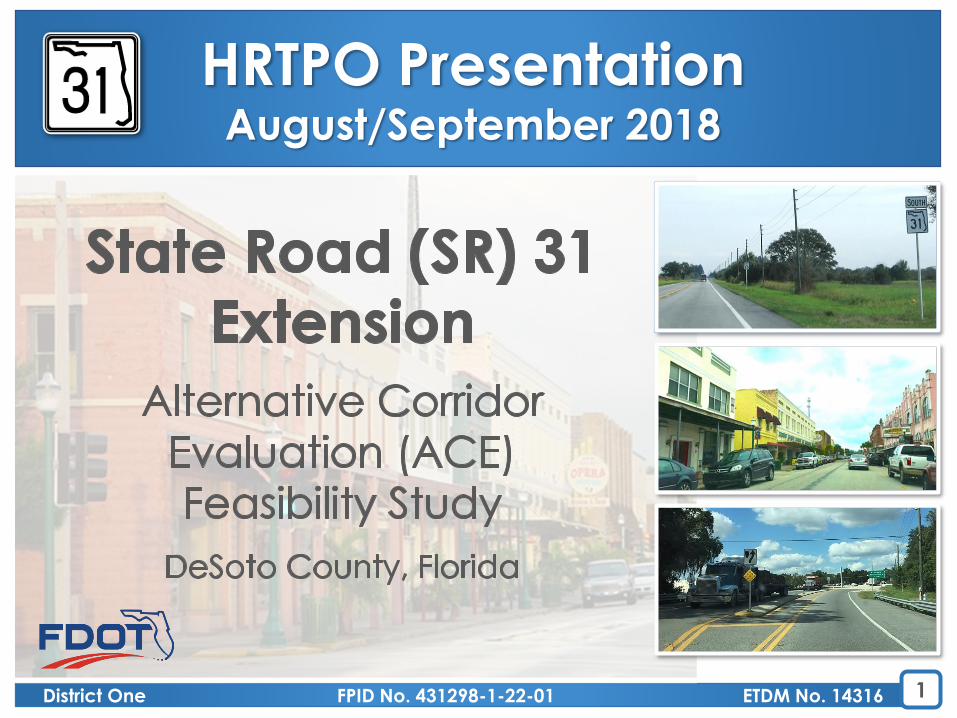
HRTPO PresentationAugust/September 2018
District One FPID No. 431298-1-22-01 ETDM No. 14316 1
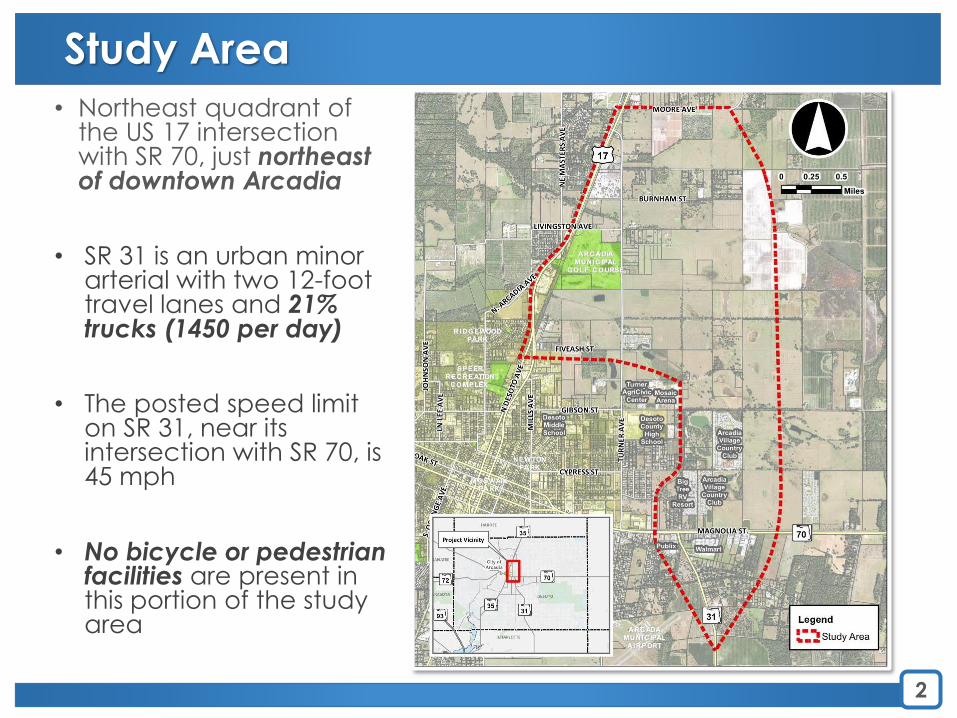
• Northeast quadrant of the US 17 intersection with SR 70, just northeast of downtown Arcadia
• SR 31 is an urban minor arterial with two 12-foot travel lanes and 21% trucks (1450 per day)
• The posted speed limit on SR 31, near its intersection with SR 70, is 45 mph
• No bicycle or pedestrian facilities are present in this portion of the study area
2
Study Area
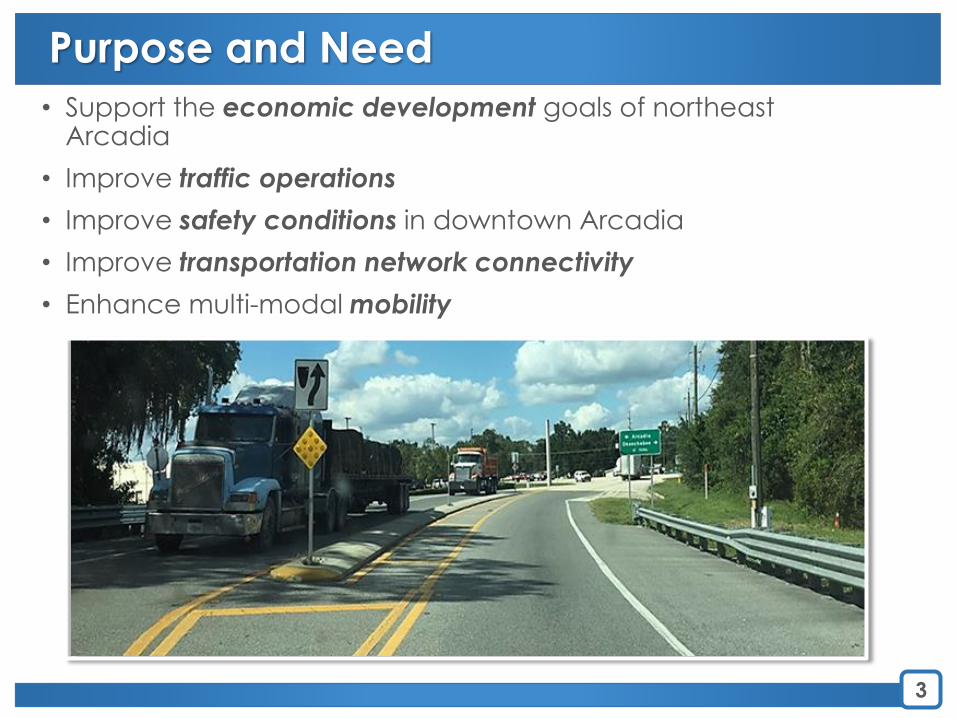
Purpose and Need
• Support the economic development goals of northeast Arcadia
• Improve traffic operations
• Improve safety conditions in downtown Arcadia
• Improve transportation network connectivity
• Enhance multi-modal mobility
3 3

• Ten corridors evaluated east of
Arcadia from SR 70 to US 17
• Corridors are between 2.5 and 5
miles long
• Connections to US 17 are
between Fiveash Street and
Moore Avenue
4
Alternative Corridors Studied

5
Evaluation Criteria
• Satisfies Purpose and Need
• Receives Public and Stakeholder Support
• Minimizes Potential Environmental Impacts
• Demonstrates Engineering Feasibility
• Minimizes Costs

• DeSoto County
• City of Arcadia
• Heartland Regional TPO
• Arcadia Crossing
• Arcadia Village
• Big Tree RV Resort
• Walmart
• Publix
• Stevenson Family
• Turner Family
• Arcadia Rodeo Association
• Redlands Christian Migrant
Association (RCMA)
6
Stakeholder Coordination Efforts
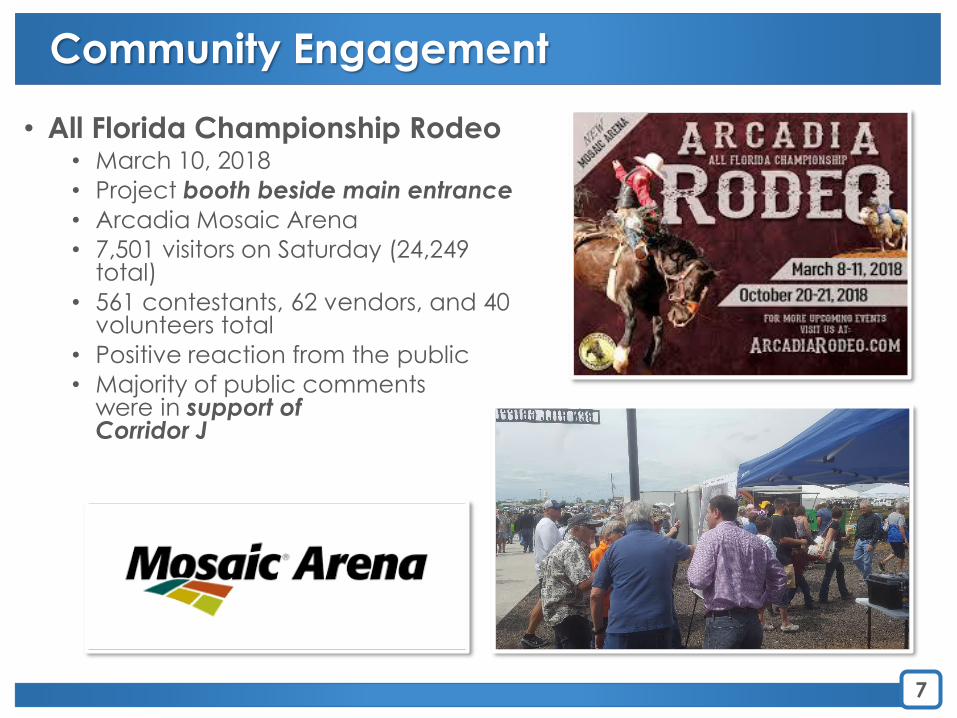
• All Florida Championship Rodeo• March 10, 2018
• Project booth beside main entrance
• Arcadia Mosaic Arena
• 7,501 visitors on Saturday (24,249 total)
• 561 contestants, 62 vendors, and 40 volunteers total
• Positive reaction from the public
• Majority of public commentswere in support of Corridor J
7
Community Engagement

Thursday, October 4th, 2018
5 p.m. to 7 p.m.
Turner Agri-Civic Center
Exhibition Hall
2250 NE Roan Street, Arcadia, Florida 34266
Project website
www.swflroads.com/sr31extension/sr70tous17
8
Corridor Public Information Meeting

• 1,279 newsletters mailed
• Residents/tenants/property owners
• Consideration given to seasonal residents
9
Public Meeting Outreach

• Hold Public Information Meeting on October 4th, 2018
• Finalize Alternative Corridor Evaluation Report (ACER) based on public input and add recommended corridors
• Publish ETDM Planning Screen Summary Report with ACER
• Approval of final ACER and ETDM Planning Screen Summary Report
• Transition into PD&E Study phase early 2019
10
Next Steps

presented to
presented by
SR 70 Multimodal Corridor
HRTPO
Central Office

SR 70 Corridor
Limits» From I-75 to I-95
Counties» Manatee» De Soto» Highlands» Okeechobee» St. Lucie
Approximately 140 miles
Existing Conditions Data Study

SR 70 Facility Data
Typical Sections
» Lanes
» Urban/Rural
» AADT
» LOS – Tables
» ROW
Roadway Structures
» Horizontal Clearances
» Vertical Clearances
» Embankment
Safety/Crash Data
Evacuation Routes
Rail Road Crossings
Pedestrian and Bicycle Facilities
Major Utilities
Drainage Structures
» Water Body
» Structure Size
» Flow Direction
» WBID
Potential Truck Stop/Rest Areas
Grade Separation Opportunities
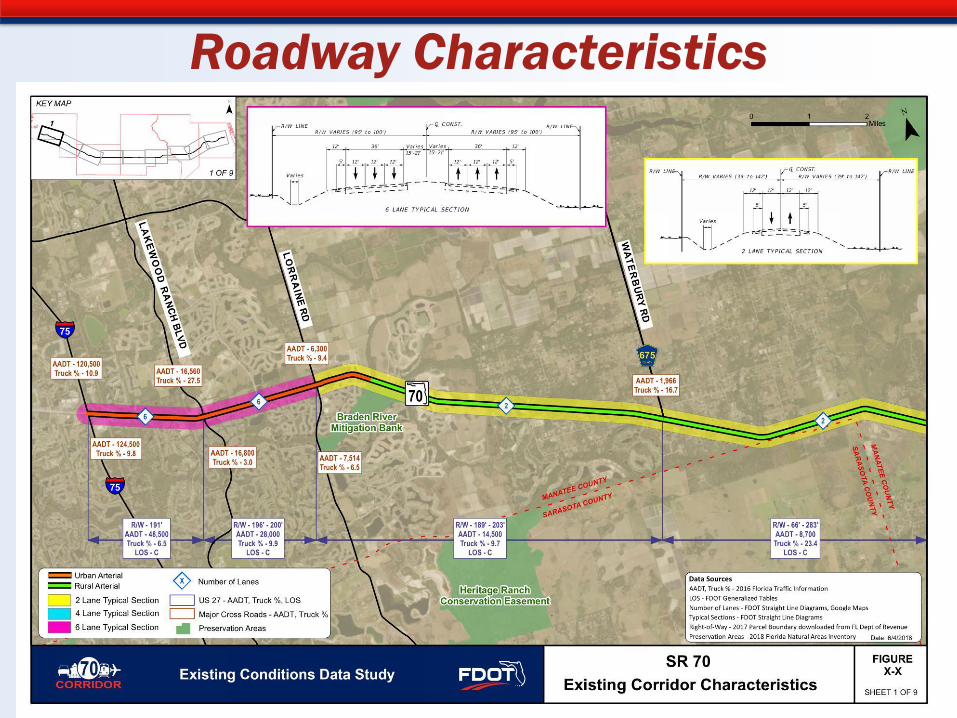
Roadway Characteristics
4

Pedestrian and Bicycle Facilities
5

Crash Data
6

Crash Data
7

DISCUSSION
8

5) 2045 Strategic Intermodal
System (SIS) Plan Overview
Page 7

What is a Strategic Intermodal
System?
• Established in 2003
• Florida’s highest priority of transportation hubs,
corridors, and connectors
• Primary focus for implementing the Florida
Transportation Plan
• Focus on moving people and freight
▪ Between Florida and other states and nations
▪ Between regions of Florida
• Re-evaluated every 3 years
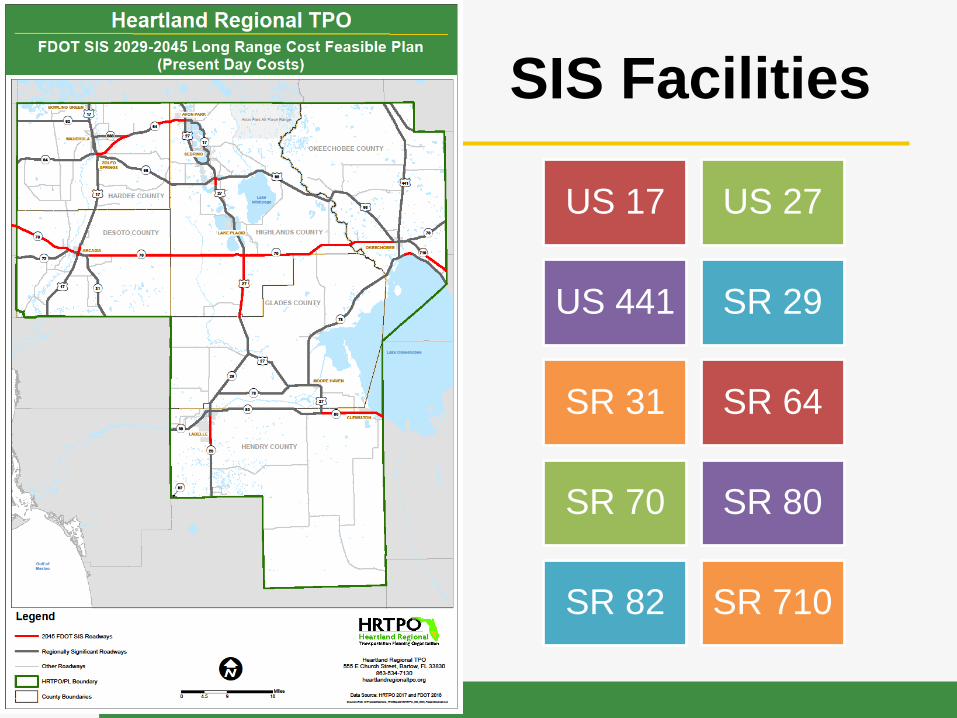
SIS Facilities
US 17 US 27
US 441 SR 29
SR 31 SR 64
SR 70 SR 80
SR 82 SR 710
Strategic Intermodal System (SIS)
Cost Feasible Plan
• Evaluates SIS needs in light of revenues
• Represents a phased plan for capacity
improvements to the SIS
• Utilizes forecasted revenues
• Guided by objectives in the Florida
Transportation Plan (FTP)
• 16 year planning timeframe (FY 2029-2045)
• Divided into 3 funding bands

SIS Designation Criteria Update

2045 SIS Long Range Cost
Feasible Plan (Page 11)


Strategic Growth Criteria
• Must meet one of the following:
▪ Meet SIS minimum activity levels within 3 years of
designation
▪ Determined to be of compelling state interest
• Must meet all of the following:
▪ Have a current master plan and prioritized list of ready
projects
▪ Identified within local government comprehensive plan,
long range transportation plan, comprehensive
economic development strategy, transit development
plan
▪ Have partner and public consensus
▪ Meet community and environment screening criteria

Proposed Changes to Rail
Corridor Designation
14
Rail Corridors Existing Designation Proposed Designation
CSX Transportation, Osceola County Line to Hillsborough County
LineSIS SIS
CSX Transportation, CSX Transportation Line (Lakeland) to Pasco
County LineSIS SIS
CSX Transportation, CSX Transportation Line (Lakeland) to Arcadia SIS SIS
CSX Transportation, CSX Transportation Line (Lakeland) to Palm
Beach CountySIS SIS
CSX Transportation, CSX Transportation Line (Bartow) to South
Polk CountyNot Designated SIS
CSX Transportation, Bradenton to Oneco Not Designated SIS
Seminole Gulf Railway, CSX Transportation Line (Oneco) to
SarasotaNot Designated Strategic Growth
Seminole Gulf Railway, Arcadia to Estero Emerging SIS Strategic Growth
South Central Florida Express, CSX Transportation Line (Sebring) to
Palm Beach County LineEmerging SIS Strategic Growth
CSX Transportation, CSX Transportation Line (West Bartow) to CR
555 SIS Not Designated
CSX Transportation, CSX Transportation Line (Bradley Junction) to
Hooker’s Prairie Mine Rd.Emerging SIS Not Designated

15
Pro
po
sed
SIS
Rail
Co
rrid
ors
-D
RA
FT

Proposed Waterway Corridor
Designation
16
Waterways Existing Designation Proposed Designation
Inland
Okeechobee Waterway Emerging SIS Not Designated

Projects ContinuingRoadway From To Improvement
SR 29 Cowboy Way (CR 80A) Whidden Rd 2 Lanes to 4 Lanes
SR 29 Spencer (F Rd) North of Cowboy Way 2 lanes to 4 lanes
SR 29 CR 832 (Keri Rd) Spencer (F Rd) 2 Lane to 4 Lane
SR 29 Collier / Hendry C/L CR 832 (Keri Rd) 2 Lane to 4 Lane
SR 70 Manatee / DeSoto C/L Jefferson Ave (Arcadia) 2 to 4 Lanes
SR 70 Singletary Rd / DeSoto C/L American Legion Dr (Arcadia) 2 Lane to 4 Lane
SR 70 SR 72 West of Peace River 2 Lane to 4 Lane
SR 70 American Legion Dr (Arcadia) Jefferson Ave (Arcadia) 2 Lane to 4 Lane
SR 70 CR 29 US 98 (Eagle Bay Dr) 2 Lane to 4 Lane
SR 70 Jefferson Ave CR 29 2 Lane to 4 Lane
SR 70 CR 29 Highlands / Okeechobee C/L 2 to 4 Lanes
SR 710 East of L-63 Canal Sherman Wood Ranches 2 Lane to 4 Lane
SR 710 Sherman Wood Ranches Martin / Okeechobee C/L - CR 714 2 Lane to 4 Lane
SR 710 US 441 L-63 Canal New Road

Project AdditionsRoadway From To Improvement
SR 64 US 17 SR 636 2 Lanes to 4 Lanes
SR 64 Hardee / Highlands C/L US 27 2 lanes to 4 lanes
SR 64 Old Town Creek Rd Hardee / Highlands C/L 2 lanes to 4 lanes
SR 70 East of SR 31 Jefferson Ave 2 lanes to 4 lanes
SR 70 Lonesome Island Rd NW 38 Ter 2 Lane to 4 Lane
SR 70 CR 760 DeSoto / Highlands C/L 2 Lane to 4 Lane
US 17 SR 70 Hickory St Highway Capacity
US 17 Hickory St DeSoto ave Highway Capacity
US 27 South of Skipper Rd US 98 4* lane to 6 lanes
US 27 Glades / Highlands C/L SR 70 4* lane to 6 lanes
US 27 Hendry / Palm Beach C/L SR 80 Freight Capacity
US 98 /
US 441 18th Ter 38 Ave 2 Lane to 4 Lane

Project DeletionsRoadway From To Improvement
SR 29 SR 78 US 27 2 Lane to 4 Lane
SR 29 Bermont Rd (CR 74) US 27 2 Lane to 4 Lane
SR 29 Whidden Rd (CR 731) Bermont Rd (CR 74) 2 Lane to 4 Lane

Public Comment Period
Public Comment Survey is available online at:
http://www.fdot.gov/planning/systems/SISPublicComment.htm
FDOT will be collecting public and partner comments through
August 30, 2018
20

6) Heartland Rural Mobility Plan
Update
Page 13

Heartland Rural Mobility Plan Update
HRTPO Technical CommitteeSebring - August 15, 2018

Presentation Agenda
1. Overview of Original 2009 Heartland Rural Mobility Plan (HRMP)
2. HRMP Update Process◦ A. HRTPO Mobility Advisory Committee (MAC)
◦ B. Review Original Recommendations◦ C. Update Socio-Economic Data◦ D. Detail Mobility Options◦ D. Update Plan Analysis◦ E. Develop Priorities and Strategies
3. Heartland Rural Mobility Plan (HRMP) Update◦ A. Mobility Management and Coordination
◦ B. Mobility Service Concept Priorities◦ C. Funding◦ D. HRMP Implementation Strategies
Heartland Rural Mobility Plan Update

HRMP Planning Process
Strategies
• HRTPO Process / Procedures
• Regional Mobility Management
• TD / CTC Structure
Goals
Service Concepts
• Previous HRMP Corridors
• Previous HRMP Circulators
• Coordination with TDP
• Focus on Mobility Management
Technical / SCOT
Assessment
• Strengths
• Challenges
• Opportunities
• Threats
• Service Types / Market
• New Technologies
Data & Analysis
•Updated Socio-Economic
•Updated Commuter Data
• Internal / External Regional Trips
1) To Maintain A Pronounced Mobility Management Approach In Coordinating Rural Transportation Services Emphasizing Customer Characteristics, Needs And Communication Outreach.
2) To Support An On-Going Coordination Of Rural Public Transportation Planning To Maintain and Enhance Mobility Services
3) Establish A Rural Public Transportation Project Development Program Utilizing Service Concepts In The HRMP
4) Develop a Technical Assistance and Project Management Program for Rural Transportation Services Maintenance and Implementation
HRMP Strategies

Demographics: Population
-3.0%
-2.0%
-1.0%
0.0%
1.0%
2.0%
3.0%
4.0%
5.0%
6.0%
DeSoto Glades Hardee Hendry Highlands Okeechobee
Percent Population Change
In the past five years, the overall trend of growth has slowed with several counties losing population since 2010 and only Glades and DeSoto County experiencing population growth since 2010. In spite of this recent trend, analysis by BERB predicts a 16.7% growth with nearly 60,000 more people to over 400,000.

5
Senior Population Growth

6
Income
County Name Median Inc 2015 Median Inc 2010 Change Percent Change
DeSoto County 35,165$ 35,979$ (814)$ -2.3%
Glades County 34,877$ 39,429$ (4,552)$ -11.5%
Hardee County 35,457$ 37,466$ (2,009)$ -5.4%
Hendry County 36,771$ 37,298$ (527)$ -1.4%
Highlands County 35,093$ 34,946$ 147$ 0.4%
Okeechobee County 35,405$ 38,339$ (2,934)$ -7.7%
County Name2015 Percent Pop
Below Poverty
2012 Percent Pop
Below Poverty
DeSoto County 30.6% 26.8%
Glades County 20.2% 25.3%
Hardee County 27.4% 29.7%
Hendry County 26.4% 28.7%
Highlands County 19.4% 19.0%
Okeechobee County 27.7% 27.2%

Existing Mobility Services
▪ Transportation Disadvantaged Services
▪ Transportation Disadvantaged Service Plans
▪ Community Transportation Coordinators (CTCs)
▪ DeSoto-Arcadia Regional Transit (DART) Flex Route Service
▪ ClewBelle Community Bus Route
▪ Commuter Assistance
▪ Inter-County / Inter-Region Services
▪ Health, Education and Other Programs

Regional Mobility Management Alignment
Heartland Mobility Management
FDOT Federal and State Transit Programs
FTA 5310, 5311, Discretionary
grants, Etc.
Commuter Assistance Program
HRTPO Planning Process
Urban and Rural Synergy
CTC Services and
Coordination
CTD Trips & Equipment
Social Service and Health Programs
Florida Dept. Health
Dept. Elderly Affairs
Family & Children Services
Private Sector / Technology
Services
TNC’s
Ridesharing

Mobility Management Support
Mobility management
▪ Encourages innovation and flexibility to reach the "right fit" solution for customers
▪ Plans for sustainability
▪ Strives for easy information and referral to assist customers in learning about and using services
▪ Continually incorporates customer feedback as services are evaluated and adjusted
Mobility management is an approach to designing and delivering transportation services that starts and ends with the customer. It begins with a community vision in which the entire transportation network—public transit, private operators, cycling and walking, volunteer drivers, and others—works together with customers, planners, and stakeholders to deliver the transportation options that best meet the community's needs.
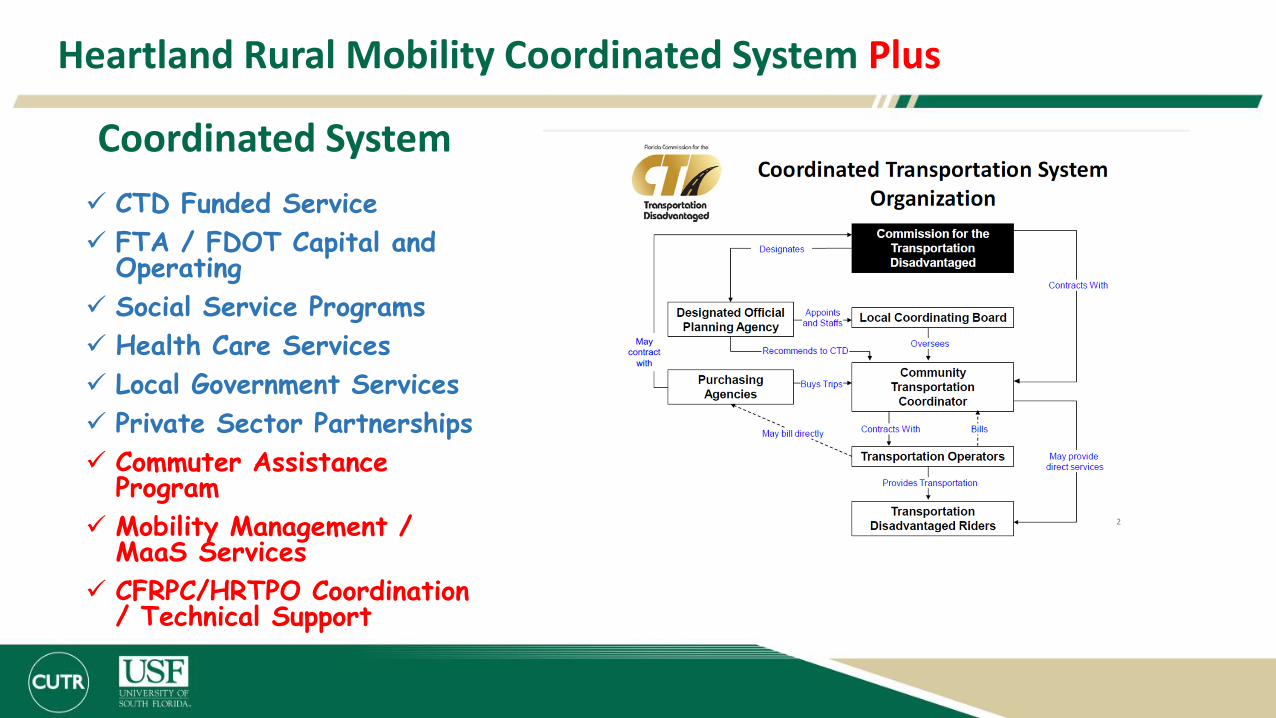
Coordinated System
✓ CTD Funded Service
✓ FTA / FDOT Capital and Operating
✓ Social Service Programs
✓ Health Care Services
✓ Local Government Services
✓ Private Sector Partnerships
✓ Commuter Assistance Program
✓ Mobility Management / MaaS Services
✓ CFRPC/HRTPO Coordination / Technical Support
Heartland Rural Mobility Coordinated System Plus

Funding
➢ Mobility Management – FDOT / CFRPC
➢ Regional Commuter Assistance Program (FDOT)
➢ Coordinated System (CTCs)➢Human Services➢TD Trip and Equipment Grants
➢ FTA / FDOT Grant Programs➢5307 - Urban➢5310 - Seniors / Persons with Disabilities➢5311 - Rural➢5339 – Bus / Facilities➢State Block Grant➢State Corridor Grants➢Service Development➢Discretionary Grants
➢Local Funding
➢Private Sector Services / TNC
➢Volunteer / In-Kind Services
Comprehensive Coordination of existing resources and queue of needs for discretionary and new initiatives funding
12
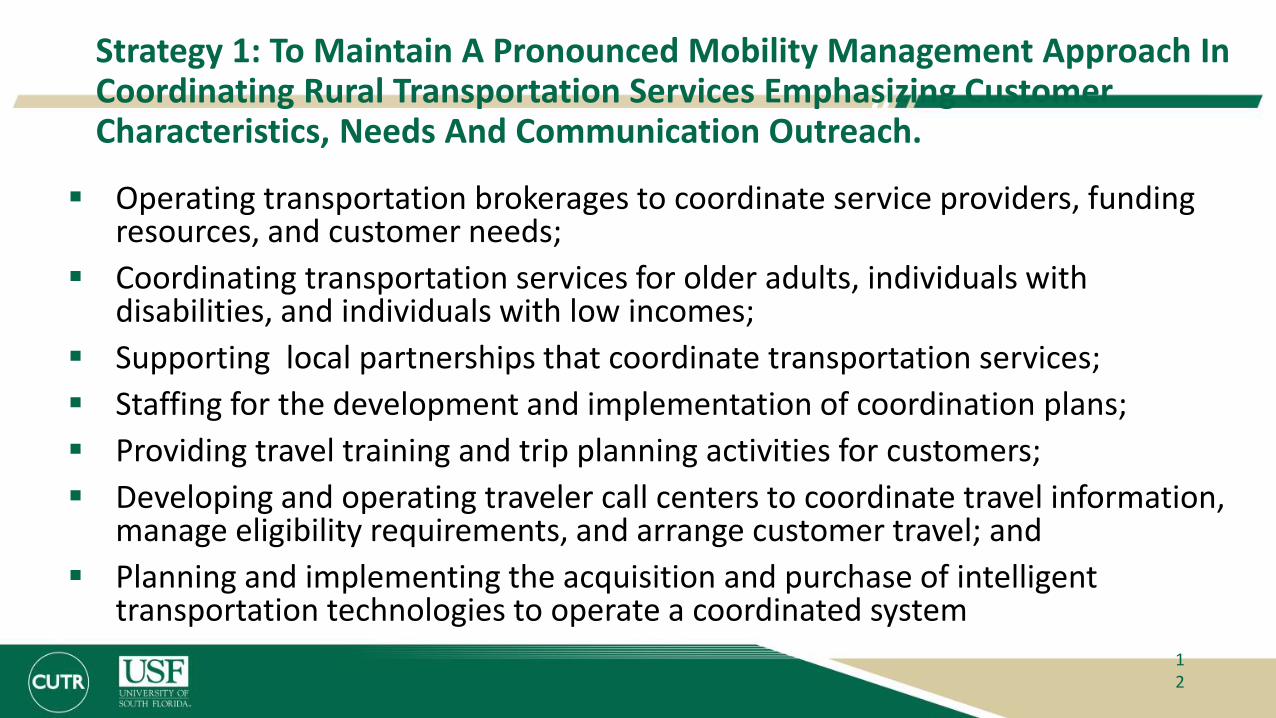
Strategy 1: To Maintain A Pronounced Mobility Management Approach In Coordinating Rural Transportation Services Emphasizing Customer Characteristics, Needs And Communication Outreach.
▪ Operating transportation brokerages to coordinate service providers, funding resources, and customer needs;
▪ Coordinating transportation services for older adults, individuals with disabilities, and individuals with low incomes;
▪ Supporting local partnerships that coordinate transportation services;
▪ Staffing for the development and implementation of coordination plans;
▪ Providing travel training and trip planning activities for customers;
▪ Developing and operating traveler call centers to coordinate travel information, manage eligibility requirements, and arrange customer travel; and
▪ Planning and implementing the acquisition and purchase of intelligent transportation technologies to operate a coordinated system

Strategy 2: To Support An On-Going Coordination Of Rural Public Transportation Planning To Maintain and Enhance Mobility Services
➢Urban / Rural Transportation Planning Coordination
➢Alignment of Service Planning TDP/TDSP/Grant Opportunities
➢Mobility Management / Commuter Assistance Functions
14
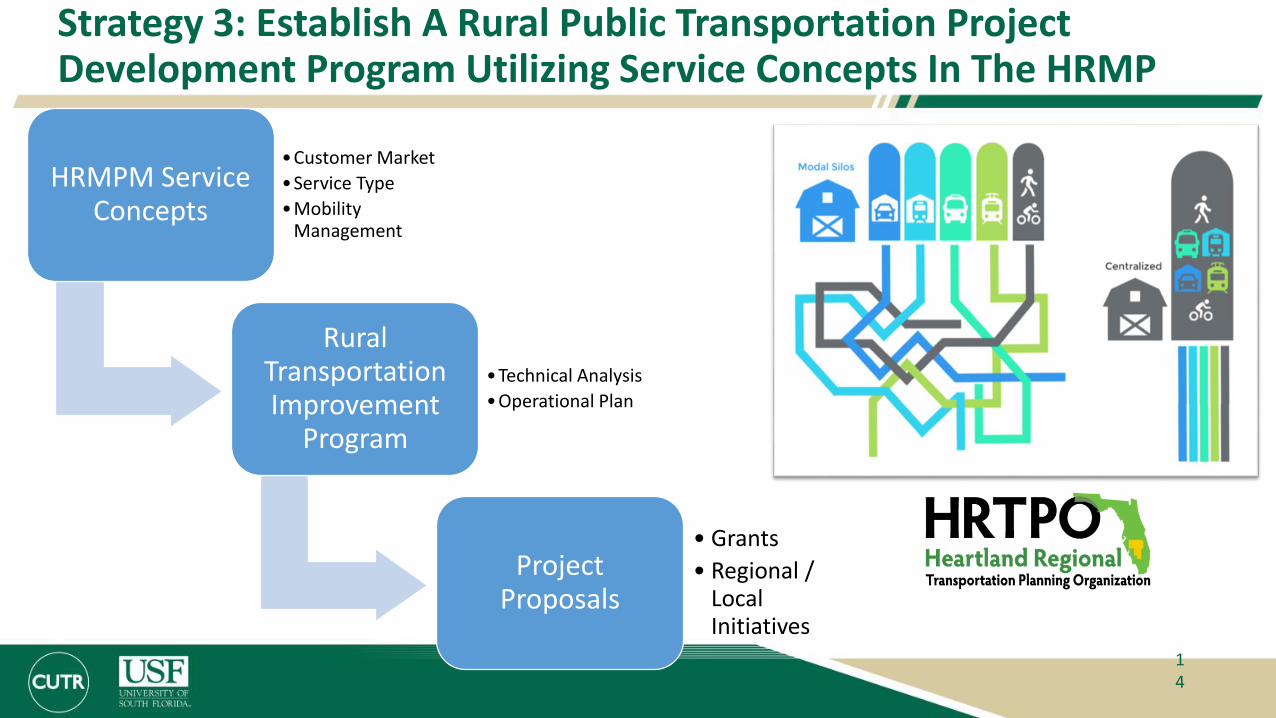
Strategy 3: Establish A Rural Public Transportation Project Development Program Utilizing Service Concepts In The HRMP
HRMPM Service Concepts
•Customer Market
•Service Type
•Mobility Management
Rural Transportation Improvement
Program
•Technical Analysis
•Operational Plan
Project Proposals
• Grants
• Regional / Local Initiatives

15
Strategy 4: Develop a Technical Assistance and Project Management Program for Rural Transportation Services Maintenance and Implementation
Project Management
FDOT
HRTPO
Service Providers
Public Participation
Local Agencies
CTCs

Discussion: Executive Report / Plan Endorsement
I. Background and Purpose
II. Original HRMP Recap
III. Socio-Economic Data
IV. Existing Services
V. Update Plan Analysis
VI. Priorities and Strategies

17
Next Steps – Project Schedule
Refine Concepts / Draft Update
MAC II
MAC III
HRTPO Committees
HRTPO Endorsement
Complete by Early June
Late June
TAC => Wednesday, August 15th
CAC => Thursday, August 23rd
TPO Endorsement => Wednesday, September 19th
MAC III Endorsement – August 9th

18
Consideration for Endorsement
▪ Rob Gregg [email protected]
▪ Jay Goodwill [email protected]
▪ Martin Catala [email protected]
▪ Mitch Spicer [email protected]
▪ Paul Simmons, Modal Development Administrator, District One: [email protected]
▪ Michelle Peronto, Transit Programs Administrator, District One: [email protected]

HRTPO PresentationAugust/September 2018
District One FPID No. 431298-1-22-01 ETDM No. 14316 1

• Northeast quadrant of the US 17 intersection with SR 70, just northeast of downtown Arcadia
• SR 31 is an urban minor arterial with two 12-foot travel lanes and 21% trucks (1450 per day)
• The posted speed limit on SR 31, near its intersection with SR 70, is 45 mph
• No bicycle or pedestrian facilities are present in this portion of the study area
2
Study Area

Purpose and Need
• Support the economic development goals of northeast Arcadia
• Improve traffic operations
• Improve safety conditions in downtown Arcadia
• Improve transportation network connectivity
• Enhance multi-modal mobility
3 3

• Ten corridors evaluated east of
Arcadia from SR 70 to US 17
• Corridors are between 2.5 and 5
miles long
• Connections to US 17 are
between Fiveash Street and
Moore Avenue
4
Alternative Corridors Studied

5
Evaluation Criteria
• Satisfies Purpose and Need
• Receives Public and Stakeholder Support
• Minimizes Potential Environmental Impacts
• Demonstrates Engineering Feasibility
• Minimizes Costs

• DeSoto County
• City of Arcadia
• Heartland Regional TPO
• Arcadia Crossing
• Arcadia Village
• Big Tree RV Resort
• Walmart
• Publix
• Stevenson Family
• Turner Family
• Arcadia Rodeo Association
• Redlands Christian Migrant
Association (RCMA)
6
Stakeholder Coordination Efforts

• All Florida Championship Rodeo• March 10, 2018
• Project booth beside main entrance
• Arcadia Mosaic Arena
• 7,501 visitors on Saturday (24,249 total)
• 561 contestants, 62 vendors, and 40 volunteers total
• Positive reaction from the public
• Majority of public commentswere in support of Corridor J
7
Community Engagement

Thursday, October 4th, 2018
5 p.m. to 7 p.m.
Turner Agri-Civic Center
Exhibition Hall
2250 NE Roan Street, Arcadia, Florida 34266
Project website
www.swflroads.com/sr31extension/sr70tous17
8
Corridor Public Information Meeting

• 1,279 newsletters mailed
• Residents/tenants/property owners
• Consideration given to seasonal residents
9
Public Meeting Outreach

• Hold Public Information Meeting on October 4th, 2018
• Finalize Alternative Corridor Evaluation Report (ACER) based on public input and add recommended corridors
• Publish ETDM Planning Screen Summary Report with ACER
• Approval of final ACER and ETDM Planning Screen Summary Report
• Transition into PD&E Study phase early 2019
10
Next Steps

7) Heartland Regional Sidewalk
Inventory
Page 145
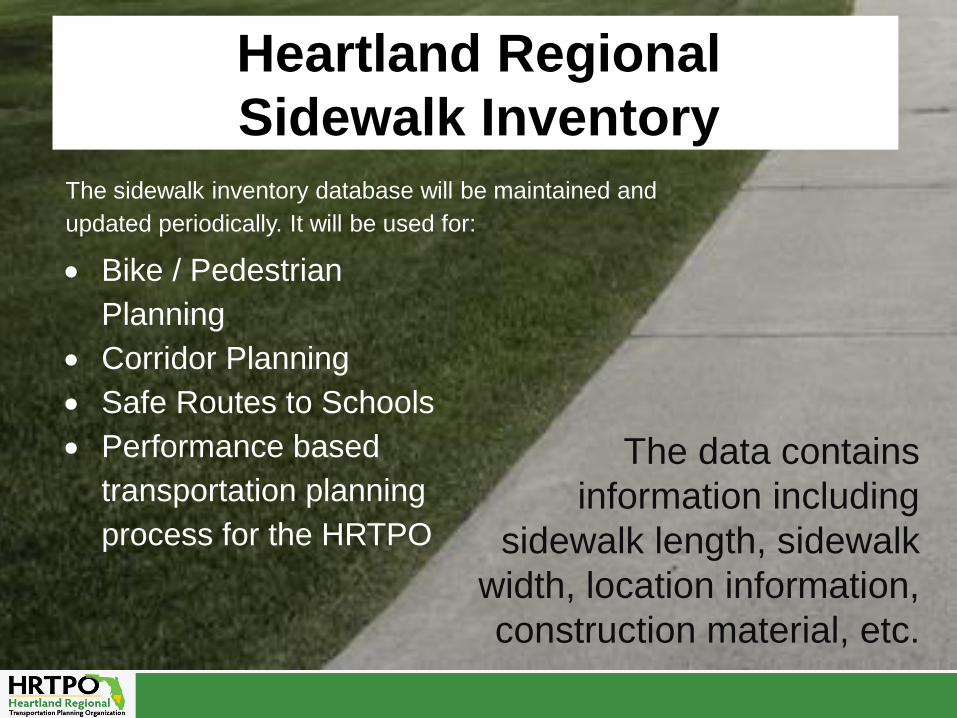
• Bike / Pedestrian
Planning
• Corridor Planning
• Safe Routes to Schools
• Performance based
transportation planning
process for the HRTPO
The sidewalk inventory database will be maintained and
updated periodically. It will be used for:
The data contains
information including
sidewalk length, sidewalk
width, location information,
construction material, etc.
Heartland Regional
Sidewalk Inventory

8) Performance Measures
Page 155

Performance Measures
Implementation
✓Safety Measures
✓Freight Plan
✓Asset Management Plan
✓Planning Requirements
❑Bridge Measures
❑Pavement Measures
❑System Performance (Reliability)
❑Transit Measures

PM2: Pavement ConditionEstablishes criteria to measure the condition of the pavement on the
Interstate System and non Interstate National Highway System (NHS)
roads, and the deck condition of bridges on the NHS
Performance Measure2-Year Target
4-Year Target
Pavement
% of Interstate pavements in GOOD condition N/A ≥ 60%
% of Interstate pavements in POOR condition N/A ≤ 5%
% of non-Interstate NHS pavements in GOOD condition ≥ 40% ≥ 40%
% of non-Interstate NHS pavements in POOR condition ≤ 5% ≤ 5%
NHS Bridge Deck Area
% of NHS bridges by deck area classified as in GOOD
condition≤ 50% ≤ 50%
% of NHS bridges by deck area classified as in POOR
condition≤ 10% ≤ 10%

PM2: Pavement Condition

PM3: ReliabilityMeasures highway system performance (reliability) and freight travel
time reliability
Performance Measure2-Year Target
4-Year Target
Interstate Reliability 75% 70%
Non-Interstate Reliability N/A 50%
Freight Reliability 1.75 2.00

PM3: Reliability

Next Steps
❑ Agree to continue to
support the FDOT
performance measures
and targets
OR
❑ Establish performance
measures and targets
specific to the HRTPO
planning area
Deadline
Nov. 14,
2018

9) Project Prioritization
Process
Page 159

Process for Priority Selection
❑Project submission to HRTPO
❑Project review by HRTPO staff
❑Project submittal to FDOT
❑Preliminary score review by local jurisdiction
❑Project review by TAC and CAC
❑Project review by HRTPO
❑Ranking endorsement by TAC and CAC
❑Priority List Adoption by HRTPO

Current Evaluation Criteria
Non-Capacity Projects
Improve
Safety
40%
Provide
Reliable and
Efficient
Options
30%
Create Quality
Places
20%
Project
Specific
10%

Proposed Evaluation Criteria
Transportation Alternatives Projects
Improve
Safety
40%
Provide
Reliable and
Efficient
Options
40%
Create Quality
Places
20%

Draft Recommendation for Evaluation Criteria of TA Projects
Imp
rove
Sa
fety
Safety
Adjacent road has no car/pedestrian incidents past 5
years0
Adjacent road has 1 or more car/pedestrian incidents past
5 years20
School Zone Safety
Project is within 1-2 miles from a K-12 school 4
Project is 1/2 mile to 1 mile from a K-12 school 10
Project is within 1/2 mile of a K-12 school 16
Project is within 1/4 mile of a K-12 school 18
Project is within 1/8 mile of a K-12 school 20
Evaluation Criteria for TA Projects

Pro
vid
e R
elia
ble
an
d E
ffic
ien
t
Op
tio
ns
Project Linkage
Isolated improvement 0
Connects to network 15
Completes connection/closes gap 30
Project Status/Funding Availability
Additional phase or connects to project in Five-Year Work
Program or Local Capital Improvement Program10
Evaluation Criteria for TA Projects

Cre
ate
Qu
ality
Pla
ce
s
Community and/or Environmental Impact
Potential negative impact on community or environment 0
No impact to community or environment 5
Potential positive impact on community or environment 10
Areas of Limited Modal Choice
Zero Vehicle Household rate in project Census area of 6.1%
or higher10
Evaluation Criteria for TA Projects
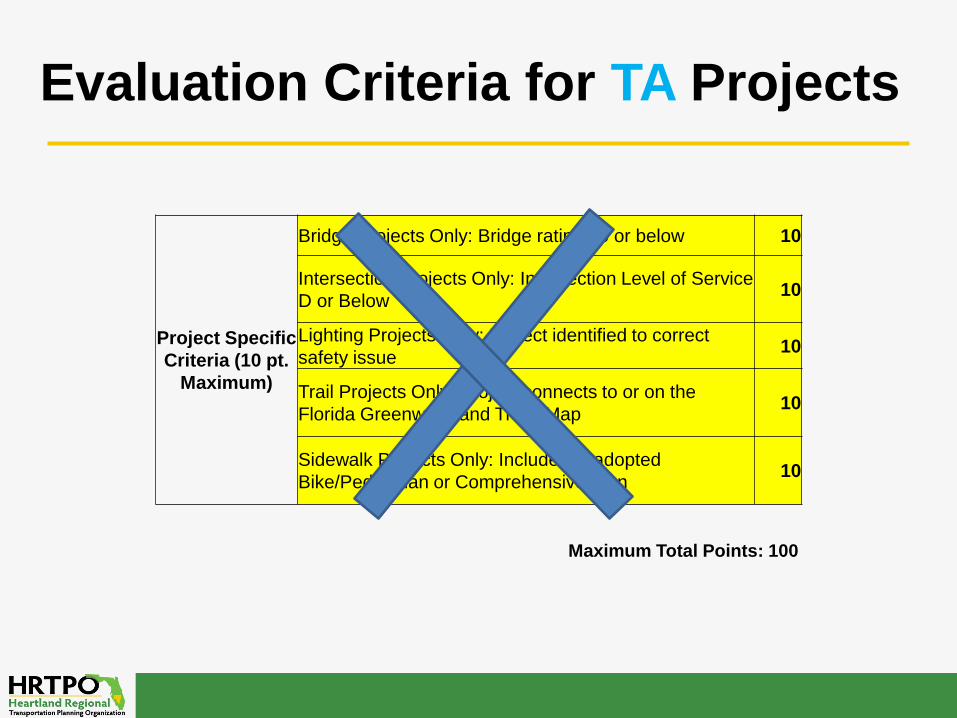
Project Specific
Criteria (10 pt.
Maximum)
Bridge Projects Only: Bridge rating 70 or below 10
Intersection Projects Only: Intersection Level of Service
D or Below10
Lighting Projects Only: Project identified to correct
safety issue10
Trail Projects Only: Project connects to or on the
Florida Greenways and Trails Map10
Sidewalk Projects Only: Included in adopted
Bike/Pedestrian or Comprehensive Plan10
Maximum Total Points: 100
Evaluation Criteria for TA Projects

Proposed Evaluation Criteria
Congestion Management Projects
Improve
Safety
40%
Provide
Reliable and
Efficient
Options
50%
Create Quality
Places
10%

Draft Recommendation for Evaluation Criteria of CM Projects
Imp
rove
Sa
fety Safety
Road/intersection has experienced 1 or more fatal or
serious accidents in previous 5 years20
Pedestrian Safety
Road/intersection has 1 or more car/pedestrian incidents
past 5 years20
Evaluation Criteria for CM
Projects

Pro
vid
e R
elia
ble
an
d E
ffic
ien
t O
pti
on
s
Project Status/Funding Availability
Local funding is available to advance or contribute to
project 10
Level of Service (LOS)
Segment of road or intersection does not meet FDOT LOS
Standards 10
Truck Factor
Truck factor on segment of road or intersection managed
by FDOT is greater than 10% 10
Non Interstate Reliability
Person miles traveled on Non Interstate NHS segment of
road managed by FDOT reported as not reliable or below
50% on FDOT scale 20
Evaluation Criteria for CM
Projects

Cre
ate
Qu
ality
Pla
ce
s
Community and/or Environmental Impact
Potential negative impact on community or environment 0
No impact to community or environment 5
Potential positive impact on community or environment 10
Evaluation Criteria for CM
Projects
Maximum Total Points: 100

10) Transportation
Improvement Program
Page 161
Requested Action
Approve amendment to the
FY 2018/19 - 2022/23 Transportation Improvement
Program

11) Public Participation
Page 189


Goals
INFORM
INVOLVE
INCLUDE
IMPROVE

INFORM
Inform the public of opportunities to participate in the transportation decision-making process.
✓At least one meeting or opportunity is located in each county annually.
✓Translators are available at public meetings in areas where a high proportion of the affected population comprises non-English speakers or when requested.
✓100% of board and committee meetings are accessible to
persons with disabilities.

INVOLVE
Involve the public early and often in the transportation planning process.
✓100% of HRTPO meetings have comment cards available.
✓100% of HRTPO committee meetings will have time for public input on the agenda.
✓Responses to public inquiries are made within 3 working days of the day of receipt.
✓Responses to media inquiries are made within 1 working day of the
date of receipt.
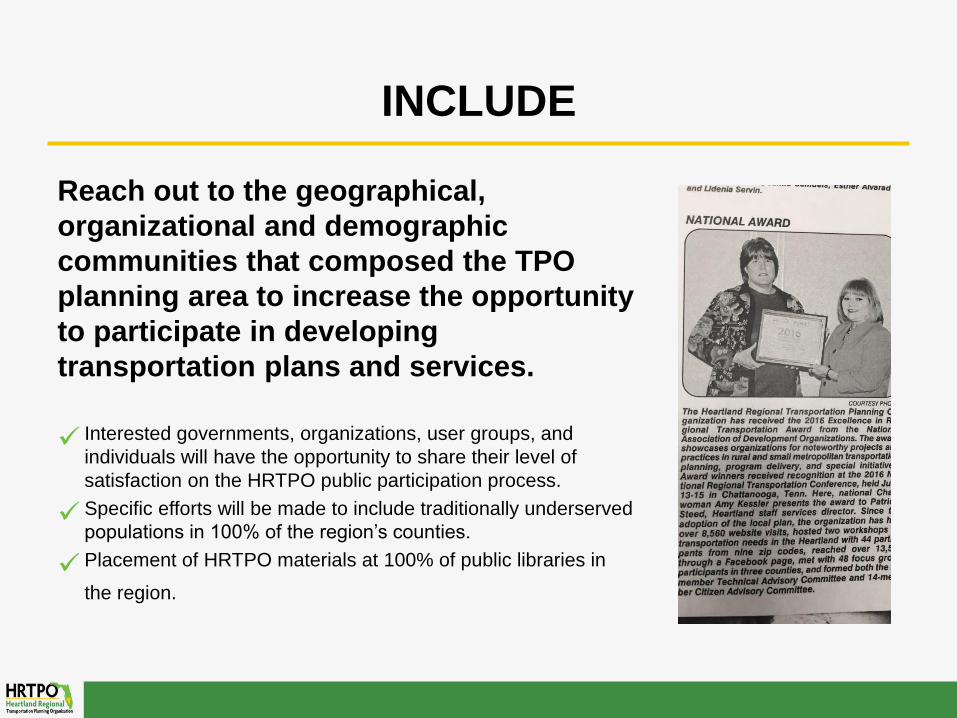
INCLUDE
Reach out to the geographical,
organizational and demographic
communities that composed the TPO
planning area to increase the opportunity
to participate in developing
transportation plans and services.
✓Interested governments, organizations, user groups, and
individuals will have the opportunity to share their level of
satisfaction on the HRTPO public participation process.
✓Specific efforts will be made to include traditionally underserved
populations in 100% of the region’s counties.
✓Placement of HRTPO materials at 100% of public libraries in
the region.

IMPROVE
Continually
identify and
implement ways
to improve the
public
participation
processes.
✓A base-line of results will
be established so that
future outcomes may be
evaluated with a regional
perspective.
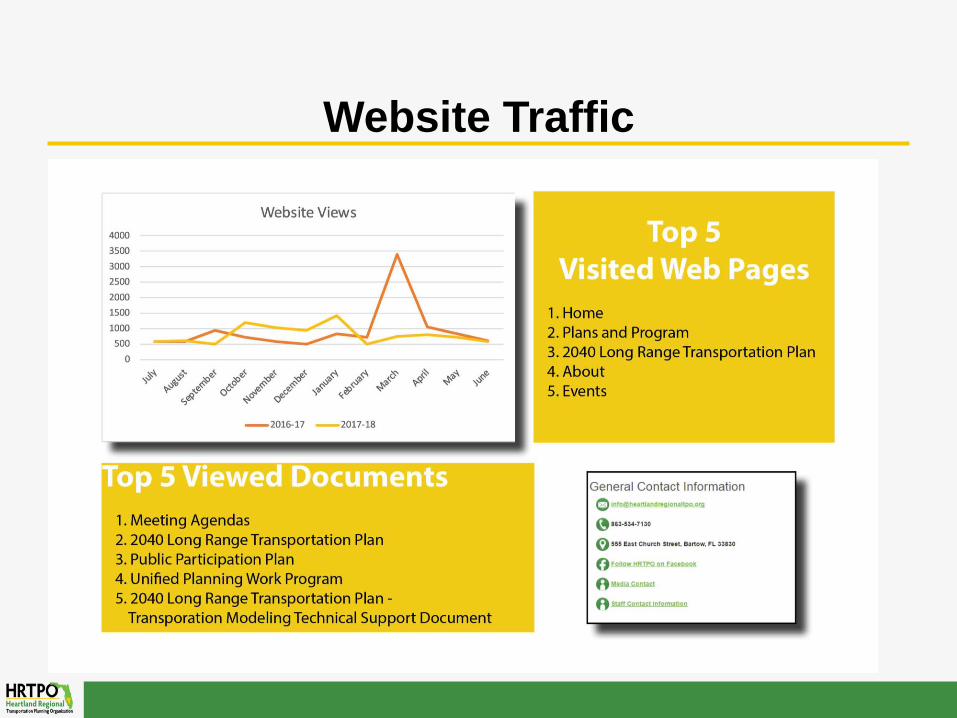
Website Traffic

Facebook Engagement

2015-2018 2018-2021

Inform
Refresh website as dynamic content is now available
Continue to execute the recommendations of the adopted Limited English Proficiency Plan
Involve
Enhance use of Facebook
Continue to work with local governments and community partners to advertise committee openings to fill any vacancies on the established committees
Include
Displays at local libraries
Coordinate with local governments to provide an annual update of HRTPO activities to each county commission
Improve
Reevaluate annual survey tool
Identification of any additional measures
Goals
45 Day Comment Period: September 4 – October 19
12) Other Business
13) Next Meeting
October 17, 2018
10 a.m.
CareerSource Heartland


