Technical University of Denmark
Masking
1st semester project
Ørsted•DTU
Acoustic Technologyfall 2007
Group 6
Troels Schmidt Lindgreen – 073081Kristoffer Ahrens Dickow – 071324
Reynir Hilmisson – 060162
Instructor
Tobias Piechoviak


Ørsted • DTU
Ørsteds Plads Bygning 348
2800 Lyngby
Denmark
Telephone +45 4525 3800
http://www.oersted.dtu.dk
Technical University of Denmark
Title:
Masking
Course:
31230 Acoustic CommunicationFall semester 2007
Project group:
6
Participants:
Troels Schmidt LindgreenKristoffer Ahrens DickowReynir Hilmisson
Supervisor:
Torben Poulsen
Instructor:
Tobias Piechoviak
Date of exercise: November 1st
Pages: 21
Copies: 4
Synopsis:
In this report masking effects are investi-
gated. Masking is when one sound affects
another sound, and is something that
everyone has experienced.
Masking effects can be measured in
different ways; backward, simultaneous
and forward masking. In this report only
simultaneous and forward masking effects
are measured, with three test subjects.
The results show that the simultane-
ous masking effect is most significant
around the center frequency of the masker,
and the forward masking effect decreases
as the time delay between the masker and
the probe signal grows.
No part of this report may be published in any form without the consent of the writers.


Introduction
Auditory masking (henceforth masking), is when when the perception of one sound isaffected by the presence of another sound.
In quiet parts of a song, it is sometimes possible to hear when a singer stamps his footto keep the pace of the rhythm. It is not possible to hear this effect during a full-on rockanthem because the instruments completely drowns the subdued effect. In other wordsthe stamping is masked by the music.
To carry out the analysis of masking, two different experiments are conducted:
• Simultaneous masking
• Forward masking
When testing simultaneous masking effect, two signal intervals are presented consecutively,separated by a pause. A pure tone is presented together with a narrow band noise in onesignal interval while in the other signal interval only the noise is presented. The testsubject is asked to indicate which interval carried the pure tone. From the responses ofthe test subject his/her masking threshold for the given tone and noise can be determined.
When measuring forward masking, three signal intervals are presented consecutively, sep-arated by two pauses. All three signal intervals contain noise, but only one of them hasa probe signal subsequent. The test subject is asked to indicate which interval containedthe probe signal. This time the forward masking threshold is calculated as a function oftime delay.
Technical University of Denmark, 20th of November 2007.
Troels Schmidt Lindgreen Kristoffer Ahrens Dickow Reynir Hilmisson


Contents
1 Masking theory 3
1.1 Masking of pure tones by broadband noise . . . . . . . . . . . . . . . . . . . 41.2 Simultaneous Masking . . . . . . . . . . . . . . . . . . . . . . . . . . . . . . 61.3 Forward Masking . . . . . . . . . . . . . . . . . . . . . . . . . . . . . . . . . 6
2 Measuring methods 9
2.1 Psychometric functions . . . . . . . . . . . . . . . . . . . . . . . . . . . . . . 92.2 Measuring setup . . . . . . . . . . . . . . . . . . . . . . . . . . . . . . . . . 102.3 Simultaneous masking . . . . . . . . . . . . . . . . . . . . . . . . . . . . . . 102.4 Forward masking . . . . . . . . . . . . . . . . . . . . . . . . . . . . . . . . . 12
3 Results 15
3.1 Measurement results for simultaneous masking . . . . . . . . . . . . . . . . 153.2 Measurement results for forward masking . . . . . . . . . . . . . . . . . . . 16
4 Discussion 17
5 Conclusion 19
Bibliography 21

Technical University of Denmark
Page 2 Speech intelligibility report

October 2007 Chapter 1. Masking theory
Chapter 1Masking theory
When exposed to two different sounds (or more), a certain correlation occurs. This corre-lation is known as masking and is encountered in psychoacoustics. Masking is when theperception of one sound is affected by the presence of another sound. Masking plays a veryimportant role in everyday life. For a conversation outside where it is quiet, little speechpower is necessary for the speakers to understand each other. However, if a loud truckpasses by, the conversation is severely disturbed. There are two ways of overcoming thisphenomenon of masking. Either wait until the truck passes or raise the voice to producemore speech power and greater loudness.
The masking threshold is the sound pressure level of a test sound (usually a pure tone),necessary for the test sound to be just audible in the presence of the masker. When maskerand test sound are presented, the masking effects can be measured for either simultaneousand not simultaneous masking depending on the presentation. In the latter case, the testsound has to be a short burst or sound impulse which can be presented before, or after,the masker stimulus is turned on.
For a stimulus presented before the masker, the masking effect produced is called pre-stimulus masking or backward masking. This effect is not very strong, but if the stimulusis presented after the masker is turned off, then the masking effect becomes significant,see figure 1.1. Because the test sound is presented after the termination of the masker,the effect is called forward masking or post-stimulus masking. [Zwicker and Fastl, 1999]
Page 3
Chapter 1. Masking theory Technical University of Denmark
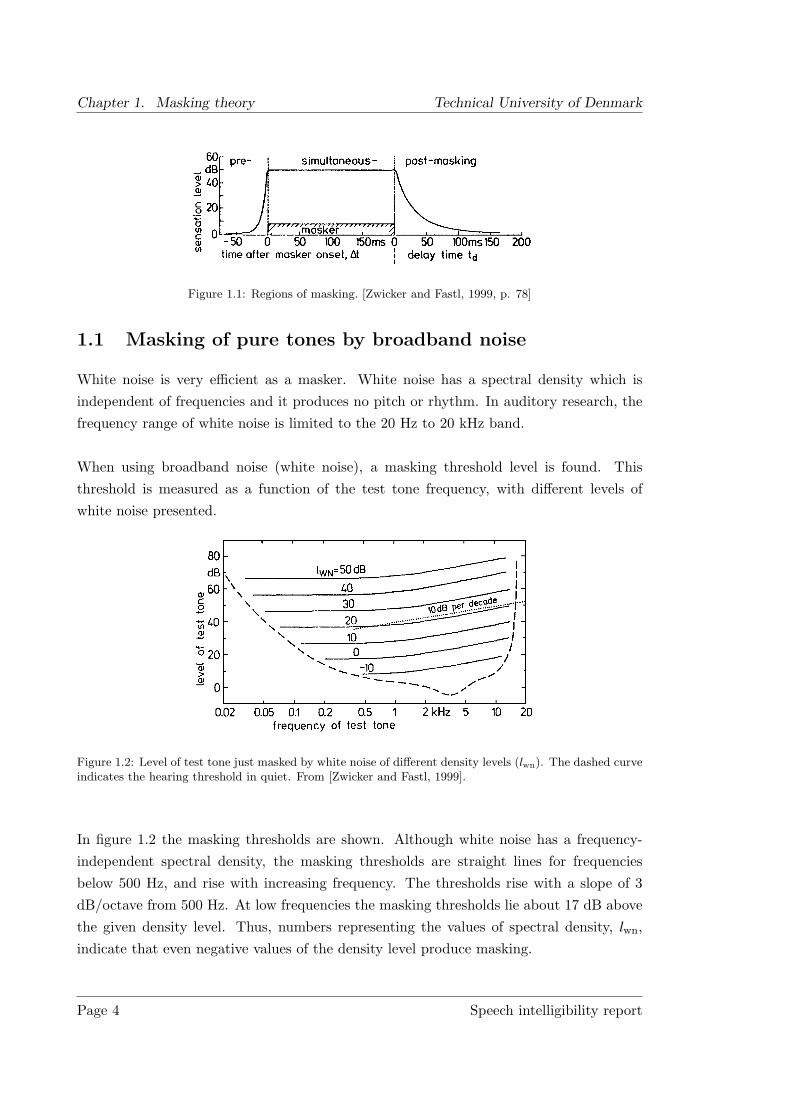
Figure 1.1: Regions of masking. [Zwicker and Fastl, 1999, p. 78]
1.1 Masking of pure tones by broadband noise
White noise is very efficient as a masker. White noise has a spectral density which isindependent of frequencies and it produces no pitch or rhythm. In auditory research, thefrequency range of white noise is limited to the 20 Hz to 20 kHz band.
When using broadband noise (white noise), a masking threshold level is found. Thisthreshold is measured as a function of the test tone frequency, with different levels ofwhite noise presented.
Acoustic Communication T. Poulsen
21
4. Masking The term ‘masking’ is used about the phenomenon that the presence of a given sound (sound A) can make another sound (sound B) inaudible. In other words A masks B or B is masked by A. Masking is a very common phenomenon which is experienced almost every day, e.g. when you need to turn down the radio in order to be able to use the telephone. The situation described above is also called simultaneous masking because both the masking signal and the masked signal are present at the same time. This is not the case in backward and forward masking. (Backward and forward refer to time). Simultaneous masking is best described in the frequency domain and is closely related to the movements of the Basilar membrane in the inner ear. The masking phenomenon is usually investigated by determining the hearing threshold for a pure tone when various masking signals are present. The threshold determined in this situation is called the masked threshold contrary to the absolute threshold.
4.1 Complete masking If the ear is exposed to white noise, the hearing threshold (i.e. masked threshold) will be as shown in Figure 4-1 where also the absolute threshold is shown. The masked threshold is shown for different levels of the white noise.
Figure 4-1. Masking from white noise. The curves show the masked threshold for different spectrum levels of white noise. From (Zwicker and Fastl 1999)
The masked thresholds are almost independent of frequency up to about 500 Hz. Above 500 Hz the threshold increases by about 10 dB per decade (= 3 dB/octave). A 10-dB change in the level of the noise will also change the masked threshold by 10 dB. If a narrow band signal is used instead of the white noise, the masked threshold will be as shown in Figure 4-2. Here the masked threshold is shown for a narrow band signal centred at 250 Hz, 1 kHz and 4 kHz respectively. Generally, the masking curves have steep slopes (about 100 dB/octave) towards the low frequency side and less steep slopes (about 60 dB/octave)
Figure 1.2: Level of test tone just masked by white noise of different density levels (lwn). The dashed curveindicates the hearing threshold in quiet. From [Zwicker and Fastl, 1999].
In figure 1.2 the masking thresholds are shown. Although white noise has a frequency-independent spectral density, the masking thresholds are straight lines for frequenciesbelow 500 Hz, and rise with increasing frequency. The thresholds rise with a slope of 3dB/octave from 500 Hz. At low frequencies the masking thresholds lie about 17 dB abovethe given density level. Thus, numbers representing the values of spectral density, lwn,indicate that even negative values of the density level produce masking.
Page 4 Speech intelligibility report

October 2007 Chapter 1. Masking theory
When the density level is increased by 10 dB, the masking threshold is shifted up by10 dB. This linear behavior of masking is due to broadband white noise. Another thingthat characterises the broadband noise is that the frequency dependence of threshold inquiet, almost completely disappear when thresholds masked by broadband noise are mea-sured. [Zwicker and Fastl, 1999]
1.1.1 Pure tones masked by narrowband noise
Instead of measuring masking effects using broadband noise, narrowband noise can beused. A narrowband noise is generally a noise with a bandwidth equal to, or smaller than,the critical bandwidth. The critical bandwidth is about 100 Hz for frequencies below 500Hz, and 0.2 f for frequencies above 500 Hz [Zwicker and Fastl, 1999].
Masking
Part 1. Simultaneous masking 1.1. Background Simultaneous masking is a very common situation in which both the masking (masker) and the masked signals are presented at the same time. The following figure (Figure 1) shows the masking threshold and the relationship with the absolute hearing threshold.
Figure 1 – Level of a test tone that is just masked by critical-band wide noise with a level of 60 dB, and centre frequencies of 0.25, 1, and 4 kHz. The broken curve is the absolute hearing threshold in quiet. [3]
1.1.1. Narrow band noise and its bandwidth
A narrow band noise which is centred at 1000Hz is used in this exercise. The bandwidth of this narrow band noise follows the 1/3-octave band principle:
61
2−
×= cl ff ; 61
2×= cu ff ; lu ffBandwidth −= where , and are the lower cut-off frequency, centre frequency and the upper cut-off frequency.
lf cf uf
1.1.2. Measurement strategy In the adaptive methods, the presentation level of the signal depends on the course of the previous presentation levels and the subject answers. The one-up three-down method is a transformed up-down method in which the next presentation level is determined by the last few responses. This one-up three-down strategy is based on the last three responses and will result in the 79.4% point on the psychometric function. The level of the signal will decrease after three consecutive positive responses while the level will be increased after one negative response. [2] TAFC means Two Alternative Forced Choice. The test subject shall – between two alternatives – choose the stimulus that contains the signal. The test subject is forced to choose between two alternatives. Figure 2 shows the presentation sequence.
TORBEN POULSEN: 45 25 39 40 (office), e-mail: [email protected] 2
Figure 1.3: Level of test tone masked by narrowband noise. From [Zwicker and Fastl, 1999, p. 64]
Figure 1.3 shows the threshold of pure tones masked by a critical-band wide noise at centerfrequencies of 250 Hz, 1 kHz and 4 kHz. The masking noise has a level of 60 dB, andcorresponding bandwidths of the noise 100 Hz, 160 Hz and 700 Hz, respectively [Zwickerand Fastl, 1999]. For a higher center frequency of the masker, the maximum thresholdfalls as seen on figure 1.3. The difference between the maximum of the masking thresholdsand the dashed straight line in figure 1.3 is 3 dB for the lowest frequency (250 Hz) andthe highest frequency (4 kHz).
When going from low frequencies, the masking thresholds show very steep increases, andafter reaching maximum threshold a decrease not as steep as the increase is seen. Thisincrease is around 100 dB/octave, so in order to get reliable data to measure the thresh-old, the filters of these bands have to have a very step slope of attenuation (more than200 dB/octave), to exceed the frequency selectivity of our hearing system. Otherwise thefrequency response of the filter is measured and not that of our hearing.
Page 5

Chapter 1. Masking theory Technical University of Denmark
1.2 Simultaneous Masking
When two sounds are presented at the same time, a simultaneous masking effect occurs.When measuring simultaneous masking quantitatively, the masking sound is presentedwith limited duration together with short impulses, such as tone bursts or pulses. Thesignal masked can be shifted in frequency, relative to masker, see figure 1.1 on page 4.
In figure 1.1 an illustration of the masking regions are shown. These regions are backwardmasking (pre-masking), simultaneous masking and forward masking (post-masking). Thefigure has two time scales, a ∆t which corresponds to the time relative to the onset of themasker and the second time scale, td, which begins where the masker stops, and forwardmasking effects are seen. [Zwicker and Fastl, 1999]
1.3 Forward Masking
When the masker ends, forward masking occurs. During the time scale given by delaytime, td, found in figure 1.1, the masker is physically inexistent, though it produces mask-ing. This effect can last longer than 100 ms. Backwards masking effect is relative short(about 20 ms) compared to forward masking effect, and therefore forward masking is thedominant, non-simultaneous temporal masking effect. [Zwicker and Fastl, 1999]
When measuring the forward masking effect, the delay time, td, is varied. For a highvalue of this delay time, a lower masking threshold is seen. As this value gets smaller, themasking threshold gets higher.
Acoustic Communication T. Poulsen
23
another sound (sound B) inaudible. Partial masking is a situation where sound A influences the perception of sound B even though sound B is still audible. The influence is mainly seen in the loudness of sound B. An example: When you listen to a standard car-radio while you are driving at, e.g. 100 km/h, you will adjust the level of the radio to a comfortable level. There will be some background noise from the engine, the tires, and the wind around the car (at least in ordinary cars). Then, when you come to a crossing or a traffic light and have to stop you will hear that the radio-volume is much too high. This is an example of partial masking where the background noise masks part of the radio signal and when the background noise disappears the masking disappears too and the radio signal becomes louder than before. (Some modern car radios are equipped with a speed dependent automatic level control. The example above is not fully convincing for such cars.)
4.3 Forward masking It has been shown that a strong sound signal can mask another (weak) signal which is presented after the strong signal. This kind of masking goes forward in time and is therefore called forward masking. Forward masking is also called post-masking (post = after). Figure 4-4 shows the results of a forward masking experiment. The effect lasts for about 200 ms after the end of the strong signal.
Figure 4-4. Threshold of a 20µs Gaussian pressure impulse as a function of the delay, td after the end of a white noise signal. Redrawn from (Zwicker and Fastl 1999)
4.4 Backward masking It has been shown that a strong sound signal can mask another (weak) signal which appears before the strong signal. This kind of masking goes back in time and is therefore called backward masking. Backward masking is also called pre-masking (pre = before). Figure 4-5 shows the result of a backward masking experiment. The effect is restricted to about 20 ms before the start of the
Figure 1.4: Forward masking: peak level of a just-audible 20 µs Gaussian pressure impulse after the endof white noise masker. From [Zwicker and Fastl, 1999, p. 83].
Page 6 Speech intelligibility report
October 2007 Chapter 1. Masking theory
Figure 1.4 shows the masking threshold of a 20 µs Gaussian pressure impulse as a functionof the delay time. For a time delay less then 5 ms, no change is in the masking threshold.After 5 ms a small decrease occurs for high levels. The masking threshold gradually de-creases until a steady state is reached, around 200 ms. [Zwicker and Fastl, 1999]
After describing the theory behind masking, measuring methods will be described in thefollowing chapter.
Page 7

Chapter 1. Masking theory Technical University of Denmark
Page 8 Speech intelligibility report
October 2007 Chapter 2. Measuring methods
Chapter 2Measuring methods
2.1 Psychometric functions
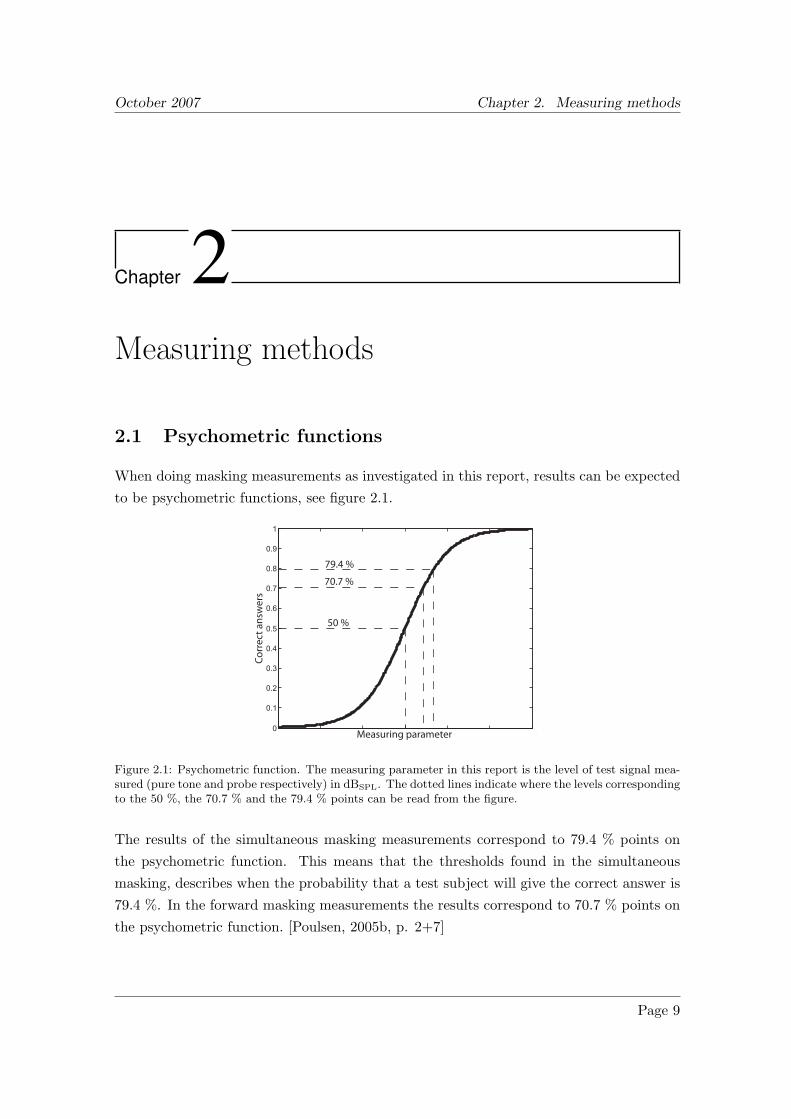
When doing masking measurements as investigated in this report, results can be expectedto be psychometric functions, see figure 2.1.
−15 −10 −5 0 5 10 150
0.1
0.2
0.3
0.4
0.5
0.6
0.7
0.8
0.9
1
50 %
70.7 %
79.4 %
Corr
ect a
nsw
ers
Measuring parameter
Figure 2.1: Psychometric function. The measuring parameter in this report is the level of test signal mea-sured (pure tone and probe respectively) in dBSPL. The dotted lines indicate where the levels correspondingto the 50 %, the 70.7 % and the 79.4 % points can be read from the figure.
The results of the simultaneous masking measurements correspond to 79.4 % points onthe psychometric function. This means that the thresholds found in the simultaneousmasking, describes when the probability that a test subject will give the correct answer is79.4 %. In the forward masking measurements the results correspond to 70.7 % points onthe psychometric function. [Poulsen, 2005b, p. 2+7]
Page 9
Chapter 2. Measuring methods Technical University of Denmark
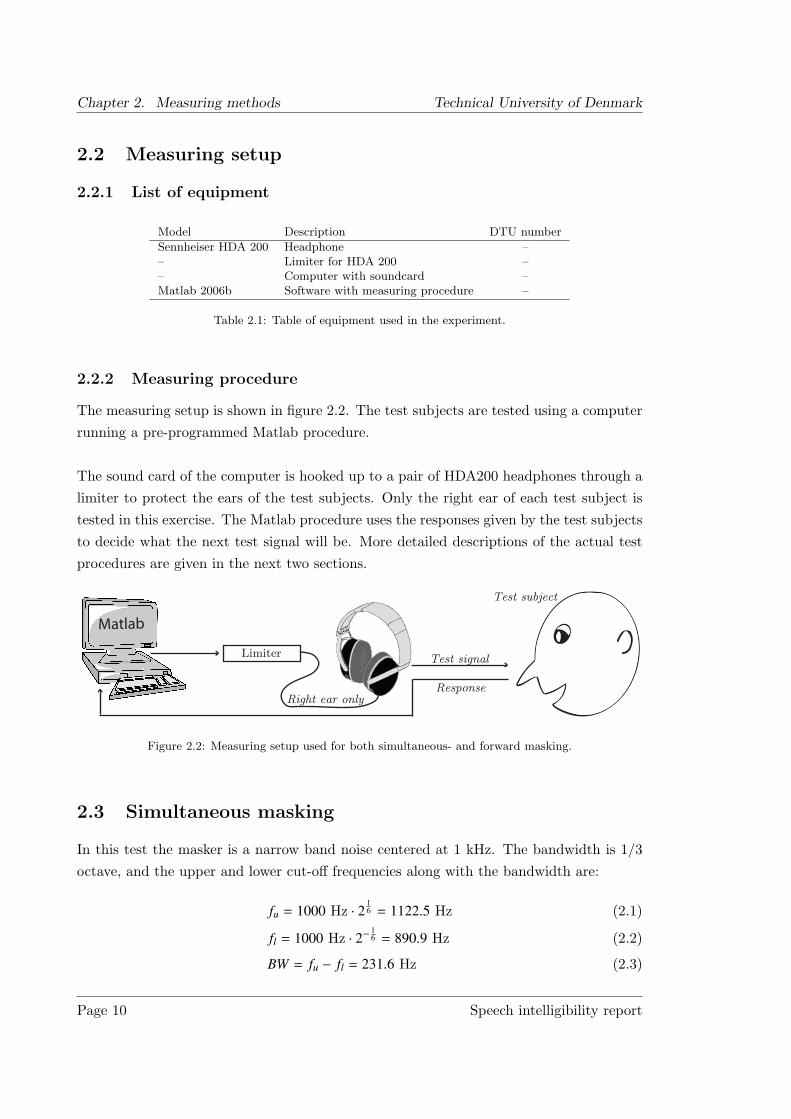
2.2 Measuring setup
2.2.1 List of equipment
Model Description DTU number
Sennheiser HDA 200 Headphone –– Limiter for HDA 200 –– Computer with soundcard –Matlab 2006b Software with measuring procedure –
Table 2.1: Table of equipment used in the experiment.
2.2.2 Measuring procedure
The measuring setup is shown in figure 2.2. The test subjects are tested using a computerrunning a pre-programmed Matlab procedure.
The sound card of the computer is hooked up to a pair of HDA200 headphones through alimiter to protect the ears of the test subjects. Only the right ear of each test subject istested in this exercise. The Matlab procedure uses the responses given by the test subjectsto decide what the next test signal will be. More detailed descriptions of the actual testprocedures are given in the next two sections.
Limiter
Right ear only
Test signal
Response
Test subject
Matlab
Figure 2.2: Measuring setup used for both simultaneous- and forward masking.
2.3 Simultaneous masking
In this test the masker is a narrow band noise centered at 1 kHz. The bandwidth is 1/3octave, and the upper and lower cut-off frequencies along with the bandwidth are:
fu = 1000 Hz · 216 = 1122.5 Hz (2.1)
fl = 1000 Hz · 2−16 = 890.9 Hz (2.2)
BW = fu − fl = 231.6 Hz (2.3)
Page 10 Speech intelligibility report

October 2007 Chapter 2. Measuring methods
The measuring procedure in Matlab uses a two alternative forced choice procedure anda one-up three-down method. [Poulsen, 2005b]. The test sequence is two noise signalsseparated by a pause, where one of the signals also carries a pure tone and the other isjust noise. The test subject is asked to indicate which of the two signals carries the tone.An example on such a test sequence is given in figure 2.3, where the second signal is thecarrier of the pure tone.
Figure 2.3: Presentation sequence of the two alternative forced choice procedure. From [Poulsen, 2005b, p.3].
The pure tones tested are 500 Hz, 630 Hz, 800 Hz, 1 kHz, 1.25 kHz, 1.6 kHz and 2 kHz,and the interval between the two signals in each test sequence is 500 ms. The level of thenoise is constant and set to 75 dBSPL, see figure 2.4.
dBSPL
t
Noi
se
(mas
ker)
Probe signal
td
70
Masking
f [Hz]
Noi
se
(mas
ker)
Pure tone
dBSPL
75
1000 2000500
Masking
Figure 2.4: Narrow band noise centered at 1 kHz with pure tone for determining simultaneous masking.
2.3.1 One-up three-down procedure
The one-up three-down method used is a strategy, where (as the name indicates) thelevel of the test tone is decreased after three consecutive correct responses, but increasedafter only one incorrect answer and results in a 79.4 % point on the psychometric func-tion. [Poulsen, 2005c, p. 22]
How the Matlab procedure works is described in [Poulsen, 2005b, p. 3]. The following iscopied directly from [Poulsen, 2005b, p. 3]:
The one-up three-down method will be applied to measure the masking thresh-old. The pure tone will start with a high sound pressure level and then falldown to the threshold level. The step size is varied. A relative larger step sizeof 4 dB will be introduced at the beginning and then decreased gradually down
Page 11

Chapter 2. Measuring methods Technical University of Denmark
to 1 dB closer to the threshold. The step size sequence is 4 dB, 2 dB and 1 dB.The change of the step size will take place after a negative response until itreaches the smallest step size. The measurement will stop after 8 reversals andthe value of the threshold will be calculated.
For more detailed information about starting and using the Matlab procedure, see [Poulsen,2005b].
2.4 Forward masking
A noise signal is followed by a test signal after a certain time delay. The goal is to deter-mine the masking threshold as a function of the time delay.
A one-up two-down method is applied along with a three Alternative Forced Choice (3-AFC) procedure. The 3-AFC procedure implies that the test subject is presented tosequences of three signals seperated by pauses. All three signals contain the test noise,which is 500 ms of Gaussian distribution white noise, but one of them is followed by a 5 msGaussian distribution white noise probe signal after a certain (short) delay time. [Poulsen,2005b, p. 6] See figure 2.5.
dBSPL
t
Noi
se
(mas
ker)
Probe signal
td
70
Masking
f [Hz]
Noi
se
(mas
ker)
Probe signal
dBSPL
75
1000 2000500
Masking
Figure 2.5: Noise followed by a probe signal for determining forward masking.
The test subject is asked to indicate which of the three signals is subsequent by the probesignal. The goal is to measure the threshold where the probe signal is just audible tothe test subject, at different delay times. The delay times measured are 200 ms, 100 ms,50 ms, 20 ms, 10 ms and 5 ms. The level of the noise is kept constant at 70 dB. The levelof the probe also starts at 70 dB and varies according to the procedure described below.
2.4.1 One-up two-down procedure
As when measuring the effect of simultaneous masking the test probe starts at a highsound pressure level, and the tracking size is varied in the sequence 4 dB, 4 dB, 2 dB and1 dB.
Page 12 Speech intelligibility report
October 2007 Chapter 2. Measuring methods
The level of the test probe is decreased after two consecutive correct answers, but in-creased after only one incorrect answer and results in a 70.7 % point on the psychometricfunction. [Poulsen, 2005c, p. 22]
In the procedure implemented in Matlab, the tests each consists of six trials to determinethe threshold at the given time delay. The measurement will stop after eight reversals andMatlab will calculate the threshold of the probe signal at the given time delay. [Poulsen,2005b, p. 7]
For more detailed information about starting and using the Matlab procedure, see [Poulsen,2005b].
Page 13
Chapter 2. Measuring methods Technical University of Denmark
Page 14 Speech intelligibility report
October 2007 Chapter 3. Results
Chapter 3Results
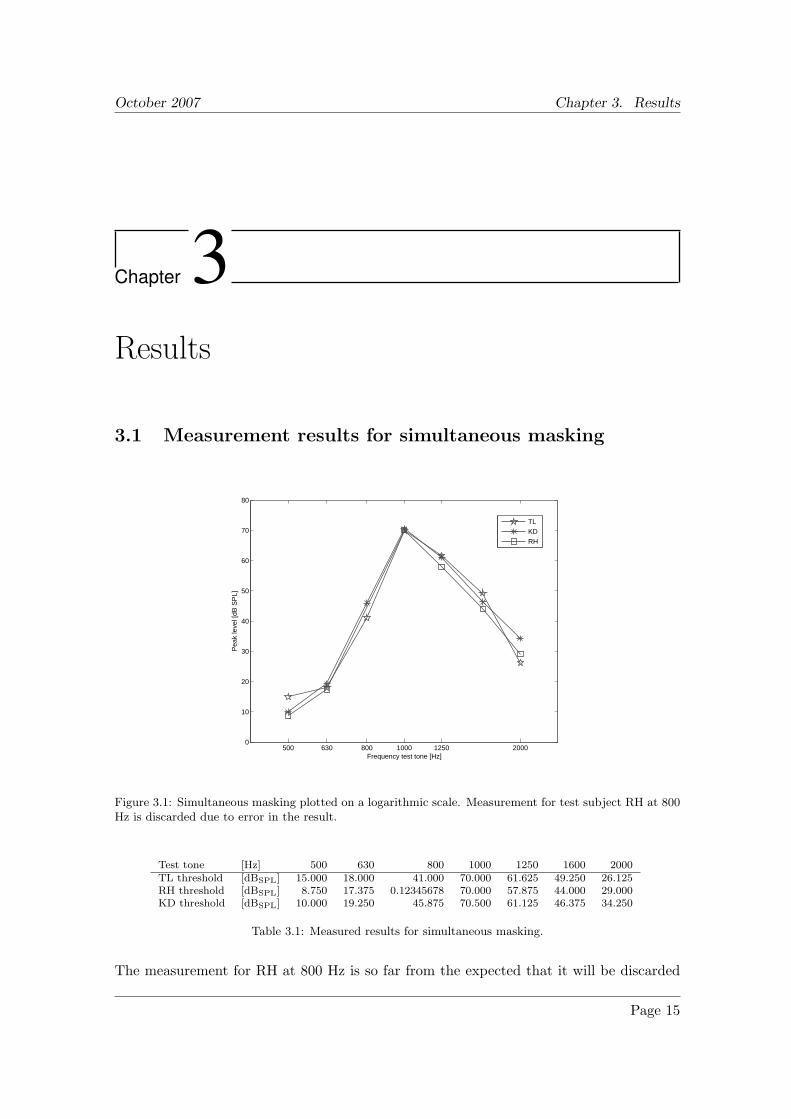
3.1 Measurement results for simultaneous masking
500 630 800 1000 1250 20000
10
20
30
40
50
60
70
80
Frequency test tone [Hz]
Pea
k le
vel [
dB S
PL]
TLKDRH
Figure 3.1: Simultaneous masking plotted on a logarithmic scale. Measurement for test subject RH at 800Hz is discarded due to error in the result.
Test tone [Hz] 500 630 800 1000 1250 1600 2000TL threshold [dBSPL] 15.000 18.000 41.000 70.000 61.625 49.250 26.125RH threshold [dBSPL] 8.750 17.375 0.12345678 70.000 57.875 44.000 29.000KD threshold [dBSPL] 10.000 19.250 45.875 70.500 61.125 46.375 34.250
Table 3.1: Measured results for simultaneous masking.
The measurement for RH at 800 Hz is so far from the expected that it will be discarded
Page 15

Chapter 3. Results Technical University of Denmark
as an error. From table 3.1 it is clear that the measurement is wrong. Every othermeasurement result have 3 significant decimals except the measurement at 800 Hz.
3.2 Measurement results for forward masking
5 10 20 50 100 20030
32
34
36
38
40
42
44
46
48
50
Delay time [ms]
Pea
k le
vel [
dB S
PL]
TLKDRH
Figure 3.2: Forward masking plotted on a linear scale.
Delay [ms] 5 10 20 50 100 200TL threshold [dBSPL] 49.250 88.625 46.275 38.875 34.250 31.000RH threshold [dBSPL] 48.125 46.500 43.750 43.625 31.250 34.750KD threshold [dBSPL] 48.750 45.500 40.500 38.625 33.875 36.875
Table 3.2: Measured results for forward masking.
Page 16 Speech intelligibility report

October 2007 Chapter 4. Discussion
Chapter 4Discussion
In this discussion the results is compared to theory and discussed. It is assumed that allthree test subjects are normal hearing although no preliminary measurements have beenconducted to support this assumption. It is also assumed that the equipment used for themeasurements in this report is correctly calibrated, since the measurements are based onpre-defined Matlab scripts were the authors have no insight.
The measurement results correspond to theory as described in chapter 1. This is eas-ily seen on figure 4.1 where the results for simultaneous masking are plotted on a referencefigure from [Poulsen, 2005a, p. 22]. Note that the results can not be directly compared.The reference figure is assumed to be measured on the 79.4 % point of the psychometricfunction and thereby comparable to the measured results from this report. The resultsof this report have been measured using 1/3 octave bands where the reference figure usescritical bands as described in chapter 1. This denotes that the measurent results of thisreport can not be directly compared to the measurent results from [Poulsen, 2005a] butthe curve is assumed to be on the same form so the reference figure can be used to supportthe results in this report.
As described in section 3.1 the measurement for simultaneous masking for RH at 800 Hzis so far from the expected that it will be discarded as an error, see figure 3.1. On figure3.1 it is seen that when going from low to high frequencies, the slope is somewhat steeperbefore the maximum level is reached compared to the decreasing slope after the maximum.This corresponds to figure 4.1 where the slopes are approximately 75 dB/octave in theinterval 630 Hz - 1 kHz and 40 dB/octave in the interval 1 kHz - 2 kHz.
The results for forward masking can be seen on figure 3.2. The figure shows that a stimuli
Page 17

Chapter 4. Discussion Technical University of Denmark
leve
l of t
est t
one
100
80
60
40
20
0
dB
0.02 0.05 0.1 0.2 0.5 1 2 kHz 5 10 20frequency of test tone
Figure 4.1: Average of measurements for simultaneous masking with a constant noise level of 75 dBSPL
are plotted on a figure from [Poulsen, 2005a, p. 22].
after a short period is masked more than a stimuli after a long period. The threshold,determining that a person can hear the subsequent stimuli, is very much depending onhow long the time delay is.
After a 100 ms time delay the threshold is starting to stabilize. Theory shows that after200 ms the threshold is stable This can not be seen from the results in this report. Toshow a stable threshold after 200 ms, more tests have to be executed, e.g. at 300 ms and400 ms time delay. Likewise for thresholds before 5 ms that are also expected to be stable,see figure 1.4 on page 6.
The average of the forward masking results correlates to theory, but with deviations.The measurement result for RH at 50 ms time delay deviate from the expected. Thereason for this can be from surrounding noise during the measurements. The surroundingnoise consisted of people talking and, among others, vibrations into the ear traveling fromthe floor. The vibrations were so close to the probe in frequency and intensity that issounded like there was a probe after two signal intervals instead of just one, making itvery difficult to detect the right probe.
Contrary to the expected test subject KD and RH have a higher threshold at 200 msthan at 100 ms. The deviation is 3 dB for both and is considered to be in the normalinterval of deviation. The adaptive methods used in this report take minor errors intoaccount by demanding three or two positive answers for the two tests respectively. Thetest is not stopped before 8 reversals had been carried out, making the influence fromisolated errors originated from noise very little. At times the noise were consistent over aperiod so the surrounding noise could have influenced the measurement.
Page 18 Speech intelligibility report

October 2007 Chapter 5. Conclusion
Chapter 5Conclusion
The scope of this report was to investigate simultaneous masking and forward masking.Theory has been described, mainly considering those two types of masking. Measurementsof simultaneous and forward masking were conducted and the setup described. The resultswere presented and discussed by comparison to theory.
From the discussion the following was concluded:
• The measurement results correspond to theory.
• The masking threshold for simultaneous masking is worst around the center fre-quency of the masker.
• The masking threshold for forward masking becomes better the greater the timedelay between the masker and the probe signal.
When comparing the results with what could be expected, similar graphs are seen.
The masking threshold for simultaneous masking is worst (highest) around the centerfrequency of the masker. The further away from a masker the threshold becomes signifi-cantly better (lower). At lower frequencies than the masker the masking is less effectivethan at frequencies higher than the masker.
The masking threshold, where the test sound is just audible, is lower than the level ofthe masker at all frequencies within the hearing threshold.
The masking threshold for forward masking becomes better the greater the time delaybetween the masker and the probe signal. At small time delays the masking effect be-comes greater making the threshold worse (higher).
Page 19

This report only measures from 5 ms up to 200 ms and thus it can not be concludedthat the threshold will stabilize before 5 ms and after 200 ms.
In order to achieve better results, the following propositions are given:
– Steady and quiet surroundings, perhaps an audiometric booth.
– A Matlab script that works without constant error messages and faulty measurement.
October 2007 Chapter 5. Conclusion
Bibliography
[Poulsen, 2005a] Poulsen, T. (2005a). Acoustic Communication, Hearing and Speech. 2.0edition. Only available from DTU campusnet.
[Poulsen, 2005b] Poulsen, T. (2005b). Masking. September 11th. edition. Only availablefrom DTU campusnet.
[Poulsen, 2005c] Poulsen, T. (2005c). Psychoacoustic Measuring Methods. 2.2 edition.
[Zwicker and Fastl, 1999] Zwicker, E. and Fastl, H. (1999). Psychoacoustics. Facts andModels. 2 edition. Available at Ørsted DTU Library Building 352.
Page 21


![[Engberg-Pederson, Troels Engberg-Pedersen] Aristo(BookZa.org)](https://cdn.vdocument.in/doc/165x107/55cf98ea550346d0339a6e12/engberg-pederson-troels-engberg-pedersen-aristobookzaorg.jpg)

