TEEKAY LNGPARTNERS Q2-2018 EARNINGS PRESENTATIONAugust 2, 2018
Forward Looking StatementThis presentation contains forward-looking statements (as defined in Section 21E of the Securities Exchange Act of 1934,
as amended) which reflect management’s current views with respect to certain future events and performance, including
statements regarding: the timing of newbuilding vessel deliveries and the commencement of related contracts; the start-up
timing for the second Yamal LNG project’s train; the future Multi-gas carrier market; the effects of future newbuilding
deliveries on the Partnership’s future cash flows and balance sheet leverage; the timing and certainty of completing the
refinancing of Teekay LNG’s unsecured revolver; Teekay LNG’s ability to benefit from future LNG fundamentals and the
timing of payment by the Teekay Nakilat Joint Venture of a tax indemnification guarantee liability. The following factors are
among those that could cause actual results to differ materially from the forward-looking statements, which involve risks
and uncertainties, and that should be considered in evaluating any such statement: potential shipyard and project
construction delays, newbuilding specification changes or cost overruns; changes in production of LNG or LPG, either
generally or in particular regions; changes in trading patterns or timing of start-up of new LNG liquefaction and
regasification projects significantly affecting overall vessel tonnage requirements; changes in applicable industry laws and
regulations and the timing of implementation of new laws and regulations; the potential for early termination of long-term
contracts of existing vessels in the Partnership's fleet; the inability of charterers to make future charter payments; the
inability of the Partnership to renew or replace long-term contracts on existing vessels; the Partnership’s or the
Partnership’s joint ventures’ ability to secure or draw on financings for its vessels; progress of the Yamal LNG project;
refinancing discussions with lenders and indemnification guarantee discussions with the HMRC; and other factors
discussed in Teekay LNG Partners’ filings from time to time with the SEC, including its Report on Form 20-F for the fiscal
year ended December 31, 2017. The Partnership expressly disclaims any obligation to release publicly any updates or
revisions to any forward-looking statements contained herein to reflect any change in the Partnership’s expectations with
respect thereto or any change in events, conditions or circumstances on which any such statement is based.
2
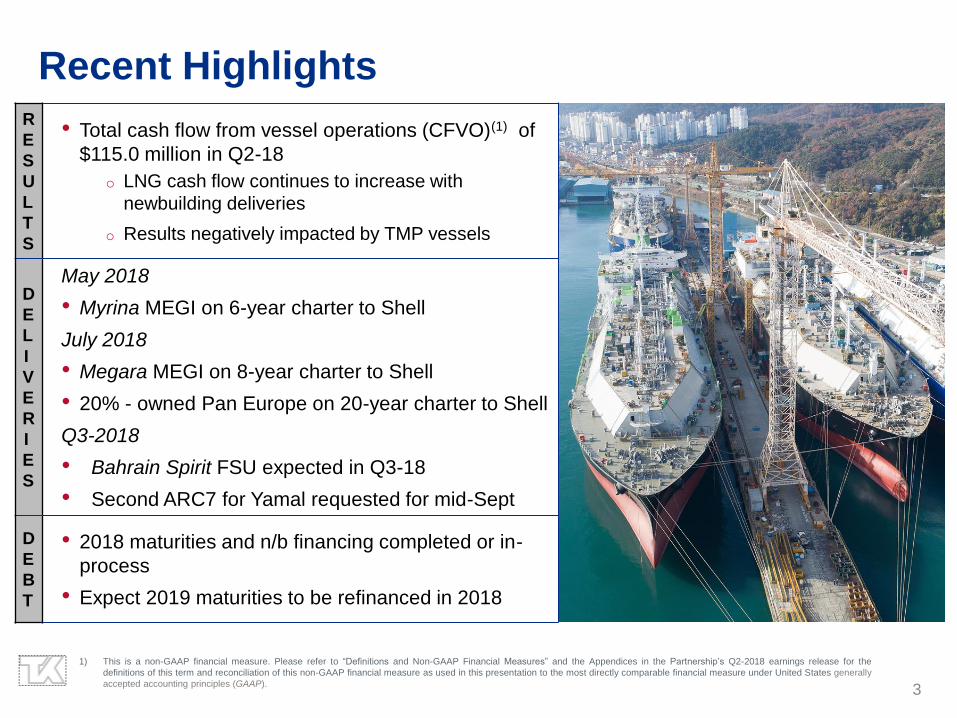
Recent Highlights
1) This is a non-GAAP financial measure. Please refer to “Definitions and Non-GAAP Financial Measures” and the Appendices in the Partnership’s Q2-2018 earnings release for the
definitions of this term and reconciliation of this non-GAAP financial measure as used in this presentation to the most directly comparable financial measure under United States generally
accepted accounting principles (GAAP).
R
E
S
U
L
T
S
• Total cash flow from vessel operations (CFVO)(1) of
$115.0 million in Q2-18
o LNG cash flow continues to increase with
newbuilding deliveries
o Results negatively impacted by TMP vessels
D
E
L
I
V
E
R
I
E
S
May 2018
• Myrina MEGI on 6-year charter to Shell
July 2018
• Megara MEGI on 8-year charter to Shell
• 20% - owned Pan Europe on 20-year charter to Shell
Q3-2018
• Bahrain Spirit FSU expected in Q3-18
• Second ARC7 for Yamal requested for mid-Sept
D
E
B
T
• 2018 maturities and n/b financing completed or in-
process
• Expect 2019 maturities to be refinanced in 2018
3

Evidence of Ongoing Tightening in LNG Market
• LNG carrier spot rates were 63% higher year-over-year in 1H 2018
• LNG carrier demand driven by strong demand in Asia and arbitrage
o Chinese imports were 49% higher in 1H 2018 vs. 1H 2017
o Europe to Asia arbitrage was similar to peak winter levels
• Magellan Spirit took advantage of stronger spot rates with ~$90k/day voyage
4
0
10,000
20,000
30,000
40,000
50,000
60,000
70,000
80,000
90,000
$/d
ay
160k CBM Spot Rate
2016 2017 2018
Source: Clarksons
0
2
4
6
8
10
12
Jan-16Apr-16Jul-16Oct-16Jan-17Apr-17Jul-17Oct-17Jan-18Apr-18Jul-18
$/m
mbtu
Source: Thomson Reuters
LNG Prices and Arbitrage
Europe Asia Arbitrage Asia Spot
Europe (NBP) Henry Hub
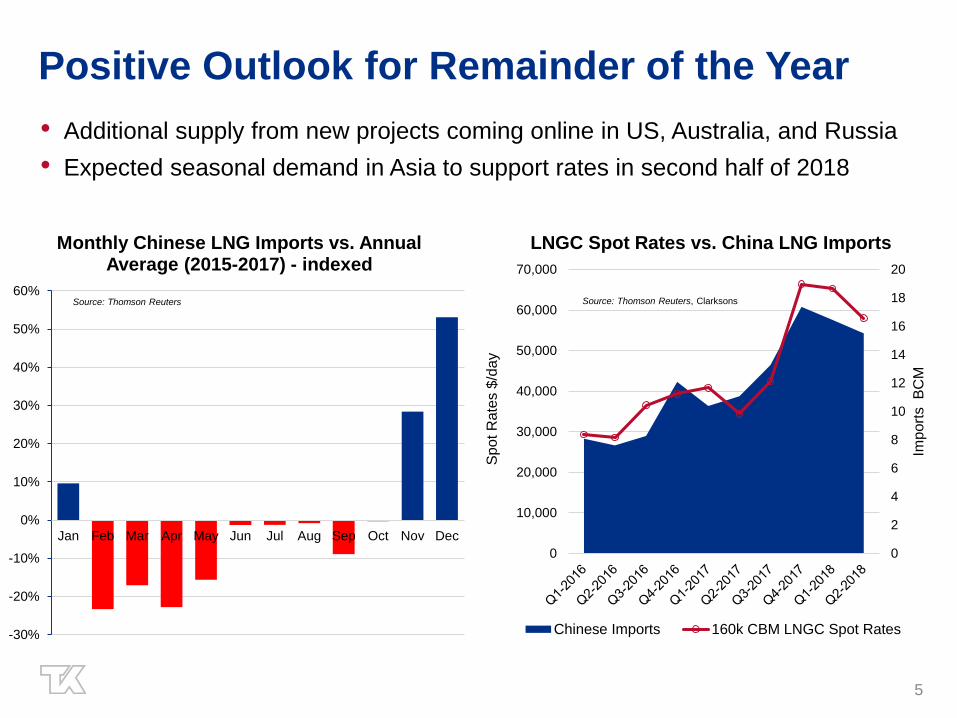
Positive Outlook for Remainder of the Year
• Additional supply from new projects coming online in US, Australia, and Russia
• Expected seasonal demand in Asia to support rates in second half of 2018
5
0
2
4
6
8
10
12
14
16
18
20
0
10,000
20,000
30,000
40,000
50,000
60,000
70,000
Imp
ort
s B
CM
Sp
ot R
ate
s $
/da
y
LNGC Spot Rates vs. China LNG Imports
Chinese Imports 160k CBM LNGC Spot Rates
Source: Thomson Reuters, Clarksons
-30%
-20%
-10%
0%
10%
20%
30%
40%
50%
60%
Jan Feb Mar Apr May Jun Jul Aug Sep Oct Nov Dec
Monthly Chinese LNG Imports vs. Annual Average (2015-2017) - indexed
Source: Thomson Reuters

Bahrain LNG Import Terminal 90%+ Complete Commercial start-up for project expected in March 2019
6

Delivering Long-Term Value to Unitholders
7
Financings
progressing
One remaining
newbuild to be
financed; all 2018
and 2019
refinancings on-
track
Newbuildings
delivering
9 LNG and 3 LPG
carriers delivered in
past 10 months;
remaining 9 LNG n/bs
and Bahrain LNG
Terminal on-track, or
early
Built-in cash flow
growth
~$310 million of
incremental fixed-rate
LNG cash flow p.a. to be
realized Q4-2017 thru
Q1-2020
Attractive LNG
Supply/Demand
Fundamentals
Balanced
financial
strategy
Balancing delevering
with returning capital
to unitholders and
pursuit of attractive
growth
Significant new LNG
Vessel Orders Needed
by 2030
Executing on Business and Financial Strategy
Strong Underlying LNG Fundamentals

Appendix
Financing
completed
Macoma
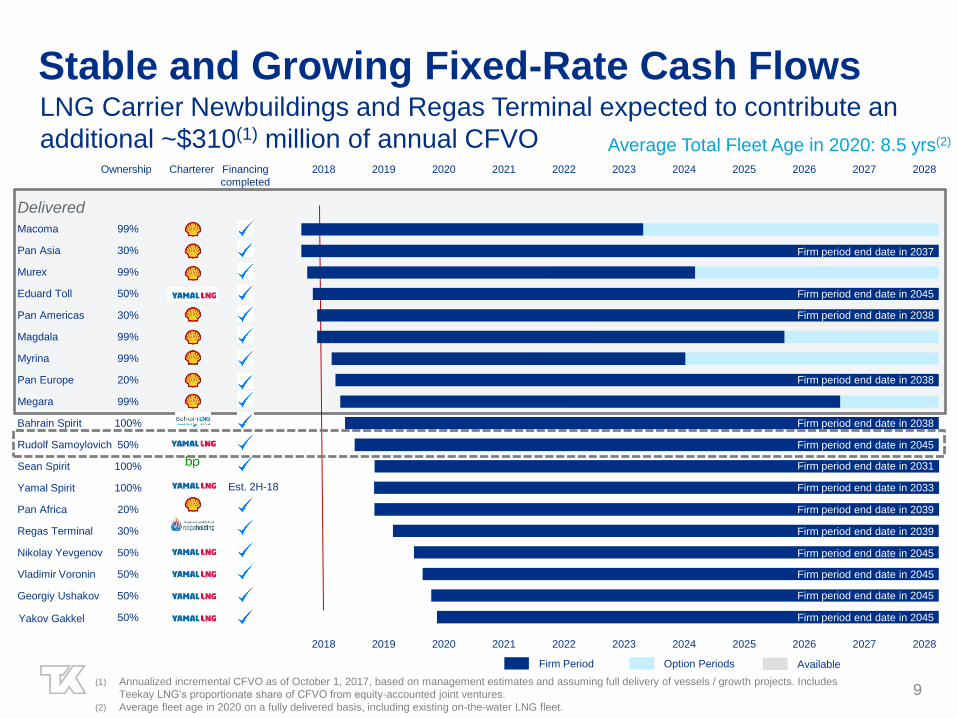
LNG Carrier Newbuildings and Regas Terminal expected to contribute an
additional ~$310(1) million of annual CFVO
Stable and Growing Fixed-Rate Cash Flows
9
2018 2019 2020 2021 2022 2023 2024 2025 2026 2027 2028
Murex
Magdala
Myrina
Megara
Charterer
Bahrain Spirit
Sean Spirit
Yamal Spirit
Pan Asia
Pan Americas
Pan Europe
Pan Africa
Ownership
99%
99%
99%
99%
99%
Regas Terminal
100%
30%
100%
30%
30%
20%
20%
Eduard Toll
Rudolf Samoylovich
Nikolay Yevgenov
Vladimir Voronin
50%
50%
50%
50%
50%
50%
Georgiy Ushakov
Yakov Gakkel
100%
2018 2019 2020 2021 2022 2023 2024 2025 2026 2027 2028
Firm Period Option Periods
Firm period end date in 2045
Firm period end date in 2045
Firm period end date in 2045
Firm period end date in 2045
Firm period end date in 2045
Firm period end date in 2045
Firm period end date in 2039
Firm period end date in 2038
Firm period end date in 2038
Firm period end date in 2037
Firm period end date in 2039
Firm period end date in 2038
Available
Est. 2H-18
Delivered
(1) Annualized incremental CFVO as of October 1, 2017, based on management estimates and assuming full delivery of vessels / growth projects. Includes
Teekay LNG’s proportionate share of CFVO from equity-accounted joint ventures.
(2) Average fleet age in 2020 on a fully delivered basis, including existing on-the-water LNG fleet.
Average Total Fleet Age in 2020: 8.5 yrs(2)
Firm period end date in 2031
Firm period end date in 2033

Long-Term Contract Coverage With High- Quality Customers
10
2018 2019 2020 2021 2022 2023 2024 2025 2026 2027 2028ChartererOwnership
Hispania Spirit 100%
2018 2019 2020 2021 2022 2023 2024 2025 2026 2027 2028
Option PeriodsFirm Period Available
Existing LNG Fleet
Madrid Spirit 100%
Al Marrouna 70%
Al Areesh 70%
Al Daayen 70%
Catalunya Spirit 100%
Wilforce 99%
Wilpride 99%
Creole Spirit 100%
Oak Spirit 100%
Torben Spirit 100%
Excalibur 49%
Magellan Spirit 52% Spot Market
Methane Spirit 52% Spot Market
Woodside Donaldson 52%
(1) Trading in short-term market as a result of the temporary closing of YLNG’s LNG plant in Yemen in 2015 due to the conflict situation.
Tangguh Hiri 69% Firm period end date in 2029
Marib Spirit(1) 52% Firm period end date in 2029
Arwa Spirit(1) 52% Firm period end date in 2029
Tangguh Sago 69% Firm period end date in 2029
Galicia Spirit 100% Firm period end date in 2029
Meridian Spirit 52% Firm period end date in 2030
Soyo 33% Firm period end date in 2031
Malanje 33% Firm period end date in 2031
Lobito 33% Firm period end date in 2031
Cubal 33% Firm period end date in 2032
Al Huwaila 40% Firm period end date in 2033
Al Kharsaah 40% Firm period end date in 2033
Al Shamal 40% Firm period end date in 2033
Al Khuwair 40% Firm period end date in 2033
Arctic Spirit 99%
Polar Spirit 99%
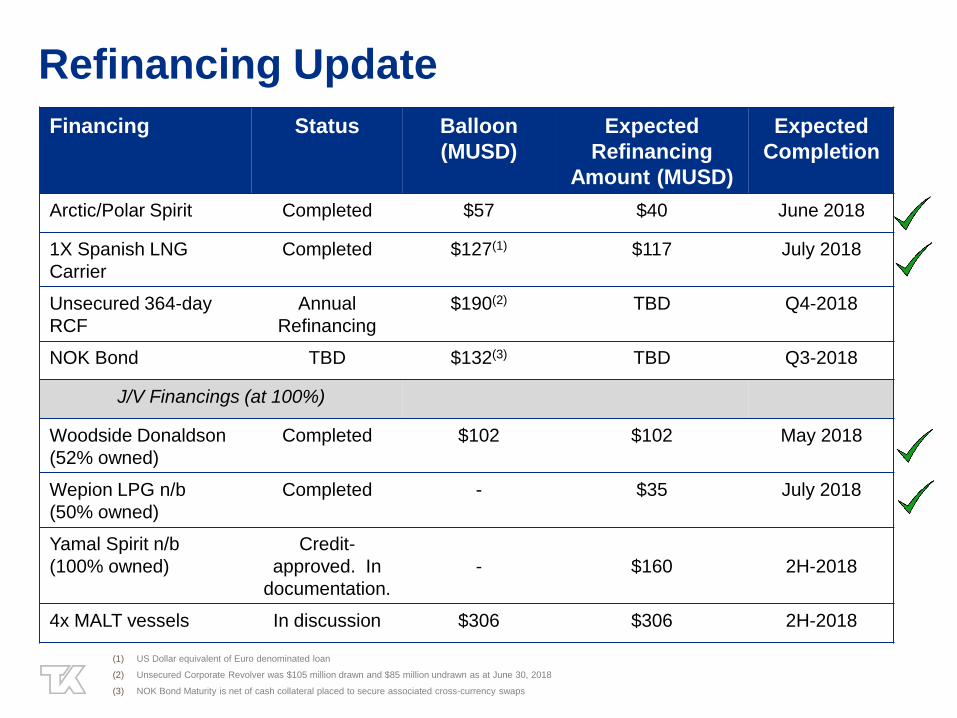
Refinancing Update
Financing Status Balloon
(MUSD)
Expected
Refinancing
Amount (MUSD)
Expected
Completion
Arctic/Polar Spirit Completed $57 $40 June 2018
1X Spanish LNG
Carrier
Completed $127(1) $117 July 2018
Unsecured 364-day
RCF
Annual
Refinancing
$190(2) TBD Q4-2018
NOK Bond TBD $132(3) TBD Q3-2018
J/V Financings (at 100%)
Woodside Donaldson
(52% owned)
Completed $102 $102 May 2018
Wepion LPG n/b
(50% owned)
Completed - $35 July 2018
Yamal Spirit n/b
(100% owned)
Credit-
approved. In
documentation.
- $160 2H-2018
4x MALT vessels In discussion $306 $306 2H-2018
(1) US Dollar equivalent of Euro denominated loan
(2) Unsecured Corporate Revolver was $105 million drawn and $85 million undrawn as at June 30, 2018
(3) NOK Bond Maturity is net of cash collateral placed to secure associated cross-currency swaps

Distributable Cash FlowQ2-18 vs. Q1-18
2) For a reconciliation of Distributable Cash Flow, a non-GAAP measure, to the most directly comparable GAAP figures, see Appendix B in the Q2-18 and Q1-18 Earnings Releases.
1) Refer to next slide for a reconciliation of Net Voyage Revenues, Adjusted Vessel Operating Expense, Adjusted Interest Expense, and Adjusted Income Tax Expense.
(Thousands of U.S. Dollars except units outstanding
or unless otherwise indicated)
Q2-2018
(unaudited)
Q1-2018
(unaudited) Comments
Net voyage revenues(1) 114,514 109,814
Increase primarily due to the delivery of the Myrina in May 2018 and delivery of the Magdala in
February 2018. These increases were partially offset by the sale of the Teide Spirit in February 2018.
Adjusted vessel operating expenses(1) (33,187) (28,467)Increase due to additional repairs and spares purchased on Multi-gas carriers in Q2-18.
Estimated maintenance capital expenditures (16,345) (14,907)
General and administrative expenses (7,096) (6,571)
Partnership's share of equity-accounted joint ventures'
DCF net of estimated maintenance capital expenditures 14,939 18,726
Lower equity income as the Teekay LNG-Marubeni Joint Venture earned lower rates from two of its
LNG carriers trading in the spot market in Q2-18.
Adjusted interest expense(1) (35,129) (31,408)Increase due to vessel deliveries during Q1-18 and Q2-18.
Interest income 902 914
Adjusted Income tax expense(1) (569) (505)
Distributions relating to preferred units (6,425) (6,425)
Distributions relating to equity financing of newbuildings 2,289 2,421
Direct finance lease payments received in excess of revenue
recognized and other adjustments 2,897 2,887
Portion of additional tax indemnification guarantee liability
previously recognized in DCF - (3,849)Adjusted in Q1-18 upon recording additional tax indemnification guarantee liability.
Other adjustments - net (686) (2,086)Decrease due to restructuring charge recorded in Q1-18.
Distributable Cash Flow before Non-Controlling
Interests 36,104 40,544
Non-controlling interests' share of DCF (4,988) (5,203)
Distributable Cash Flow(2) 31,116 35,341
Cash distributions to the General Partner (228) (228)
Limited partners' Distributable Cash Flow 30,888 35,113
Weighted-average number of common units outstanding 79,687,499 79,637,607
Distributable Cash Flow per limited partner unit 0.39 0.44

Reconciliations of Non-GAAP Financial Measures
Reconciliation of the Partnership’s Adjusted Interest Expense:
Reconciliation of the Partnership’s Net Voyage Revenues:
(Thousands of U.S. Dollars)
Three Months Ended
June 30, 2018
(unaudited)
Three Months Ended
March 31, 2018
(unaudited)
Voyage revenues as reported 122,315 115,306
Voyage expenses as reported (7,951) (5,801)
Realized gains on charter contract derivative instrument 150 309
Net Voyage Revenues 114,514 109,814
(Thousands of U.S. Dollars)
Three Months Ended
June 30, 2018
(unaudited)
Three Months Ended
March 31, 2018
(unaudited)
Interest expense as reported (28,171) (24,706)
Realized losses on derivative instruments and other (6,958) (6,702)
Adjusted Interest Expense (35,129) (31,408)
Reconciliation of the Partnership’s Adjusted Income Tax Expense:
(Thousands of U.S. Dollars)
Three Months Ended
June 30, 2018
(unaudited)
Three Months Ended
March 31, 2018
(unaudited)
Income tax (expense) recovery as reported (843) (779)
Deferred income tax expense (recovery) 274 274
Adjusted Income Tax Expense (569) (505)
(Thousands of U.S. Dollars)
Three Months Ended
June 30, 2018
(unaudited)
Three Months Ended
March 31, 2018
(unaudited)
Vessel operating expenses as reported (33,969) (28,467)
Pre-delivery crew-training expenses relating to newbuildings 782 -
Adjusted Vessel Operating Expenses (33,187) (28,467)
Reconciliation of the Partnership’s Adjusted Vessel Operating Expenses:
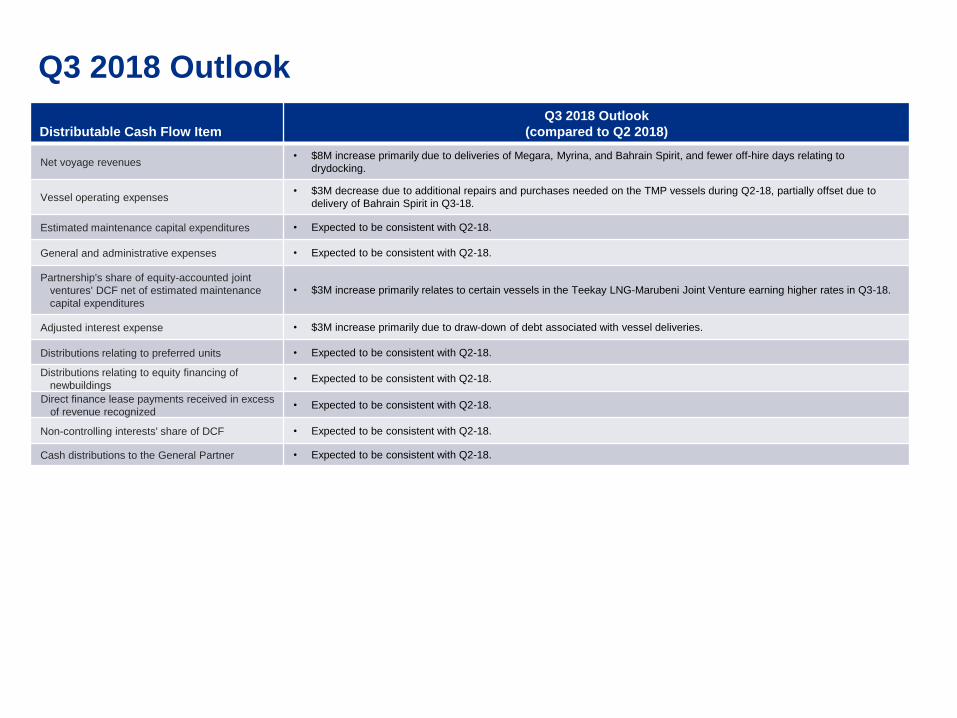
Q3 2018 Outlook
Distributable Cash Flow Item
Q3 2018 Outlook
(compared to Q2 2018)
Net voyage revenues• $8M increase primarily due to deliveries of Megara, Myrina, and Bahrain Spirit, and fewer off-hire days relating to
drydocking.
Vessel operating expenses• $3M decrease due to additional repairs and purchases needed on the TMP vessels during Q2-18, partially offset due to
delivery of Bahrain Spirit in Q3-18.
Estimated maintenance capital expenditures • Expected to be consistent with Q2-18.
General and administrative expenses • Expected to be consistent with Q2-18.
Partnership's share of equity-accounted joint
ventures' DCF net of estimated maintenance
capital expenditures
• $3M increase primarily relates to certain vessels in the Teekay LNG-Marubeni Joint Venture earning higher rates in Q3-18.
Adjusted interest expense • $3M increase primarily due to draw-down of debt associated with vessel deliveries.
Distributions relating to preferred units • Expected to be consistent with Q2-18.
Distributions relating to equity financing of
newbuildings• Expected to be consistent with Q2-18.
Direct finance lease payments received in excess
of revenue recognized• Expected to be consistent with Q2-18.
Non-controlling interests' share of DCF • Expected to be consistent with Q2-18.
Cash distributions to the General Partner • Expected to be consistent with Q2-18.

2018(E) Drydock Schedule
15
SegmentVessels
Total Off-hire
DaysVessels
Total Off-hire
Days Vessels
Total Off-
hire Days Vessels
Total Off-
hire Days Vessels Total Off-hire Days
Liquefied Gas - Consolidated 1 48 2 52 - 3 - - 3 103
Conventional Tankers - - 1 22 - - - - 1 22
LPG Equity - - - - - - 1 24 1 24
LNG Equity - - 1 21 1 24 - - 2 45
1 48 4 95 1 27 1 24 7 194
March 31, 2018 (A) June 30, 2018 (A) September 30, 2018 (E) December 31, 2018 (E) Total 2018 (E)


