Linköping Studies in Science and Technology
Dissertations, No. 1284
TESTING OF DOPPLER ULTRASOUND SYSTEMS
Andrew Walker
Linköping 2009
Department of Biomedical Engineering, Linköping University, Linköping, Sweden and Departments of Biomedical Engineering and Clinical Physiology and Centre for
Clinical Research, Central Hospital, Västerås, Sweden
Linköping Studies in Science and Technology
Dissertations, No. 1284
TESTING OF DOPPLER ULTRASOUND SYSTEMS
Andrew Walker
Cover illustration by Najah Samaan
Copyright © Andrew Walker 2009
Printed by LIU-Tryck, Linköping Sweden 2009
ISBN: 978-91-7393-498-5
ISSN: 0345-7524
II
ABSTRACT
Blood and tissue velocities are measured and analyzed in cardiac, vascular, and other
applications of diagnostic ultrasound. Errors in system performance might give invalid
measurements.
We developed two moving string test targets and a rotating cylinder phantom (Doppler
phantoms) to characterize Doppler ultrasound systems. These phantoms were initially
used to measure such variables as sample volume dimensions, location of the sample
volume, and the performance of the spectral analysis. Later, specific tests were
designed and performed to detect errors in signal processing, causing time delays and
inaccurate velocity estimation in all Doppler modes.
In cardiac motion pattern even time delays as short as 30 ms may have clinical
relevance. These delays can be obtained with echocardiography by using flow and
tissue Doppler and M-mode techniques together with external signals (e.g.,
electrocardiography (ECG) and phonocardiography). If one or more of these signals
are asynchronous in relation to the other signals, an incorrect definition of cardiac time
intervals may occur. To determine if such time delays in signal processing are a
serious problem, we tested four commercial ultrasound systems. We used the Doppler
string phantom and the rotating cylinder phantom to obtain test signals. We found time
delays of up to 90 ms in one system, whereas delays were mostly short in the other
systems. Further, the time delays varied relative to system settings. In two-dimensional
(2D) Doppler the delays were closely related to frame rate.
To determine the accuracy in velocity calibration, we tested the same four ultrasound
systems using the Doppler phantoms to obtain test signals for flow (PW) and tissue (T-
PW) pulse Doppler and for continuous wave (CW) Doppler. The ultrasound systems
were tested with settings and transducers commonly used in cardiac applications. In
two systems, the observed errors were mostly close to zero, whereas one system
systematically overestimated velocity by an average of 4.6%. The detected errors are
mostly negliable in clinical practice but might be significant in certain cases and
research applications.
III

IV

LIST OF PAPERS
This thesis is based on the following papers, which are referred to in the text by their
Roman numerals:
I. Walker AR, Phillips DJ, Powers JE. Evaluating Doppler devices using a
moving string test target. J Clin Ultrasound 1982;10:25-30.
II. Walker A, Olsson E, Wranne B, Ringqvist I, Ask P. Time delays in ultrasound
systems can result in fallacious measurements. Ultrasound Med Biol
2002;28:259-263.
III. Walker A, Olsson E, Wranne B, Ringqvist I, Ask P. Accuracy of spectral
Doppler flow and tissue velocity measurements in ultrasound systems.
Ultrasound Med Biol 2004;30:127-132.
IV. Walker A, Henriksen E, Rinqvist I, Ask P. A rotating cylinder phantom for
flow and tissue color Doppler testing. Ultrasound Med Biol 2009;35:1892-
1898, in press.
The papers are reproduced with the permission of the publishers.
Related international conference publications:
Faludi R, Walker A, Pedrizzetti G, Engvall J, Voigt J-U. Can Feature Tracking Correctly Detect Motion Patterns as They Occur in Blood Inside Heart Chambers? Validation of Echocardiographic Particle Image Velocimetry Using Moving Phantoms. German Cardiac Society meeting, Mannheim, Germany, April 16-18, 2009. Walker A, Henriksen E, Rinqvist I, Ask P. A rotating cylinder phantom for flow and tissue color Doppler testing. World Congress on Medical Physics and Biomedical Engineering, Munich, Germany, September 7 – 12, 2009.
V

ABBREVIATIONS
2D Two-dimensional
3D Three-dimensional
AUX Auxiliary
A-mode Amplitude mode
B-mode Brightness mode
CD Color Doppler
CW Continuos wave (Doppler)
DC Direct current
DFT Discrete Fourier transform
DTI Doppler tissue imaging
ECG Electrocardiogram
FFT Fast Fourier transform
MHz Mega Hertz
M-mode Motion mode
PIV Particle image velocimetry
PW Pulse wave (Doppler)
QRS A high amplitude rapidly changing part of the ECG
TIH Time interval histogram
T-PW Tissue pulse wave (Doppler)
VI

CONTENTS
Abstract ......................................................................................................................... III
List of papers.................................................................................................................. V
Abbreviations................................................................................................................VI
Contents .......................................................................................................................VII
Introduction..................................................................................................................... 9
Ultrasound physics and techniques ............................................................................. 9
Clinical use of ultrasound and Doppler..................................................................... 12
Performance testing of ultrasound systems............................................................... 13
Aims.............................................................................................................................. 15
Summary of papers ....................................................................................................... 17
Moving string test target (Paper I) ............................................................................ 17
Time delays (Paper II)............................................................................................... 20
Spectral Doppler velocity (Paper III) ........................................................................ 22
Rotating cylinder phantom (Paper IV)...................................................................... 25
Discussion and Conclusions ......................................................................................... 33
Test phantoms ........................................................................................................... 33
Time delays ............................................................................................................... 36
Accuracy of velocity ................................................................................................. 38
Conclusions ............................................................................................................... 41
Future work ............................................................................................................... 42
Populärvetenskaplig sammanfattning ........................................................................... 45
Acknowledgments......................................................................................................... 47
References..................................................................................................................... 49
Appended papers........................................................................................................... 57
VII

8

INTRODUCTION
Ultrasound physics and techniques
In medical diagnostic ultrasound, frequencies in the range 2-10 MHz are commonly
used. Pulsed, or sometimes continuous, ultrasound is emitted into the body using a
piezoelectric transducer (Angelsen 2000; Holmer 1992). The ultrasound is reflected
and scattered in tissue and blood, where the transducer in receiving mode detects part
of the backscattered signal (echo). Displaying these echoes with the amplitude
modulating the intensity of the display and the depth in tissue on the horizontal axis,
we obtain a B-mode line of the echoes that return from the tissue. By repeatedly
emitting and receiving ultrasound pulses, static two-dimensional (2D) images could be
acquired by manually sweeping the transducer over the target area and keeping track
of the position and orientation of the transducer. Two-dimensional real-time images
can be created by rapidly changing the direction of the emitted ultrasound beam. This
can be done either by a mechanical sector scanner or by electronic steering of a multi-
element transducer.
When ultrasound is reflected against a moving target of tissue or blood, the ultrasound
frequency will change: this is known as the Doppler effect (Angelsen 2000; Holmer
1992; Jensen 1996; Nelson and Pretorius 1988). This shift in frequency, the Doppler
frequency fd, is proportional to the velocity of the moving target:
fd = (2 f0 v cosα ) / c (1)
where f0 is the transmitted frequency, v is the velocity of the moving target, α is the
angle between the movement vector and the transmitted ultrasound beam, and c is the
speed of sound in tissue. The Doppler frequency is mostly in the audible range (about
100 Hz to 10 kHz) and can be presented from a loudspeaker.
In reality, the received Doppler signal will contain a range of simultaneous velocity
components leading to a complex spectral content. Under ideal uniform sampling
9

conditions, the Doppler power spectrum should have the same shape as a velocity
distribution plot for the current flow or tissue motion. A number of factors distort the
power spectra and may limit the accuracy of the measured velocity distribution. This
distortion is due to the blood flow or tissue motion condition, the region of sensitivity
and imperfections in the transducer and electronics and limitations in the spectral
analysis. Blood flow, which can be turbulent, is different in different parts of a vessel
or heart chamber. Furthermore, the concentration of scatterers (blood and tissue cells)
is heterogeneous. The presence of highly reflective stationary or slowly moving targets
will also affect the spectral content (“clutter”). The region of sensitivity is defined by
the diameter of the ultrasound beam and, in the case of pulsed Doppler, the axial
dimension of the sample volume. The spectral content of the Doppler signal will
depend on where this region of sensitivity is placed in relation to blood flow or tissue
motion. The scattering properties will also vary with the Doppler angle (α). Further,
the Doppler spectrum is widened because of intrinsic spectral broadening. In short, this
is due to the range of angles that are available as the target passes through the
ultrasound beam. In pulsed Doppler the wide signal bandwidth and the effect of
sampling may alter the shape of the power spectrum.
The zero-crossing detector and the more developed time interval histogram (TIH) were
widely used to display the spectral content of the Doppler signal. The TIH nicely
displays the center frequency and width of the spectrum but gives no detailed
information about the shape of the spectrum. These techniques are not sufficient when
several velocity components are present simultaneously. A better estimate of the
Doppler spectrum is obtained from Fourier analysis. This analysis requires a
transformation of the Doppler signal from the time to the frequency domain. The
discrete Fourier transform (DFT) can be used to calculate this transformation. The
DFT is efficiently implemented with several methods, including the Chirp-Z transform
and the fast Fourier transform (FFT). Some limitations of these Fourier transform
analyzers are:
1. The data segment length limits the spectral resolution.
10

2. The maximum frequency component that can be detected is half the sampling
frequency of the analyzer.
3. The Fourier transform of a random signal is merely an estimate of the true
spectrum and has a large variance.
More detailed descriptions of the Doppler signal, the estimation of blood velocity and
the different methods of spectral analysis are given by Angelsen (2000), Hatle and
Angelsen (1993), and Jensen (1996). The velocity is usually presented graphically as a
spectrum with velocity on the vertical axis and time on the horizontal axis; the
grayscale (intensity) indicates the relative prevalence of the shifted signals. Motion
toward the transducer is presented above the zero line, whereas motion away from the
transducer is displayed below the zero line. Blood flow Doppler signals are
characterized by high velocities and low amplitude. In contrast, Doppler signals from
the myocardial wall exhibit low velocities (4–8 cm/s in healthy subjects) and high
amplitude. With proper gain and filter settings, the flow signal can be suppressed and
the tissues signal enhanced or vice versa.
In continuous wave Doppler (CW) ultrasound is emitted continuously from one
transducer element (or a group of transducer elements); the reflected signal is then
detected by another transducer element (or group of elements). This technique is easy
to implement, working particularly well for high velocities, but lacks the ability to
indicate the depth from which the velocity arises. Pulse wave Doppler (PW) was
developed to solve this problem (Baker 1970). Repeated pulses of ultrasound are
emitted but the system only acts as a receiver for a limited period of time or
“window”. The time from emission to the beginning of this period corresponds to the
depth in tissue, whereas the length of the period corresponds to the length of the area
(sample volume) where motion is interrogated. The width of the sample volume is
determined by the ultrasound beam profile.
Two-dimensional imaging can be combined with the PW and CW Doppler ("Duplex
scanning") so that velocity can be measured at any point in the image.
11

Color Doppler (CD) (Evans 1993) is a further development of the pulsed Doppler
technique, where colored 2D images of blood flow are overlaid on the tissue images.
Each line in the color 2D image consists of a large number of sample volumes (range
cells). The mean, or average, of all velocity components found in each sample volume
is calculated in the time domain using an autocorrelation technique. Velocity is usually
presented using a color scale, in which red represents motion toward the transducer
and blue represents motion away from the transducer. The brightness of the color
represents the magnitude of the velocity.
Using similar techniques as for flow color Doppler, tissue motion can be displayed in
2D using color Doppler tissue imaging (DTI) (Mundigler and Zehetgruber 2002).
Clinical use of ultrasound and Doppler
The diagnostic use of ultrasound developed in the early 1950s, where the first heart
examinations were performed in 1953 (Edler and Hertz 1954). In early ultrasound A-
mode, M-mode, and static B-mode scanners were used. Commercial real-time imagers
became available about 1975. The clinical use of Doppler ultrasound began in the mid
1950s (Satumura 1957). Nowadays, PW and CW Doppler ultrasound is routinely used
in the non-invasive assessment of blood flow velocity in cardiac (Hatle and Angelsen
1993) and vascular applications (Atkinson and Woodcock 1982). Typical flow
velocities in the cardiovascular system are 10 to 200 cm/s, with velocities up to 600
cm/s at constrictions.
Tissue pulse wave Doppler (T-PW) is increasingly used to record regional myocardial
tissue velocity (Isaaz et al. 1989; Sutherland and Hatle 2000). Tissue velocity is lower
than blood flow velocity. For example, cardiac tissue velocities are commonly in the
range of 2.5 to 30 cm/s.
12
The main use of Doppler is to measure velocity, but the velocity signals and
measurements are often used to derive other quantities. One example is the estimation
of the pressure drop across a flow obstruction:
Δp ≈ 4 v2 (2)
where the peak velocity v in m/s gives the pressure drop Δp in mmHg. This
approximation is derived from Bernoulli’s equation and is valid only for these units of
velocity and pressure and for restrictions on geometry and viscous friction.
In clinical practice of cardiac ultrasound, it is also common to define and measure time
intervals during the cardiac cycle. It is possible to compare local and global cardiac
events using a combination of signals such as flow and tissue Doppler, M-mode,
electrocardiogram (ECG) and phonocardiography (Fukuda et al. 1998; Garcia-
Fernandez et al. 1999; Mishiro et al. 1999).
The CD technique is commonly used to get an overview of flow, but also for
quantification of flow areas and for timing of flow events in the heart.
Doppler tissue imaging (DTI) can provide velocity maps of normal and pathologic
myocardial structures during the cardiac cycle. Assessment of myocardial wall
velocities regarding timing and amplitude is used for quantification of global and
regional systolic and diastolic function (Mundigler and Zehetgruber 2002). A
relatively novel application is identifying patients who will benefit from cardiac
resynchronization therapy.
Performance testing of ultrasound systems
Objective testing of the performance of ultrasound systems is essential to validate
measurements used in clinical practice and clinical research. Tests of an individual
system as well as tests to compare systems are needed.
13

Traditionally, methods for testing imaging performance have been developed and
applied over the years (AIUM 1990; Brendel et al. 1977; Carson 1979; IEC 1986;
Robinson and Kossoff 1972; Thijssen 2007). This work was supported by various
organizations, including the American Institute for Ultrasound in Medicine (AIUM),
the American Association of Physicists in Medicine (AAPM), the National Electrical
Manufacturers Association (NEMA), the British Standards Institution (BSI), and the
International Electrotechnical Commission (IEC). The IEC and AIUM initiated the
development of standards for measuring Doppler performance (AIUM 1993; IEC
1993; Reid et al. 1979). These publications mention numerous test devices (e.g., string
and flow phantoms). Hoskins et al. (1994a) give a more extensive description of
measurable quantities in Doppler systems and of test methods. Reference is also given
to international standards. Thijssen et al. (2002) describe methods for measuring both
imaging quality and Doppler performance. These investigators used a string phantom
to assess Doppler sensitivity, sample volume depth and dimensions, velocity
measurement, and channel separation. An overview of methods for the simulation and
validation of arterial ultrasound blood flow assessment is given by Hoskins (2008).
However, few test methods have been designed and hardly any studies have addressed
the potential problems with timing and time delays in Doppler ultrasound imaging.
Studies of Doppler performance, especially peak velocity estimation accuracy, have
been conducted in the past. Some tests of performance will be described in this thesis.
However, several other characteristics of Doppler ultrasound systems remain to be
evaluated. The rapid development of systems, including techniques such as tissue
Doppler, strain rate imaging, and in the future, 3D data acquisition may require
performance that was not previously needed and puts new demands on performance
testing.
14

AIMS
Meaningful interpretation of Doppler ultrasound measurements requires knowledge of
system characteristics as well as the underlying physics and physiology. The overall
aim in this study was to develop reliable test methods to characterize Doppler systems
and to apply these test methods to a number of commercial cardiovascular ultrasound
systems.
To meet this overall aim the research addresses the following specific objectives:
- to develop methods that included moving string test targets to characterize Doppler
ultrasound systems.
- to investigate time delays in the display of flow and tissue pulse and continuous wave
Doppler, M-mode, phonocardiography, and auxiliary signals in relation to the
electrocardiogram, and to study to what extent the delays change with system settings
in commercially available ultrasound systems.
- to investigate the accuracy of the spectral Doppler velocity estimation in pulse and
continuous wave Doppler for both flow and tissue settings in commercially available
ultrasound systems.
- to develop a test phantom for two-dimensional Doppler blood flow and Doppler
tissue imaging and to evaluate the ability of the phantom to measure velocity and
timing performance in commercially available ultrasound systems.
15

16
SUMMARY OF PAPERS
Moving string test target (Paper I)
Method
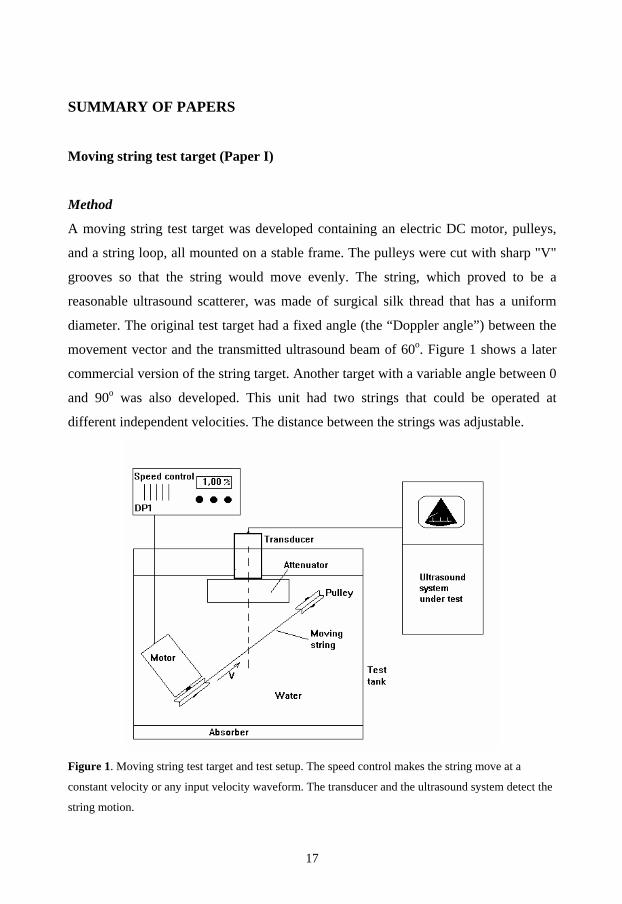
A moving string test target was developed containing an electric DC motor, pulleys,
and a string loop, all mounted on a stable frame. The pulleys were cut with sharp "V"
grooves so that the string would move evenly. The string, which proved to be a
reasonable ultrasound scatterer, was made of surgical silk thread that has a uniform
diameter. The original test target had a fixed angle (the “Doppler angle”) between the
movement vector and the transmitted ultrasound beam of 60o. Figure 1 shows a later
commercial version of the string target. Another target with a variable angle between 0
and 90o was also developed. This unit had two strings that could be operated at
different independent velocities. The distance between the strings was adjustable.
Figure 1. Moving string test target and test setup. The speed control makes the string move at a
constant velocity or any input velocity waveform. The transducer and the ultrasound system detect the
string motion.
17
The string target was placed in a water tank lined with absorbing rubber to minimize
undesirable acoustic reflections from the walls. To provide precision movement along
three orthogonal axes the transducer under test was placed in a holder with linear
translators. A linear potentiometer provided a voltage proportional to the position of
the transducer. As water is a weak attenuator, gain settings of the ultrasound
instrument were set to avoid saturation of the amplifiers. A piece of attenuating
material could also be placed between the transducer and the string.
Sample volume size was measured by moving the transducer while at the same time
detecting the Doppler signal amplitude. The Doppler amplitude signal was input to the
vertical axis and the voltage proportional to the position of the transducer to the
horizontal axis on an oscilloscope.
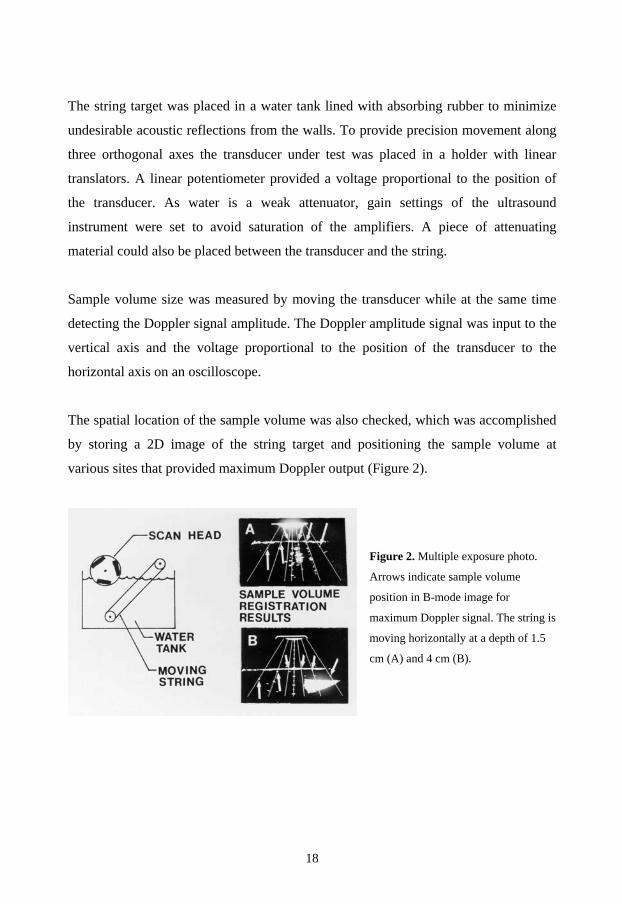
The spatial location of the sample volume was also checked, which was accomplished
by storing a 2D image of the string target and positioning the sample volume at
various sites that provided maximum Doppler output (Figure 2).
Figure 2. Multiple exposure photo.
Arrows indicate sample volume
position in B-mode image for
maximum Doppler signal. The string is
moving horizontally at a depth of 1.5
cm (A) and 4 cm (B).
18
This procedure was repeated with the string at different depths. If the location is
correct, the bright dot defining the sample volume should fall exactly on the line
defining the string.
The frequency content of the Doppler signal relates to the pattern of blood flow
velocity. To analyze the frequency content we used a separate FFT spectrum analyzer.
By changing the string velocity, we could observe the corresponding change in
frequency spectrum. Using the dual string target, the effect of simultaneous velocity
components with differing magnitudes and directions could be studied.
Results
A clinical pulsed Doppler instrument (Mark V Duplex scanner, ATL, Bellevue, WA,
USA) and a prototype annular array system were evaluated. The sample volume
dimensions were measured at a series of depths. As an example, we found the width to
be 3.7 mm and the length 2 mm at 3 cm depth using the ATL scanner.
Figure 2 shows the sample volume location measurements made with the ATL
scanner. As can be seen, the sample volume in some locations did not coincide either
in angle or in range with the string as defined by the 2D image.
Frequency spectra were obtained under various conditions applying the FFT spectrum
analyzer. Using the annular array system and constant string speed, we showed that
Doppler center frequency changed linearly with the cosine of the Doppler angle as
expected. The ATL system was also tested for its response to two velocity components
within the sample volume. The ATL system presented Doppler frequency as a TIH
(Lorch et al. 1977). Whereas the FFT analyzer could clearly distinguish the two
velocity components, the TIH output fluctuated between the two frequencies and
displayed all frequencies in between (Figure 3C and 3D).
19

Figure 3. Separation of flow components using
the FFT analyzer (left) and the TIH (right).
A: One string moving away from the transducer.
B: One string moving toward the transducer.
C: Two strings moving toward the transducer at
different speeds.
D: Two strings moving in opposite directions and
at different speeds.
Time delays (Paper II)
Method
Three common ultrasound systems were tested referred to as systems A, B, and C in
the text. A similar test setup as shown in Figure 1 was used. In addition, an ECG signal
from a digital ECG simulator was input to the ECG, phonocardiography, and AUX
inputs of the tested ultrasound system and simultaneously to an external input on the
speed control of the moving string phantom. In this way the string moved and
generated Doppler signals in synchrony with the ECG, phonocardiogram, and
auxiliary signals. A display of these signals is shown in Figure 4.
20

Figure 4. The sector part
of the image shows the
string and the sample
volume placed on it. The
lower part displays the
pulse Doppler (PW)
together with ECG,
auxiliary input (DCA),
and phonocardiogram
(PHONO).
All three systems were tested with similar settings for PW, CW, and T-PW Doppler,
and for M-mode. The sharp onset of the QRS complex in the ECG signal was used as
the time reference. Delay was defined as the time difference between this point and the
corresponding onset in the other signals. From a pilot study, we suspected that some
system settings could affect delays. Therefore, these system settings were varied in our
tests: velocity scale, velocity scale baseline, sweep speed, and "edge" in system B. All
measurements were done in three ways:
1. Directly on the screen after the image had been frozen.
2. From the frozen image as recorded on videotape. This measurement was carried out
to verify that the video recording procedure itself did not introduce delays.
3. From the live image after it had been recorded on videotape. The tape was then
stopped using the pause function of the videotape recorder. This measurement was
performed to determine whether there was a difference in delay between frozen and
live displays.
The variation in time delay measurements was less than ± 4 ms (± 1 SD) for all tested
systems and display modes including video recordings. The variation comprises
several factors, including resolution of time calipers (about 1.5-4 ms, varying with
sweep speed and system), uncertainty in placing the calipers on the recording and
variations in the ultrasound and test systems.
21

Results
In general, the delays in systems B and C were regarded as small, showing only slight
variation with system settings. In system B the AUX signal appeared 14 ms ahead of
the ECG; in system C the phonocardiography signal was displayed 13 ms ahead of the
ECG. In system B a change in "edge" setting from +1 to 0 increased the delay in
Doppler signals with 11-15 ms. In system A we found larger time delays in all Doppler
modes, with delays varying as a function of velocity scale settings. Delays up to 90 ms
were found. An example from tissue pulse Doppler is presented in Figure 5.
Tissue pulsed Doppler
-20
0
20
40
60
80
100
0.0 0.5 1.0 1.5 2.0
Velocity scale settings ±[m/s]
Dela
y [m
s]
frozenvideo livevideo frozen
Figure 5. Time delays in tissue pulse Doppler
as a function of velocity scale in system A (±
in the velocity scale denotes that the baseline
was put centrally in the image and that both
positive and negative velocities were
displayed).
In system A there was a difference in delay between frozen and live displays. The
delays for all Doppler modes were about 20 ms longer in live than in frozen displays.
For M-mode, the corresponding difference was approximately 15 ms.
Spectral Doppler velocity (Paper III)
Method
The same three ultrasound systems were evaluated as in paper II (also referred to here
as systems A, B, and C). The test setup is the same as shown in Figure 1. In this study
the accuracy of the string velocity was critical. The string phantom has a tachometer
22

signal output from the motor that provides readout of string velocity on the speed
control unit. This readout was carefully calibrated using a digital tachometer to
measure rotational speed and a slide ruler to measure the diameter of the string drive
pulley (string speed = rotational speed x circumference).
Doppler frequency is dependent on the speed of sound in the medium where it is
generated. Because our measurements were done in water (~1480 m/s) and the
ultrasound systems are calibrated for soft tissue (~1540 m/s), we corrected for this by
multiplying the velocity values with a correction factor (Goldstein 1991b). We used an
angle of 45o between the ultrasound beam and the string motion. A special setup
procedure ensured a correct angle, i.e. ± 1o (Goldstein 1991a). The total accuracy of
the test system was estimated to be better than ± 1.8% at velocities at and above 20
cm/s and better than ± 4.9% at lower velocities.
The ultrasound systems were set at similar clinical settings. The string speed was
varied in the range 25 to 400 cm/s for PW and CW Doppler and in the range, 2.5 to 50
cm/s for T-PW Doppler. The velocity scales of the ultrasound systems were adjusted
to comply with the present string velocity. A typical spectral Doppler signal is
displayed in Figure 6.
Figure 6. The sector part of
the image shows the string and
the sample volume placed on
it. The lower part displays the
Doppler spectrum, with string
velocity measured in two
points in the center.
23

The spectral image was frozen and measurements were done directly on the screen
using the ultrasound system calipers. The true string velocity corresponds to the mean
Doppler velocity, which was measured at the estimated center of the spectrum (Lange
and Loupas 1996). Measurements were repeated three times (measures presented as
mean values).
Results
The measured errors for the different systems and tested modes are given in Figure 7.
In general, the mean errors were below 5% for all systems and tested modes, but errors
of up to 8.3 % were detected at certain velocities. In systems B and C the errors were
mostly near zero. System A systematically overestimated velocity by an average of
4.6%.
Mean error and confidence limits (95%)
-2.0
-1.0
0.0
1.0
2.0
3.0
4.0
5.0
6.0
7.0
P C T P C T P C T
System(A,B,C) and mode
Erro
r [%
]
Mode:P = pulsedC = continuousT = tissue
System A System B System C
Figure 7. Mean value and confidence limits (95% confidence interval) for the percentage difference
between measured [mean of three measurements] and true velocity in ultrasound systems A, B, and C.
24

Rotating cylinder phantom (Paper IV)
Method
-The Doppler phantom
This Doppler phantom was based on the principle that a known velocity signal was
generated from ultrasound reflections from the surface of a rotating cylinder (Figure 8)
placed in a water tank. A hollow Plexiglas cylinder 25.0 mm in diameter gave a
suitable backscattered signal. The surface of the Plexiglas cylinder was sandpapered to
improve the acoustic backscattering. An ultrasound transducer was positioned
perpendicular to the Plexiglas cylinder with the 2D scan plane parallel to the cylinder
long axis to record the velocity of the rotating cylinder. The scan plane covered the
area of peripheral velocity of the cylinder.
Figure 8. The principle of the rotating cylinder Doppler phantom that generates a known velocity field
with pre-set speed and direction. The cylinder is driven by an electric motor and the rotation speed is
controlled by separate electronics. The cylinder and motor are placed in a water tank (length 450 mm,
width 220 mm, and height 290 mm). The transducer and the ultrasound system detect the peripheral
motion of the cylinder. The peripheral velocity of the cylinder surface is v. The rotating cylinder is
shown in the sector plane to the left and the plane perpendicular to the scanning plane to the right
(enlarged cross section).
25

The special feature of this phantom design is that it generates a known 2D velocity
field for test purposes. The test tank was filled with degassed tap water and an
absorber was placed at the bottom to minimize reflections and reverberations. The
rotation of the cylinder was obtained from an electric motor, where a digital
tachometer was attached to the motor to obtain calibrated rotational speed and speed of
the cylinder surface. Phantom speed was calibrated and corrected for the acoustic
velocity of degassed tap water at room temperature as described previously. This
method of calibration gives a total relative uncertainty in velocity of less than ± 2% for
the velocity range 20 to 400 cm/s and less than ± 5% for the range 2.5 to 10 cm/s
(Paper III). The vertical distance between the transducer surface and the center of the
cylinder was 120 mm during all measurements. We used an ultrasound sector angle of
about 80º, which resulted in angles between the ultrasound beam and the cylinder of 0
to 35º.
The rotating cylinder phantom was evaluated in CD and DTI, as well as PW, T-PW,
and CW spectral Doppler for testing both velocity and timing characteristics in a
commercially available ultrasound system. 2D and Doppler gains were adjusted to
give an optimal image and the Doppler velocity scale was adjusted to be optimal in
order to attain the desired velocity. In spectral Doppler the horizontal sweep was set to
200 mm/s.
-Measurement of velocity performance
PW Doppler was tested at peripheral cylinder velocities of 50, 100, and 200 cm/s at
both directions of rotation. T-PW Doppler and DTI were tested at velocities of 2.5,
5.0, 10.0, and 25.0 cm/s and CW Doppler at velocities of 50, 100, 200, and 400 cm/s.
All velocities were measured at three sites along the cylinder: 35º to the left, at the
center, and 35º to the right. Using the ultrasound system calipers, the Doppler velocity
was measured at the spectral maximum corresponding to the peripheral velocity of the
cylinder. All measurements were performed three times: data were angle-corrected for
26

the angle between the ultrasound beam and velocity from the cylinder and presented as
average measures.
-Measurement of timing performance
The Doppler phantom was set to produce a repetitive rapid acceleration moving from
zero to a preset velocity followed by a deceleration with a “heart rate” close to 60
beats/second (the blue signal in Figure 10-12). The tachometer signal was applied to
the ECG input and to an AUX input of the ultrasound system. These signals were used
as time reference (Paper II) and displayed with the Doppler signals on the ultrasound
system screen. The AUX input was used because it renders the true cylinder motion
almost unaffected, whereas the highly filtered ECG input distorts the tachometer
signal.
Using the ultrasound system calipers, the time delays were measured from the onset of
the Doppler signal to the onset of the ECG and AUX signals, respectively. The delays
are defined as positive when the Doppler signal appeared before the AUX or ECG
signals (note: this definition is the opposite of that in Paper II!). Delays were measured
in PW and T-PW Doppler modes with varying velocity scale settings.
The DTI mode images were acquired at different frame rates and different velocity
scales. The images were stored for subsequent measurements offline on a standard
computer with special analysis software (EchoPac PC ver. 6.1.3, GE Vingmed
Ultrasound, Horten, Norway). Measurements were performed at different points along
the cylinder with the oval sampling area set to 6 mm (vertical) by 12 mm (horizontal).
Temporal filtering was varied and angle correction was not performed.
To study CD the peripheral velocity of the cylinder was set to accelerate from 0 to 100
cm/s in about 36 ms. This acceleration rate, which is within the expected clinical
range, was confirmed using the tachometer signal and an oscilloscope. The acquisition
of the ultrasound system was set to triggered mode so the start of the triggered frame
27

could be set to any arbitrary instant during the heart cycle. Acquisition was done at
five frame rates (8.7, 11.1, 16.2, 22.6, and 24.2 fps).
Results
-Velocity performance
The results are summarized in Table 1. For PW Doppler, the difference between the
true- and Doppler-calculated peripheral cylinder velocity was from 0.0 – 5.2% in the
range of velocities tested. For CW Doppler, the difference was in the range 4.9 – 6.2%,
for T-PW 1.1 – 16.1% and for DTI -24.7 – -19.2%.
Table 1. Measured velocities and the difference (Diff) between the measured and true
peripheral velocity of the cylinder at different true velocities and Doppler modes.
PW T-PW CW DTI
True
velocity
[cm/s]
Measured
[cm/s]
Diff
[%]
Measured
[cm/s]
Diff
[%]
Measured
[cm/s]
Diff
[%]
Measured
[cm/s]
Diff
[%]
2.5 2.9 16.1 1.9 -24.7 5.0 5.5 9.9 4.0 -19.2 10.0 10.6 5.6 7.8 -22.1 25.0 25.3 1.1 19.7 -21.3 50.0 52.6 5.2 53.1 6.2 100.0 102.8 2.8 105 4.9 200 200 0.0 211 5.4 400 421 5.1 -200 -207 3.6 -100.0 -104.4 4.4 -50.0 -52.4 4.7
PW = Pulsed Doppler; T-PW = Tissue pulsed Doppler; CW = Continuous Doppler; DTI = Doppler tissue imaging. Positive velocities are toward and negative velocities away from the transducer.
28
-Timing performance
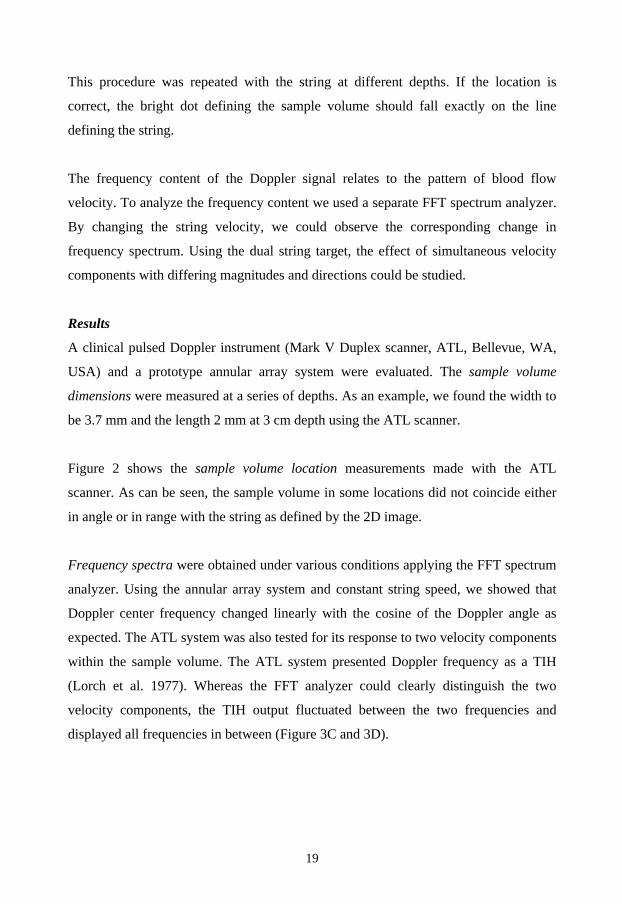
For PW and T-PW Doppler, the results are shown in Figure 9. The delays were in the
range 0 to 37 ms and longer for the ECG signal than for the AUX signal. The delays
varied as a function of the velocity scale settings with the longest delays at low
velocity scales.
Figure 9. Time delays in
flow (PW) and tissue (T-PW)
pulse Doppler in relation to
the electrocardiogram (ECG)
and auxiliary (AUX) signals
as a function of the velocity
scale.
Figure 10 depicts the response to the cylinder motion in the DTI mode from one
sampling area on the cylinder. Without temporal filtering, the velocity signal (yellow)
was synchronous with the AUX signal (blue), whereas the ECG signal (green) was
delayed approximately 20 ms. When temporal filtering of 70 ms was employed (right
image), the AUX and ECG signals were delayed approximately 27 ms and 40 ms,
respectively, after the velocity signal. The amplitude of the velocity signal was also
affected.
29
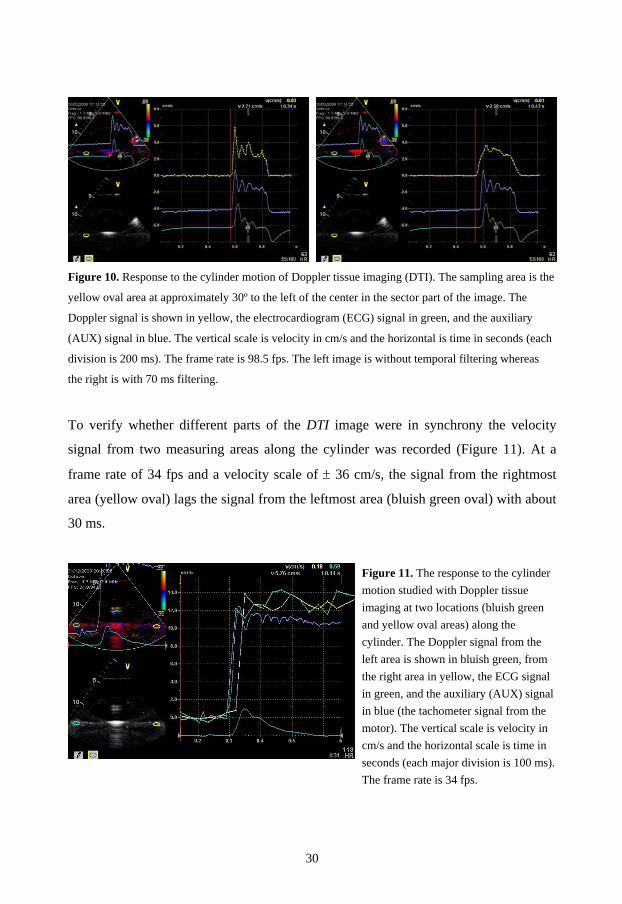
Figure 10. Response to the cylinder motion of Doppler tissue imaging (DTI). The sampling area is the
yellow oval area at approximately 30º to the left of the center in the sector part of the image. The
Doppler signal is shown in yellow, the electrocardiogram (ECG) signal in green, and the auxiliary
(AUX) signal in blue. The vertical scale is velocity in cm/s and the horizontal is time in seconds (each
division is 200 ms). The frame rate is 98.5 fps. The left image is without temporal filtering whereas
the right is with 70 ms filtering.
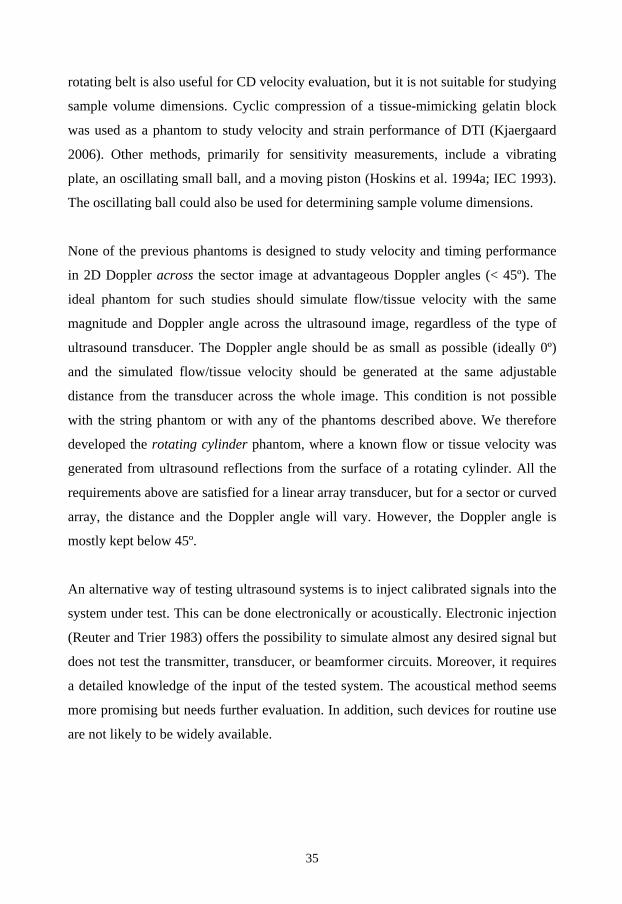
To verify whether different parts of the DTI image were in synchrony the velocity
signal from two measuring areas along the cylinder was recorded (Figure 11). At a
frame rate of 34 fps and a velocity scale of ± 36 cm/s, the signal from the rightmost
area (yellow oval) lags the signal from the leftmost area (bluish green oval) with about
30 ms.
Figure 11. The response to the cylinder motion studied with Doppler tissue imaging at two locations (bluish green and yellow oval areas) along the cylinder. The Doppler signal from the left area is shown in bluish green, from the right area in yellow, the ECG signal in green, and the auxiliary (AUX) signal in blue (the tachometer signal from the motor). The vertical scale is velocity in cm/s and the horizontal scale is time in seconds (each major division is 100 ms). The frame rate is 34 fps.
30

A series of triggered CD images were acquired at different frame rates. Images with
two frame rates are shown in Figure 12. Although the whole cylinder moves with the
same peripheral velocity, the images display colors corresponding to a spectrum of
velocities between zero and approximately 100 cm/s. The size of the colored area
varied with frame rate.
Figure 12. Triggered color Doppler
images of the response to the
cylinder motion acquired at 8.7
(115 ms) and 24.2 fps (41 ms). The
trigger point is shown as a red dot
on the green electrocardiogram
(ECG) signal. The blue trace is the
auxiliary (AUX) signal.
31

32

DISCUSSION AND CONCLUSIONS
In this thesis we have developed test methods for Doppler ultrasound systems utilizing
string phantoms and a rotating cylinder phantom. We have shown that these phantoms
can be used to test numerous characteristics of these systems. Specifically we have
found significant timing errors in some systems. Velocity calibration was mostly
acceptable in the tested systems.
Test phantoms
The string phantom was developed and used to study Doppler ultrasound system
properties (e.g., sample volume size and localization) and to illustrate how the
frequency spectra were influenced by string velocity, Doppler angle, and multiple
velocity components within the sample volume.
A string was chosen as test target in our phantom design in that it makes it reasonably
easy to implement a test phantom that can be used to evaluate and demonstrate several
properties of the tested ultrasound system. String phantoms with similar design as the
phantom described in Paper I have been used by numerous investigators (Cathignol et
al. 1994; Daigle et al. 1990; Eicke et al. 1993; Eicke et al. 1995; Goldstein 1991a;
Hames et al. 1991; Hoskins 1994a; Hoskins 1996; Lange and Loupas 1996; Phillips et
al.1990; Russell et al.1993; Thijssen et al. 2002; Wolstenhulme et al. 1997). The string
phantom is easy to calibrate accurately for velocity (string speed = rotational speed x
circumference of pulley). The string has a small diameter so that the sample volume
size and position can be studied. Moreover, it is suitable for testing several variables
derived from the velocity signal. It is relatively easy to steer, making it possible to
produce a predefined waveform with high acceleration and well-defined timing. The
string phantom is also recommended in standards (AIUM 1993; IEC 1993) and reports
(Hoskins et al. 1994a).
33

One disadvantage with string phantoms is that the obtained signal is stronger than that
at in vivo measurements. This has to be compensated for by lowering the gain of the
system. A proper choice of string filament can reduce the backscatter to a level more
resembling the in vivo situation. Some string filaments, depending on the structure of
the string, have varying backscatter characteristics in different directions (i.e.
depending on the Doppler angle) (Cathignol et al. 1994; Hoskins 1994b). Further, the
moving string only simulates one velocity at a certain time, whereas physiological
flow contains a range of velocities. String phantoms with two strings moving at
different velocities have been designed (Paper I; Lange and Loupas 1996). The test
procedure could be improved to provide signals closer to physiological conditions. For
example, tissue equivalent material could be placed between the transducer and the
string. A highly reflective target placed near the string can simulate the strong
reflections from vessel walls.
Doppler flow phantoms circulating a blood mimicking fluid in tubing attempt to
simulate physically the blood flow in a vessel (Boote and Zagzebski 1988; Groth et al.
1995; Hoskins et al. 1994a; IEC 1993; McDicken 1986; Thijssen et al. 2002; Browne
et al. 2007). These phantoms are suitable for studying volume flow, velocity profiles,
and 3D flow. On the other hand, they are not suitable for testing the velocity accuracy
of instruments because they are only calibrated for mean velocity and the velocity
varies across the tube diameter depending on the flow profile. They are also not well
suited for assessing sample volume location and size or for studying timing problems
because a time-controlled signal might be harder to obtain.
Other types of phantom have been designed utilizing a rotating/spinning disk (Bennett
et al. 2007; Fleming et al. 1994; Kripfgans et al. 2006; Nelson and Pretorius 1990), a
rotating torus (Stewart 1999 & 2001), or a rotating belt (Rickey et al. 1992). The
rotating disk is well suited for velocity calibration but is not meant to measure sample
volume dimensions. The rotating torus is primarily intended for assessing CD
accuracy, giving a rather realistic signal with a low velocity gradient. It is, however,
large and unwieldy, and furthermore, it is difficult to eliminate the air bubbles. The
34
rotating belt is also useful for CD velocity evaluation, but it is not suitable for studying
sample volume dimensions. Cyclic compression of a tissue-mimicking gelatin block
was used as a phantom to study velocity and strain performance of DTI (Kjaergaard
2006). Other methods, primarily for sensitivity measurements, include a vibrating
plate, an oscillating small ball, and a moving piston (Hoskins et al. 1994a; IEC 1993).
The oscillating ball could also be used for determining sample volume dimensions.
None of the previous phantoms is designed to study velocity and timing performance
in 2D Doppler across the sector image at advantageous Doppler angles (< 45º). The
ideal phantom for such studies should simulate flow/tissue velocity with the same
magnitude and Doppler angle across the ultrasound image, regardless of the type of
ultrasound transducer. The Doppler angle should be as small as possible (ideally 0º)
and the simulated flow/tissue velocity should be generated at the same adjustable
distance from the transducer across the whole image. This condition is not possible
with the string phantom or with any of the phantoms described above. We therefore
developed the rotating cylinder phantom, where a known flow or tissue velocity was
generated from ultrasound reflections from the surface of a rotating cylinder. All the
requirements above are satisfied for a linear array transducer, but for a sector or curved
array, the distance and the Doppler angle will vary. However, the Doppler angle is
mostly kept below 45º.
An alternative way of testing ultrasound systems is to inject calibrated signals into the
system under test. This can be done electronically or acoustically. Electronic injection
(Reuter and Trier 1983) offers the possibility to simulate almost any desired signal but
does not test the transmitter, transducer, or beamformer circuits. Moreover, it requires
a detailed knowledge of the input of the tested system. The acoustical method seems
more promising but needs further evaluation. In addition, such devices for routine use
are not likely to be widely available.
35

Time delays
In Paper II three commercial ultrasound systems were tested using the string phantom
for time delays in the spectral display of Doppler signals in relation to ECG,
phonocardiography, and AUX signals. In Paper IV similar tests were performed on a
fourth system using the rotating cylinder. In these tests we also included CD and DTI.
In Paper II we found in one system time delays of up to 90 ms between spectral
Doppler signals and the ECG and AUX signals, with the Doppler signal lagging the
ECG signal. In the system studied with the rotating cylinder phantom we observed
delays of up to 37 ms but now the ECG signal lagged the spectral Doppler signal. The
delays varied with velocity scale settings in both systems.
In the DTI mode the delays were inversely related to frame rate, with the ECG signal
delayed in relation to the DTI signal. When temporal filtering was employed, the
delays increased in proportion to the amount of filtering. The amplitude (velocity) was
also affected. The technical explanations for the effects of filtering and the possible
clinical effects have been previously examined (Gunnes et al. 2004). That study shows
the importance of a proper frame rate to avoid errors in both velocity and timing
measurements when velocity rapidly changes.
The rotating cylinder tests illustrate how the colored flow area in CD varies with frame
rate when rapid changes of flow velocity are studied (Figure 12).
-Test methods
To measure short time delays a signal with a stable and rapid change of amplitude is
required. In the present paper a simulated ECG signal was used, both as the time
reference (ECG input) and as the input to the string phantom to generate Doppler
signals. With the rotating cylinder phantom, we used a step-like signal to produce a
repetitive rapid acceleration moving from zero to a preset velocity followed by a
deceleration.
36

A potential error is the delay that is due to inertia in the motor-string system. This
delay was constantly monitored and compensated for in the string phantom studies.
When using the rotating cylinder, we avoided this problem by using the tachometer
signal as reference and applying it to the ECG and AUX inputs of the ultrasound
system. The tachometer signal renders the true motion of the cylinder. Another
potential error source concerns the establishment of the reference point for time
measurements in the Doppler spectrum (as defined in Paper II). To reduce the
uncertainty of this reference point we repeated measurements on three consecutive
simulated “heartbeats”.
-Clinical implications
In clinical practice different signals (e.g., ECG and Doppler velocity) are compared
when defining and measuring regional and global cardiac events and time intervals. It
is known that local time delays of cardiac events as short as 30 ms may be important
when diagnosing ischemic heart disease (Garcia-Fernandez et al. 1999). In two
systems tested the delays were small (less than15 ms) and in two systems we found
considerable time delays (up to 90 ms) that may have clinical implications. The time
delays varied with system settings (specially the velocity scale) and were dissimilar in
live and frozen displays.
Examples of measurements in which timing errors may be of importance are:
1. When relating Doppler velocity signals (i.e. PW, CW, T-PW, and DTI) to an
external signal (e.g., ECG, phonocardiogram, and intracardiac pressure).
2. When relating two or more Doppler velocity signals recorded using different
Doppler modes.
3. When relating Doppler velocity signals recorded with different system settings (e.g.,
different velocity scales or different temporal filtering properties in DTI mode).
4. When relating DTI velocity signals recorded from different sites across the sector
image.
37

5. When CD is used to obtain 2D flow profiles and when obtaining CD jet areas for
quantification of regurgitant flow (Eidenvall et al. 1992; Utsunomiya et al. 1990).
A situation where correct timing is of outmost importance is when evaluating cardiac
dyssynchrony (Gorcsan et al. 2008). Interventricular dyssynchrony is often quantified
by measuring the delay between the onset of the pulmonary artery and aortic flow
measured in PW Doppler mode with the ECG as a reference. Intraventricular
dyssynchrony may be quantified using T-PW Doppler and DTI signals to measure the
delay between onsets or the peaks of the systolic signals in anticipating basal segments
of the left ventricular wall.
Our ambition was to find all settings that could affect delays. Although we
investigated many settings, modern ultrasound systems have so many combinations of
settings that some settings leading to delays may have eluded us. The problem of time
delays in Doppler ultrasound signals has not been previously described in the
literature. It is our belief that the technical problem of time delays in different signals
in ultrasound systems should attract more attention from manufacturers and medical
investigators. The manufacturers should ensure that there are no such significant
delays in their systems.
Accuracy of velocity
In Paper III we demonstrated that one system consistently overestimated velocity by
an average of 4.6%. The other two systems tested showed mostly small errors in
velocity calibration for velocities above 25 cm/s. There was no systematic difference
between the different Doppler modes in any of the systems.
Using the rotating cylinder phantom, velocity measurements agreed within 6.2% with
true velocity in the PW and CW Doppler modes. The largest variability between the
obtained and the true velocity was found in the T-PW Doppler mode (1-16%), whereas
an underestimation of approximately 20% was found in the DTI mode.
38

-Test methods
The errors reported in this study are relatively low compared with those previously
reported in the literature (Table 2). There may be several reasons for this discrepancy.
First, in previous studies peak velocity was measured, whereas we measured the mean
string velocity. Because of spectral broadening, measurement of peak velocity will
yield an overestimation (Newhouse et al. 1980). Second, it has also been shown that
the type (structure) of filament used in string phantoms in combination with the
Doppler angle directly affects the intrinsic spectral broadening (Cathignol et al. 1994;
Hoskins 1994b). Because the aim of this study was to examine the velocity calibration
of the ultrasound systems and not the method of velocity estimation per se, the spectral
broadening is of less relevance.
Table 2. Errors in velocity reported in earlier studies.
Reference Phantom Transducer Velocity range
(cm/s)
Angle
(°)
Error
(%)
Daigle, 1990 String L 93 50 -3 - 30
String S 93 50 6 - 11
String L 93 70 3 - 61
String S 93 70 8 - 16
Groth, 1995 Flow L 6 - 25 50 7 - 30
Hoskins, 1996 String L, CL, PA 50 - 250 40 - 70 -4 - 47
Kimme Smith, 1990 Flow L, S, PA, M 25 - 75 50 - 60 -25 - 60
Flow S 25 - 75 80 35 - 100
Rickey, 1992 Belt D, L 0 - 80 70 -10 - 12 (mean)
Present study, 2003 String S 2.5 - 400 45 -4.5 - 8.0
L= linear, S= sector, CL= curved-linear, PA= phased array, M= mechanical, D= duplex
A stable, accurate test velocity source is needed for the measurement of ultrasound
system velocity accuracy. It should be easy to calibrate, use, and cover a sufficient
velocity range (2.5 - 400 cm/s). Both the string phantom and the rotating cylinder
phantom were calibrated using a slide caliper to measure the diameter of the drive
39

pulley/cylinder and a digital tachometer to measure the speed of rotation. The total
uncertainty of the test system consists of uncertainties in the measured diameter, speed
of rotation, resolution (digits) in phantom read-out, Doppler angle, and speed of sound
(ultrasound velocity) in water. The total relative uncertainty will vary with velocity:
±1.8% for the velocity range 20.0 – 400 cm/s and from ±3.0 to ±4.9% for the lowest
velocities (2.5 – 10.0 cm/s). The main sources of uncertainty are the Doppler angle at
high velocities and the last digit of the Doppler phantom display at lower velocities. At
velocities equal to or below 25 cm/s, larger velocity errors were found in the tested
ultrasound systems. However, these errors may partly be due to inaccuracies in the
performance of the Doppler phantoms at the lowest velocities.
When using the rotating cylinder phantom, the transducer receives not only the
velocity components directed straight toward the transducer but also contributions
from other Doppler angles, which is due to the thickness of the ultrasound sector
“slice” (Figure 8, cross-section). This situation results in a spectrum of velocities in
which the highest components correspond to the peripheral cylinder velocity (Figure
13). However, this signal can be separated in spectral Doppler but not in CD and DTI
because these latter techniques present only mean velocities.
Figure 13. A pulse wave Doppler
recording in which the sector part
of the image shows the cylinder
and the sample volume placed at
the center. The lower part displays
the Doppler spectrum, with the
cylinder’s peripheral velocity
measured at the cursor (+).
40

Based on our experience, the string phantom is still the first choice to test Doppler
velocity accuracy.
-Clinical implications
We have not found any specified demands on velocity accuracy in the literature.
Varying clinical and scientific measurements of velocity may demand different levels
of measurement accuracy. If no such requirements are specified in the literature, the
investigator should define what accuracy is needed and assure that this is met in all
measurements. However, it is reasonable to accept an uncertainty of ± 5% in a clinical
routine investigation. In research and other scholarly activities, the accuracy required
might be higher.
In two systems the average errors were close to zero and therefore of no clinical
significance. Even the overestimation by an average of 4.6% (range 1.0 - 8.3%) in one
system might not be important in a single measurement. However, when comparing
measurements done at different occasions with different ultrasound systems, the
problem might be of importance. Moreover, processing of velocity data may increase
the uncertainty. An example is when estimating pressure drop using the modified
Bernoulli equation where the velocity is squared. In this case the percentage of
uncertainty will double.
Conclusions
The purpose of these studies was to develop test methods for Doppler ultrasound
systems and apply these tests to some commercial systems.
We have shown that a moving string test target and a rotating cylinder phantom are
useful in providing information on Doppler ultrasound system performance. The
techniques are easy to implement, can help the user reach a better understanding of
ultrasound system function and controls, and can ensure that the system is working
properly.
41
Investigations using these phantoms have shown that serious time delays can be
present in the display of Doppler and M-mode signals in relation to ECG and other
external signals. These delays were affected by system settings and were dissimilar in
frozen and live displays. In the present studies delays as long as 90 ms were found in
one system, delays that can lead to serious errors when defining and measuring time
intervals of the heart cycle. This type of delay, which was rather unexpected,
emphasizes the importance of a critical attitude to acquired data and the importance of
methods for objective testing of ultrasound systems.
We have shown that velocity calibration was quite accurate in two common ultrasound
systems; however, a third system consistently overestimated velocity. This
overestimation was found both in the higher velocity ranges used in cardiac blood flow
measurements and in the lower ranges used in myocardial tissue velocity
measurements. Such errors may be acceptable in clinical measurements but may not be
acceptable in certain research fields.
Measurement and display of blood flow and tissue motion are the primary functions of
Doppler instruments, with velocity and time measurements serving as the primary
quantitative data. Therefore, manufacturers should specify the accuracy (including
eventual delays) and resolution of these variables, including reference to the test
methods used. Further, professional and scientific societies in the field of diagnostic
ultrasound should include demands on ultrasound system accuracy in their guidelines,
recommendations, and standards. Commercial test phantoms, including test protocols,
should be made available so that performance can be verified in a non-research setting.
Future work
There are relatively few commercially available test devices about Doppler ultrasound
testing and publications are scarce. From our experience, it seems that few tests are
performed in the hospital environment. The overall goal with this work was to improve
42

quality assurance in Doppler ultrasound measurements by providing methods and test
devices that could be used routinely in a clinical environment. Although many
measurable quantities of interest have been defined (Hoskins 1994a & 2008, Thijssen
2002), there is still a lack of readily available test methods.
The tests of time delays and velocity accuracy described in this thesis should be
extended to other ultrasound systems and to other transducers. Further, measurement
of velocity accuracy and linearity within each measurement range should be
investigated.
Spatial, velocity, and temporal resolution of both spectral and CD could be tested
using the moving string or rotating cylinder phantoms.
Modern ultrasound systems include several functions for calculating (derived)
variables from primary velocity, time, and spatial data. The string and cylinder
phantoms could be useful in testing the accuracy of these calculations by simulating
predefined velocity waveforms.
New techniques and applications (e.g., tissue velocity imaging, strain rate imaging,
echo particle image velocimetry (PIV), cardiac resynchronization therapy, 3D imaging
and the use of contrast) also require evaluation of performance. These new techniques
might require the development of new test methods.
It is important that in-house Doppler ultrasound performance testing is performed for
both clinical and scientific work. Therefore, the original moving string test target
described in Paper I was subsequently developed into a commercial test phantom
(DP1). Our intention is to develop it further so that it can become a natural part of
routine Doppler ultrasound quality assurance. It is also our intention to improve the
rotating cylinder phantom and ultimately to establish the usefulness of this phantom.
43

44

POPULÄRVETENSKAPLIG SAMMANFATTNING
Vid hjärt- och kärlundersökningar med ultraljud mäter och analyserar man bl a
blodflödet och vävnadens rörelse. Mätfel i den använda mätutrustningen kan eventuellt
leda till felaktig diagnos. Det är därför viktigt att kalibrera och kontrollera sin
utrustning med jämna mellanrum, för att säkerställa sina mätresultat.
-Testutrustning
Två typer av testutrustningar (“Moving string test target”, "Rotating cylinder
phantom”) utvecklades för kontroll och kalibrering av ultraljudutrustning. De består av
en motor som driver en tunn tråd respektive en roterande cylinder vilka i sin tur på ett
kontrollerat sätt simulerar rörelsen av blod eller vävnad. Testutrustningarna kan
användas för att testa flera olika egenskaper hos ultraljudutrustningen. I de fyra
delarbetena har vi främst studerat tidsfördröjningar av signaler och noggrannheten i
hastighetsmätningar. Vi har också visat på andra användningsmöjligheter som t ex test
av mätområdets utbredning och läge, jämförelse av olika beräkningsmetoder för
flödeshastighet, riktningskänslighet samt inverkan av vinkeln mellan rörelseriktning
och ultraljudstråle. Den roterande cylindern är främst lämpad för tvådimensionell
Doppler, s.k. färgDoppler och vävnadsDoppler.
-Tidsfördröjningar
Vid hjärtundersökningar med ultraljud (ekokardiografi) är det bl a viktigt att mäta
tidsintervall och tidsrelationer mellan olika händelser i hjärtcykeln. Dessa
tidsrelationer kan mätas med tekniker som flödes- och vävnads-Doppler och M-mode,
ofta i relation till externa signaler som elektrokardiografi (EKG) och fonokardiografi
(hjärtljud). Om en eller flera av dessa signaler visas fördröjda i förhållande till de
övriga (alltså ej synkrona), kan vi få felaktiga mätvärden. För att utröna om detta var
ett problem, undersökte vi några vanliga ultraljudutrustningar. En testsignal skickades
in simultant till ultraljudutrustningarnas EKG- och andra externa ingångar samt till
våra testutrustningar. Vi fann fördröjningar upp till 90 ms i en apparat medan två andra
45

apparater hade relativt små fördröjningar. Fördröjningarna i den första apparaten
förändrades vid olika apparatinställningar, t ex hastighetsskala, rörlig respektive fryst
bild samt direkt bild respektive videoinspelning. Eftersom man visat att förändringar i
hjärtats rörelsemönster, som är kortare än 30 ms, kan ha klinisk betydelse så är det
funna felet allvarligt.
-Hastighet
Vi undersökte även om tre ultraljudutrustningar var riktigt kalibrerade för flödes- och
rörelsehastighet, mätt med pulsad och kontinuerlig Doppler. Samma testutrustning
som ovan användes, men nu var den noggrant kalibrerad i aktuellt hastighetsintervall
(2.5 – 400 cm/s). Vi fann bara små fel (medelfel ≤ 2,2 %) i två av apparaterna, medan
en apparat visade systematiskt cirka 4,6 % för höga värden. Vid en normal, klinisk
undersökning har de funna felen oftast ingen större betydelse, men kan ha det i vissa
situationer och i vetenskapliga studier. Det är alltså viktigt att känna till hastighetsfelet
i en viss apparat, så att man kan bedöma dess betydelse i den aktuella applikationen.
Våra undersökningar visar att det är viktigt att ha en kritisk attityd till sina mätresultat.
För att kunna säkerställa sina mätresultat måste fabrikant och användare ha metoder
för att kontrollera sin ultraljudutrustning.
46
ACKNOWLEDGMENTS
I wish to thank all those who have helped and supported me, in particular:
Per Ask, my supervisor, for making this work possible, for good supervision, and for
always being available when needed.
Ivar Ringqvist, my co-supervisor, co-author, and friend, for introducing me to the field
of scientific research, for inspiring me over a span of more than 35 years, and for his
constructive help with the preparation of the manuscripts.
Bengt Wranne (deceased), my co-supervisor and co-author, for his many research
ideas and for his invaluable help and interest in this work.
Egil Henriksen, co-supervisor and co-author, for making it possible to carry this
research through and for valuable discussions and help with the manuscripts.
Eva Olsson, co-author, for her patience and devotion during countless number of
measurements on ultrasound systems.
David Phillips (deceased) and Jeffry Powers, co-authors, formerly at the Department
of Surgery and the Center for Bioengineering, University of Washington, Seattle, for
their inspiration during the first steps toward this thesis.
Gordon Kirkendall, Bitte Nolstedt, Annette Andersson, Sven Lindgren, Björn Segall,
Per Sveider and Markus Ullberg for skilful and devoted work when developing the
Doppler phantoms.
Pär Hedberg, Toomas Kangro, and Tommy Jonasson for fruitful discussions, valuable
help and comments on the manuscripts included in this thesis.
47

The Departments of Clinical Physiology and Biomedical Engineering, Central
Hospital, Västerås, my former and present employers, for providing me the
opportunity to do this research.
The Centre for Clinical Research, Central Hospital, Västerås, especially for help with
practical and statistical matters, and Jerzy Leppert, head of the centre, for valuable
support.
And not the least, my family, Marie-Louise, Lotta and Camilla, for always being there
for me and for their patience, support, and enthusiasm over the years. Special thanks to
my wife Marie-Louise for all her constructive discussions of the manuscripts.
This work was supported by grants from the County of Västmanland, Sweden, from the
Swedish Research Council, from the Swedish Heart-Lung Foundation, and from the SSF
program Cortech.
48

REFERENCES
American Institute of Ultrasound in Medicine. Standard methods for measuring
performance of pulse-echo ultrasound imaging equipment. AIUM 1990.
American Institute of Ultrasound in Medicine. Performance criteria and measurements
for Doppler ultrasound devices. AIUM 1993.
Angelsen BAJ. Ultrasound imaging. Waves, Signals and Signal Processing, Vol I & II.
Emantec, Trondheim, 2000.
Atkinson P, Woodcock JP. Doppler ultrasound and its use in clinical measurement.
Academic press inc., London, 1982. ISBN 0-12-066260-4.
Baker DW. Pulsed ultrasonic Doppler blood-flow sensing. IEEE Trans Sonics
Ultrasonics SU-17 1970;3:170.
Bennett M, McLaughlin S, Anderson T, McDicken N. Error analysis of ultrasonic
tissue Doppler velocity estimation techniques for quantification of velocity and strain.
Ultrasound Med Biol 2007;33:74-81.
Boote EJ and Zagzebski JA. Performance tests of Doppler ultrasound equipment with
a tissue and blood-mimicking phantom. J Ultrasound Med 1988;7:137-147.
Brendel K, Filipczynski LS, Gerstner R, Hill CR, Kossoff G, Quentin G, Reid JM,
Saneyoshi J, Somer JC, Tchevnenko AA, Wells PNT. Methods of measuring the
performance of ultrasonic pulse-echo diagnostic equipment. Ultrasound Med Biol
1977;2:343-50.
49

Browne J, Brown I, Hoskins P, Watson A, Elliott A.. Colour Doppler spatial resolution
performance testing. Ultrasound 2007;15:162-166.
Carson PL. Imaging factors and evaluation ultrasound. In Haus AJ (ed): Physics of
medical imaging: Recording system measurements and techniques. American Assn of
Physicists in Medicine, Chicago, Ill, 1979;366-380.
Cathignol D, Dickerson K, Newhouse VL, Faure P, Chapelon JY. On the spectral
properties of Doppler thread phantoms. Ultrasound Med Biol 1994;20:601-610.
Daigle RJ, Stavros AT, Lee RM. Overestimation of velocity and frequency values by
multielement linear array Dopplers. J Vasc Technol 1990;14:206-213.
Edler I, Hertz CH. The use of the ultrasonic reflectoscope for the continuous recording
of the movement of heart walls. Kungl. fysiogr. sällskap Lund, förhandl 1954;24:40-
58.
Eicke BM, Tegeler CH, Howard G, Bennet, JB, Myers LG, Meads D. In vitro
validation of color velocity imaging and spectral Doppler for velocity determination. J
Neuroimaging 1993;3:89-92.
Eicke BM, Kremkau FW, Hinson H, Tegeler CH. Peak velocity overestimation and
linear-array spectral Doppler. J Neuroimaging 1995;5:115-121.
Eidenvall L, Janerot Sjöberg B, Ask P, Loyd D, Wranne B. Two-dimensional color
Doppler flow velocity profiles can be time corrected with an external ECG-delay
device. J Am Soc Echocardiogr 1992;5:405-413.
Evans DH. Techniques for Color-flow Imaging, in Wells PNT (Ed.): Advances in
ultrasound techniques and instrumentation. New York: Churchill Livingstone,
1993:87-107.
50

Fleming AD, McDicken WN, Sutherland GR, Hoskins PR. Assessment of colour
Doppler tissue imaging using test-phantoms. Ultrasound Med Biol 1994;20:937-951.
Fukuda K, Oki T, Tabata T, Iuchi A, Ito S. Regional left ventricular wall motion
abnormalities in myocardial infarction studied with pulsed tissue Doppler imaging. J
Am Soc Echocardiogr 1998;11:841-848.
Garcia-Fernandez MA, Azevedo J, Moreno M, et al. Regional diastolic function in
ischaemic heart disease using pulsed wave Doppler tissue imaging. Eur Heart J
1999;20:496-505.
Goldstein A. Performance test of Doppler ultrasound equipment with a string
phantom. J Ultrasound Med 1991a;10:125-139.
Goldstein A. Effect of tank liquid acoustic velocity on Doppler string phantom
measurements. J Ultrasound Med 1991b;10:141-148.
Gorcsan J 3rd, Abraham T, Adler DA, Bax JJ, Derumeaux G, Grimm RA, Martin R,
Steinberg JS, Sutton MS, Yu CM. Echocardiography for Cardiac Resynchronization
Therapy: Recommendations for Performance and Reporting–A Report from the
American Society of Echocardiography Dyssynchrony Writing Group Endorsed by the
Heart Rhythm Society. J Am Soc Echocardiogr 2008;21:191-213.
Groth DS, Zink FE, Felmlee JP, Kofler JM, James EM, Lindsey JR, Pavlicek W.
Blood flow measurements: A comparison of 25 clinical ultrasonographic units. J
Ultrasound Med 1995;14:273-277.
Gunnes S, Storaa C, Lind B, Nowak J, Brodin L-Å. Analysis of the effect of temporal
filtering in myocardial tissue velocity imaging. J Am Soc Echocardiogr 2004;17:1138-
45.
51

Hames TK, Nelligan BJ, Nelson RJ, Gazzard VM, Roberts J. The resolution of
transcranial Doppler scanning: a method for in vitro evaluation. Clin Phys Physiol
Meas 1991;12:157-161.
Hatle L, Angelsen BAJ. Doppler Ultrasound in Cardiology: Physical Principles and
Clinical Applications. 3rd edition. Lea & Febiger, Philadephia,USA, 1993. ISBN 0-
812112679.
Holmer N-G (ed.). Diagnostiskt ultraljud - Grunderna. 2nd ed. Teknikinformation,
Lund, Sweden, 1992. ISBN 91-88156-02-8.
Hoskins PR, Sherriff SB, Evans JA (editors). Testing of Doppler ultrasound
equipment, Institute of physical sciences in Medicine, York, England. Report No.70;
1994a. ISBN 0-904181-715.
Hoskins PR. Choice of moving target for a string phantom: II. On the performance
testing of Doppler ultrasound systems. Ultrasound Med Biol 1994b;20:781-789.
Hoskins PR. Accuracy of maximum velocity estimates made using Doppler ultrasound
systems. Br J Radiol 1996;69:172-177.
Hoskins, PR. Simulation and validation of arterial ultrasound imaging and blood flow.
Ultrasound Med Biol 2008;34:693-717.
International Electrotechnical Comission (IEC). Methods of measuring the
performance of ultrasonic pulse-echo diagnostic equipment. IEC Technical report 854,
1986.
International Electrotechnical Comission (IEC). Ultrasonics - Continuous wave
Doppler systems - Test procedures. IEC Technical report 1206, 1993.
52
Isaaz K, Thompson A, Ethevenot G, Cloez JL, Brembilla B, Pernot C. Doppler
echocardiographic measurement of low velocity motion of the left ventricular posterior
wall. Am J Cardiol 1989;64:66-75.
Jensen JA. Estimation of blood velocities using ultrasound: a signal processing
approach. University press, Cambridge, GB, 1996. ISBN 0-521-46484-6.
Kimme-Smith C, Hussain R, Duerinckx A, Tessler F, Grant E. Assurance of consistent
peak-velocity measurements with a variety of duplex Doppler instruments. Radiology
1990;177:265-272.
Kjaergaard J, Korinek J, Belohlavek M, Oh J, Sogaard P, Hassager C. Accuracy,
reproducibility, and comparability of Doppler tissue imaging by two high-end
ultrasound systems. J Am Soc Echocardiogr 2006;19:322-328.
Kripfgans O, Rubin J, Hall A, Fowlkes B. Vector Doppler imaging of a spinning disc
ultrasound Doppler phantom. Ultrasound Med Biol 2006;32:1037-1046.
Lange GJ and Loupas T. Spectral and color Doppler sonographic applications of a new
test object with adjustable moving target spacing. J Ultrasound Med 1996;15:775-784.
Lorch G, Rubenstein S, Baker D, Dooley T, Dodge H. Doppler echocardiography. Use
of a graphical display system. Circulation 1977; 56:576-85.
McDicken WN. A versatile test-object for the calibration of ultrasonic Doppler flow
instruments. Ultrasound Med Biol 1986;12:245-249.
Mishiro Y, Oki T, Yamada H, Wakasuki T, Ito S. Evaluation of left ventricular
contraction abnormalities in patients with dilated cardiomyopathy with the use of
pulsed tissue Doppler imaging. J Am Soc Echocardiogr 1999;12:913-920.
53

Mundigler G, Zehetgruber M. Tissue Doppler Imaging: Myocardial Velocities and
Strain - Are there Clinical Applications? J Clin Basic Cardiol 2002;5:125-132.
Nelson TR and Pretorius DH. The Doppler signal: Where does it come from and what
does it mean? AJR 1988; 151:439-447.
Nelson TR, Pretorius DH. Device for the calibration of flow-velocity measuring
Doppler ultrasound equipment. J Ultrasound Med 1990;9:575-581.
Newhouse VL, Furgason ES, Johnson GF and Wolf DA. The dependence of
ultrasound Doppler bandwidth on beam geometry. IEEE Trans Sonics Ultrason
1980;27:50-59.
Phillips DJ, Hossack J, Beach KW, Strandness DE. Testing ultrasonic pulsed Doppler
instruments with a physiologic string phantom. J Ultrasound Med 1990;9:429-436.
Reid JM. Methods of measuring the performance of continuous-wave ultrasonic
Doppler diagnostic equipment. IEC subcommittee 29D, Ultrasonics, Working group 4,
Medical Applications. Draft. 1979.
Reuter R and Trier HG. Der Doppler-simulator DS 81. Eine neue Kalibriermethode für
Ultraschall-cw-Doppler-Blutfluss-Messgeräte. Ultraschall 1983;4:188-191.
Rickey DW, Rankin R, Fenster A. A velocity evaluation phantom for colour and
pulsed Doppler instruments. Ultrasound Med Biol 1992;18:479-494.
Robinson DE, Kossoff G. Performance tests of ultrasonic echoscopes for medical
diagnosis. Radiology 1972;104:123-132.
54
Russell SV, McHugh D, Moreman BR. A programmable Doppler string test object.
Phys Med Biol 1993;38:1623-1630.
Satomura S. Doppler Ultrasonic Doppler method for inspection of cardiac functions. J
Acoust Soc Am 1957;29:1181-1185.
Stewart SFC. A rotating torus phantom for assessing color Doppler accuracy.
Ultrasound Med Biol 1999;25:1251-1264.
Stewart SFC. Effects of transducer, velocity, Doppler angle, and instrument settings on
the accuracy of color Doppler ultrasound. Ultrasound Med Biol 2001;27:551-564.
Sutherland GR, Hatle L. Pulsed Doppler myocardial imaging. A new approach to
regional longitudinal function? Eur J Echocardiogr 2000;1:81-83.
Thijssen JM, van Wijk MC, Cuypers MHM. Performance testing of medical
echo/Doppler equipment. Eur J Ultrasound 2002;15:151 – 164.
Thijssen JM, Weijers G, de Korte CL. Objective performance testing and quality
assurance of medical ultrasound equipment. Ultrasound Med Biol 2007;33:460-471.
Utsunomiya T, Ogawa T, King SW, Sunada E, Lobodzinsky SM, Henry WL, Gardin
JM. Pitfalls in the Display of Color Doppler Jet Areas: Combined Variability Due to
Doppler Angle, Frame Rate and Scanning Direction. Echocardiography 1990;7:739-
45.
Wolstenhulme S, Evans JA, Weston MJ. The agreement between colour Doppler
systems in measuring internal carotid artery peak systolic velocities. Br J Radiol
1997;70:1043-1052.
55


