Uns
aved
Doc
umen
t / 0
1/05
/201
2 / 0
8:12
Testing the new oil market ‘consensus’
Platts Middle Distillates Conference Antwerp, January 2014

Uns
aved
Doc
umen
t / 0
1/05
/201
2 / 0
8:12
1
Disclaimer
The information contained in this presentation (the “Presentation”) is being provided by Gunvor Group Ltd (the “Company”) and its subsidiaries (together with the Company, the “Group”). The Presentation is for information purposes only and any information made available orally or in writing at the Presentation is strictly confidential and may not be distributed, published, copied or reproduced (in whole or in part) or disclosed by its recipients to any other person for any purpose, at any time or in any form other than with the prior written consent of the Company.
This Presentation does not constitute or form part of and should not be construed as, any offer or invitation to sell or issue, or any solicitation of any offer to purchase or subscribe for, any securities to any person in any jurisdiction nor shall it (or any part of it), or the fact of its distribution, form the basis of, or be relied on in connection with or act as any recommendation or inducement to enter into, any contract, commitment or investment decision whatsoever relating to any securities. The information contained in this Presentation, unless otherwise specified, is only current as of the date of this Presentation and is subject to further verification and amendment in any way without liability or notice to any person. The information contained in this Presentation has not been independently verified. The Company, all members of the Group and their respective associates or directors, officers, employees, advisers or representatives expressly disclaim any duty, undertaking or obligation to update publicly or release any revisions to any of the information, opinions or forward looking statements contained in this Presentation to reflect any events or circumstances occurring after the date of this Presentation. No undertaking, representation or warranty or other assurance, express or implied, is made or given as to the accuracy, completeness, sufficiency or fairness of the information or opinions contained or expressed in the Presentation or any information made available orally or in writing at the Presentation (or whether any information has been omitted from the Presentation) and, save in the case of fraud, no responsibility or liability is accepted by any person for any loss, cost or damage suffered or incurred as a result of the reliance on such information or opinions or otherwise arising in connection with the Presentation. In addition, no duty of care or otherwise is owed by any person for any loss, cost or damage suffered or incurred as a result of the reliance on such information or opinions or otherwise arising in connection with the Presentation. Recipients of the Presentation should conduct their own investigation, evaluation and analysis of the business, data and property described in the Presentation. This Presentation contains unaudited financial information in relation to the Group.
This presentation includes statements that are, or may be deemed to be, ‘forward-looking statements’. These forward-looking statements can be identified by the use of forward-looking terminology, including the terms ‘targets’, ‘believes’, ‘anticipates’, ‘expects’, ‘estimates’, ‘intends’, ‘plans’, ‘will’, ‘may’, ‘could’ or ‘should’ or similar expressions or by discussions of plans, objectives, goals, strategies, future events or performance and underlying assumptions. These forward-looking statements include matters that are not historical facts or are statements regarding the Company’s intentions, beliefs or current expectations. Forward-looking statements are based on current plans, estimates and projections, and therefore too much reliance should not be placed upon them. Such statements are subject to risks and uncertainties, most of which are difficult to predict and generally beyond the Company's control. If the assumptions underlying any of these statements prove incorrect, the Company’s actual results of operations, financial condition and liquidity and the development of the industry in which the Company operates may materially differ from those made in, or suggested by, the forward-looking statements contained in this Presentation. The Company expressly disclaims any obligation or undertaking publicly to review or confirm analysts expectations or estimates or to release publicly any updates or revisions to any forward-looking statements contained herein to reflect any changes in the Company's expectations with regard thereto or any change in events, conditions or circumstances on which any such statement is based.
This Presentation is not directed to, or intended for distribution to or use by, any person or entity that is a citizen or resident of, or located in, any locality, state, country or other jurisdiction where such distribution or use would be contrary to law or regulation or which would require any registration or licensing within such jurisdiction.

Uns
aved
Doc
umen
t / 0
1/05
/201
2 / 0
8:12
2
Pump It Move It Refine It Store It Sell It Move It
Gunvor: Providing liquidity along the supply chain
• Origins trading Russian crude into Europe since 2000 • Now more diversified - geographically, across
products and along the value chain • But trading remains central
Uns
aved
Doc
umen
t / 0
1/05
/201
2 / 0
8:12
3
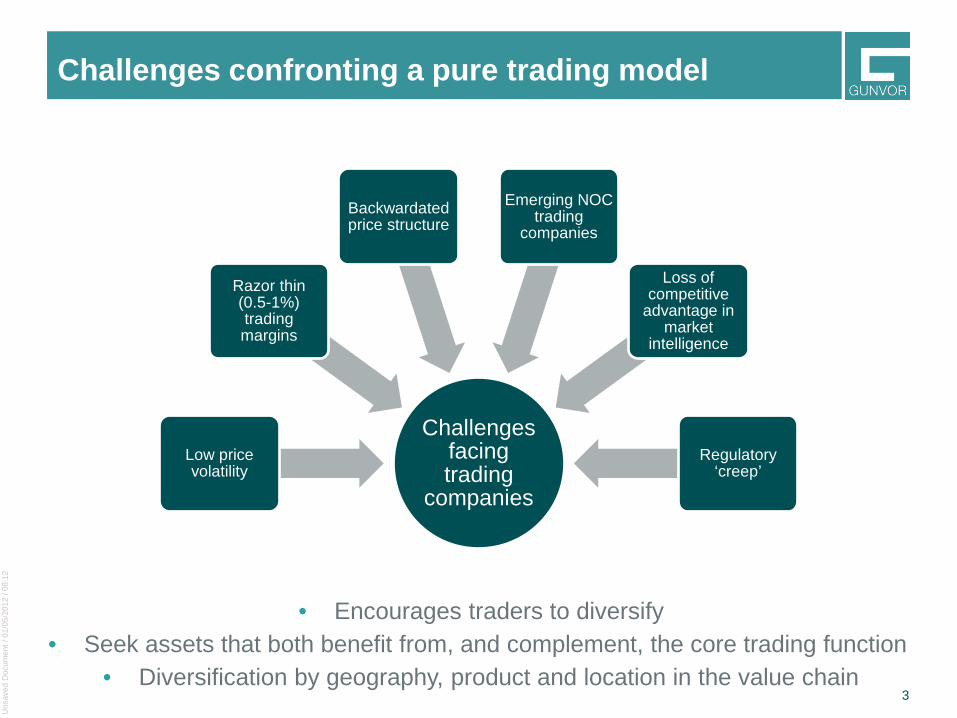
Challenges confronting a pure trading model
Challenges facing trading
companies
Low price volatility
Razor thin (0.5-1%) trading margins
Backwardated price structure
Emerging NOC trading
companies
Loss of competitive
advantage in market
intelligence
Regulatory ‘creep’
• Encourages traders to diversify • Seek assets that both benefit from, and complement, the core trading function
• Diversification by geography, product and location in the value chain
Uns
aved
Doc
umen
t / 0
1/05
/201
2 / 0
8:12
4
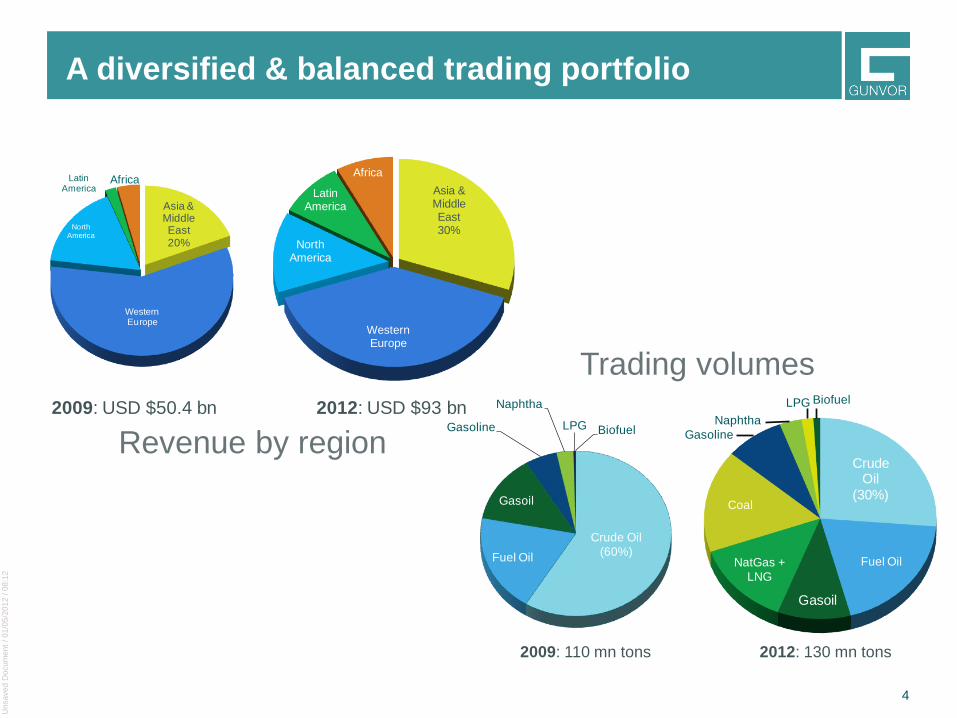
A diversified & balanced trading portfolio
Asia & Middle East 20%
WesternEurope
North America
Latin America
AfricaAsia & Middle East 30%
Western Europe
North America
Latin America
Africa
2009: USD $50.4 bn 2012: USD $93 bn
Crude Oil(60%)Fuel Oil
Gasoil
Gasoline
Naphtha
LPG Biofuel
Crude Oil
(30%)
Fuel Oil
Gasoil
NatGas + LNG
Coal
GasolineNaphtha
LPG Biofuel
2009: 110 mn tons 2012: 130 mn tons
Revenue by region
Trading volumes

Uns
aved
Doc
umen
t / 0
1/05
/201
2 / 0
8:12
5
Investment strategy – integration along the value chain
• Ust Luga Oil Products Terminal (Russia)
• Ust Luga Crude Oil Pipeline (Russia)
• Novorossiysk Fuel Oil Terminal (Russia)
• Petroterminal de Panama, S.A. (Panama)
• Independent Belgium Refinery BV (Belgium)
• Gunvor Raffinerie Deutschland GmbH (Germany)
• TAL Pipeline (Italy, Austria, Germany)
Signal Peak (United States)
• LLC Kolmar (Russia)
• Keaton Energy Holdings Ltd (South Africa)
• Lagansky Block (Caspian Sea)
• PA Resources (North Sea, North and West Africa)
Midstream
Downstream
Upstream
Uns
aved
Doc
umen
t / 0
1/05
/201
2 / 0
8:12
6
New consensus on oil markets deserves testing
1. “2014 marks the beginnings of a bear market”
2. “En route for robust economic recovery”
3. “Emerging markets underpin 1 mb/d+ yearly demand growth”
4. “North American supply revolution will continue apace”
5. “The inevitable rise of Iraq, and a new, bipolar OPEC”
6. “Comfortable mid-term fundamentals”
7. Where does this all leave European refining?

Uns
aved
Doc
umen
t / 0
1/05
/201
2 / 0
8:12
7
2014: the return of Libya & Iran will take time
160 kb/d 230 kb/d 110 kb/d
250 kb/d
70 kb/d
90 kb/d
350 kb/d
Libyan exports may struggle to exceed 500 kb/d in early-
2014

Uns
aved
Doc
umen
t / 0
1/05
/201
2 / 0
8:12
8
Tighter 2013 fundamentals, and more of the same in 2014?
• Consensus fundamentals - weak 1H14, tighter 2H14
• But ‘hidden’ non-OECD demand for stock…
• …& seasonal OECD stock change raise OPEC call thru’ 3Q14
• Heightened geopolitical risk also at play, at least until mid-2014
• Range-bound prices continue?
Source: IEA Oil Market Report, Jan 2014

Uns
aved
Doc
umen
t / 0
1/05
/201
2 / 0
8:12
9
Mid term: evolving macro-economic risks
11.5
22.5
33.5
44.5
55.5
6
Developed economies Emerging markets
% g
row
th
Risk shifts to emerging marketschange in IMF GDP forecast Jan 2013-Jan 2014
2013 2014
2013 2014
IEA/WEO (2013) estimate worldwide fossil fuel subsidies of $544 billion in 2012
IMF sees increased EM financial risk after rapid credit growth, capital flow volatility,
Structural reforms needed, nb subsidies Economic slowdown in EMs has heavier
impact on oil than in developed economies (oil intensity)
Uns
aved
Doc
umen
t / 0
1/05
/201
2 / 0
8:12
10
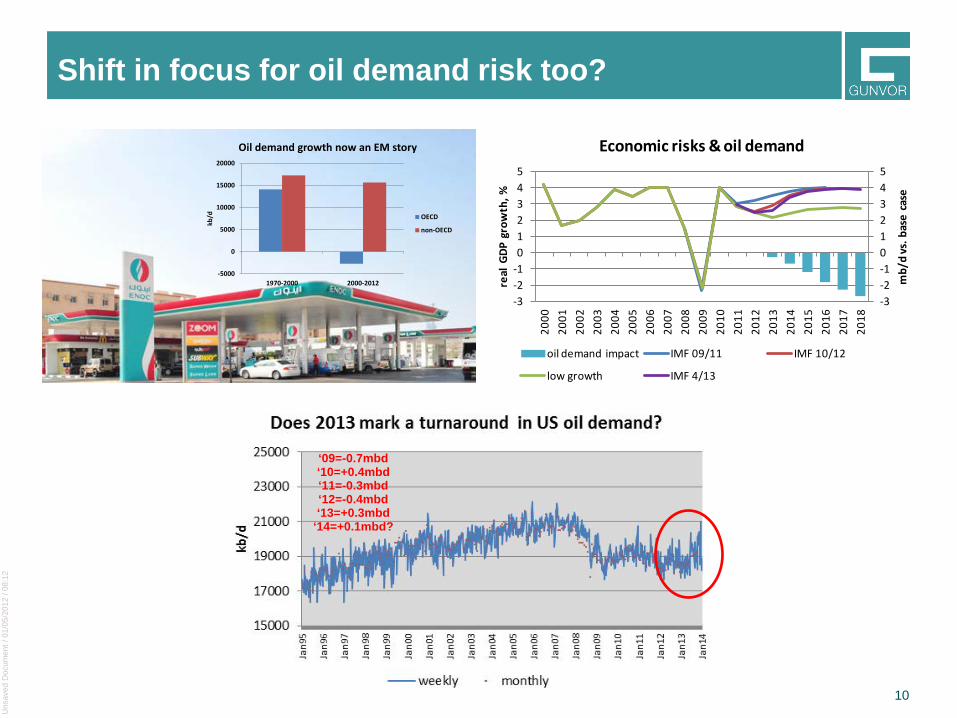
Shift in focus for oil demand risk too?
-5000
0
5000
10000
15000
20000
1970-2000 2000-2012
kb/d
Oil demand growth now an EM story
OECD
non-OECD
-3-2-1012345
-3-2-1012345
2000
2001
2002
2003
2004
2005
2006
2007
2008
2009
2010
2011
2012
2013
2014
2015
2016
2017
2018
mb/
d vs
. bas
e ca
se
real
GDP
gro
wth
, %
Economic risks & oil demand
oil demand impact IMF 09/11 IMF 10/12
low growth IMF 4/13
‘09=-0.7mbd ‘10=+0.4mbd ‘11=-0.3mbd ‘12=-0.4mbd ‘13=+0.3mbd
‘14=+0.1mbd?
Uns
aved
Doc
umen
t / 0
1/05
/201
2 / 0
8:12
11
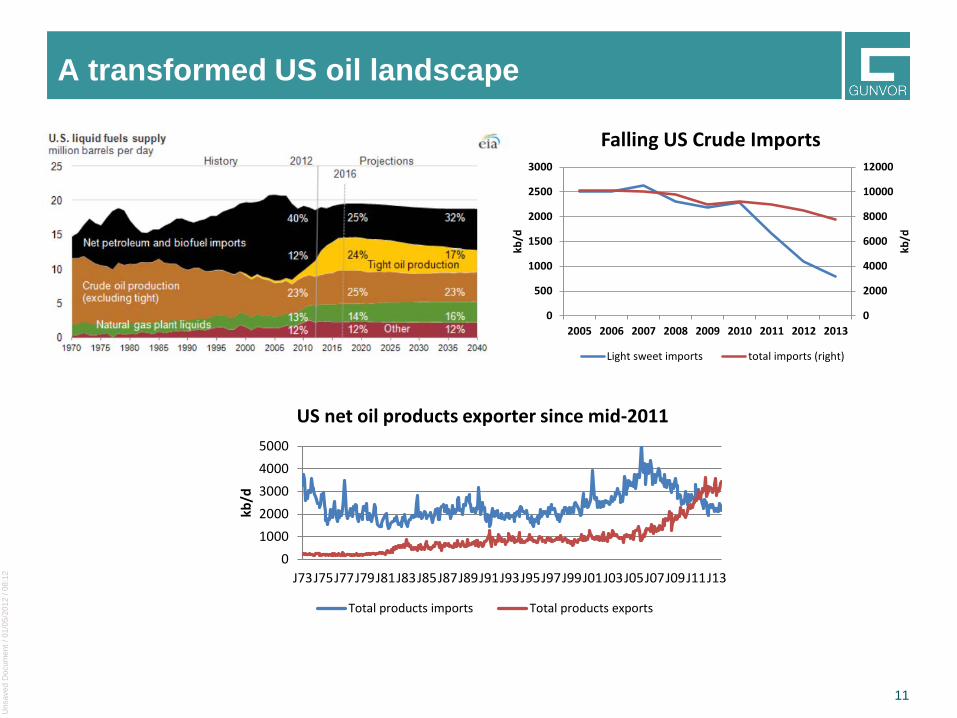
A transformed US oil landscape
0
2000
4000
6000
8000
10000
12000
0
500
1000
1500
2000
2500
3000
2005 2006 2007 2008 2009 2010 2011 2012 2013
kb/d
kb/d
Falling US Crude Imports
Light sweet imports total imports (right)
010002000300040005000
J73J75J77J79J81J83J85J87J89J91J93J95J97J99J01J03J05J07J09J11J13
kb/d
US net oil products exporter since mid-2011
Total products imports Total products exports

Uns
aved
Doc
umen
t / 0
1/05
/201
2 / 0
8:12
12 12
Logistical & policy issues hit first WTI, and now LLS?
405060708090
100110120
Bakk
en
Eagl
e Fo
rd
Perm
ian
Full
fund
ing
Bren
t
OPE
C b/
e Br
ent
OPE
C b/
e W
TI
Oil
sand
s SAG
D
Min
ing
& u
/g
Break-even costs & prices, $/bbl WTI
Uns
aved
Doc
umen
t / 0
1/05
/201
2 / 0
8:12
13
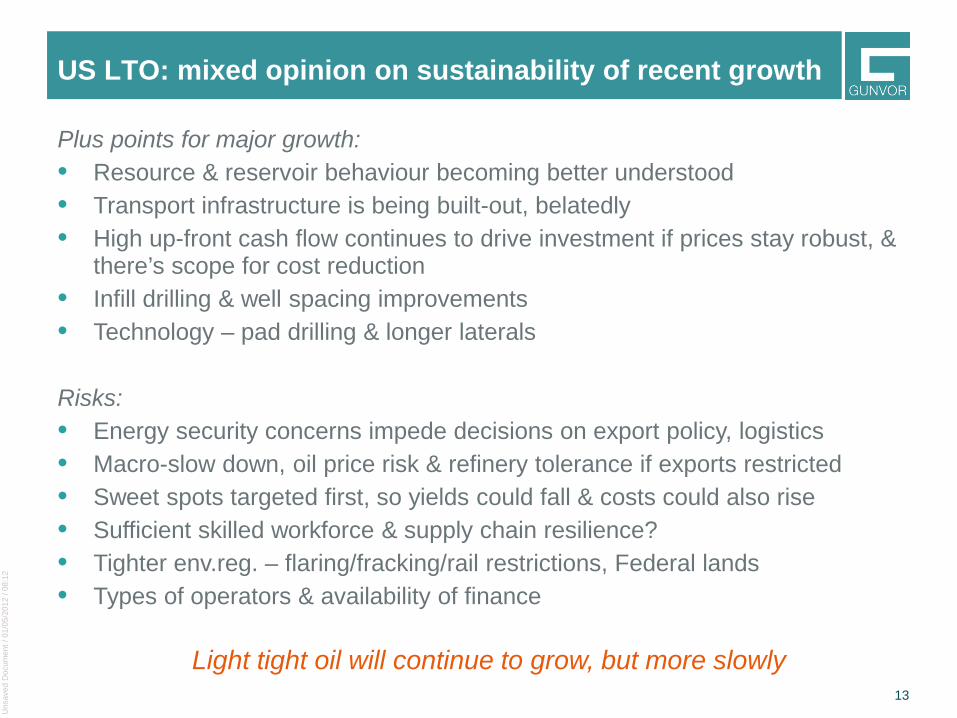
US LTO: mixed opinion on sustainability of recent growth
Plus points for major growth: • Resource & reservoir behaviour becoming better understood • Transport infrastructure is being built-out, belatedly • High up-front cash flow continues to drive investment if prices stay robust, &
there’s scope for cost reduction • Infill drilling & well spacing improvements • Technology – pad drilling & longer laterals
Risks: • Energy security concerns impede decisions on export policy, logistics • Macro-slow down, oil price risk & refinery tolerance if exports restricted • Sweet spots targeted first, so yields could fall & costs could also rise • Sufficient skilled workforce & supply chain resilience? • Tighter env.reg. – flaring/fracking/rail restrictions, Federal lands • Types of operators & availability of finance
Light tight oil will continue to grow, but more slowly
Uns
aved
Doc
umen
t / 0
1/05
/201
2 / 0
8:12
14
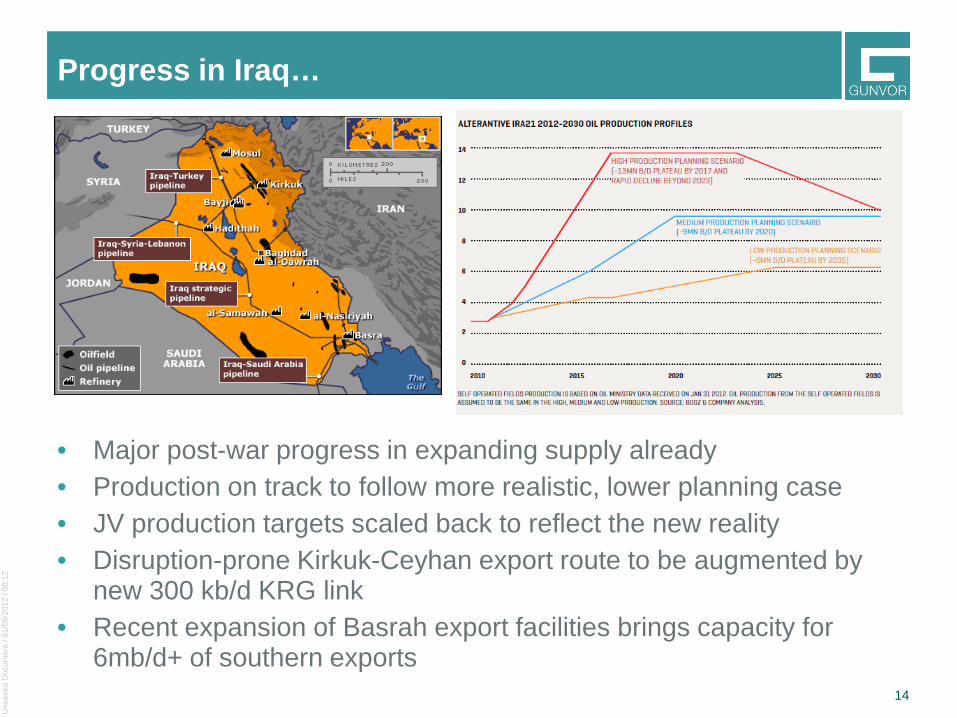
Progress in Iraq…
• Major post-war progress in expanding supply already • Production on track to follow more realistic, lower planning case • JV production targets scaled back to reflect the new reality • Disruption-prone Kirkuk-Ceyhan export route to be augmented by
new 300 kb/d KRG link • Recent expansion of Basrah export facilities brings capacity for
6mb/d+ of southern exports
Uns
aved
Doc
umen
t / 0
1/05
/201
2 / 0
8:12
15
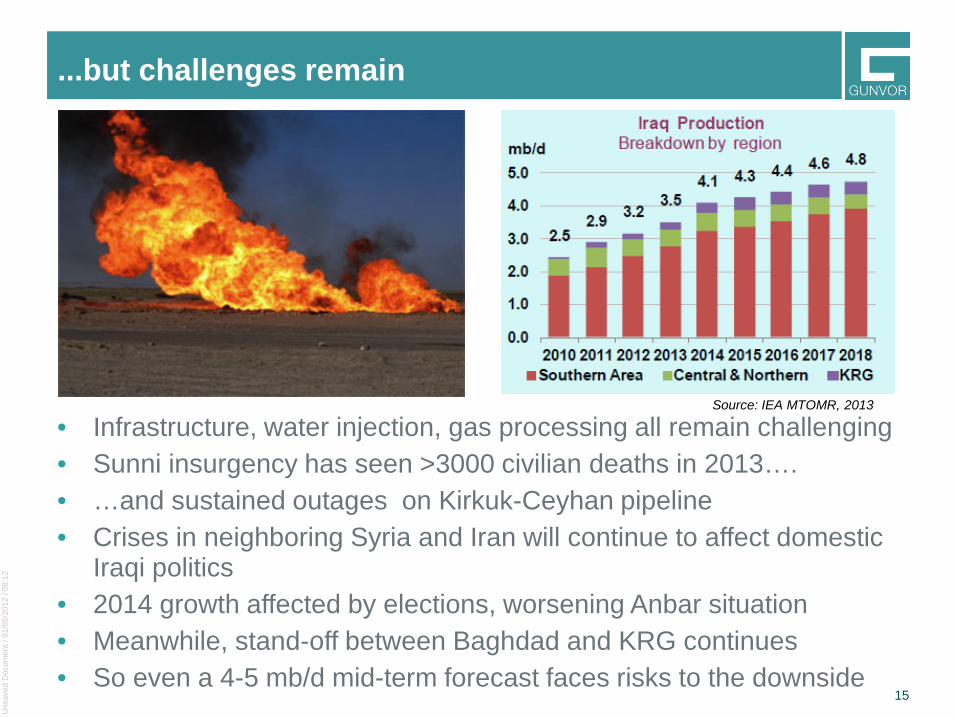
...but challenges remain
• Infrastructure, water injection, gas processing all remain challenging • Sunni insurgency has seen >3000 civilian deaths in 2013…. • …and sustained outages on Kirkuk-Ceyhan pipeline • Crises in neighboring Syria and Iran will continue to affect domestic
Iraqi politics • 2014 growth affected by elections, worsening Anbar situation • Meanwhile, stand-off between Baghdad and KRG continues • So even a 4-5 mb/d mid-term forecast faces risks to the downside
Source: IEA MTOMR, 2013

Uns
aved
Doc
umen
t / 0
1/05
/201
2 / 0
8:12
16 16
Medium Term: easing market fundamentals on resurgent supply
• Lower-than-expected spare capacity in 2013 was due to supply issues (2-3 mb/d)
• Even an improved, more ample supply scenario doesn’t necessarily equate to sharply lower crude prices
Effective OPEC Spare Capacitymb/d 2013January 3.26February 3.63March 3.59April 3.38May 3.47June 3.23July 3.13August 3.08September 2.94October 3.32November 3.37December 3.33Average 3.31
Source: IEA MTOMR, 2013
Uns
aved
Doc
umen
t / 0
1/05
/201
2 / 0
8:12
17
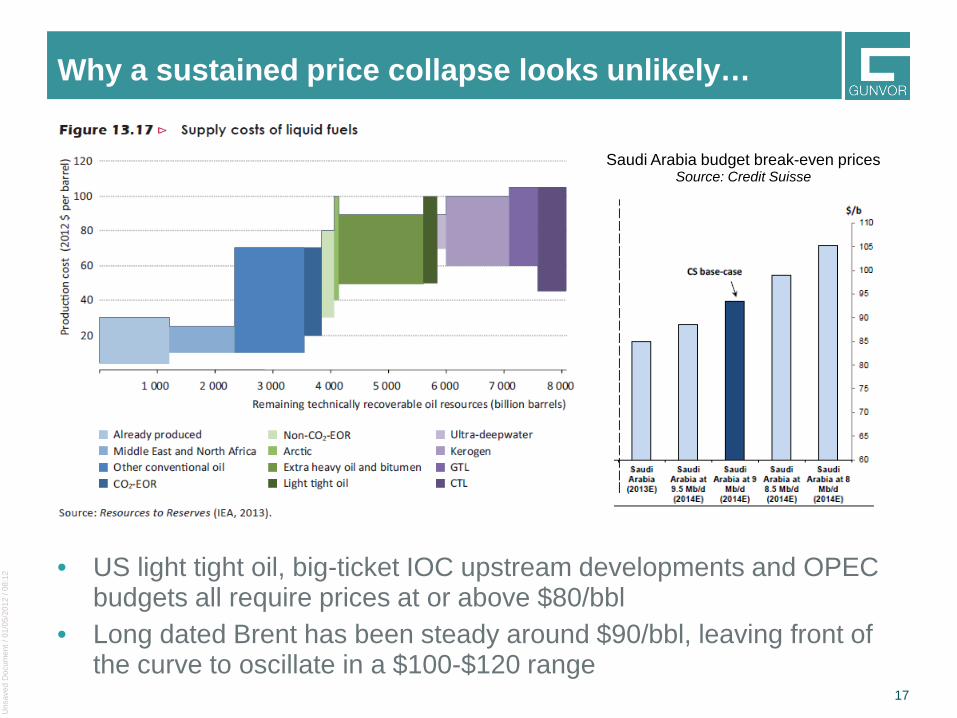
Why a sustained price collapse looks unlikely…
• US light tight oil, big-ticket IOC upstream developments and OPEC budgets all require prices at or above $80/bbl
• Long dated Brent has been steady around $90/bbl, leaving front of the curve to oscillate in a $100-$120 range
Saudi Arabia budget break-even prices Source: Credit Suisse

Uns
aved
Doc
umen
t / 0
1/05
/201
2 / 0
8:12
18
…unless Saudi Arabia loses patience
9.8 9.8 9.2 8.5 8.1 8.2 8.3 8.4 8.5
3.0 2.7 2.5 2.5 2.4 2.3 2.2 2.1 2.03.0 3.1 3.3 3.5 3.8 4.0 4.2 4.3 4.5
0.0
5.0
10.0
15.0
20.0
25.0
30.0
35.0
2012 2013 2014 2015 2016 2017 2018 2019 2020
mb/
dOPEC output under a constrained 'call'
Saudi Arabia Iran Iraq
Other GCC Other OPEC 'call'
• Sustained demand growth, slow Iranian petroleum decline, plus conservative Iraqi outlook….
• Yet Saudi Arabia is still held below 9 mb/d??

Uns
aved
Doc
umen
t / 0
1/05
/201
2 / 0
8:12
19
Major new refining capacity in Asia, Mid.East, Lat.America
• Simple arithmetic: +6 mb/d demand confronts +8-9 mb/d of new refining capacity during 2013-2018.
• Around 1 mb/d of upgrading additions annually too • Much of the new build in Asia, Middle East & Latin America is
designed to improve self sufficiency or to create export hubs • Less likely to cut runs than ‘purely commercial’ capacity elsewhere
Source: IEA MTOMR 2013

Uns
aved
Doc
umen
t / 0
1/05
/201
2 / 0
8:12
20
More European downstream consolidation to come?
Teesside
Grangemouth(Petrochina)
Stanlow:Essar -> Shell
Milford Haven
WhitegateCoryton
Gothenburg:Shell -> St1
Harburg
Heide:Shell -> Klesch
Wilhelmshaven
Vlissigen (Lukoil)
Gonfreville-l’Orcher
Antwerp: Petroplus -> Vitol; Petroplus GunvorGelsenkirchen (Rosneft)
Dunkirk
Ingolstadt:Petroplus -> Gunvor
Karlsruhe (Rosneft)
Lavera (Petrochina)
Berre-l’Étang
ReichstettPetite-Couronne
Priloi & Melilli (Lukoil)
Milazzo (Kuwait Petroleum)Saras(Rosneft)
Rome
Cremona
CressierPetroplus -> Vitol
Ballshi
Fieri
Szazhalombatta(Surgutneftegaz)
Brod (Zarubezneft)
Novi Sad (Gazprom)
Pancevo (Gazprom)
Gibraltar(IPIC)
Huelva(IPIC)
Capacity
ReductionTerminal
Closure For Sale
Sale
(Part)Owned Russian/Indian/
Chinese/ Middle Eastern
Burgas (Lukoil)
Mantova
• Simply regaining 2006-2008 utilisation rates suggests 1 mb/d more European closures
• …but, changing ownership profile, and refinery specific operating regimes
Uns
aved
Doc
umen
t / 0
1/05
/201
2 / 0
8:12
21
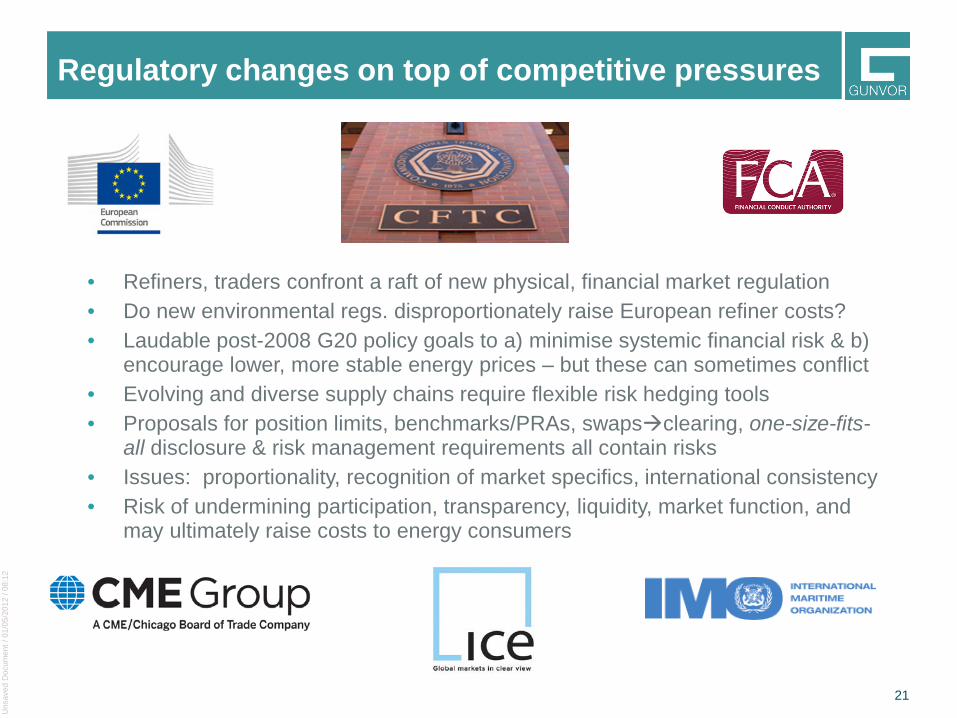
Regulatory changes on top of competitive pressures
• Refiners, traders confront a raft of new physical, financial market regulation • Do new environmental regs. disproportionately raise European refiner costs? • Laudable post-2008 G20 policy goals to a) minimise systemic financial risk & b)
encourage lower, more stable energy prices – but these can sometimes conflict • Evolving and diverse supply chains require flexible risk hedging tools • Proposals for position limits, benchmarks/PRAs, swapsclearing, one-size-fits-
all disclosure & risk management requirements all contain risks • Issues: proportionality, recognition of market specifics, international consistency • Risk of undermining participation, transparency, liquidity, market function, and
may ultimately raise costs to energy consumers

Uns
aved
Doc
umen
t / 0
1/05
/201
2 / 0
8:12
22
Challenges & opportunities in European distillates
source: Gunvor estimates
-600
-400
-200
0
200
400
600
800
Crude west Crude east Diesel Fuel oil Hydrocracking additions
kb/d
Potential change in Russian export flows 2012-2020
• Will US distillate exports surge to Europe or Latin America/Asia?
• Up to 600 kb/d middle distillate supply from new MEG refineries
• Changing Russian export flows, including 300 kb/d+ diesel, depends on pace of refinery upgrading programme
• But rising demand too: new bunker sulphur regs could add 250-400 kb/d marine diesel demand short/mid term
Rosneft & Petromarkets estimates, 2013

Uns
aved
Doc
umen
t / 0
1/05
/201
2 / 0
8:12
23
Not all bad news in European downstream
• New refining hubs in N.America, Middle East and other producing areas, emergence of India and China as exporters of key products
• Global products trade to grow faster than crude in the next decade, much of it on new routes
• Products tanker order book is rising (86% of new orders in 2013) • Opportunities for the new refiner-traders: Access to flow, diversified
arbitrage opportunities, aggressive crack hedging strategy
Uns
aved
Doc
umen
t / 0
1/05
/201
2 / 0
8:12
24
Summing up
• Oil traders are diversifying across products, geographies and along the value chain
• Libya + Iran, and tight early-year fundamentals, suggest prices range-bound in 2014
• Macro-economic risk shifting to Emerging Markets and might undermine cosy 1 mb/d-plus demand consensus forecasts
• US oil picture transformed, but supply growth could now slow • Growth in Iraqi supply may underwhelm vs. ambitious plans • Easier mid-term fundamentals on healthy supply, but no price
collapse, unless Saudi Arabia rejects swing supplier role • Competitive pressure for European refiners, - surge of new EM
capacity, regulatory uncertainty & new distillate export hubs • But opportunities too - expanding distillate bunker demand • New refiner-traders target expanding products trade flows,
new arbitrage routes and aggressive hedging strategies