International Journal of Nutrition and Food Sciences 2021; 10(4): 78-85
http://www.sciencepublishinggroup.com/j/ijnfs
doi: 10.11648/j.ijnfs.20211004.11
ISSN: 2327-2694 (Print); ISSN: 2327-2716 (Online)
Textural and Eye Qualities of Injera Prepared from Quality Protein Maize and Teff Blended Flours
Umer Asrat Yasin
Food Science and Nutrition Research Directorate, Melkassa Agricultural Research Center, Ethiopian Institute of Agricultural Research,
Melkassa, Ethiopia
Email address:
To cite this article: Umer Asrat Yasin. Textural and Eye Qualities of Injera Prepared from Quality Protein Maize and Teff Blended Flours. International Journal
of Nutrition and Food Sciences. Vol. 10, No. 4, 2021, pp. 78-85. doi: 10.11648/j.ijnfs.20211004.11
Received: May 18, 2021; Accepted: July 5, 2021; Published: July 13, 2021
Abstract: Injera is fermented, leavened, flat and round pancake-like Ethiopian traditional bread, and made from cereals like teff,
wheat, barley, sorghum, maize or a combination of some of these cereals. This study was conducted to investigate the effect of
blending ratio and fermentation times on the textural and eye /hole/ characteristics of injera prepared from quality protein maize
(QPM) and teff composite flours. Factorial design of two factors in CRD arrangement was used. The factors were blending ratio
of teff flour (20%, 30%, and 40%) and fermentation times (48hr, 60hr, and 72hr). The sensory acceptability scores for eye-size,
texture, and rollability were ranged from 5.08 to 5.50, 5.01 to 5.76, and 4.61 to 5.69 due to blending ratio, respectively and from
5.18 to 5.41, 5.28 to 5.48, and 5.08 to 5.29 due to fermentation times, respectively tested for fresh injera. The peak force, which
indicate the firmness level of injera samples also varied significantly (p<0.05) and the values ranged between 2.23 to 3.13 N (first
day) due to blending ratio and from 2.59 to 2.69 N (first day) due to fermentation times. Increasing the blending proportions of
teff flour in the composite was found improving the texture, firmness, and eye qualities of QPM-teff composite injera samples.
Keywords: Quality Protein Maize, Teff, Injera, Texture, Firmness
1. Introduction
Native to Ethiopia and Eritrea, injera is a traditional
sourdough flatbread with teff as a major ingredient [7].
However, depending on the agroecology of the area concerned
different cereals (sorghum, wheat, finger millet, maize, and
barley) and their blends are used to make injera [11, 5]. A
good injera is soft, fluffy, and able to be rolled without
cracking. It should retain these textural properties after 2 to 3
days of storage. Injera made from teff is most preferred due to
its softer texture, preferred taste, its color and can be rolled
without cracking. The front side of a good quality injera has
uniformly spaced honeycomb-like pores traditionally called
"eyes", formed due to the penetration of escaping gas that is
produced during fermentation and baking, whereas the bottom
surface of injera is smooth and shiny [10].
Injera prepared from quality protein maize are only
preferred in their fresh state and softness does not last as long
as teff injera. Upon storage, it firms rapidly and becomes
friable. Because of this, the use of quality protein maize for
injera making received little attention [13]. Quality protein
maize (QPM) is nutritionally enhanced maize developed
through conventional breeding method. It contains nearly
twice the quantity of lysine (>4.0%) and tryptophan (>0.8%)
present in the conventional maize [6, 8, 12]. Increasing the
consumption of food products prepared from QPM is the
ideal solution to problems related to malnutrition [13].
Therefore, the study planned to improve textural, rollability,
and firmness qualities of injera prepared from quality protein
maize flour through compositing with teff flour and
identifying the fermentation time required to maximize the
utilization of QPM by the consumers in the country.
2. Materials and Methods
2.1. Flour Preparations
Quality protein maize (Melkassa-6Q) and teff (Magna)
grains were collected from Melkassa Agricultural Research
Center and Debre Zeit Agricultural Research Center of
Ethiopian Institute of Agricultural Research, respectively.
The grains were sorted and cleaned, and separately milled

79 Umer Asrat Yasin: Textural and Eye Qualities of Injera Prepared from Quality Protein
Maize and Teff Blended Flours
(UDY3010-019, USA) to a sieve size of 0.50 mm [13].
2.2. Injera Making
About 200 g of flour was mixed with 180 ml of water and
kneaded for 2 mins. Then, 10 ml of (5% on flour weight basis)
pre-prepared starter yeast (irsho) was poured on the dough
and left to ferment for 48, 60, and 72 hrs at room temperature.
After the primary fermentation, about 10% of the fermented
dough was taken and mixed with three parts of boiling water
and then mixed thoroughly for 1 min (absit). The mixture
was left at room temperature until the temperature dropped
and then, the mixture was added back on the fermenting
dough and mixed well. To this, 100 ml of water was added
and the mixture was let to ferment for about 3 – 4 hrs at room
temperature until a foamy slurry was formed. Then, the slurry
was poured on an electric clay stove in circular motions and
covered to cook for 2 mins [14].
2.3. Sensory Evaluation
Sensory evaluation of injera samples were carried out by 30
panelists composed of male and female. The evaluation was
carried out for freshly baked injera, on the second and third days,
respectively. The panelists were requested to test the injera
samples in terms of eye-size, texture, and rollability using seven-
point hedonic scale (1=dislike extremely, 2=dislike moderately,
3=dislike slightly, 4=neither like nor dislike, 5=like slightly,
6=like moderately, and 7=like extremely) [16].
2.4. Firmness Test
The firmness of the injera samples were measured following
the procedure described by Senayit et al. with slight
modification [10]. The peak force was determined using texture
analyzer (TA.XT plus, Stable Micro Systems, Godalming, UK)
in a compression mode with a sharp blade cutting probe and TA-
90 heavy duty platform. The settings were: pre-test speed~4.0
mm/s, test speed~2.0 mm/s, post-test speed~5 mm/s,
distance~3.5 mm, load cell~5 kg, and operating software
(Exponent, version 5.1.10). The firmness was measured for
freshly baked injera, on the second and third days, respectively.
2.5. Determination of Number of Eyes and Color
The number of eyes on the surface of injera and color
(surface and hole) were determined using software (Injera-
Eyes, version 1.0.0.0). Photo images were taken for each
injera samples using digital color camera form similar height
and with uniform light intensity. Then, to fit the software, the
image of injera samples were cropped into 1550 pixels by
1550 pixels (width by height) [1, 13].
2.6. Experimental Design and Analysis
The experiment was carried out in triplicates for all the
measured parameters. A factorial design of two factors in
completely randomized design arrangement was used. The
factors were blending ratio of teff flour (20, 30, and 40%)
and fermentation time (48, 60, and 72 hrs). The experimental
data was statistically analyzed using SAS software (version
9.4) following PROC ANOVA procedure. Means were
separated by Fisher’s least significant difference (LSD) test
at p<0.05 level of significance. The results were expressed as
mean ± standard deviation.
3. Results and Discussions
3.1. Eye-Size and Textural Qualities of QPM-teff Blended
Injera
The results for eye-size, texture, and rollability scores of
QPM-teff composite injera samples are presented in Table 1.
The mean scores for eye-size ranged from 5.08 – 5.50, and
blending ratio had significant effect (p<0.05). The eye-size
of injera prepared from composite flour ratio of 60% QPM
and 40% teff obtained the highest score and injera prepared
from QPM (100%) flour obtained the lowest score.
Fermentation times also had significant effect (p<0.05) on
the eye-size and the mean scores ranged from 5.18 – 5.41.
The number of eyes and the distribution on the surface of
injera is a good indicator of injera quality. Ideally, eyes
should neither be too few nor too numerous, they must be
rather deep, interlocked with thin cross walls between them
and be evenly distributed [11]. Table 1. Eye-size and textural qualities of QPM-teff blended injera.
Blending ratio (%) Eye-size First day Second day Third day
Texture Rollability Texture Rollability Texture Rollability
100: 0 5.08±0.86c 5.01±0.86d 4.61±1.17d 4.53±0.93d 4.59±1.13d 4.34±0.81d 4.27±1.04c
80: 20 5.20±0.94bc 5.24±0.64c 4.94±0.81c 4.94±0.81c 4.88±0.95c 4.79±0.94c 4.62±1.01b
70: 30 5.37±0.77ab 5.46±0.71b 5.42±0.76b 5.38±0.71b 5.30±0.76b 5.17±0.86b 4.81±0.98ab
60: 40 5.50±0.78a 5.76±0.72a 5.69±0.71a 5.58±0.78a 5.57±0.78a 5.40±0.91a 4.97±1.12a
CV (%) 15.00 12.80 15.11 13.06 15.88 15.42 20.30
LSD 0.23 0.20 0.23 0.20 0.24 0.22 0.28
Fermentation time (hrs) Eye-size First day Second day Third day
Texture Rollability Texture Rollability Texture Rollability
48 5.27±0.76ab 5.28±0.76b 5.08±0.82b 5.00±0.82b 5.02±0.87a 4.73±0.98b 4.53±1.01b
60 5.41±0.88a 5.35±0.82ab 5.16±1.14ab 5.08±0.94ab 5.06±1.10a 5.00±0.90a 4.64±1.17ab
72 5.18±0.90b 5.48±0.77a 5.29±0.92a 5.24±0.93a 5.18±0.98a 5.06±0.99a 4.83±1.00a
CV (%) 15.00 12.80 15.11 13.06 15.88 15.42 20.30
LSD 0.20 0.17 0.20 0.17 0.21 0.19 0.24
Data: mean ± SD, means with the same letter in the column are not significantly different, QPM flour= 60, 70, and 80%, teff flour= 20, 30, and 40%.

International Journal of Nutrition and Food Sciences 2021; 10(4): 78-85 80
The texture acceptability of injera samples were
significantly influenced (p<0.05) by blending ratio and
fermentation times. The scores ranged between 5.01 to 5.76,
4.53 to 5.58, and 4.34 to 5.40 due to blending ratio and
ranged between 5.28 – 5.48, 5.00 – 5.24, and 4.73 – 5.06 due
to fermentation times for the first, second, and third days,
respectively. Injera samples prepared from QPM (100%)
flour and QPM-teff composite flour (80: 20) were rated
below 5 in the second and third days, and the response
indicated lower degree of liking compared to injera samples
having 30 and 40% teff flour. Textural properties are key
drivers in food acceptability. Previous work of Senayit et al.
reported that teff injera is relatively soft compared to
sorghum injera [10]. The work of Zewdu et al. also reported
that an increasing trend of liking the texture of teff-rice-
maize composite injera when the proportion of teff and rice
are increased, and texture score decreased when the
proportion of maize is increased [16]. The relative softness of
teff injera could be related to starch granule size. Teff starch
have smaller granule size (2 – 6µm) compared with maize
(20µm) and sorghum (20µm) starch granule sizes [2].
The rollability of injera samples significantly influenced
(p<0.05) by blending ratio of teff flour and fermentation
times. The mean scores varied from 4.61 to 5.69, 4.59 to 5.57,
and 4.27 to 4.97 due to blending ratio for the first, second
and third days, respectively. Only injera samples prepared
from QPM-teff composite flour ratio of 70: 30 and 60: 40
(QPM: teff) were liked in the first and second days and the
other injera samples were rated below 5, and they were not
liked by the panelists.
3.2. Effect of Blending Ratio and Fermentation Time on
Firmness of QPM-teff Blended Injera
Table 2 indicates the firmness of QPM-teff composite
injera samples tested in the first, second and third days.
Blending ratio significantly affected (p<0.05) the firmness of
the samples and the values ranged from 2.23 to 3.13 N. The
highest peak force was recorded for QPM (100%) injera and
the lowest peak force was recorded for QPM-teff composite
injera (60: 40). As the fermentation time varied from 48 to 60,
and 72 hrs, maximum force values of 2.69, 2.65, and 2.59 N
were also recorded, respectively. Peak force values ranged
from 2.35 to 3.24 N, and 2.46 – 3.37 N were also recorded in
the second and third days due to blending ratio. The values
were greater than the peak force required for cutting teff
injera (2.01, 2.12, and 2.23 N). From the result it was
observed that, as the level of teff flour increased in the
composite, the force required for cutting (injera) decreased.
It has been reported that the hardness that develops in starch-
based products during storage is due to the retrogradation of
starch molecules [3]. Onyango et al. reported that, bread
prepared from wheat-maize composite flour having higher
proportion of maize flour required the maximum force of
cutting [9]. The authors recorded the peak force values of
1.27, 1.52, 2.68, and 7.62 N for bread samples prepared from
the wheat-maize composite flour ratio of 100: 0, 90: 10, 80:
20, and 70: 30, respectively.
Table 2. Effect of blending ratio and fermentation time on firmness of QPM-
teff blended injera.
Blending ratio
(%) First day (N) Second day (N) Third day (N)
100: 0 3.13±0.04a 3.24±0.08a 3.37±0.08a
80: 20 2.70±0.07b 2.81±0.07b 2.97±0.09b
70: 30 2.49±0.09c 2.60±0.11c 2.73±0.09c
60: 40 2.23±0.13d 2.35±0.08d 2.46±0.10d
CV (%) 1.99 1.52 1.61
LSD 0.05 0.04 0.05
Fermentation
time (hrs) First day Second day Third day
48 2.69±0.35a 2.82±0.35a 2.94±0.35a
60 2.65±0.36a 2.73±0.34b 2.88±0.36b
72 2.59±0.35b 2.70±0.34b 2.82±0.36c
CV (%) 1.99 1.52 1.61
LSD 0.04 0.04 0.04
Teff injera 2.01±0.07 2.12±0.08 2.25±0.07
Data: mean ± SD, means with the same letter in the column are not
significantly different, QPM flour= 60, 70, and 80%, teff flour= 20, 30, and
40%, N=Newton.
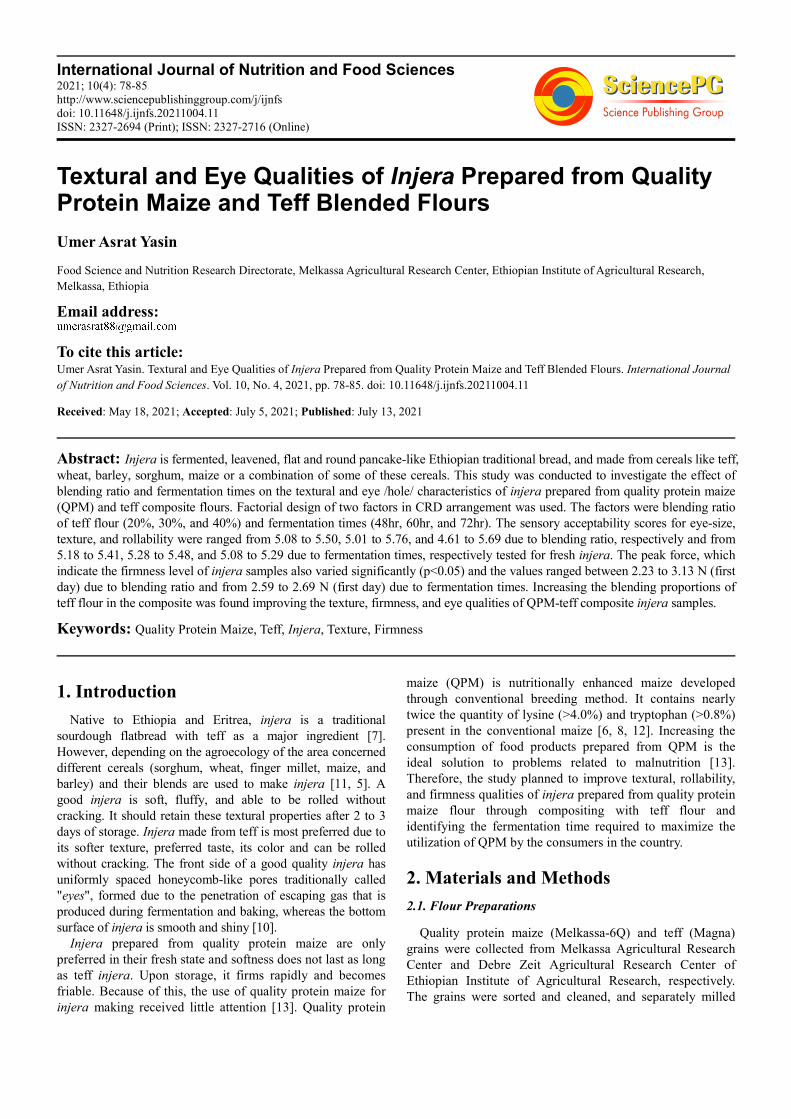
3.3. Interaction Effects of Blending Ratio and Fermentation
Time on Firmness of QPM-teff Blended Injera
Table 3 shows the interaction effects of blending ratio and
fermentation time on the firmness of QPM-teff composite
injera. The highest values (3.16, 3.31, and 3.42 N) were
recorded for injera sample prepared from QPM (100%) flour
and the lowest values (2.19, 2.30, and 2.41 N) were recorded
for injera sample prepared from QPM-teff composite flour
(60: 40). Texture analysis is primarily concerned with the
evaluation of mechanical characteristics where a material is
subjected to controlled force from which deformation curve
of its response is generated [9].
3.4. Effect of Blending Ratio and Fermentation Time on the
Number of Eyes and Color of QPM-teff Blended Injera
The number of eyes and color of QPM-teff composite
injera samples are presented in Table 4. Blending ratio had
significant effect (p<0.05) on the number of eyes and the
values ranged from 3618.22 to 6847.89. The highest value
was recorded for injera sample prepared from QPM-teff
composite flour having 30% teff, followed by 20% teff and
the lowest value was recorded for injera sample prepared
from QPM (100%) flour. Fermentation time also had
significant (p<0.05) effect on the number of eyes and values
of 5310.42, 5412.17, and 6542.92 were recorded from injera
samples fermented for 48, 60 and 72 hrs, respectively. The
number, size and distribution of holes; commonly called eyes
on the injera surface represent one of the most important
qualities attributes of injera [11]. Hayelom reported the
number of eyes of teff injera ranged from 17764.50 to
19609.20 (area not specified) for injera samples prepared
from different teff varieties [4]. Yoseph also reported the
number of eyes of teff injera varied from 224 to 298
81 Umer Asrat Yasin: Textural and Eye Qualities of Injera Prepared from Quality Protein
Maize and Teff Blended Flours
(unspecified area) for injera samples prepared from teff flour
milled by different millers [15].
Blending ratio and fermentation time had significant effect
(p<0.05) on the color of injera samples. The lightness (L*)
values ranged from 64.66 to 70.32. Injera samples prepared
from QPM (100%) and QPM-teff composite flour (80: 20)
obtained the highest L* value and had no significant difference
(p>0.05). The lowest L* value was recorded from injera
sample prepared from 60% QPM and 40% teff composite flour.
The work of Zewdu et al. also reported that, the L* value of
teff injera (54.65) was lower than the L* value of injera (63.17)
prepared from teff-maize-rice composite (70: 0: 30) flour [16].
The redness (a*) values of QPM-teff composite injera were
varied from 0.92 – 3.81, and 2.18 – 2.61 due to blending ratio
and fermentation time, and significant differences (p<0.05)
were noted. Higher a* value was recorded for injera sample
prepared from QPM-teff composite flour having 40% teff and
lower value was recorded for injera sample prepared from
QPM (100%) flour. Injera sample fermented for 48 hrs
showed the highest a* value whereas those fermented for 72
hrs showed the lowest a* value.
The yellowness (b*) values of QPM-teff composite injera
varied significantly (p<0.05) from 5.06 to 13.24 due to
blending ratio, and from 9.18 to 11.00 due to fermentation time.
As the blending ratio of teff flour increased (20, 30, and 40%)
in the composite, b* values were found increase in parallel, in
contrast as the fermentation time (48, 60, and 72 hrs) increased
b* values were found decreasing. Significant differences
(p<0.05) were also observed on the hole color of QPM-teff
composite injera samples due to blending ratio and the values
ranged from 41.53 – 48.01 (L*), 1.52 – 5.44 (a*), and 9.11 –
16.09 (b*). As blending ratio of teff flour increased in the
blends, the lightness of the hole was found decreasing whereas
the redness and yellowness values were found increasing. The
fermentation time also significantly (p<0.05) increased the L*
values from 42.17 to 44.41, but decreased the redness (3.87 –
4.28) and yellowness (13.21 – 14.95) values.
Table 3. Interaction effects of blending ratio and fermentation time on firmness of QPM-teff blended injera.
Blending ratio (%) Fermentation time (hrs) First day (N) Second day (N) Third day (N)
100: 0 48 3.16 ± 0.03a 3.31 ± 0.07a 3.42 ± 0.08a
100: 0 60 3.14 ± 0.03a 3.20 ± 0.07b 3.37 ± 0.10ab
100: 0 72 3.09 ± 0.03a 3.18 ± 0.06b 3.34 ± 0.06c
80: 20 48 2.78 ± 0.05b 2.88 ± 0.01c 3.03 ± 0.07c
80: 20 60 2.71 ± 0.07bc 2.80 ± 0.08d 2.98 ± 0.10c
80: 20 72 2.65 ± 0.04c 2.76 ± 0.06d 2.89 ± 0.05d
70: 30 48 2.53 ± 0.10d 2.66 ± 0.10e 2.80 ± 0.08e
70: 30 60 2.51 ± 0.11de 2.59 ± 0.13ef 2.73 ± 0.09e
70: 30 72 2.43 ± 0.05e 2.56 ± 0.10f 2.64 ± 0.05f
60: 40 48 2.28 ± 0.16f 2.41 ± 0.07g 2.53 ± 0.16g
60: 40 60 2.23 ± 0.14f 2.34 ± 0.08gh 2.45 ± 0.07gh
60: 40 72 2.19 ± 0.12f 2.30 ± 0.08h 2.41 ± 0.03h
CV (%) 1.99 1.52 1.61
LSD 0.09 0.07 0.08
Data: mean ± SD, means with the same letter in the column are not significantly different, QPM flour= 60, 70, and 80%, teff flour= 20, 30, and 40%,
N=Newton.
Table 4. Effect of blending ratio and fermentation time on number of eyes and color of QPM-teff blended injera.
Blending ratio (%) Number of eyes Surface color Hole color
L* a* b* L* a* b*
100: 0 3618.22±538.76d 70.32±0.98a 0.92±0.19d 5.06±0.32d 48.01±0.32a 1.52±0.42c 9.11±0.82b
80: 20 6359.00±604.13b 70.09±0.89a 1.57±0.17c 10.70±0.40c 42.56±0.39b 4.32±0.48b 15.89±0.65a
70: 30 6847.89±632.50a 65.61±0.84b 3.30±0.11b 11.97±0.44b 42.13±0.49b 5.28±0.53a 16.07±0.48a
60: 40 6195.56±595.56c 64.66±0.93c 3.81±0.13a 13.24±0.33a 41.53±0.41c 5.44±0.59a 16.09±0.89a
CV (%) 0.67 0.55 8.26 2.50 1.06 4.79 2.78
LSD 37.52 0.36 0.19 0.25 0.44 0.19 0.39
Fermentation time
(hrs) Number of eyes
Surface color Hole color
L* a* b* L* a* b*
48 5310.42±771.06c 66.91±3.51c 2.61±1.49a 11.00±4.06a 42.17±2.51b 4.28±1.57a 14.95±3.18a
60 5412.17±834.02b 67.63±2.74b 2.41±1.23b 10.55±3.50b 44.10±2.67a 4.27±1.58a 14.69±3.40a
72 6542.92±775.25a 68.45±2.87a 2.18±1.11c 9.18±3.42c 44.41±2.50a 3.87±1.39c 13.21±3.23b
CV (%) 0.67 0.55 8.26 2.50 1.06 4.79 2.78
LSD 32.50 0.31 0.17 0.22 0.38 0.17 0.34
Teff injera 9488.33±109.91 59.41±1.35 0.26±0.08 4.88±0.26 43.12±2.55 0.51±0.27 6.56±0.61
Data: mean ± SD, means with the same letter in the column are not significantly different, QPM flour= 60, 70 and 80%, teff flour= 20, 30 and 40%, L*=
lightness, a*= redness, b*= yellowness.

International Journal of Nutrition and Food Sciences 2021; 10(4): 78-85 82
3.5. Interaction Effects of Blending Ratio and
Fermentation Time on Number of Eyes and Color of
QPM-teff Blended Injera
The interaction effects of blending ratio and fermentation
time on the number of eyes and color of QPM-teff blended
injera are shown in Table 5. The number of eyes of injera
samples ranged from 3103.33 – 7775.67, and significant
differences (p<0.05) were observed. The maximum numbers
of eyes were recorded for injera sample prepared from QPM-
teff composite flour (60: 40) fermented for 72 hrs and the
values were lower than teff injera (9488.33). The minimum
value was recorded for injera sample prepared from QPM
(100%) flour fermented for 72 hrs. As the fermentation time
extended from 48 to 72 hrs for preparing QPM (100%) injera,
the number of eyes was found deceasing. The interaction
effect of blending ratio and fermentation time on the
lightness (surface) of injera was significant (p<0.05) and the
values ranged from 62.64 – 70.38.
Injera prepared from QPM (100%) flour and QPM-teff
composite flour (80: 20) and fermented for 48, 60, and 70 hrs
were statistically similar (p>0.05). Similarly, the redness of
injera samples due to the interactions of blending ratio and
fermentation time was significant (p<0.05) and the values
varied from 0.87 – 4.10. Injera samples prepared from QPM-
teff composite flour having 30 and 40% teff, when fermented
for 48 and 60 hrs compared to 72 hrs showed higher a*
values. The yellowness of injera samples were varied
significantly (p<0.05) from 4.87 to 15.48 due to the
interactions of blending ratio and fermentation time. Injera
samples having 30 and 40% teff flour in the composite and
fermented for 48 and 60 hrs showed higher b* values. The
interaction effect of blending ratio and fermentation time on
the hole color of QPM-teff composite injera was significant
(p<0.05) and the values ranged between 48.22 – 39.37 (L*),
1.01 – 7.25 (a*), and 8.26 – 17.50 (b*).
Table 5. Interaction effects of blending ratio and fermentation time on number of eyes and color of QPM-teff blended injera.
Blending
ratio (%)
Fermentation
time (hrs) Number of eyes
Surface color Hole color
L* a* b* L* a* b*
100: 0 48 4309.33±15.50j 70.25±0.16a 0.95±0.18f 4.87±0.35g 47.79±0.27a 1.01±0.09i 9.86±0.37f
100: 0 60 3442.00±18.89k 70.32±0.16a 0.93±0.18f 5.11±0.28g 48.03±0.33a 1.72±0.30h 9.20±0.71f
100: 0 72 3103.33±14.93l 70.38±0.25a 0.87±0.28f 5.21±0.33g 48.22±0.38a 1.82±0.12h 8.26±0.46g
80: 20 48 5312.67±19.81h 70.09±0.10a 1.47±0.18e 11.03±0.30d 41.57±0.51ef 2.93±0.11g 15.49±0.27c
80: 20 60 6160.67±18.33f 70.08±0.11a 1.61±0.13e 10.70±0.29de 44.25±0.55b 4.79±0.27e 15.47±0.17c
80: 20 72 7603.67±14.84c 70.07±0.13a 1.63±0.22e 10.36±0.34ef 41.87±0.81e 5.25±0.16cd 16.70±0.44b
70: 30 48 6391.33±19.74e 64.65±0.33d 3.93±0.22ab 12.60±0.10c 39.96±0.62g 5.94±0.17b 16.98±0.45ab
70: 30 60 6463.33±15.10d 65.69±0.29c 3.40±0.16c 12.41±0.34c 43.05±0.38d 5.11±0.12de 16.97±0.35ab
70: 30 72 7689.00±19.12b 66.48±0.36b 2.57±0.17d 10.89±0.21d 43.40±0.40cd 4.78±0.10e 14.28±0.22d
60: 40 48 5228.33±12.37i 62.64±0.19e 4.10±0.21a 15.48±0.10a 39.37±0.36g 7.25±0.18a 17.50±0.47a
60: 40 60 5582.67±10.46g 64.43±0.09d 3.69±0.34bc 13.97±0.26b 41.09±0.25f 5.47±0.19c 17.13±0.28ab
60: 40 72 7775.67±18.18a 66.92±0.08b 3.65±0.20bc 10.26±0.12f 44.13±0.43bc 3.61±0.16f 13.61±0.40e
CV (%) 0.67 0.55 8.26 2.50 1.04 4.79 2.78
LSD 64.99 0.62 0.34 0.43 0.76 0.34 0.67
Data: mean ± SD, means with the same letter in the column are not significantly different, QPM flour= 60, 70 and 80%, teff flour= 20, 30 and 40%, L*=
lightness, a*= redness, b*= yellowness.
Figure 1. Firmness graph of QPM-teff composite injera samples fermented for 48 hr.

83 Umer Asrat Yasin: Textural and Eye Qualities of Injera Prepared from Quality Protein
Maize and Teff Blended Flours
Figure 2. Firmness graph of QPM-teff composite injera samples fermented for 60 hr.
Figure 3. Firmness graph of QPM-teff composite injera samples fermented for 72 hr.
Figure 4. Firmness graph of teff injera samples.
International Journal of Nutrition and Food Sciences 2021; 10(4): 78-85 84
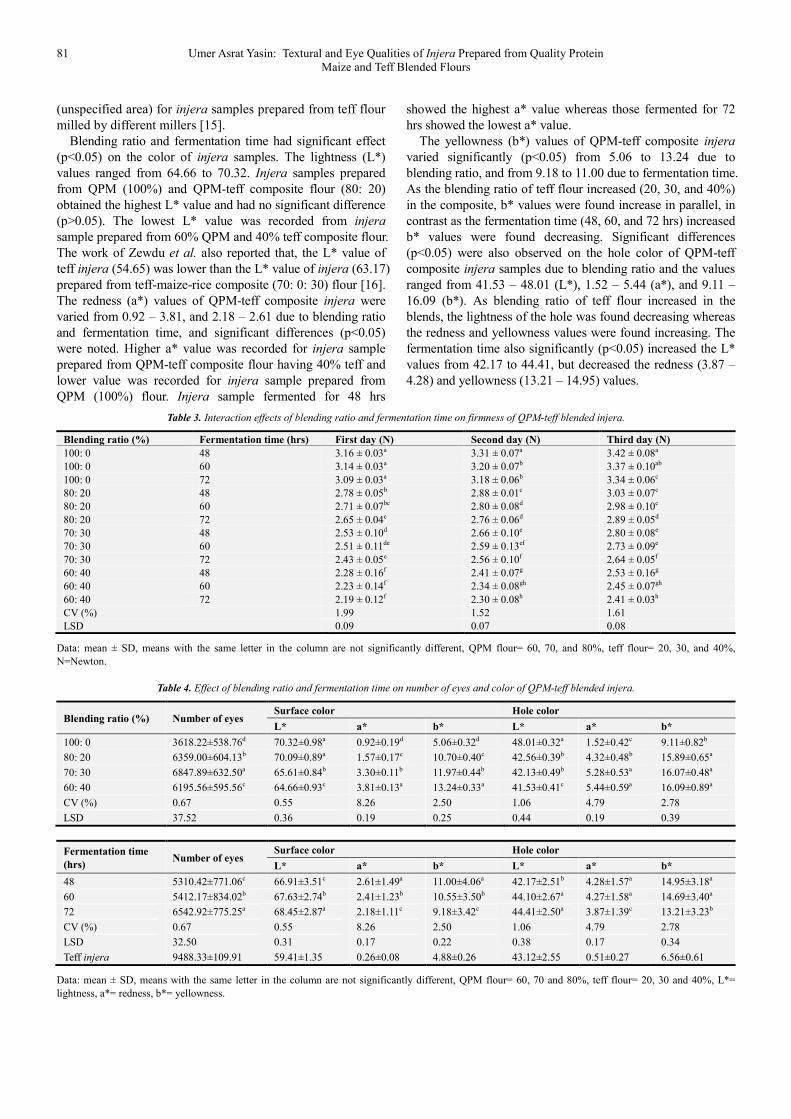
Figure 5. QPM-teff blended injera samples.
4. Conclusions
Quality protein maize is nutritionally enhanced variants of
maize, and preparing injera from QPM has considerable
advantages both nutritionally and economically over teff.
However, injera prepared from QPM are only preferred in
their fresh state and softness does not last as long as teff
injera. Fermentation time is important factor that affects the
eye qualities and distributions of injera. The study showed
that, blending ratio of teff flour and fermentation times had
significant effect (p<0.05) on the eye-size, texture, rollability,
firmness, number of eyes and color (surface and hole) of
injera. As the blending proportion of teff flour increased,
better preference was observed for texture and rollability.
Lower stalling and firmness were also observed with
increasing in teff proportions.
Acknowledgements
The author is thankful to Mr. Mulate Zerihun (Food
Science Laboratory, Melkassa Agricultural Research Center)
and the staff of Melkassa Agricultural Research Center for
their helpful contribution on the sensory work.
References
[1] Attuquayefio, W. D. (2014). Influence of processing parameters on eye size and elasticity of teff-based injera. Master’s thesis: Pennsylvania State University.
[2] Bultosa, G., Hall, A. N., and Taylor, J. R. (2002). Physicochemical characterization of grain teff [Eragrostis teff (Zucc.) Trotter] starch. Starch/Stärke, 54 (10): 461–468.
[3] Goesaert, H., Brijs, K., Veraverbeke, W., Courtin, C., Gebruers, K., and Delcour, J. (2005). Wheat flour constituents: how they impact bread quality and how to impact their functionality. Trends in Food Science and Technology, 16 (1-
3): 12–30.
[4] Hayelom, B. (2018). Influence of nitrogen fertilizer rates and varieties on grain yield, grain nutrition and injera sensory quality of teff [Eragrostis teff (Zucc.) Trotter] varieties. Master’s thesis: Addis Ababa University.
[5] Kaleab, B., Claire, M. R., Christèle, I. V., Isabelle, R., and Jean-Pierre, G. (2013). Influence of flour blend composition on fermentation kinetics and phytate hydrolysis of sourdough used to make injera. Food Chemistry, 138: 430–436.
[6] Krivanek, A. F., De Groote, H., Gunaratna, N. S., Diallo, A. O., and Friesen, D. (2007). Breeding and disseminating quality protein maize (QPM) for Africa. Afr. J. Biotech., 6: 312–324.
[7] Mekonnen, M., Zarnkow, M., and Becker, T. (2014). Teff [Eragrostis teff (Zucc.) Trotter] as a raw material for malting, brewing and manufacturing of gluten-free foods and beverages: A review. J. Food Sci. Technol., 51 (11): 2881–2895.
[8] Nuss, E. T., and Tanumihardjo, S. A. (2011). Quality Protein Maize for Africa: closing the protein inadequacy gap in vulnerable populations. Advances in Nutrition, 2: 217–222.
[9] Onyango, C., Unbehend, L., Unbehend, G., and Lindhauer, M. G. (2015). Rheological properties of wheat-maize dough and their relationship with the quality of bread treated with ascorbic acid and malzperle classic bread improver. African Journal of Food Science, 9 (2): 84–91.
[10] Senayit, Y., de Kock, H. L., Rooney, L. W., and Taylor, J. R. (2004). Effects of sorghum cultivar on injera quality. Cereal Chemistry, 81 (3): 314–321.
[11] Senayit, Y., Rooney, L. W., and Taylor, J. R. (2005). Improving the quality of sorghum injera by decortication and composting with teff. Journal of the Science of Food and Agriculture, 85: 1252–1258.
[12] Sofi, P. A., Wani, S. A., Rather, A. G., and Wani, S. H. (2009). Quality protein maize (QPM): Genetic manipulation for the nutritional fortification of maize. Journal of Plant Breeding and Crop Science, 1: 244–253.

85 Umer Asrat Yasin: Textural and Eye Qualities of Injera Prepared from Quality Protein
Maize and Teff Blended Flours
[13] Umer, A. (2019). Effect of blending ratio and natural fermentation time on the qualities of injera prepared from quality protein maize and teff flours. Master’s thesis: Haramaya University.
[14] Weerasooriya, D. K., Bean, S. R., Yohannes, N., Ioerger, B. P., and Tesfaye, T. (2018). The effect of genotype and traditional food processing methods on invitro protein digestibility and micronutrient profile of sorghum cooked products. PLoS ONE, 13 (9), doi.org/10.1371/journa.pone.0203005.
[15] Yoseph, L. (2019). Process optimization and quality characterization of teff flour for the industrial manufacturing of injera. Doctoral thesis: Addis Ababa University.
[16] Zewdu, C., Gregory, R. Z., Habtamu, F., and Ashagrie, Z. (2018). Optimization and modeling of teff-maize-rice based formulation by simplex lattice mixture design for the preparation of brighter and acceptable injera. Cogent Food and Agriculture, 4: 1443381.


