
The basic reproductive ratio
• One of the fundamental concepts in mathematical biology
• Defined as “the average number of secondary infections caused by a single infectious individual during their entire infectious lifetime.”

R0
Average number
of secondary
infections
Individual
parameter
Anderson
& May
Threshold
Population
parameter
Calculate
equilibria
Jacobian
Evaluate at the
disease-free
equilibrium
Eigenvalues
All eigenvalues
< 0 ! stable
Any eigenvalue
> 0 ! unstable
Largest eigenvalue
derives an R0
Use endemic
equilibrium to
derive an R0
(Appendix B)
(Appendix C)
Vectorial
capacity
Lab
Next
generation
Compare with
Jacobian
Endemic
equilibrium
Other
methods
Next
generation
Survivor
function
Average age
at infection
Final size
Intrinsic
growth rate
25
A brief history of R0
• Originally developed for demographics (1886)• Independently studied for malaria (1911,1927)• Now widely used for infectious disease (1975+)
“One of the foremost and most valuable ideas that mathematical thinking has brought to epidemic theory”(Heesterbeek & Dietz, 1996).
Definition of R0
• Expected number of secondary individuals produced by an individual in its lifetime
• However, “secondary” depends on context:- mean lifetime reproductive success
(demographics and ecology)- number of individuals infected within a single
infected individual’s entire infectious lifetime (epidemiology)
- number of newly infected cells produced by a single infected cell (in-host dynamics).

A threshold criterion
• If R0<1, each individual produces, on average, less than one new infected individual......and hence the disease dies out
• If R0>1, each individual produces more than one new infected individual......and hence the disease is able to invade the susceptible population
• This allows us to determine the effectiveness of control measures.
R0 is a threshold
• Predicts whether a disease will become endemic or die out
• If R0>1, then each individual is causing more than one infection, so the disease will take hold
• If R0<1, then the disease will die out• This threshold is where R0 is most useful.
R0 = basic reproductive ratio

• R0 is rarely measured in the field• R0 is an individual parameter• Most models (eg ODEs) deal with
populations• Matching the two ⇒ lots of thresholds, not
necessarily the true R0.
R0 vs. ODES
Problems with R0

Surrogate thresholds
• These surrogate, R0-like thresholds will also tell us whether a disease will become endemic or die out
• They may be easier to calculate than the true R0
But… • We can’t compare different diseases.
R0 = basic reproductive ratio

We can't compare diseases
• Suppose– HIV has an R0 of 3
– SARS has an R0 of 5
• Unless they were calculated using the same method, we don't know if SARS is worse than HIV
• All we know is that both will persist • This is because R0 is a distance measure
and is thus dependent on the metric used.R0 = basic reproductive ratio

Anderson & May
R0 = β c D, where• β = transmission probability• c = number of contacts• D = average time spent infectious
(= 1/b if the infection rate is b)This is the method most commonly used by biologists (not always correctly).
Note: This formula only applies if there is no background death rate
R0 = basic reproductive ratio

The Jacobian
The Jacobian is• A matrix of partial derivatives• Created by differentiating every equation
with respect to every variable• If there are 6 equations and 6 variables,
you'll have a 6 × 6 matrix
This is one of the most useful tools in mathematical biology.

A method for determining stability
1. Calculate the disease-free equilibrium2. Create the Jacobian matrix3. Evaluate the Jacobian at the equilibrium4. Find the eigenvalues5. If all eigenvalues < 0 ⇒ stable If even one eigenvalue > 0 ⇒ unstable6. Largest eigenvalue ⇒ R0-like threshold.
R0 = basic reproductive ratio

The SIS Jacobian
S = Susceptible I = Infecteda = infection rate b = recovery rate

The SIS eigenvalues
• The disease-free equilibrium is (S,I)=(N,0)
• The eigenvalues are
S = Susceptible I = InfectedN = total pop. J = Jacobianb = recovery rate a = infection rate
. (See notes: Eigenvalues)

Stability from largest eigenvalue
The non-constant eigenvalue is aN-b• aN-b < 0 ⇒ equilibrium is stable• aN-b > 0 ⇒ equilibrium is unstable.
N = total pop.a = infection rate b = recovery rate

Defining an R0-like threshold
Stability if
∴ DefineN = total pop.a = infection rate b = recovery rate
.

R0SIS is a threshold, not R0
• If R0SIS < 1, we have stability of the DFE
and hence the disease dies out• If R0
SIS > 1, we have instability of the DFE and hence the disease persists
• But why isn't this R0?
R0SIS = SIS model threshold
R0 = basic reproductive ratioDFE = Disease-free equilibrium

Answer
1. It isn't unique:• (R0
SIS)2 < 1 ⇒ disease dies out• (R0
SIS)2 > 1 ⇒ disease persists2. There's no reason the largest eigenvalue
would inexorably lead to the average number of secondary infections.
R0SIS = SIS model threshold
(See notes: R0 sleight of hand)

What does this mean?
• R0 is not well defined for ODEs• But if all we want is a threshold, then this
is acceptable• We have lots of methods of calculating R0-like thresholds.
R0 = basic reproductive ratio

R0
Average number
of secondary
infections
Individual
parameter
Anderson
& May
Threshold
Population
parameter
Calculate
equilibria
Jacobian
Evaluate at the
disease-free
equilibrium
Eigenvalues
All eigenvalues
< 0 ! stable
Any eigenvalue
> 0 ! unstable
Largest eigenvalue
derives an R0
Use endemic
equilibrium to
derive an R0
(Appendix B)
(Appendix C)
Vectorial
capacity
Lab
Next
generation
Compare with
Jacobian
Endemic
equilibrium
Other
methods
Next
generation
Survivor
function
Average age
at infection
Final size
Intrinsic
growth rate
25

SIS endemic equilibrium
• The endemic equilibrium for the SIS model is (b/a,N-b/a)
• This only exists if N-b/a > 0 N > b/a aN/b >1• ∴ Define R0
end = aN/b as before (since if
R0end > 1, the disease persists).
N = total pop.a = infection rate b = recovery rate

The SIR Jacobian
S = Susceptible I = InfectedR = Recovered J = Jacobianπ = birth rate a = infection rateb = recovery rate µ = death rate
.

Jacobian at the DFE
J = Jacobian DFE = Disease-free equilibriumπ = birth rate a = infection rateb = recovery rate µ = death rate

Calculating eigenvalues
J = Jacobian I = identity matrixπ = birth rate a = infection rateb = recovery rate µ = death rate
(See notes: Eigenvalues)

A 3×3 matrix has 3 eigenvalues
• The eigenvalues are thus
• Rearrange the largest eigenvalue to find
π = birth rate a = infection rateb = recovery rate µ = death rate

SIR endemic equilibrium
• The endemic equilibrium for the SIR model is
• The disease persists when Ī > 0.
S = Susceptible I = Infected R = Recoveredπ = birth rate a = infection rateb = recovery rate µ = death rate

• Ī > 0:
Endemic equilibrium > 0 R0end>1
Note: In general, these two methods produce different R0s.
I = Infected R0end = endemic threshold
π = birth rate a = infection rateb = recovery rate µ = death rate
Usefulness of the Jacobian
• The Jacobian can determine stability of equilibria
• It can also lead us to R0-like thresholds• These determine whether an epidemic will
persist or die out.

R0
Average number
of secondary
infections
Individual
parameter
Anderson
& May
Threshold
Population
parameter
Calculate
equilibria
Jacobian
Evaluate at the
disease-free
equilibrium
Eigenvalues
All eigenvalues
< 0 ! stable
Any eigenvalue
> 0 ! unstable
Largest eigenvalue
derives an R0
Use endemic
equilibrium to
derive an R0
(Appendix B)
(Appendix C)
Vectorial
capacity
Lab
Next
generation
Compare with
Jacobian
Endemic
equilibrium
Other
methods
Next
generation
Survivor
function
Average age
at infection
Final size
Intrinsic
growth rate
25

Other methods
• There are many other methods used to calculate R0
• Few of them agree with each other• Even fewer calculate the true R0.

Survival function
where • b(a) is the average number of newly infected
individuals an infectious individual produces per unit time when infected for total time a
• F(a) is the probability that a newly infected individual remains infectious for at least time a.
R0 =! !
0b(a)F (a)da

Infection cycle
Eg malaria:
• b(a) = average number of humans newly infected by a mosquito which has been infected for time a
• This yields the total number of humans produced by one infected human.
• F (a) =! a
0prob(human infected at time 0 exists at time t)
!prob(human infected for tot. time t infects mosquito)!prob(infected mosquito lives to be age a" t)dt

The “gold standard” of R0
• Takes into account the complete cycle• Not restricted to ODEs• But can get cumbersome for multiple states
(eg schistosomiasis)Recent uses: Scrapie in Cyprus (Gravenor et al., 2004),
Dengue in Brazil (Luz et al., 2003).

• A general method for deriving R0 when the population is divided into discrete, disjoint cases
• Can be used for models with underlying age structure or spatial structure.
The next-generation method

Calculating the next generation R0
Let• Fi be the rate of appearance of new infections
in compartment i• Vi be the transfer of individuals out of
compartment i by all other means• x0 be the disease-free equilibrium• R0 is the largest eigenvalue of
!!Fi(x0)
!xj
"·!!Vi(x0)
!xj
"!1
.
Matrix of partial derivatives
Matrix of partial derivatives.

A malaria model
H !S = !! !MHMIHS ! µHHS
H !I = !MHMIHS ! (µH + " + #)HI
HR = #HI ! µHHR
M !S = "! !MHMSHI ! µMMS
MI = !HMMSHI ! µMMI
HS HI HR
MI MS
βMH βHM
βMH
βHM
σ
Λ
Π
Infected humans
Infected mosquitos.
α
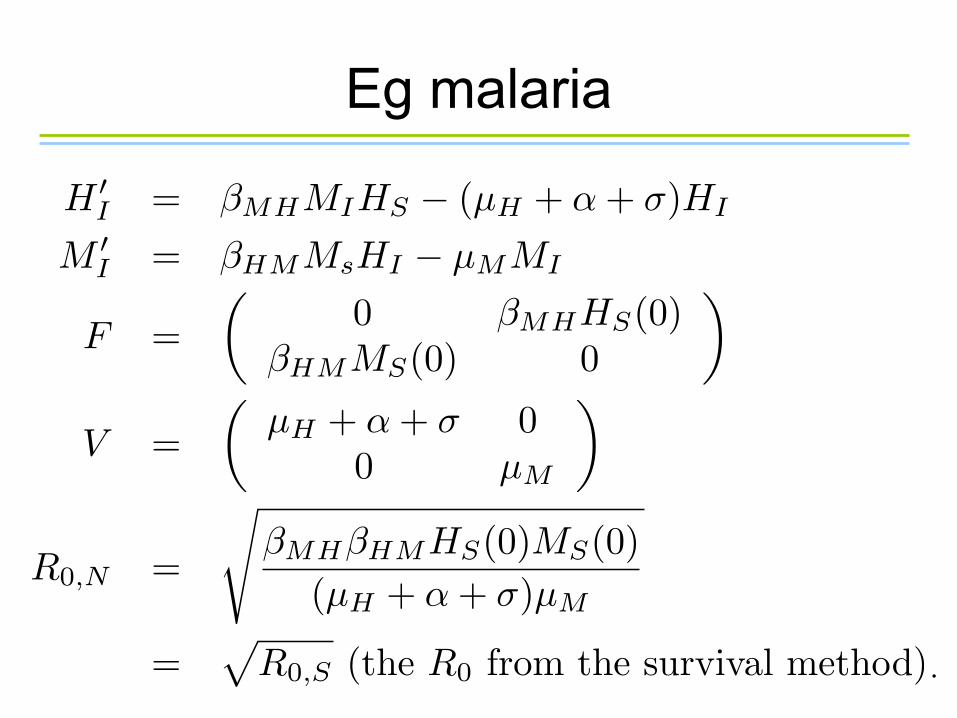
Eg malaria
H !I = !MHMIHS ! (µH + " + #)HI
M !I = !HMMsHI ! µMMI
F =!
0 !MHHS(0)!HMMS(0) 0
"
V =!
µH + " + # 00 µM
"
R0,N =
#!MH!HMHS(0)MS(0)
(µH + " + #)µM
=$
R0,S (the R0 from the survival method).

Difference: definition of a “generation”
• Survival method: the number of infected humans produced by a single infected human
• Next-generation: the number of infected mosquitos produced by a single human
Recent uses: West Nile virus (Wonham et al., 2004),Mad cow (de Koeijer et al., 2003).

Threshold criterion
• The true R0 is clearly a threshold• Other expressions are also thresholds• eg (R0)k for k > 0• However, these thresholds are not
necessarily the average number of secondary infections
Q. Does this matter?
Does the emperor have no clothes?
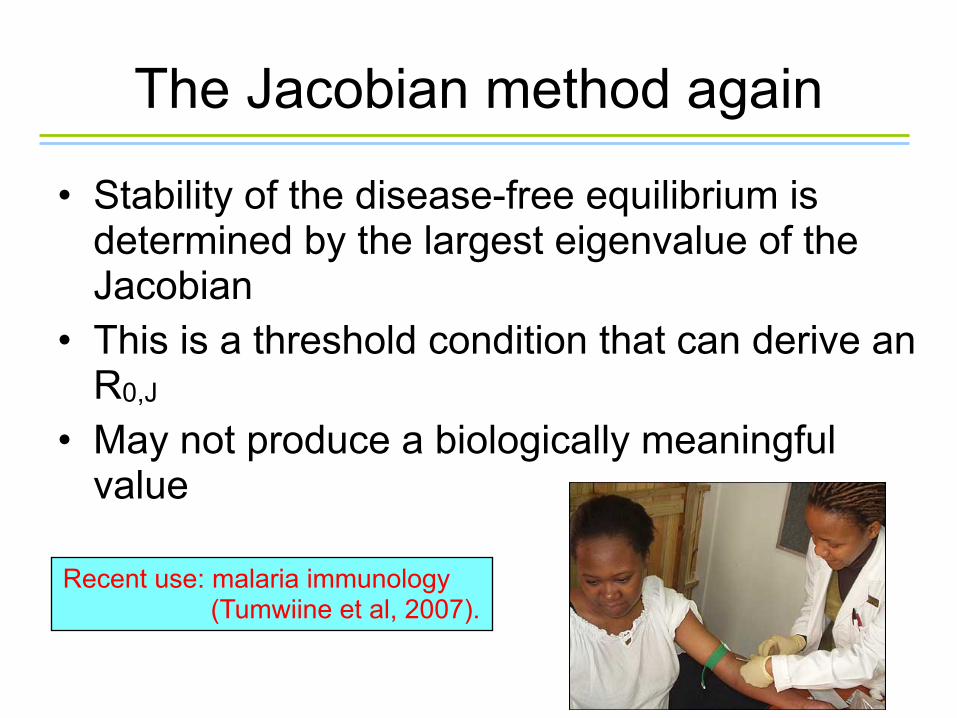
The Jacobian method again
• Stability of the disease-free equilibrium is determined by the largest eigenvalue of the Jacobian
• This is a threshold condition that can derive an R0,J
• May not produce a biologically meaningful value
Recent use: malaria immunology (Tumwiine et al, 2007).
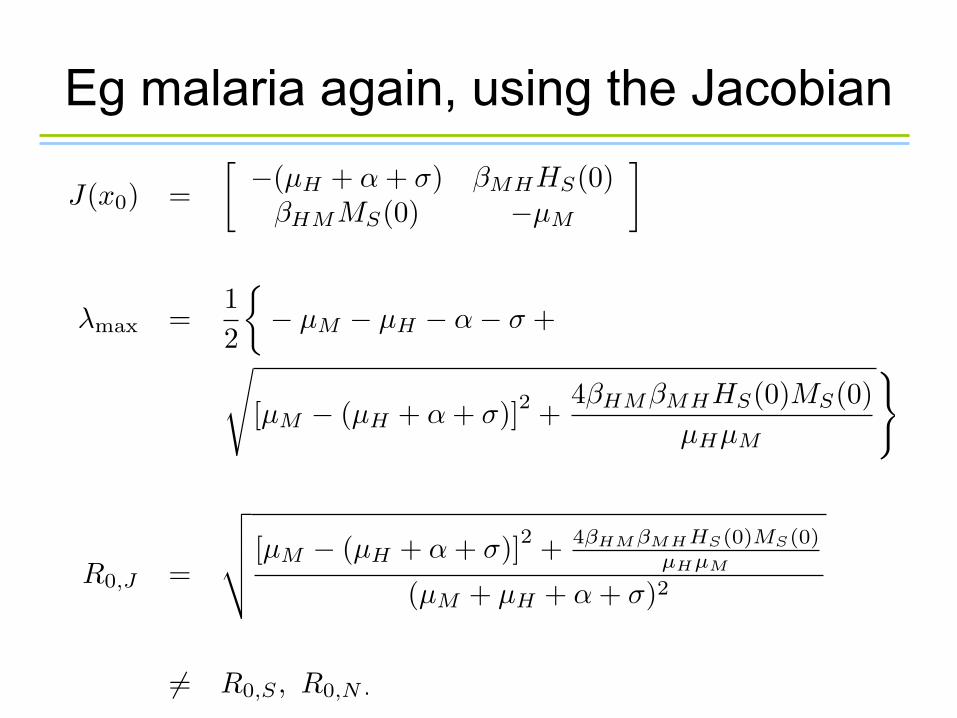
J(x0) =!!(µH + ! + ") #MHHS(0)
#HMMS(0) !µM
"
$max =12
#! µM ! µH ! !! " +
$
[µM ! (µH + ! + ")]2 +4#HM#MHHS(0)MS(0)
µHµM
%
R0,J =
&''( [µM ! (µH + ! + ")]2 + 4!HM !MHHS(0)MS(0)µHµM
(µM + µH + ! + ")2
"= R0,S , R0,N .
Eg malaria again, using the Jacobian

Constant term of the characteristic polynomial
• Malaria again:
J(x0) =!!(µH + ! + ") #MHHS(0)
#HMMS(0) !µM
"
det(J ! $I) = $2 + (µM + µH + ! + ")$+µM (µH + ! + ")! #MH#HMMS(0)HS(0)
R0,C =#MH#HMMS(0)HS(0)
µM (µH + ! + ")
= R0,S
"= R0,J , R0,N .

Constant term
• Easier to calculate than most other methods• Especially useful for calculating different R0s
corresponding to different strains of a disease
Recent use: tuberculosis in hot zones (Blower & Chou, 2004).

Measuring R0 in the field
• R0 is usually calculated from readily estimated parameters
• eg death and recovery rates• But not contact rates• Thus, other methods are needed to produce
R0, using simple estimates.

Susceptibles at endemic equilibrium
• The number of successful contacts for an individual is R0πs
• πs is the probability that a given contact is with a susceptible
• At equilibrium, R0=1/πs
• Assumes homogenous mixing and mass action transmission (ie number of contacts per infective is independent of the number of infectives).
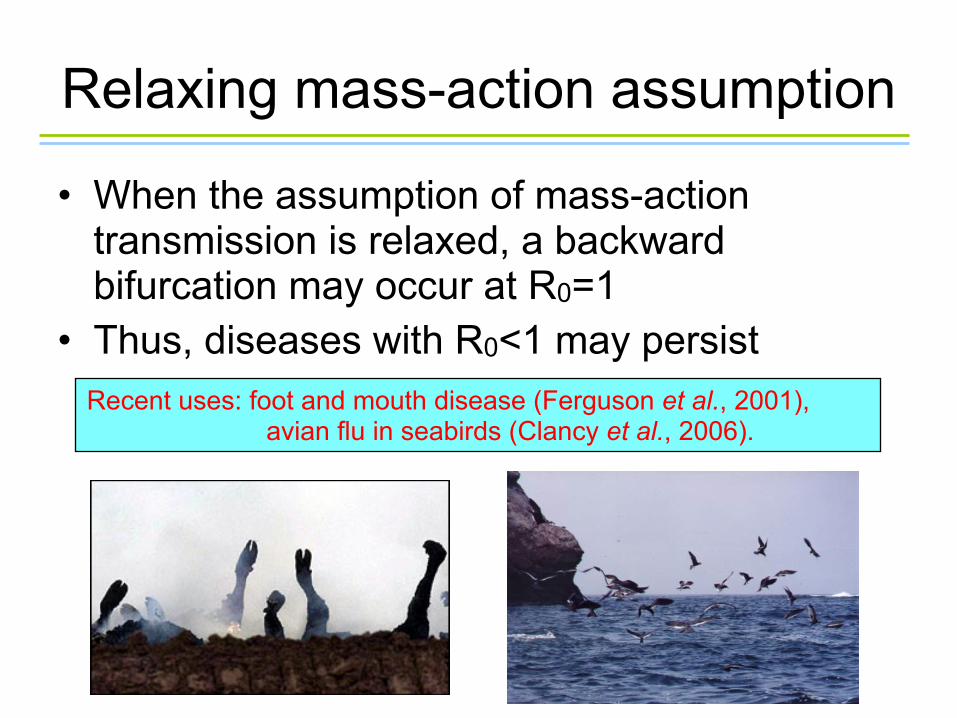
Relaxing mass-action assumption
• When the assumption of mass-action transmission is relaxed, a backward bifurcation may occur at R0=1
• Thus, diseases with R0<1 may persistRecent uses: foot and mouth disease (Ferguson et al., 2001),
avian flu in seabirds (Clancy et al., 2006).

Average age at infection
• R0=L/A• L=mean lifetime• A=average age of acquiring disease• Assumes population is well mixed among
different age groups
Recent use: canine pathogens (Laurenson et al., 1998).

Final size equation
• Only applicable to closed populations• ie infection leads to either immunity or death• Thus, the number of susceptibles decreases
to s(∞)
R0,F =ln s(!)
s(!)" 1
Recent use: SARS (Lipsitch et al., 2003).

Intrinsic growth rate
• r0 is the rate at which infections grow such that I' = r0I
• R0 can be estimated from r0
• This is an implicit definition, so seldom elegant
Recent use: Hepatitis C (Pybus et al., 2001).

R0 in disease control policy
• How has R0 been used in policy?• Can it determine useful outcomes in the
field?

R0 in disease control policy
SARS: R0 used to determine when intervention measures had Hong Kong epidemic under control (Riley et al., 2003)
Mad Cow: Effect of ban on recycling animals into bonemeal showed that disease spread could be controlled in the UK (Ferguson et al., 1999)
Foot and Mouth: Slaughter of animals within 24h would not reduce R0 below one, but ring vaccination and ring culling would be effective (Ferguson et al., 2001).

R0 in disease control shocker!
West Nile Virus: R0 used to evaluate public health policies of mosquito vs bird control, concluding that bird control would actually enhance transmission (Wonham et al., 2004).
Malaria: Low R0 used to justify possibility of elimination from an island in the Gulf of Guinea (Hagmann et al., 2003)
Limitations
• Models used “in the field” are usually simple, deterministic and non-structured
• R0 typically quantified after epidemic has run its course
• R0 values usually used to justify severe or costly control measures, rather than affecting public health measures directly.

Summary
• Many threshold parameters• Few of these reliably calculate the average
number of secondary infections• R0 can’t be used to compare different
diseases• However, multiple methods provide a variety
of ways to determine thresholds.

Answering our question
• R0’s methods aren’t consistent and don’t give the average number of secondary infections
Q. Does this matter?
A. Not if we only want a threshold
The emperor doesn’t need clothes to reign.


