
Economics 382
Pedagogical Notes
The Centrally Planned Economy: Socialist and Post-Socialist
Prof. B. Abegaz Department of Economics
College of William & Mary
This version: Spring 2018
To partially rectify the absence of a good undergraduate textbook on the
subject, I have prepared these sketchy pedagogical notes on the theory of
central planning and its practice as supplements to the class lectures. My
overriding concern here is to present Soviet-type planning in its own terms and
as dispassionately as possible. One needs to have a good understanding of the
internal logic of the system before evaluating its performance.
2
TABLE OF CONTENTS
I. The Centrally Planned Economy (CPE)
II. The Soviet Model: Planning Process
III. The Soviet Model: Plan Implementation
IV. Reflections on the Shortage Economy and Transition
Appendices
Brain Teaser: At the conclusion of this course, you should be able to decode the economic ideas behind each of the six assertions in the box below:
Russian Political Humor
The Six Principles of Soviet Socialism:
1. There is no unemployment, but no one works;
2. No one works, but everyone has money;
3. Everyone has money, but there is nothing to buy;
4. There is nothing to buy, and yet the refrigerators are full;
5. Everyone has a full refrigerator, but no one is happy;
6. No one is happy, and yet everyone always votes “yes.”

3
I. The Centrally Planned Economy (CPE): Economic Systems and Theories of Economic Planning
1.1. Institutional Economics and Social Orders
Institutions are understood by economists as codified rules or longstanding customs
which define and structure social, political and economic interactions among individual
or organizational actors in society. An organization is an entity owned and controlled by
individuals, other private organizations, or a government entity with a well-defined set
of shared goals and objectives that complies with the rules of the game. In ordinary usage,
institution (religious, charitable, educational) and organization are used interchangeably.
Institutional Economics uses the concepts of institutions and organizations to explain
how behavior is shaped by the incentives provided by the institutional rules and how
these rules are enforced by private and public organizations. It also explains institutional
change as a product of legal and illegal (violent or criminal) actions by contending
interest groups in society. A set of institutional rules define a social “order” which
includes the political and the economic realism. In Comparative Economics, the politico-
economic dimensions of a social order constitute an “economic system” such as
Communalism, Slavery, Feudalism, Capitalism, Socialism, or Communism. Of these,
Communalism and Capitalism tend to be accessible orders while Slavery, Feudalism,
Socialism, Communism, and some regimented Capitalist variants are limited orders.
Closed-access orders are societies which solve the problem of violence by politically
creating and allocating economic rents that arise from arrangements such as government
contracts, land rights, monopolies on business activities, and entry to restricted job
markets. When individuals and groups with access to violence receive economic rents—
ranging from extortion and corrupt payoffs to land rent, natural resource royalties, and
monopoly profits— they have incentives to restrain the violence precisely because
fighting reduces their rents.

4
Open access orders are societies which solve the problem of violence through open
access and competition. All citizens have the right to form contractual organizations, as
long as they are not violent, and open access helps sustain both economic and political
competition as well as an active civil society. In open access orders, the state has a
monopoly over large-scale violence.
A Successful transition between the two orders produces stable, equitable, and
competitive political economies. Being developed economically entails having
sophisticated economic organizations and credible enforcement of property rights and
other contractual commitments. Similarly, being developed politically entails having the
rule of law, a constitutional setting in which all major players accept legitimate changes
of power, and effective legal recognition of organizational rights independently of who is
in power.
The Prism of the New Institutional Economics
It turns out the provision of secure property rights for all or competitive markets may be
necessary but certainly not sufficient for shared prosperity. Many anti-growth elites have,
for example, historically provided security of ownership (including over slaves and
serfs)—for themselves. Modern economic growth is also attributable to entrepreneurial
monopolies and oligopolies. What also seems to matter more is the incentive of those
holding political power to either focus on redistributing existing wealth (extracting) or
on creating new wealth to be shared with the masses (inclusionary). In other words,
politics and economics are intertwined in all systems.
We, therefore, need to understand the historical roots and the logic of institutions
(norms and rules of the game) in order to identity the forces that trigger enduring
transitions from closed-access and extractive social order to an open-access and inclusive
social order. Acemoglu and Robinson (2012), in their much-acclaimed book—Why
Nations Fail— link the political and economic dimensions of the social “system” to arrive
at a very useful framework for thinking about the issues.
5
Extractive (absolutist) political institutions (power in the hands of a few, without
checks and balances or the rule of law), they argue, tend to have a close affinity with
extractive economic institutions (insecure property rights for non-elites, entry barriers,
lack of law and order) resulting in episodic growth. Inclusive political institutions
(pluralist) and inclusive economic institutions (level playing field and support by capable
governments for human capital investment and innovation), on the other hand, tend to
produce both political legitimacy and enduringly shared growth.
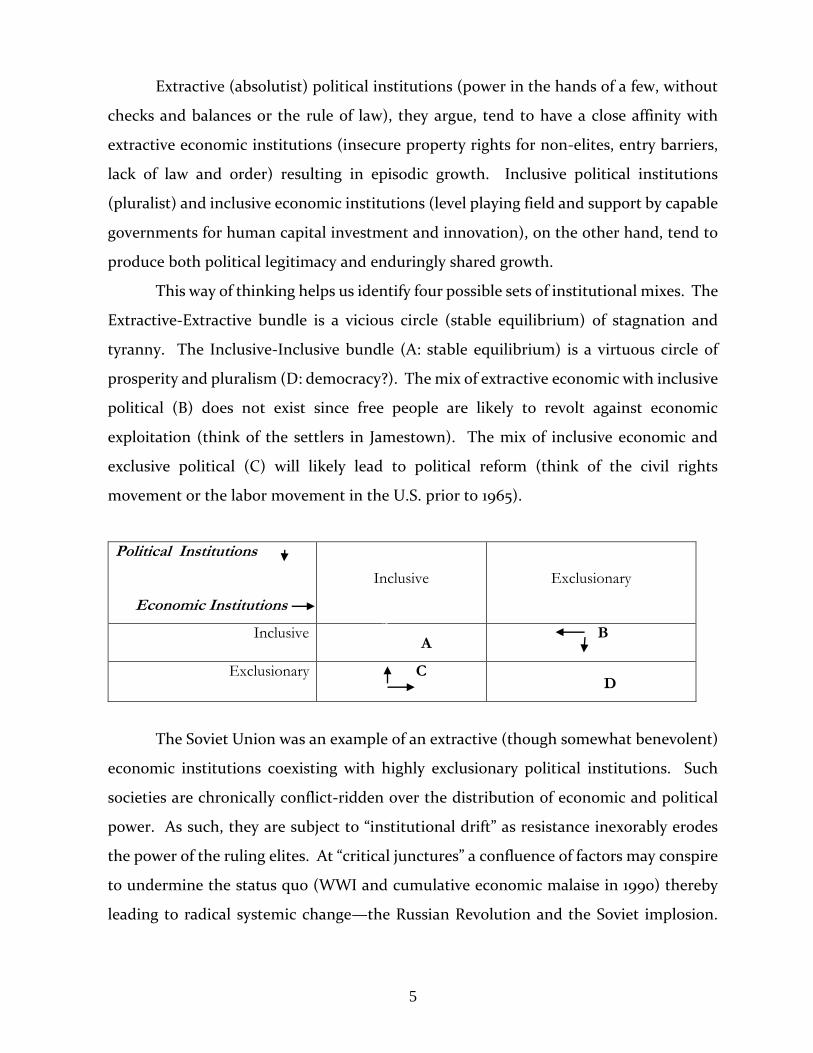
This way of thinking helps us identify four possible sets of institutional mixes. The
Extractive-Extractive bundle is a vicious circle (stable equilibrium) of stagnation and
tyranny. The Inclusive-Inclusive bundle (A: stable equilibrium) is a virtuous circle of
prosperity and pluralism (D: democracy?). The mix of extractive economic with inclusive
political (B) does not exist since free people are likely to revolt against economic
exploitation (think of the settlers in Jamestown). The mix of inclusive economic and
exclusive political (C) will likely lead to political reform (think of the civil rights
movement or the labor movement in the U.S. prior to 1965).
Political Institutions
Economic Institutions
Inclusive
Exclusionary
Inclusive A
B
Exclusionary C D
The Soviet Union was an example of an extractive (though somewhat benevolent)
economic institutions coexisting with highly exclusionary political institutions. Such
societies are chronically conflict-ridden over the distribution of economic and political
power. As such, they are subject to “institutional drift” as resistance inexorably erodes
the power of the ruling elites. At “critical junctures” a confluence of factors may conspire
to undermine the status quo (WWI and cumulative economic malaise in 1990) thereby
leading to radical systemic change—the Russian Revolution and the Soviet implosion.

6
These changes are, however, contingent rather than historically predetermined. A
rigorous theory of transition remains elusive.
Box 1.1
The nature of this overall process can be illustrated by a brief account of the rise and fall of
the Soviet Union (which will be the subject of a more comprehensive analysis later). Marx
and Engels provided the belief system that was Lenin's revolutionary inspiration, explaining
both the way the world was and the way it should be. The circumstances of the war-torn
Russia of 1917 provided the unusual opportunity for abrupt institutional change. While Marx
provided no blueprint for the transformation to or construction of a socialist society, his
fundamental ideological building blocks, particularly with respect to the concept of property,
remained guiding principles (and constraints) of Soviet leaders. Dire necessity forced a
retreat from the principles and led to the creation of the New Economic Policy (NEP) in 1921;
the first five-year plan in 1928 returned to ideological orthodoxy. In the early years
substantial discussion of alternative strategies and hence institutions helped shape socialism.
The gradual accretion of the complex institutional matrix that resulted led to perceived
successes--such as in heavy industry--and failures--such as in agriculture--and attempts to
correct the failures within the belief system of Marxist orthodoxy. As the economy grew,
underwent the devastating torment of the Nazi invasion, and then underwent the lengthy
reconstruction process, the institutional matrix was continually being modified by external
stimuli--war--or internal perceptions of needed institutional alterations guided by a belief
system that evolved within the ideological limits of Marxism. The result throughout the
1950s, 1960s, and early 1970s was rapid growth of physical output, military technology, and
scientific knowledge; and the advent of superpower status.
Almost half the world became socialist or communist in this era and these ideologies were
widely perceived to be the wave of the future. But then growth began to slow, the problems
of agriculture became ever more acute, and efforts at institutional reform to rectify the
problems were ineffectual. Following the advent of Gorbachev in 1985, the policies of the
next six years led to absolute decline and in 1991 to the demise of the Soviet Union--perhaps
the most striking case of internally induced rapid demise in all of human history.
This story of the Soviet Union is a story of perceived reality → beliefs → institutions →
policies → altered perceived reality and on and on. The keys to the story are the way beliefs
are altered by feedback from changed perceived reality as a consequence of the policies
enacted, the adaptive efficiency of the institutional matrix--how responsive it is to alteration
when outcomes deviate from intentions--and the limitations of changes in the formal rules as
correctives to perceived failures.
Quotable quote: “Imagine a small pie, cut into equal pieces. That’s socialism. Now imagine a big pie, cut
into unequal pieces. Even the small pieces of the second pie are much bigger than in the first. That’s
capitalism. “ S. Shataline, circa 1992.
7
1.2. The Neoclassical Theory of Economic Systems
Economics, political science, and sociology offer separate theories social systems
involving an interconnection of the state, constraints on state elites (the rule of law and
accountability), the business sector, and the social sector (family, clan, tribe, etc.).
Neoclassical theory takes the structures that define the economic system for granted and
focuses on how they affect incentives or behavior. Variants of economic thought are,
however, unanimous in underscoring the importance of three attributes for economic
efficiency and equity: (a) clearly-defined property rights (Coase), (b) strong (especially
positive) incentives (Lange), and (c) sufficiently competitiveness of markets (Pareto) or
merit-based contests in bureaucracies (Weber).
Under the following rather strong assumptions, economic theory generates three sets of
results under certain strong assumptions: markets exist for all possible goods and for all
time horizons; markets are perfectly competitive; transaction costs are negligible; and
there are no externalities.
Result #1. Two, almost symmetrical theoretical claims, known as the Fundamental
Theorems of Welfare Economics rationalize the efficiency and equity of a “perfectly
competitive” market system (at the point where the utility possibilities frontier is tangent
to the production possibilities frontier):
A. The First Theorem of Welfare Economics states that any competitive (or Walrasian)
equilibrium is almost always Pareto efficient in the allocation of resources. The
theorem simply says that a competitive equilibrium is efficient, provided markets work
perfectly. That is, the marginal product of labor and capital are equalized across the
economy; otherwise, resources could be shifted to higher productivity activities thus
increasing output. By implication, market failures (in the presence of an externality,
public goods, excessive inequality) necessitate only benign government intervention.
8
Remember: Pareto efficient situations are those in which no one can be made better
off without making someone else worse off. Pareto efficiency does not necessarily
result in a socially desirable distribution of resources since it makes no statement
about equality or the overall well-being of society generated many possible Pareto
efficient equilibria.
However, the Stiglitz-Greenwald Theorem states that “really existing” market economies
are almost never efficient. Reasons: Risk and futures markets are incomplete; and
information is often imperfect (adverse selection, moral hazard) and distributed
asymmetrically among parties to economic transactions. This means, in real-world
economies, these substantial deviations from the ideal conditions (market failures) necessitate
judicious government interventions to arrive at second-best outcomes. These
inefficiencies in resource allocation that arise from the substantial and differential deviations
from the theoretical norm constitute the better part of the explanation for why some countries
are richer than others.
B. The Second Theorem of Welfare Economics states the converse: Every Pareto-efficient
allocation can be attained by a competitive equilibrium. One implication is that
production efficiency and income distribution are in principle separable. In other
words, policymakers can choose a particular Pareto-efficient outcome which is
consistent with the most preferred distributional equity. This can be done by enacting
non-distortionary lump-sum redistributions where governments fully respect the
preferences of citizens. Redistributions are often costly in a world of imperfect
information, and decentralized decisions are not always possible due to pervasive
complementarities and the lumpiness of investments.
Result #2. Coase’s Conjecture:
Enforceable ownership right is all that matters for efficiency. Clear assignment of
property rights provides private owners adequate incentive to work out efficient
economic arrangements in cases of significant negative externalities or other conflicts—
all without government intervention!
9
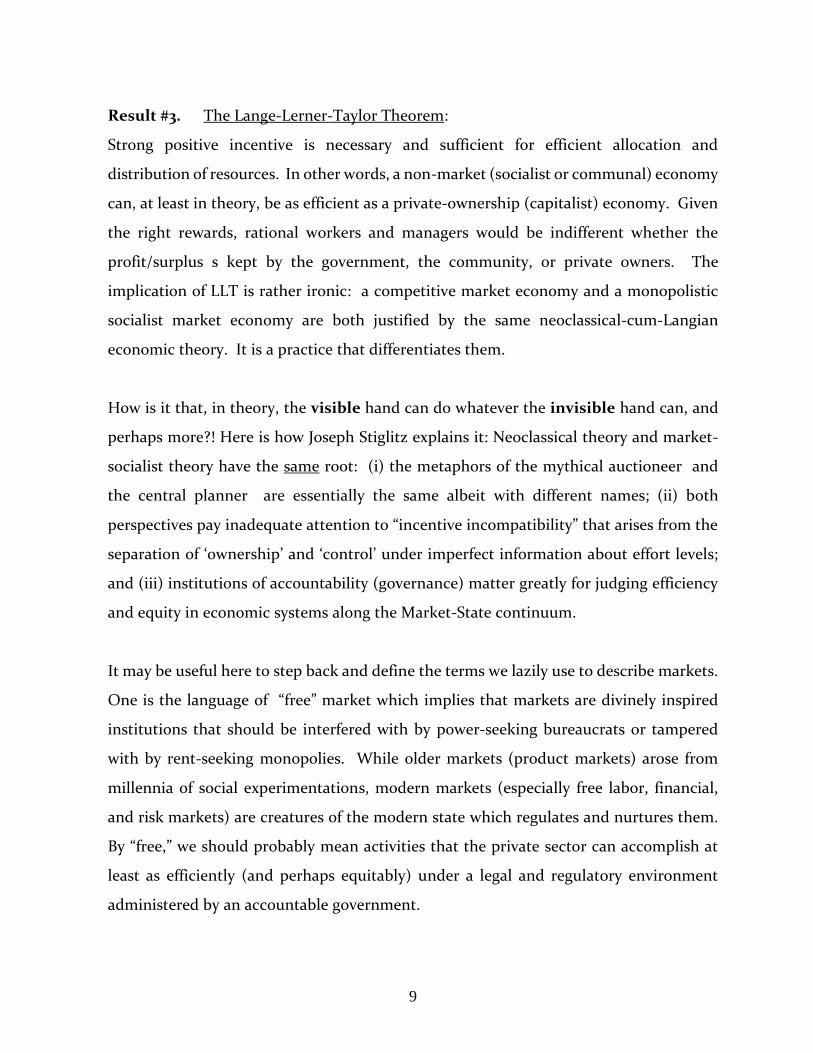
Result #3. The Lange-Lerner-Taylor Theorem:
Strong positive incentive is necessary and sufficient for efficient allocation and
distribution of resources. In other words, a non-market (socialist or communal) economy
can, at least in theory, be as efficient as a private-ownership (capitalist) economy. Given
the right rewards, rational workers and managers would be indifferent whether the
profit/surplus s kept by the government, the community, or private owners. The
implication of LLT is rather ironic: a competitive market economy and a monopolistic
socialist market economy are both justified by the same neoclassical-cum-Langian
economic theory. It is a practice that differentiates them.
How is it that, in theory, the visible hand can do whatever the invisible hand can, and
perhaps more?! Here is how Joseph Stiglitz explains it: Neoclassical theory and market-
socialist theory have the same root: (i) the metaphors of the mythical auctioneer and
the central planner are essentially the same albeit with different names; (ii) both
perspectives pay inadequate attention to “incentive incompatibility” that arises from the
separation of ‘ownership’ and ‘control’ under imperfect information about effort levels;
and (iii) institutions of accountability (governance) matter greatly for judging efficiency
and equity in economic systems along the Market-State continuum.
It may be useful here to step back and define the terms we lazily use to describe markets.
One is the language of “free” market which implies that markets are divinely inspired
institutions that should be interfered with by power-seeking bureaucrats or tampered
with by rent-seeking monopolies. While older markets (product markets) arose from
millennia of social experimentations, modern markets (especially free labor, financial,
and risk markets) are creatures of the modern state which regulates and nurtures them.
By “free,” we should probably mean activities that the private sector can accomplish at
least as efficiently (and perhaps equitably) under a legal and regulatory environment
administered by an accountable government.
10
In this sense, markets are distinctive and very powerful contractual relationships (some
arm’s length and others socially embedded) among key actors (entrepreneurs, buyers,
owners, regulators, providers of key public services, etc.). They are ill-adapted to take
care of externalities, public goods, and pre-market inequalities.
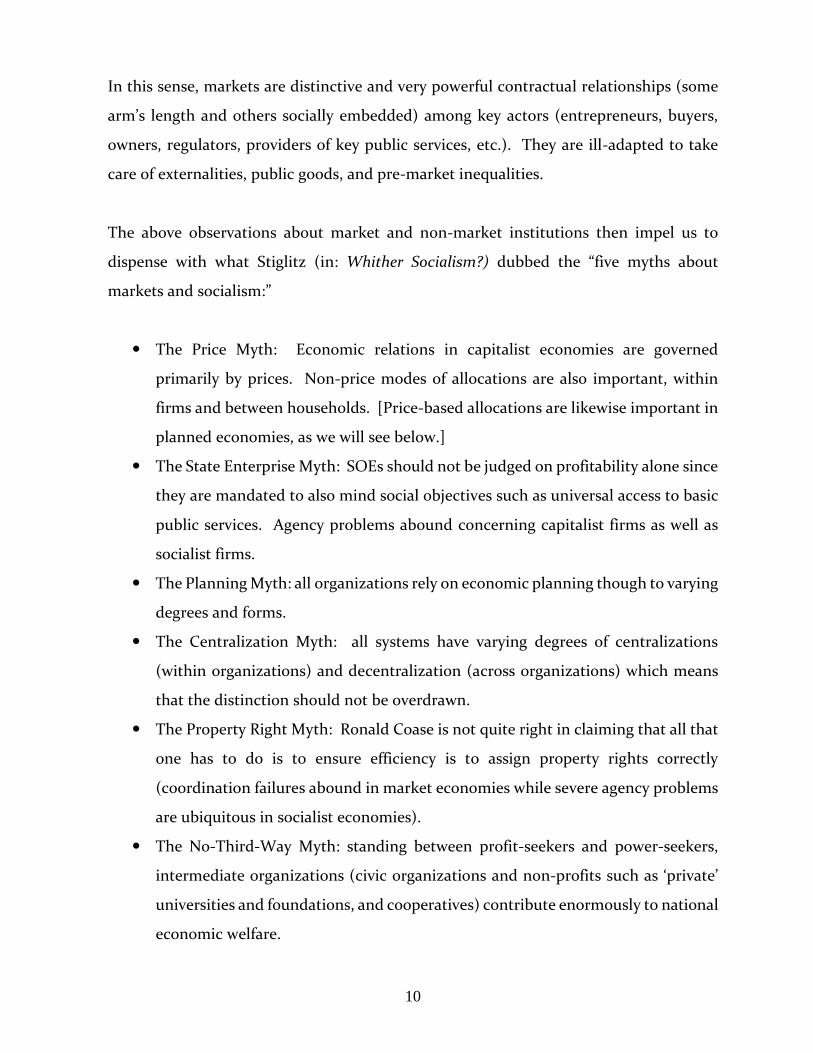
The above observations about market and non-market institutions then impel us to
dispense with what Stiglitz (in: Whither Socialism?) dubbed the “five myths about
markets and socialism:”
The Price Myth: Economic relations in capitalist economies are governed
primarily by prices. Non-price modes of allocations are also important, within
firms and between households. [Price-based allocations are likewise important in
planned economies, as we will see below.]
The State Enterprise Myth: SOEs should not be judged on profitability alone since
they are mandated to also mind social objectives such as universal access to basic
public services. Agency problems abound concerning capitalist firms as well as
socialist firms.
The Planning Myth: all organizations rely on economic planning though to varying
degrees and forms.
The Centralization Myth: all systems have varying degrees of centralizations
(within organizations) and decentralization (across organizations) which means
that the distinction should not be overdrawn.
The Property Right Myth: Ronald Coase is not quite right in claiming that all that
one has to do is to ensure efficiency is to assign property rights correctly
(coordination failures abound in market economies while severe agency problems
are ubiquitous in socialist economies).
The No-Third-Way Myth: standing between profit-seekers and power-seekers,
intermediate organizations (civic organizations and non-profits such as ‘private’
universities and foundations, and cooperatives) contribute enormously to national
economic welfare.

11
Figure 1.1.
The USSR Just Before the Breakup

12
1.3. The Emergence of the CPE
The emergence a modern socialist economy about a decade after the 1917 Russian
Revolution is one of the greatest economic developments of the 20th century. The debate
on the feasibility and desirability of the modern centrally planned economy (CPE) took
place during the great depression along with the concurrent with another debate.
Responding to the unprecedented macroeconomic crisis in the capitalist economy,
governments in the West engaged in extensive Keynesian planning as well as
administrative rationing/pricing through WW II.
The modern CPE went through three phases of the development. The first five-year plan
of the USSR coincided with the infamous collectivization drive of 1928-32. Here is a brief
chronology:
a) 1925-1945
The preoccupation during this period was with how a socialist economy could operate
and grow in the absence of markets and private property. The highlight was the
famous Soviet Industrialization Debates which presaged much of post-war
development economics. The three camps of CPSU economists were Preobrazhenski
(favored industry over agriculture), Shanin (agriculture over industry), and Bukharin
(both sectors must support each other). Stalin eventually sided with Preobrazhenski
and declared war on the peasant (collectivization of agriculture). In the West, this
new collectivist economic system generated so-called Socialist Controversies.
Barone and Lange supported the viability of such a centrally planned economy, and
von Mises and Hayek thought that it would self-destruct.
In the literature on the subject, myriad arguments are advanced in favor of central
planning. Socioeconomic modernization can be accelerated this dirigiste way. A
meritocratic system of elite formation can enhance equality while effecting a successful

13
industrialization drive. Inflation and unemployment can be cast into the dustbin of
history. And the like.
The critique of central planning, on the other hand, revolved around several concerns,
including administrative inefficiencies arising from ossified bureaucracies; an immense
and rigidly organized bureaucratic structure unable to assess the facts on the ground;
absence of consumer sovereignty; unable to respond to change (aversion to risk); and
shortages of outputs when crucial inputs become unavailable because of the proclivity to
engage in pressure or taut planning.
b) 1945-1975
After the socialist economy became a reality, the eminently debatable question focused
on discovering the appropriate institutions, organizations and planning processes for an
efficient socialist economy. Debates on these issues led to the emergence of a sub-field
of economics known as Comparative Economic Systems. From this literature, three
features of an ideal CPE suggest themselves:
Omniscience of Planners—the balance between inputs and outputs is
consistent with the preferences of the State or the Party.
Insignificance of Money—the bias for quantitative planning renders money
passive.
Flexibility of Prices—administrative guidance is supplemented by flexible
adjustments (using sales taxes, for example) in order to correct for frequent
imbalances between demand and supply.
These conditions rarely held in reality. Comparative Systems, though lacking a rigorous
theory of central planning, did provide useful generalizations based on empirical
observations of "really existing" socialism and capitalism.

14
Four empirical generalizations provide a sampling:
a. Governments have played an important role in almost all of the major
economic success stories.
b. There are inefficient state enterprises as well as efficient ones. Both
governments and markets, as institutions, are prone to failure.
c. Almost all governments play a central role in capital markets and labor markets
due mainly to informational failures.
d. Governments in almost all countries have assumed some direct role in
production and certainly in social security (Wagner’s Law).
In sum, the modern CPE has certain generic features that are across countries:
(i) Ownership of most of the means of production by a state that is controlled by
elites organized around a communist/Socialist Party. The Party is typically
assisted by mass organizations (neighborhood organizations, labor union,
professional organizations, and youth organizations), and an extensive network of
domestic security services.
(ii) Central economic planning which entails:
– hierarchical control,
– an array of economic (line) ministries and agencies,
– premium on quantitative targets, and administrative rationing of key inputs,
– administrative price setting,
– centralized allocation of large investment funds, including wage funds,
– a monobank system (financial police), and
– forced (taut) industrialization and growth driven by factor accumulation.
At its zenith around 1970, the socialist bloc (USSR, China, E/SE Europe) accounted for a
quarter of the world’s population—equal to the capitalist bloc in OECD countries. This
left half of the world’s population to reside in the third bloc—variously named Third
World, Global South, or the Mixed Underdeveloped Economies (capitalist, communal,

15
and planned). This group led by India flirted with “development planning.” The USSR,
the GDR, and Czechoslovakia typified the CPE model of industrialized economies.
c) 1975-1990
As the early "growth miracles" of the socialist economies gave way to stagnation, new
perspectives emerged. The main research question during this last phase of socialism
was: Can we explain theoretically, and substantiate empirically, the persistent
simultaneity of shortage and slack in the traditional CPE?
China and Vietnam represented the CPE variants of a semi-industrial and semi-centrally
planned economy.
However, the primary concern of economic theory of CPEs was with making sense of how
the CPE operated in practice and how it should operate in theory. Regarding the former,
two schools dominated the debate:
(a) The Disequilibrium School: Apply fix-price, excess demand disequilibrium models
of the capitalist economy (profit maximization, hard budget, and imperfect
relative prices) to the CPE. Shortages and repressed inflation can then be
rationalized as products of informational imperfection and verified empirically.
(b) The Kornai Shortage-Economy School: The socialist economy suffers an endemic
and persistent shortage. Shortage is maintained over time by a variety of
mechanisms, all of which are grounded in rational behavior on the part of
enterprises, central planners, households and other agents for pre-given the
available information and expectations. Shortage in an environment of over-taut
planning is a rational response. Both firms and household react only to an above-
normal shortage (such as those signaling unusually long queues).

16
1.4. Theories of Economic Planning
Economic planning involves three sequential actions: (a) the drawing up of a statistical
picture of the current and past state of the economy, (b) identification of the desired
future state of the economy, and (c) formulation of a strategy to deploy the available
policy instruments to bring about the desired state of the economy. Another take is that
it as a process of information exchange, iterative computation of key parameters and the
implementation of these parameter values in order to maximize a certain social welfare
function.
Planning takes place under pervasive “uncertainty” which means that good information
and useful knowledge reduce this uncertainty to calculable “risk.” Planning may
encompass the entire economy at the macro level, specific industry sectors at the meso
level, or specific organizations at the micro level. Economic planning, as a purposeful
and forward-looking activity, is almost as ubiquitous in market economies (mainly at the
meso and micro levels) as it is in socialist economies (at all levels).
We will use the LAH procedure to illustrate how one can come up with a set of optimal
production and consumption programs to which the planning process converges.
Needless to say, the planning problem is a trivial task of coming up with a good incentive
system in a world where knowledge (information) is perfect, the processing capacity of
planners is adequate, and the planners are righteously benevolent.
A number of models of central planning exist. One is the price-guided planning
procedure such as the one pioneered by Lange, Arrow and Hurwicz (known as the LAH
Procedure). It mimics the price mechanism of market economies by quoting various
relative prices to elicit profit-maximizing plans from state-owned enterprises. The others
are non-price planning procedures whereby the planner proposes a detailed output plan

17
and asks for marginal costs/benefits associated with such a plan in order to revise it so as
to maximize social welfare.
The theory of economic planning focuses on the problem of achieving an optimal (or
welfare-maximizing) set of output and input mixes. The planning problem may be
expressed in its most general form as one of maximizing a pre-given objective function
(1) subject to a hard budget constraint (2):
Maximize W = W(Y1, Y2, …, Yn) (1)
subject to the budget constraints (inputs and technology) in producing Yi:
Yi = f (X1, X2, …, Xm) (2)
where the Xi are less than or equal to the total available quantities for each resource. The
overriding concern of the social planner is to apply MSB = MSC rule to attain the highest
social utility (W) as shown in Figure 1.
Consider now the welfare function, W(G,Y), which must be continuous, increasing in
(G,Y) and quasi-concave. The production (possibilities) set, X, is compact, and convex.
Planning then becomes an iterative process of vertical information exchange in the form
of relative prices and corresponding quantities (of outputs by producers and purchases
by users). The process culminates in a final plan (G*, Y*) that would maximize W when
implemented.
The LAH procedure then focuses on the interactions among four economic agents: the
central planning board (CPB), Managers of state enterprises, Distributors (such as
retailers) which are also state-owned, and Consumers or households.
Here are the major steps in the planning procedure which are also depicted in Figure 2:
o Step 1. The CPB sends to the producers an initial vector of prices for output (Y)
and input (X). Distributors are also given output prices and the marginal social
benefit (MSB) of Y.

18
o Step 2. Managers then equate input prices with the value of marginal product (MP
x P) and report back the cost-minimizing X and profit-maximizing Y.
o Step 3. Distributors also equate output prices with MSB to inform CPB of
consumer demand for Y.
o Step 4. CPB then engages in internal iteration by varying prices until demand and
supply are equal for all inputs and outputs. No plans are to be implemented until
the market-clearing prices are announced. This routine involves several iterations
to converge.
o Step 5. Consumers, as citizens, will get a portion of the net social dividend at the
end of the year, after funds for planned investment have been deducted.
The main criteria for evaluating the LAH planning procedure, easy to list but hard to
aggregate into one overall measure, are:
o Feasibility—does the plan violate resource constraints?
o Monotonicity—does each successive step bring us closer to the optimal point?
o Optimality—does the procedure lead to a plan that would converge to the
optimum?
o Generalizability—does it apply to a variety of economic environments?
o Informational Economy—does it economize on information?
o Speed of Convergence—in the long run, we are all dead, after all!
o Computational of Ease—how big a computer do the tasks require to process all
that information?
A useful way to think about LAH is that it applies to the idealistic market socialism of
Lange (1936). This textbook socialism (closely mimicked by the Yugoslav model) is a far
cry from Stalinist socialism. Like the Walrasian tatonnement procedure, LAH posits that the
CPB is an auctioneer; no trade is allowed before the determination, by trial and error, of the
market clearing prices; and socialist firms, however big or few, can be forced to be price takers.
Theoretically speaking, two strong and debatable claims are often made:

19
1. LAH suggests that the Langian CPE has the potential (but only the potential) to ensure
that prices reflect social cost (including externalities) so that they are socially rational.
The equalization of prices and social valuations by social planners, who have society’s
best interest at heart, might very well make the CPE superior to the capitalist economy.
The latter, despite regulatory interventions by the state, cannot ensure that prices fully
reflect the social cost (inclusive of rent and negative externalities).
2. There is also a second sense in which Langian Socialism is attractive to some: it can
potentially eliminate unjustifiable inequality in income/wealth since the social surplus
can be invested in public goods, and incomes (e.g., wages) can be manipulated to embed
socio-political commitments. This kind of social engineering, being open to corruption
or being based on planner preferences rather than consumer sovereignty, is decried by
advocates of free markets.
We will study in some detail the Soviet model, as the archetypical CPE, to give you a
good sense of how well (or how poorly) an economy can be managed without the

20
Figure 1
The Planners’ Ultimate Goal
Price
MSC
P*
MSB
Q* Quantity
MSB = marginal social benefit
MSC = marginal social cost
predominance of market relations. This in-depth case study of the historical experience
is critical in informing future debates in the theory of central economic planning.
21
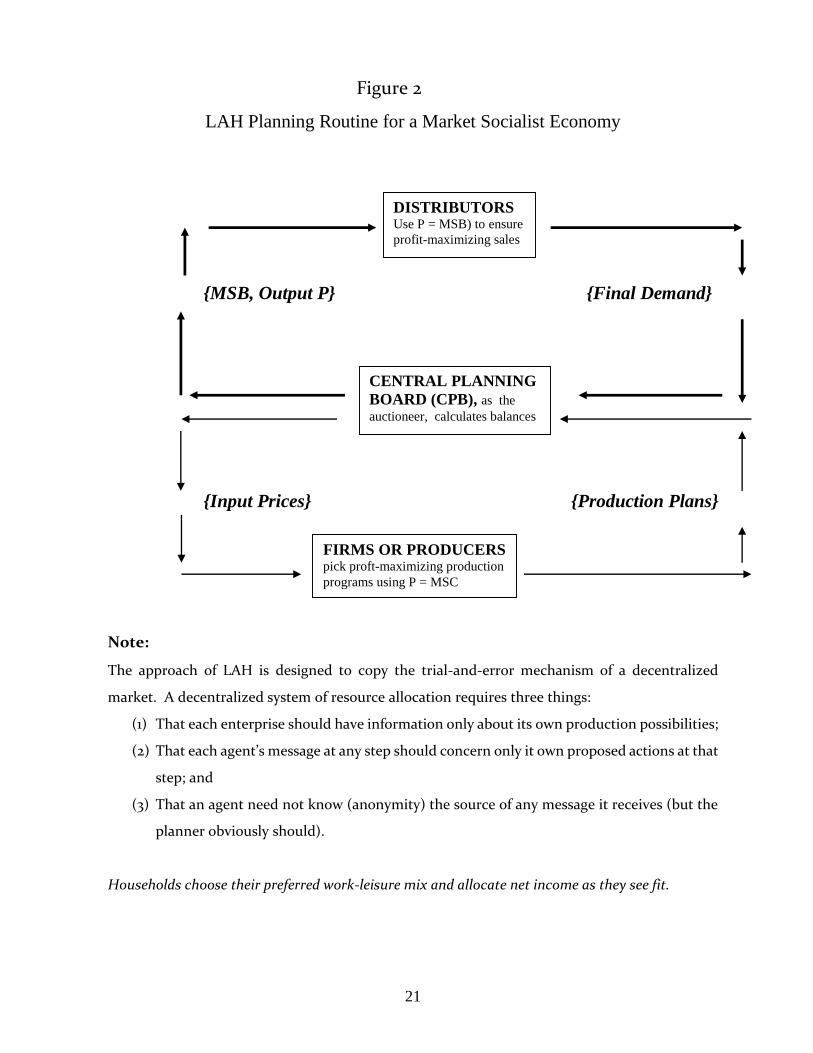
Figure 2
LAH Planning Routine for a Market Socialist Economy
{MSB, Output P} {Final Demand}
{Input Prices} {Production Plans}
Note:
The approach of LAH is designed to copy the trial-and-error mechanism of a decentralized
market. A decentralized system of resource allocation requires three things:
(1) That each enterprise should have information only about its own production possibilities;
(2) That each agent’s message at any step should concern only it own proposed actions at that
step; and
(3) That an agent need not know (anonymity) the source of any message it receives (but the
planner obviously should).
Households choose their preferred work-leisure mix and allocate net income as they see fit.
DISTRIBUTORS Use P = MSB) to ensure
profit-maximizing sales
CENTRAL PLANNING
BOARD (CPB), as the
auctioneer, calculates balances
FIRMS OR PRODUCERS pick proft-maximizing production
programs using P = MSC

22
II. The Soviet Model: Planning Process
2.1. THE ORGANIZATIONAL STRUCTURE OF SOVIET PLANNING
The Soviet economy was the most sophisticated CPE for at least half a century. A
distinctive feature of the Soviet model is the co-existence of three types of property rights:
state property (all industrial capital and urban land), collective property (most farmland),
and private property (private residences, durable goods, and micro enterprises such as
garden plots).
Following the Marxian conceptual scheme, Soviet planners make a distinction between
productive services (such as transportation and communications) and unproductive
services (such as education and health). Their Gross Material Product (GMP), in contrast
to our GDP, excludes the latter. This means that the socialist system of national
accounting significantly understates the average living standard of the Soviet citizen.
More important than ownership is the mechanism of decision-making that governs the
allocation and distribution of resources. The Soviet (Stalinist) system of planning had
the following interesting features:
1. Organizational Parallelism—the structure of the Soviet central bureaucracy
(ministerial system of government and economic organization) closely mirrored
the organizational structure of the Communist Party of the Soviet Union (CPSU).
In other words, the government is “shadowed” by the Party apparatus under the
direction of the Central Committee of CPSU.
2. The Nomenklatura System—the code-list of top-level positions or
appointments in the Party, the Government, social organizations or the trade
unions which require prior consent by Party apparat. One should also note the
importance of dual-control agencies by territory -- All-Union (federal), and Union-

23
Republican (dual). The nomenklatura control of economic organizations does not
constitute a bureaucratic system per se. It violates the integrity of autonomous
decision-making within an organization since Party officials can and do interfere
at will in the internal workings of key non-party organizations.
Why parallelism and nomenklatura?
a) One reason is the unavoidable need to impose economic discipline on the
economic bureaucracy. To use awkward metaphors: The "invisible hand" of
Market competition has its parallel in the "grabbing hand" of the Party.
Otherwise, the result will be what the Chinese call responsibility without
accountability.
b) A second, more obvious reason is the need for political control of the economy.
In fact, there is no such a thing as the “economy” in the Soviet model since the
Western-type autonomy of the political sphere from the economic sphere
cannot exist—they are necessarily fused. The dictatorship of the state elite
(purportedly on behalf of the hapless proletariat) cannot exist if the state does
not own the commanding heights of the economy.
3. Cohesion—while power emanates from the existence of a coercive one-party
system and Party-State fusion, cohesion is enhanced by ideological inculcation
through education and mass organizations, prestige, and privileges. Molding the
values of citizens is a more effective and a less costly method of ensuring loyalty
for the dominant ideology than naked force.
4. Multi-level Planning—planning is done following a rational division of labor
among the CPB (Gosplan), the Ministries, and the Republics.
5. Varying Degrees of Plannedness—agriculture and goods/services of local or
minor importance are less tightly planned by the center. Agriculture and the
24
railroads were, in fact, regionally controlled or managed precisely because they do
not lend themselves to central planning.
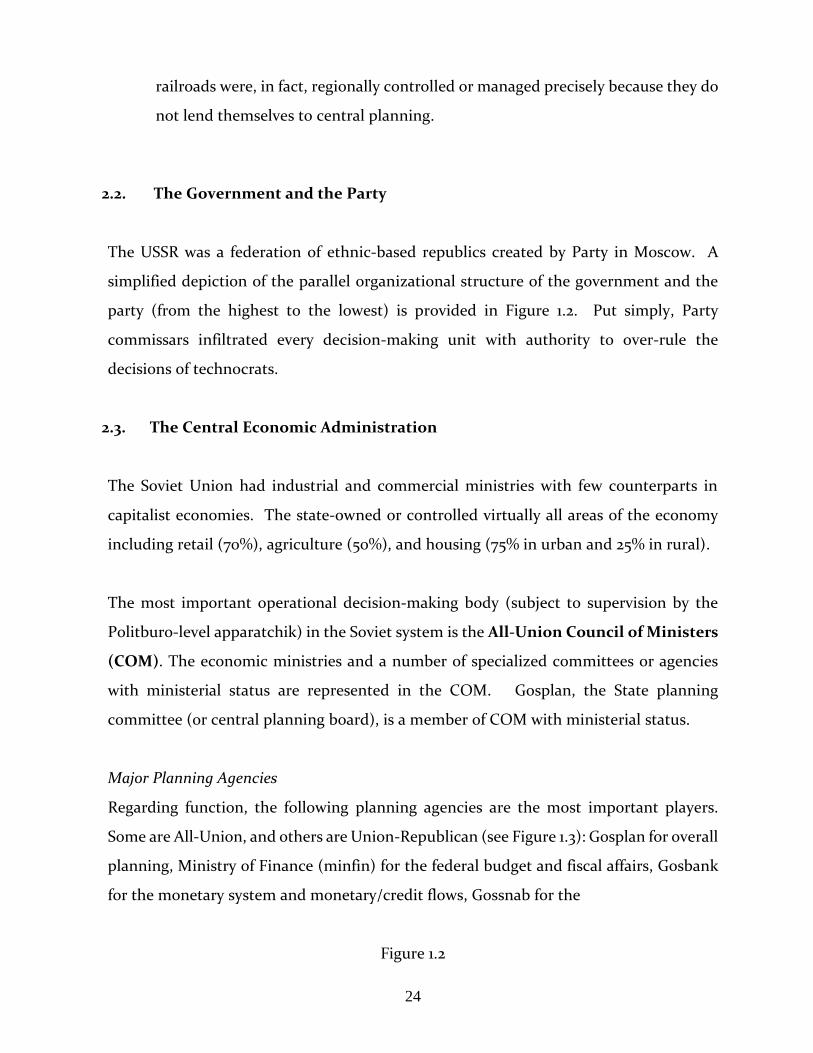
2.2. The Government and the Party
The USSR was a federation of ethnic-based republics created by Party in Moscow. A
simplified depiction of the parallel organizational structure of the government and the
party (from the highest to the lowest) is provided in Figure 1.2. Put simply, Party
commissars infiltrated every decision-making unit with authority to over-rule the
decisions of technocrats.
2.3. The Central Economic Administration
The Soviet Union had industrial and commercial ministries with few counterparts in
capitalist economies. The state-owned or controlled virtually all areas of the economy
including retail (70%), agriculture (50%), and housing (75% in urban and 25% in rural).
The most important operational decision-making body (subject to supervision by the
Politburo-level apparatchik) in the Soviet system is the All-Union Council of Ministers
(COM). The economic ministries and a number of specialized committees or agencies
with ministerial status are represented in the COM. Gosplan, the State planning
committee (or central planning board), is a member of COM with ministerial status.
Major Planning Agencies
Regarding function, the following planning agencies are the most important players.
Some are All-Union, and others are Union-Republican (see Figure 1.3): Gosplan for overall
planning, Ministry of Finance (minfin) for the federal budget and fiscal affairs, Gosbank
for the monetary system and monetary/credit flows, Gossnab for the
Figure 1.2

25
Organizational Parallelism of the Soviet System
=============================================================
Government Bureaucracy: Party Bureaucracy:
1. Presidium of Supreme Soviet Central Committee (400 members)
2. All-Union Council of Ministers Politburo (12 voting plus 8 nonvoting)
3. Ministries & State Committees Secretariat
-------------------------------------------------------------------------
4. Republican/Union-Republican Republican Party committees
5. Oblast (provincial) Obkom committees
6. Rayony (regional) Raikom committees
7. Gorod (town) Gorkom committees
The Nomenklatura System
Glavki (Chief Administration) Glavki
Obedeneniia (Association) Obedeneniia (Association)
Ministry Ministry (primary party organization)
Enterprise (one-man management) Enterprise (trade union)
Firm/plant (director, chief eng., acctnt.) Firm/plant
==============================================================
Around 1980:
The Party claimed 10% of the population as members;
The government-owned some 40,000 industrial, 30,000 construction, and 20,000 state farmers. Enterprises were grouped, by output type or geography, into Departments.
There were some 62 ministries; and
The economic bureaucracy employed some 18 million people.

26
Figure 1.3
The Central Economic Administration
27
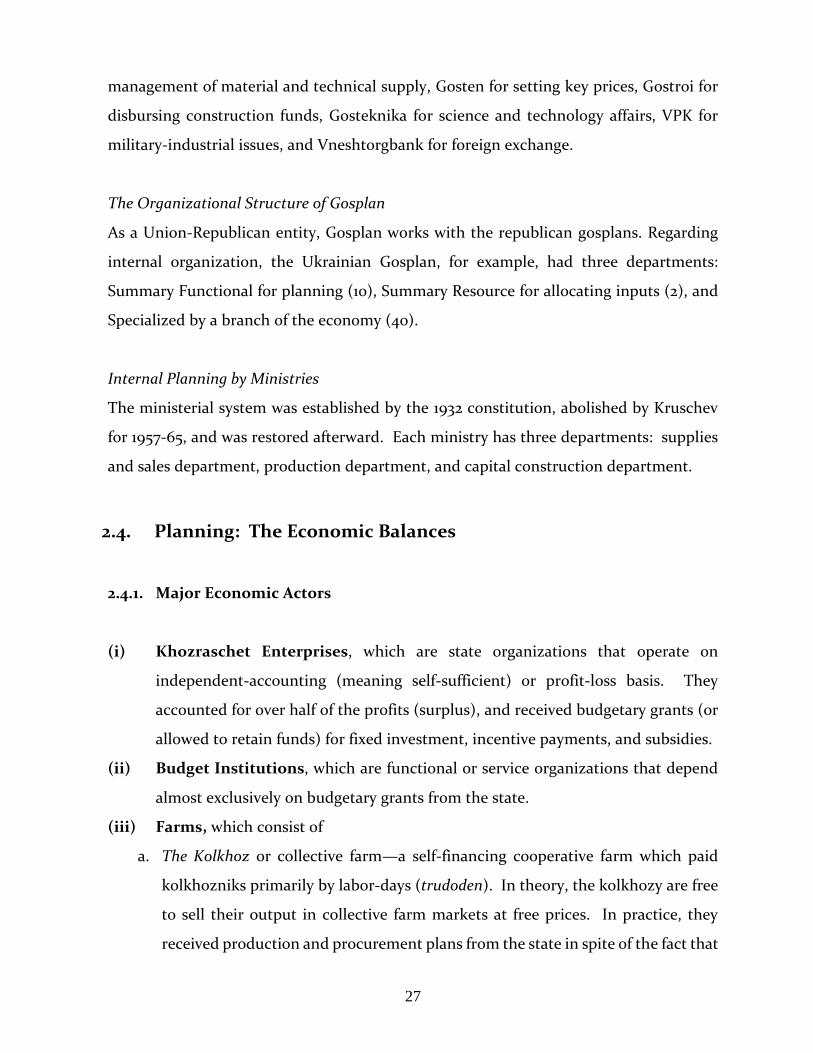
management of material and technical supply, Gosten for setting key prices, Gostroi for
disbursing construction funds, Gosteknika for science and technology affairs, VPK for
military-industrial issues, and Vneshtorgbank for foreign exchange.
The Organizational Structure of Gosplan
As a Union-Republican entity, Gosplan works with the republican gosplans. Regarding
internal organization, the Ukrainian Gosplan, for example, had three departments:
Summary Functional for planning (10), Summary Resource for allocating inputs (2), and
Specialized by a branch of the economy (40).
Internal Planning by Ministries
The ministerial system was established by the 1932 constitution, abolished by Kruschev
for 1957-65, and was restored afterward. Each ministry has three departments: supplies
and sales department, production department, and capital construction department.
2.4. Planning: The Economic Balances
2.4.1. Major Economic Actors
(i) Khozraschet Enterprises, which are state organizations that operate on
independent-accounting (meaning self-sufficient) or profit-loss basis. They
accounted for over half of the profits (surplus), and received budgetary grants (or
allowed to retain funds) for fixed investment, incentive payments, and subsidies.
(ii) Budget Institutions, which are functional or service organizations that depend
almost exclusively on budgetary grants from the state.
(iii) Farms, which consist of
a. The Kolkhoz or collective farm—a self-financing cooperative farm which paid
kolkhozniks primarily by labor-days (trudoden). In theory, the kolkhozy are free
to sell their output in collective farm markets at free prices. In practice, they
received production and procurement plans from the state in spite of the fact that

28
the collective farms are “owned” by their members, according to the 1935 Soviet
constitution. Output types, input types, sales and prices were all determined by
the State. Mr. Khrushchev was appalled enough by the living conditions on the
collective farms that he set minimum wages in 1965 and allowed limited freedom
to sell above-quota output in free markets. Consumer cooperatives were also
(mis)treated much the same way.
b. The Sovkhoz or State farms—large-scale farm managed by the state with
budgetary support and supervision by state agencies.
(iii) Non-planned and Less-planned sectors, which take one of the following
forms:
Private production—private plots, repair shops, personal services, etc.
Individuals could own such things as consumer goods, a house, livestock, tools
and small farm equipment, a car, savings account at the State Bank, government
lottery bonds, and currency. About a fifth of new housing construction private:
materials purchased from the state, labor provided by household, friends, and
moonlighting construction workers.
Private time use—consumption and home-based production. One productive
activity was the private plot: 0.5 to 3 acres; and, incredibly, produced a significant
fraction of the national agricultural output (1/3 of milk and meat consumed in the
Soviet Union, 70% of potatoes; 40% of fruit and vegetables). Moonlighting was
also permitted for doctors, artists and craftsmen, and construction workers.
However, it was not permitted for employment of a person by another, any
purchase with intent to resell at a profit, lending at interest, renting an apartment
from another, and renting a car from another.
These actors, under the direction of the COM and the Central Committee of CPSU
collectively oversee the drafting and implementation of various types of plans or
“balances.” A concise description of these balances follows.

29
The process of central planning bears only a faint resemblance with LAH. The Council
of Ministers and the Communist Party leadership set broad objectives and approve final
plan. The actual tasks of planning were conducted by several specialized planning
agencies. The State Planning Committee (Gosplan) was in charge of overall coordination
and planning of outputs and investment while the State Bank (Gosbank) was in charge of
planning and monitoring financial flows.
Soviet economic plans integrate the various dimensions of decision-making to ensure
efficiency and coherence. The Techpromfinplan (the technical-production-financial
plan) contains many balances, the most important of which are: material balances
(producer and consumer goods), labor balances, financial balances (fiscal and
monetary), and macro balances for the economy as a whole (Figure 1.4).
Regarding duration, there are annual plans, five-year plans, and longer-term perspective
plans. We will describe the annual plan with a focus on the material balances (or physical
budgets) and financial balances. But before I do that, let me introduce you to the major
economic actors in the Soviet economy.
The central planners know that they cannot oversee the planning of 24 million goods
produced by tens of thousands of enterprises. They, therefore, concentrate on key
product groups (vaguely defined) in the annual plan (AP) and the five-year plan (FYP):
1. Funded Commodities (2,000 in 1985) are the most important ones—Gosplan and
Gossnab.
2. Centrally Planned Commodities (18,000 in 1985) are also important—Gosplan,
Gossnab, All-Union Main Supply, and Sales Administration.
3. Decentrally Planned Commodities (50,000 in 1985) are left to the Republics and the
Ministries.
4. "Nonplanned" Commodities (26,000 in 1985) are the least important—ministries and
Glavki (mainly for internal use).

30
Figure 1.4
The Techpromfinplan

31
Figure 1.5
The Economic Balances

32
Even limiting themselves to Funded and Centrally Planned categories, the Plan was rarely
ready on time. In fact, in 1979, a decree was passed that mandated that the FYP be ready
1.5 years before the date of its implementation.
2.4.2. The Method of Material Balancing
The MBs are the physical budgets for key goods and services. They constitute the core of
Soviet-type economic planning. The major objective is to achieve consistency between
planned supplies and planned uses for each commodity group. Thousands of material
balances are constructed, each expressed in physical units (say, tons of steel). MB then
reconciles quantitatively the sources and uses for a product during the planning period.
Figure 1.5 lists the major Soviet economic balances.
The MBs were prepared for two major categories of products. The first is the balance for
consumer goods (industrial and food). The second, more important, is the balance for
producer goods (capital goods) produced by the various branches of industry. Balance
here means equality of sources and uses. This may sound like equilibrium between
supply and demand, but it is not. The procedure is purely administrative, i.e., without
the freedoms enjoyed by sellers and buyers in a free market setting.
The AP, being an operational plan, must be constructed in a manner that ensures
consistency with the FYP. A stylized description of the procedure for the drafting of
physical outputs and inputs for funded commodities will be useful here.
Consider a stylized model of the drafting of the plan for fiscal-year 2010 which took place
between May and December of 2009:
• Spring -- Directives
– The Council of Ministers, Gosplan, and the Politburo set aggregate growth
targets. Targets reflect goals of the current five-year plan and Gosplan’s

33
assessment of the feasibility of more ambitious targets. Because the
changes are often incremental, this is called ‘planning at the margin.’
– Directives (tentative plan assignments at highly aggregated level) are then
sent down to each ministry.
• Summer -- Input claims and bargaining
– each ministry makes up separate tentative output assignments by
disaggregating the targets for each of its departments, and each department
makes tentative output assignment for each of its enterprises.
– Based on the assigned target for output, each enterprise then requests
inputs from its department; each department aggregates input claims and
requests total from ministry; and each ministry makes its requests to
Gosplan.
– Intense bargaining takes place at each step as inferiors attempt to bargain
with superiors for easier output quotas or higher input allocations per unit
of output.
• Fall -- Balancing
– Gosplan and other planning agencies, having sent down targets and
received input requests needed to meet those targets, must now equate
total supply with total demand for each product.
• November and December -- Approval
– The final plan is submitted to Council of Ministers in November and
ratified by Supreme Soviet in December which renders it the law of the
land.
• December -- Disaggregation
– Gosplan sends each ministry its final plan; each ministry sends each
department its plan; and each department sends each enterprise its plan.
-- The State Committee for Material and Technical Supply (Gossnab) now
matches up supplying and customer enterprises for key product group by
simulating a market.

34
If you prefer jargon, the above-described procedure for constructing the annual plan
involves four key steps and 1.5 iterations:
Step 1—Retrospective Iteration. Directives are sent to ministries based on tentative
"control figures" or preliminary targets.
Step 2—Claims. The ministries disaggregate the control figures and send down the
orders. The enterprises respond with requests for the necessary inputs (indents or
counterplans, as they are sometimes called).
Step 3—Internal Iteration or Balancing. Gosplan, having sent down tentative targets
and received input demands needed to fulfill these targets, constructs a balance sheet of
sources and uses for each commodity. It applies a "correction principle" to balance the
two sides of the equation which often means the equality on paper is a forced one.
Step 4—Final Plan. The final plan is sent down to the enterprises. That means
enterprises are heard only once during planning which means that the plan cannot be
consistent.
Let us elaborate on step 3 since balancing (read: equilibrating) is the essence of planning.
Material balancing, for example, is a rule-of-thumb technique for bringing into balance
the sources of a good with its uses. It is less demanding than "input-output" analysis
which was also pioneered by Soviet planners. An army of workers for Gosplan relied on
two things to facilitate this daunting task. For one, a handful of people followed each
product group. This way, they managed to acquire enormous knowledge about specific
products (much like employees in the U.S. Department of Commerce). Secondly, it
helped that the economy was not dynamic—at least after 1960.
The Correction Principle is applied during internal iteration to ensure balance. There
are several options to undertake the adjustment exercises (see Table 1.1.):
i. Ask enterprises for an increase in planned output of Xi—over 90% of the
increase in supply is made this way,
ii. Increase imports—limited option in a foreign-exchange-constrained
economy,

35
iii. Reduce intermediate demand (Xij)—this norm tightening induces search
for poorer substitutes; under-fulfillment elsewhere,
iv. Reduce final demand (D)—low priority sectors such as consumption and
exports suffer, or
v. Deplete existing stock (V)— a useful option when large inventories exist;
allocation to favor priority sectors.
In sum, the most important source of adjustment is on the demand side for several
reasons. First, the consumer sector is the "buffer" since user-sovereignty does not exist
in a planned economy. This reduces social welfare while producing “paper balances.”
Second, planners can demand, often unrealistically, greater productivity from producers
by insisting on lower input use (reducing intermediate inputs) per unit of output. This is
called “norm tightening” and can reduce the quality of final products (shoddy goods are
the norm, especially for consumption). In the end, infeasible plans fail to meet the quota
for low-priority goods. Centrally planned economies are often called “shortage
economies” where producing shoddy goods is common. The planners might argue that
pressure planning is a workable strategy for an industrializing economy. There is
obviously great pressure on the government to create jobs even if it means lower quality
goods and circumscribed individual freedom—the obligation to work must be matched
with the right to a job.
The alternative, increasing the supply of the good that is in great demand, also leads to
several problems in a CPE without much slack due to feedback effects. Asking for an
increase in the supply of good “i” means planned quotas for other sectors will have to be
revised simultaneously because an upward revision in one sector changes intermediate
demand for the outputs of all related sectors. This is because an industrial economy has
dense intersectoral linkages. This helps explain why the Soviet economy became highly
vulnerable to disruption accompanying reform compared to the less industrialized (more
cellular) Chinese economy.

36
Table 1.1
A stylized description of MB as a double-entry accounting system
Available Sources of Product: Xs Required Uses of Product: Xd
X1 + V1 + M1 = X11 + X12 + ... + X1n + D1 . . . . . . . . . . . . . . . Xn + Vn + Mn = Xn1 + Xn2 + ... + Xnn + Dn where: X = current production V = beginning stocks or inventories M = imports D = final demand (domestic plus export plus ending stocks)
The material balance equation is: Xi = jaijXj +Di where aij are input-output coefficients.

37
2.4.3. Input-Output Analysis
The appropriate iterative method for taking full account of these direct and cascading
indirect effects is the Method of Input-Output analysis. The input-output (IO)
technique makes the following assumptions: constant returns to scale in technology (to
double output requires doubling of all material and primary inputs), zero substitutability
of inputs, and no joint output.
These rigid assumptions are realistic only for short-term planning where the primary
concerns are consistency and detail. For illustrative purposes, let:
aij = xij/Xj (1)
where xij = the amount of input i used in industry j. Xj = the total output of industry j
[aij] = A = matrix of input-output norms or coefficients.
xij = aijXj (2)
Summing over equation (2) and adding final demand (Y), we derive the relationship
ΣaijXj + Yi = Xi (3)
Rearranging terms in (3) yields
Yi = Xi - ΣaijXj (4)
Equation (4) expresses the basic relationship among final demand (Y), intermediate or
interindustry demand (ΣaijXj), and total production (X). This basic relationship can be
more conveniently expressed in matrix notation as follows:
X = AX + Y (3’)
Or by rearranging terms:
Y = (I –A)X (4’)
The balance equation for each sector then becomes:
X = [I-A]-1 Y (5)
where: I = identity matrix of 1’s
X = a vector of planned outputs A = the matrix of direct technical coefficients Y = a vector of final outputs [I-A]-1 = Leontief Inverse matrix of direct and indirect coefficients.

38
Table 1.2.

39
If the matrix of technical coefficients (A) is known to the central planner, then the
feasibility of a given vector of plan targets or control figures (X) can be readily determined
by matrix multiplication. The central planners may, of course, not know A (information
constraint) or find the inversion of the Leontief matrix computationally difficult—though
no longer a problem in the age of fast computers. Even if the focus of the planners should
change, knowing any two of the three components of this relationship makes it easier to
determine the third component. Refer to Table 1.2 for details.
The following observations hold regarding the comparative features of the methods of
material balancing and input-output planning.:
1. Consistency and Optimality: Unlike IO, MB cannot produce consistent plans (since it
ignores indirect effects) or to test the sectoral implications of changing output targets.
2. Physical Output: Unlike the focus on value and sector for IO, MB focuses on physical
targets and administrative unit.
3. Pressure Planning: In conjunction with 'taut planning" or quantity drive, MB permits
priority planning. However, the mobilizing effect has an underside: it creates
dysfunctional behavior (exaggerating input needs and hiding output capacity) to
produce chronic shortage, soft budgets, and disruptive storming.
4. Bias against Change: The introduction of new products and new sectors creates
problems for the system. Both IO and MB assume constant returns to scale and no
substitutability among inputs. Updating the IO coefficient every 5 or 10 years is also
expensive.
It is not surprising, therefore, that there is a great need for continual intervention at the
stage of plan implementation since the "paper perfect" balances are products of forced
equality. The unrealism becomes self-evident in the implementation stage, as planners
are forced to play fire fighter.
This is, in part, why Soviet planning is rightly characterized as planning-cum-
improvisation. While this approach is woefully inadequate for a dynamic economy,
40
planning at the margin is a workable proposition for a stagnating one. What is good for
planners is not necessarily good for workers or even Party bosses!
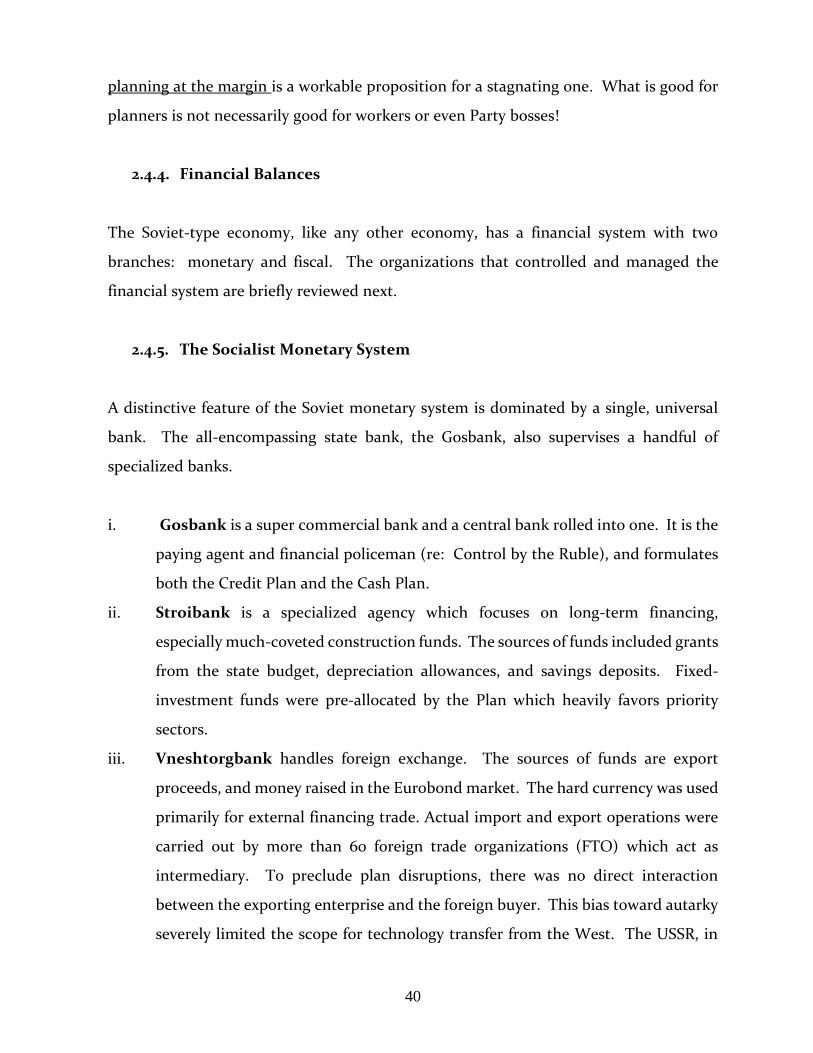
2.4.4. Financial Balances
The Soviet-type economy, like any other economy, has a financial system with two
branches: monetary and fiscal. The organizations that controlled and managed the
financial system are briefly reviewed next.
2.4.5. The Socialist Monetary System
A distinctive feature of the Soviet monetary system is dominated by a single, universal
bank. The all-encompassing state bank, the Gosbank, also supervises a handful of
specialized banks.
i. Gosbank is a super commercial bank and a central bank rolled into one. It is the
paying agent and financial policeman (re: Control by the Ruble), and formulates
both the Credit Plan and the Cash Plan.
ii. Stroibank is a specialized agency which focuses on long-term financing,
especially much-coveted construction funds. The sources of funds included grants
from the state budget, depreciation allowances, and savings deposits. Fixed-
investment funds were pre-allocated by the Plan which heavily favors priority
sectors.
iii. Vneshtorgbank handles foreign exchange. The sources of funds are export
proceeds, and money raised in the Eurobond market. The hard currency was used
primarily for external financing trade. Actual import and export operations were
carried out by more than 60 foreign trade organizations (FTO) which act as
intermediary. To preclude plan disruptions, there was no direct interaction
between the exporting enterprise and the foreign buyer. This bias toward autarky
severely limited the scope for technology transfer from the West. The USSR, in

41
effect, had export (natural resources)-import (manufactures) patterns that
resembled those of a developing country.
The monetary side of the Soviet financial system is rather primitive even by the standards
of low-income developing economies. Being underdeveloped and designed to serve a
system that was oriented toward physical quantities, the monetary regime had the
following distinctive features:
• Currency was used between individuals, and between enterprises and individuals
whether it involves legal sales or wage payments;
• Credit/debit entries at Gosbank were used for transactions between enterprises;
• Gosbank was responsible for issuing just enough currency for intended
transactions to avoid inflation.
• State banks served as a control agency since all deposits must be at government
banks, and all transactions between enterprises must be through bank accounts.
This made it hard, but not impossible, for enterprises to hide transactions at least
in the above-ground economy.
The fiscal side of the Soviet financial system was also distinctive in several respects. The
ministry of finance (Minfin) is more powerful than Gosbank. That is, fiscal authorities
who control the state budget (gosbiuzhet) hold the power of the purse over all
khozraschet and budget enterprises. It is as if the U.S. Treasury calls the shots, and the
Fed is engaged in unglamorous housekeeping.
Let us now return to financial planning. The monetary system worked through three
channels:
The Cash Channel which consists of: passive (accounting or transfer) money in
the hands of the state institutions, and active money (mostly cash) at the disposal
of households and coops.

42
Money (ruble) is non-convertible which means that holders of ruble cannot walk
into a Soviet bank and convert it into a foreign (hard) currency on demand. There
is another sense of non-convertibility we will discuss in class—that just because
you have rubles does not necessarily mean that you can convert it (buy) into a
good or service in a shortage economy. In other words, “shopping power” is much
lower than “purchasing power” under socialism. In market economies,
households and firms have access to credit which augments their purchasing
power which equals their shopping power. This why, unlike socialism, capitalism
is prone to credit-driven asset bubbles and excessive involuntary unemployment.
The Credit Channel whereby short-term loans are issued by a state bank to a state
enterprise typically against unsold inventory. This is known as the "real bills
principle." One enterprise is NOT allowed to lend cash or extend credit to
another; otherwise, the plan risks disruption.
The Foreign Exchange Channel consists of foreign exchange earnings being
distributed to authorized enterprises to permit imports of critical inputs or highly
sought after consumer goods especially for cardholding members of the
monoparty.
The financial balances (FB) then consist of several inter-related balances, the most
important of which are: (a) the balance of income and expenditure of the state, (b) the
state budget, (c) balance of income and expenditure of the ministries, (d) credit plan, and
(e) balance of money and income of the population.

43
A. Balances of Khozraschet Enterprises:
Cash revenue = budgetary grants + profits + planned credit (1)
Expenditure = costs of production + taxes + retained surplus (2)
Balance: revenue = expenditure (3)
Reality: S (savings) < I (investment) which triggers:
soft budget interventions,
invoking political connections which matter greatly.
B. Balance of money income and expenditure of the population
Cash Income = Wages + Profits – Net Tax Payments (1)
Cash Expenditure = Consumption + Investment (minor) (2)
Balance: Income = Expenditure (3)
Reality: S > I which, to avoid inflation and illegal activity, calls for:
bloating bank savings (i.e., purchasing power > shopping power)
purchase of state bonds, but not always successful due to
a large cash-based underground economy to acquire goods or services.

44
Credit Balances:
i. The Cash Plan: focuses on the economy-wide cash flow into and out of banks.
Gosplan draws it up in cooperation with Gosbank and Minfin. It balances withdrawals of
cash from circulation (cash income) and injection of cash into circulation (cash
expenditure):
Inflows: Sales revenue + saving deposits + taxes on individuals (1)
Outflows: Compensation of employees + state purchases from
non-state + withdrawals of savings by the public (2)
Balance: Inflows = Outflows (3)
ii. The Credit Plan: authorized credits extended and repayments involving
financial institutions (gosbank, stroibank and vneshtorgbank)
Sources of Funds:
budgetary deposits + money in transit + nonstate deposits + self-owned
enterprise deposits + foreign deposits and loans (1)
Uses of Funds:
Loans to enterprises and institutions + cash in the hands of the public +
foreign exchange payments (2)
Balance: Sources of funds = Uses of funds (3)
o No inter-enterprise credit is permitted although delayed payments(arrears) are a de facto interest-free loan.
o Although credit is supposed to be pre-authorized to smooth out cash flow problems (working capital), the demand for credit is both insatiable (due to soft budgets) and endogenous (above-expected bonus, or unrealistically high production quota).
45
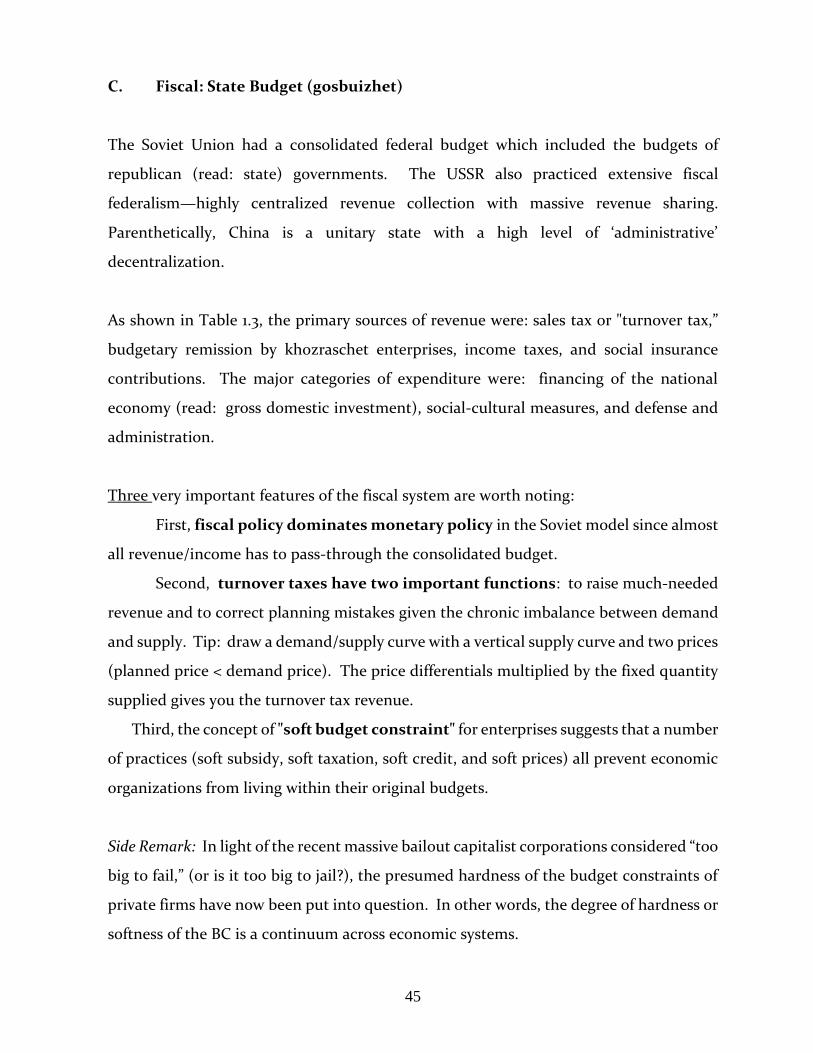
C. Fiscal: State Budget (gosbuizhet)
The Soviet Union had a consolidated federal budget which included the budgets of
republican (read: state) governments. The USSR also practiced extensive fiscal
federalism—highly centralized revenue collection with massive revenue sharing.
Parenthetically, China is a unitary state with a high level of ‘administrative’
decentralization.
As shown in Table 1.3, the primary sources of revenue were: sales tax or "turnover tax,”
budgetary remission by khozraschet enterprises, income taxes, and social insurance
contributions. The major categories of expenditure were: financing of the national
economy (read: gross domestic investment), social-cultural measures, and defense and
administration.
Three very important features of the fiscal system are worth noting:
First, fiscal policy dominates monetary policy in the Soviet model since almost
all revenue/income has to pass-through the consolidated budget.
Second, turnover taxes have two important functions: to raise much-needed
revenue and to correct planning mistakes given the chronic imbalance between demand
and supply. Tip: draw a demand/supply curve with a vertical supply curve and two prices
(planned price < demand price). The price differentials multiplied by the fixed quantity
supplied gives you the turnover tax revenue.
Third, the concept of "soft budget constraint" for enterprises suggests that a number
of practices (soft subsidy, soft taxation, soft credit, and soft prices) all prevent economic
organizations from living within their original budgets.
Side Remark: In light of the recent massive bailout capitalist corporations considered “too
big to fail,” (or is it too big to jail?), the presumed hardness of the budget constraints of
private firms have now been put into question. In other words, the degree of hardness or
softness of the BC is a continuum across economic systems.

46
Table 1.3
The Consolidated State Budget of the USSR
Items (%) 1940 1950 1960 1970 1978
REVENUE from Social Sector:
Tax receipts (turnover) 59 56 41 32 32
Surplus transfers (SOEs) 12 10 24 35 30
Social insurance 5 5 5 5 5
Miscellaneous 19 20 23 20 25
REVENUE from Private:
Taxes on population 5 9 7 8 8
Total Revenue: 100 100 100 100 100
EXPENDITURES:
Investment 33 38 47 48 54
Social expenditure 24 28 34 36 34
Defense 33 20 13 12 7
Administration 4 3 2 1 1
Loan service 6 11 4 3 4
Total 100 100 100 100 100

47
D. Other Balances
(i) Macroeconomic Balances
GMP: Y = C + I + G + NX
where Y = GMP, C = private consumption, I = gross investment, G = government
consumption, and NX = net exports.
To get a better intuitive sense of the financial side of the planned economy at both the
micro level and the macro level, consider the following macro model of the flow of money
and credit in a Soviet-type CPE.
Let:
X = flows between Ministry of Finance and state Enterprises
Y = flows between state banks and enterprises
Z = credit from state banks to the non-state sector
d = above-plan credit
As you can see in Figure 1.6, the state budget in a typical “Peoples Democracy” accounted
for over half of GMP. The State derived some eighty percent of its resources from profit
remissions by state enterprises (taxes on profits). Enterprises are self-financing and 95%
of GMP goes through them in contrast with 60% of households.

48
Figure 1.6
The Flow of Income and Expenditure in a Prototypical CPE
Regarding the credit side of the “real” economy, a couple of observations are in order: (1)
The funds “K + d” at the disposal of state enterprises are greater than reimbursements by
an amount “d,” since in an expanding economy, additional needs for working capital must
be met. A small amount of credit “Z” is granted on a low-priority basis to consumers,
private artisans, and private farmers.
Since money is largely "passive" in this quantity-driven and largely closed economy,
macroeconomic stability is not of major concern. Inflation is low (or repressed, as some
would say); so is unemployment (in part due to labor hoarding, as some would note).
Given the prevalence of the soft budget constraint, investment cycles are common and of
great concern to planners. The existence of insatiable demand for credit by state

49
enterprises became rather evident in the early 1990s as a result of the collapse of Party
discipline from above while the market discipline from below has yet to be built up—
neither the visible hand nor the invisible hand was in sight, so to speak.
(ii) Prices
Economic theory tells us that rational prices (whether determined in contestable markets
or accurately calculated by planners) serve several purposes: (a) as measure of value
(aggregation and comparison of outputs, calculation of revenues, input costs, and
national product), (b) as distributor of income (workers paid money wages, money
bonuses, and households spend their incomes on goods and services), and (c) as
storehouse of value for future consumption.
Gosten, the state committee on prices, determines the prices of funded and centrally
planned goods and services. The typical method is cost-plus pricing. Enterprises report
their cost-per-item, often inflated, and Gosten is supposed to figure out their true per
unit cost (say, based on the cost of the most efficient enterprises in the industry) and then
add a certain markup (depending on the importance of the product and the political
influence of the firm).
Managers played this game very well by overstating production cost, introducing brand
new products to obtain high prices or repackaging old ones as new with only marginal
improvements. In the case of novel products being introduced, Gosten has no other
references to fall on. Gosten obviously knows all about this game, and haplessly resorted
to intense auditing.
A hypothetical cost-plus pricing scheme for consumer goods looks something like this:

50
Input cost = 40 rubles
Factory price = 45 (5 markup) rubles
Industry price = 80 (35 turnover tax) rubles
Wholesale price = 85 (5 wholesale and transport margin) rubles
Retail price = 100 (15 retail margin) rubles.
(iii) Labor Balances
The labor balances refer to the supply and demand for various skills, and the
wage/compensation bill. To get some sense of the way the labor “market” works under
central planning, you will want to keep the following considerations in mind:
a) All able-bodied adults were expected to work full time,
b) Planners had variety of ways to channel workers into planned jobs (system of
differential wages, control of occupational training, placement services, residence
permits, and control of housing availability,
c) Despite some frictional unemployment, there was unprecedented job security—
what the Chinese aptly call the “iron rice bowl,”
d) There was evidence of some structural unemployment (mismatch between skills
and employment opportunities, tended to be a greater problem with wives seeking
jobs in light industry and service sectors in areas where most jobs were in mining
or heavy industry, and
e) A fair amount of labor hoarding existed, especially for scarce skills.
Wages were determined by several factors. Engineer’s pay was, for example, double that
of retail clerks, skill in the highest tier of an occupation earned double the lowest grade,
and managers competed for workers by manipulating scales. Non-wage incomes were
secondary but not unimportant (interest from savings account, second economy income,
transfers and publicly provided free goods such as education and health care—both
provided at the enterprise level). Transfers such as pension did matter(retirement for
men at 60 after at least 25 years work and retirement for women at 55 after at least 20

51
years work), as did other transfers (paid maternity leaves, survivor benefits upon death
of spouse, sick leaves, child allowances, and income supplements for the poor).
(iv) Investment Balances
The most contested part of the planning process is the allocation funds for long-term
investment, i.e., production of capital goods. Gosplan and the political leadership decide
on investment’s share of national product, distribution of total investment by industry
and region, and design of investment projects based on cost minimization. However,
true economic costs could hardly be minimized because prices do not reflect scarcity.
A simplified account of how the annual investment plans for the expansion of existing
capacity are drawn goes something like this:
1. Decisions are recommended by project-making organizations (which are attached to
the ministries), R & D institutes, engineering design organizations, and construction
engineering organizations. Because of the aversion of managers to innovation,
technical improvements had to be force-fed from outside the firm. In other words,
innovation by firms was supply driven.
2. Choice among Sectors: For the choice between C-goods and I-goods, the criteria are
maximization of surplus (favors capital-intensive) and employment.
3. Choice among Projects: (a) same output capacity but different projects—use
cost/benefit analysis; and (b) different sectoral output and different projects—use
economy-wide "norms" to compare the coefficients of relative effectiveness, [CRE =
(Va – Vb)/(Ib - Ia)] that would minimize outlay (I) and operating cost (V).
Parenthetically, building an empire was a time-honored strategy of Soviet mangers—or
anyone in a bureaucratic setting where gigantism is an ideal. Soviet managers routinely
solicited funds for new construction before they even finished the buildings they have
already started. The individually rational but socially irresponsible strategy is designed
to obtain as many commitments as possible.

52
No wonder that the run-in time for construction was four times as long as in the West.
It took about ten years to build a factory in the USSR. Given this incentive environment,
would you as manager of a state enterprise behaved any differently?!
Constructing a feasible, consistent and optimal plan is just the lesser of the twin tasks of
planning. The harder and more important task looms large at the stage of plan
execution—our next topic. You should read Roland (2014), ch. 8, before proceeding.
III. The Soviet Model: Plan Implementation
To understand the behavior of planners, ministries and managers concerning the
implementation of the annual plan, we need to have a good understanding of how the
traditional socialist firm differs from the traditional capitalist firm.
We must rely on Janos Kornai's pioneering work in the economics of shortage. Kornai
characterizes the classical socialist firm as follows:
(1) it is resource constrained (excess demand for investment) rather than demand
constrained (capitalist);
(2) it has a soft budget constraint (rarely becomes insolvent or goes into bankruptcy)
rather than a hard one (capitalist). In other words, the firm has an insatiable demand
for credit;
(3) its production plan is directive (prescribed by superior authority) rather than
autonomous (capitalist); and
(4) it operates in a seller's market and rations by queues rather than operating in a buyer's
market and rationing by the purse (capitalist). Since shortage is chronic, the
traditional socialist firm resorts to forced substitution (thereby lowering quality and
engaging in storming), forced change of output mix (assortment problem), and
downright failing to fulfill the plan targets (thus accentuating the shortage for
multiple users).
53
Side Remark: According to one guesstimate, Soviet citizens devoted 65 billion man-hours
of shopping time (chasing scarce goods) annually which amounted to 32 million man-
years (or 25% of the labor force)! If you were a retiree, how would supplement your
meager pension in a shortage economy?
3.1. Plan Execution and Enterprise Incentives
Polish joke: “They pretend to pay us, and we pretend to work.”
Russian joke: “Life is miserable. Thankfully, it is rather short.”
In the imperfect world of Soviet planning, the plans are inevitably inconsistent and/or
deliberately over-ambitious, and the incentive to implement them faithfully is often
weak. To understand the behavior of the major actors, we need to step-back a bit and
take a look at incentives. Economics is all about incentives, after all.
Remember that state enterprise management is dominated by the director, executives in
charge of material supply, labor, production, and accounting, superintendents of
production units, and foremen. The representative of the communist party plays an
important decision-making role in key state enterprises. Finally, the head of a unit shares
management responsibilities, more in eliciting worker discipline rather than defending
worker rights.
Regarding the enterprise plan, recall that the Soviets referred to the Khozraschet
enterprise as “economically accountable.” It is a legal entity with own fixed capital and
funds provided by budget grants, own account at State Bank with the right to borrow
additional funds from the Bank, expected to enter into contracts with suppliers and
customers in accordance with plan, and expected to earn a profit most of which was to
be handed over to Ministry of Finance.

54
The enterprise received a detailed plan specifying several indicators of success (input use,
prices, and output assortment and quality) as well as the industrial wholesale prices.
These plans were very demanding or over-taut meaning that it was often impossible to
achieve production and investment assignments with the resources allocated, and
resources allocated often turned out to be unavailable.
3.2. Behaviral Rules
Full rewards critically depended on plan fulfillment. Managerial incentives were
predominantly material (high salary, prospect of large bonus, prospect of promotion for
good performance, and the prospect of demotion for poor performance). Non-material
incentives also mattered and took such forms as power, status, and recognition.
Managers of enterprises, therefore, had to respond to a number of problems: insufficient
deliveries of input allocations, last-minute deliveries, delivery of shoddy or wrongly-
specified parts, falling inventories, and inability to meet the output quota.
Enterprise's responses to these concerns include: request for help from the industrial
ministry, vertically integrate production at the cost of efficiency, and substitute lower-
quality inputs or over-produce lower-quality output, and lower targets for unsuccessful
plants while demanding above-plan output from successful plants with the aim of cross-
subsidization under the table.
Managers informally bargained with superiors, understated enterprise potential to stem
future ratcheting, tried to stash concealed inventories of outputs and inputs (hoarding or
reserves exacerbates the chronic shortage), scouted the second economy for critical
inputs or higher-price sales, restricted specialization to reduce vulnerability that comes
from dependence on others, restricts innovation which entails uncertainty, and
encourages false reporting. Fast approaching deadlines caused storming or last-minute
spurt of activity as period nears end; and lethargy when it becomes obvious that targets
won’t be met.

55
The economic ministry, on the other hand, saw its primary objective as one of
guaranteeing industry-wide plan fulfillment rather than enterprise-specific ones per se.
Accordingly, ministers and division heads engaged in such things as reallocating
targets—higher targets for successful enterprises and lower targets for unsuccessful ones,
providing critical inputs from reserves, and lobbying party officials to intervene especially
in cases of untimely delivery of inputs.
The central planners, in turn, engaged in fire fighting as the inconsistencies and
unrealism of the plan are magnified by the poor motivation of the line ministries and
enterprises. They improvised by directly interfering with enterprise operations including
by changing assortment or permitting input substitution, and reallocating plan targets
and inputs when enterprises are clearly in financial trouble. That is why Soviet planning
is sometimes labeled "planning-cum-improvisation." In effect, there are two plans—
the officially published one and the unofficial (improvised) one.
3.3. Motivaion and "Success Indicators"
There are three basic ways to motivate enterprises and workers to make a faithful effort
to implement the plan: identification with the job, hierarchical dependence facilitating
pressure from above (vs. hierarchical consultation), and material incentives. All three
were used in tandem, but it should not surprise one to know that material incentives were
the most important even in a socialist economy that denigrated them ideologically.
The theory of agency is relevant here. A basic problem of bureaucracies, government as
well as corporate, is that the narrow self-interests of owners/superiors (principals) and
workers/inferiors (agents) are often in conflict. Principals must devise a mechanism, a
win-win system, for motivating and monitoring agents to minimize shirking, corruption,
or sabotage. The agency problem, in effect, has three dimensions: measurable indicators
of success/outcome, monitoring effort, and rewarding good behavior/punishing bad
behavior appropriately.

56
In order to use material incentives effectively, one has to have an effective system for
monitoring managerial and worker effort and performance. The challenge of devising
robust performance criteria is often known as the "success indicator problem" in the
literature on Soviet planning. The SIP disappears if planners had one transparent and
measurable target and they devised an effective motivational strategy to maximize it. In
practice, Soviet planners preferred physical output as the premier target (and managers
knew it!) and used pressure to maximize it.
There are a number of issues surrounding SIP. Consider the following three examples:
(i) Ambiguity of messages conveyed by the Plan—accuracy, aggregation and
disaggregation are problems that lend themselves to opportunistic behavior
with gall.
(ii) Multiple, conflicting goals—the Plan has quantitative targets, assortment
targets, quality targets, delivery schedule targets, etc. Since these tend to be
overly ambitious and often inconsistent, it is difficult to see which ones an
enterprise manager should choose in order to minimize penalty or maximize
reward.
(iii) Effective control of rewards—even after determining the size of the bonus,
the central planners are tempted to interfere paternalistically. They tell
enterprises how to use their hard-earned bonus money: consumption versus
investment, private consumption versus collective consumption, etc.
To understand the dilemma faced by the planners in Gosplan and the various ministries,
consider the list of post-1965 success indicators, most of which conflict with each other:
A. Output Plan
Val (value of gross output)—leads to use of dearer inputs, selection of
dearer outputs, and production of unsalable junk for the storeroom.

57
Normed net output (value added)—the need to distinguish between
"actual" and "ideal" means that two prices have to be fixed for each product
(not to mention input prices). While this discourages the use of expensive
inputs (the problem with the Val indicator), it nonetheless imposes a huge
computational burden involving millions of goods.
Volume of output—the traditionally favored yardstick, especially with
some (unknown) adjustment for quality and assortment.
Sales Revenue—designed to ensure that delivery contracts are fulfilled.
No unsold and unfinished goods would count.
Fulfillment of planned delivery contracts—due to the enormous
problems associated with a last-minute storming, great emphasis is placed
on this indicator.
Tasks for the introduction of a new technique—to encourage genuine
product or process innovation in a risk-averse environment.
B. Labor Plan
Total wage bill—minimize the cost of labor by effectively imposing a
maximum on the numbers of workers employed as pay rates or wage tariffs
are fixed officially.
Increase in labor productivity—often in percentage terms.
Norm for unit labor cost—wage increases to be justified by productivity
increases.
C. Financial Plan
Total profit—no need to comment, except to say that "profit" does not
mean much in the absence of scarcity (market or shadow) prices.
Cost reduction—using norm tightening, i.e., less input use per unit of
output. Operating surplus is probably a better label.

58
The last legal pronouncement on the subject, in 1986, had just three indicators: planned
contractual delivery, physical volume, and normed value added.
3.4. Incentive Funds and Bonus Functions
It is often argued, perhaps unfairly, that Soviet planner had an all-or-nothing attitude
toward bonus—100% plan fulfillment yielded a bonus but not a 99% fulfillment rate. In
reality, degrees of success mattered, but one’s political network influenced the degree of
penalty or reward.
Assuming the complexity imbedded in the multiplicity of indicators is somehow
reconciled with the help of appropriate weights, we can formulate, at least theoretically,
the optimal performance-reward relationship in the form of a bonus function.
Consider a simplified version of a bonus determination formula proposed by Martin
Weitzman of MIT to avoid the infamous "ratchet effect" of Soviet planning:
B = β0 Vp + β1 (Va – Vp)
where B = bonus amount in rubles, β 0 = basic norm (bonus coefficient), β 1 = over-
fulfillment norm, Vp = planned value of output, and Va = actual value of output.
We are assuming here that V is both a fund-forming indicator and a base indicator (see
below). It is easy to add other indicators (profit targets, sales targets, etc.) to the above
formula. Ideally, the coefficients should be stable for some years to ensure that exceeding
targets pays off to managers and workers year after year.
However, in an environment of “low trust” and deep-seated authoritarianism, superiors
were routinely tempted to ratchet-up the requirements for obtaining the basic bonus
from year to year. This, of course, encourages firms from deliberately understating their
59
true capacity for fear of being expected to deliver more to receive a given amount of bonus
(see Figure 3.1). This behavior, induced by planner behavior, becomes self-fulfilling.
The problem goes beyond the lack of a pre-commitment to a stable bonus formula. As
noted earlier, the Planners (or the Party) also mandated the use of the earned bonus itself!
The incentive funds are financed out of net profits (normative profits plus bonuses due
to over-fulfillment) after the firm makes its normative (expected) budgetary
contributions (taxes on assets, rent, etc.) to the federal budget.
The bonus, B, is then divided into three types of incentive funds: the material incentive
fund, the social-cultural incentive fund for collective consumption (30-50% of total), and
the production development incentive fund for additional investment. Worker bonuses
come out of the wages fund (average wage x number of workers) which is strictly
controlled to avoid "wage drift." Bonuses constituted a significant fraction of the income
for managers and workers (30-50%) not to mention its role in increasing income
inequality. Soviet income distribution was no more egalitarian than that of capitalist
Scandinavia.

60
Figure 3.1
The Ratchet Effect
Note: What produces the ratchet effect is the downward shift in the bonus function from F0 to F1. One
has to achieve 120% of the old quota just to earn the same bonus. Such a shift was declared illegal but
hardly enforced.

61
The procedure for determining the size of the bonus, which comes out of the enterprise’s
surplus, involves five steps:
1. Fund-forming (or Success) Indicators are chosen first (such as output, productivity,
% of the highest-quality grade, etc.).
2. Base Indicators are then selected. Usually tied to total profits or the wage fund
(which unfortunately encourages hiring too many workers!).
3. Norms (betas) are then established as % of the base indicators to arrive at an
unadjusted bonus amount (B). These norms are supposed to be differentiated but
stable for the duration of the FYP.
4. Fund-correcting Indicators are established to penalize failure to meet one or more
key success indicators (such as delivery or sales, or % of the lowest-quality grade
in total output).
5. Rules for Disbursement to individuals of the material incentive fund—usually based
on individual and brigade performance.
3.5. The Second Soviet Economy
The Soviet economy was a dual economy. The biggest component was above ground—
the de jure economy which included the planned economy and the non-planned
economy. Let us call this the “first economy” comprising activities that are planned or
legal, and intended for public or private gain. Then there is the smaller but important
underground economy—a de facto subterranean economy. Let us call this the “second
economy” comprising of activities with different degrees of legality but intended
primarily for private gain. These activities are variously estimated to account for 10-30%
of Soviet GMP.
Assume for our purposes here that the Soviet second economy combines two sub-
economies that are not formally planned: the shadow market (legal and semi-legal)
economy and the underground market (illegal) economy. The second economy is

62
actually complex or multicolored ranging from white markets to black markets (see Table
3.1. ). The second economy is not unique to socialist countries—it is quite sizeable in the
West as in the U.S. (10%), Germany (15%), and Italy (30%).
In order to understand the role of the second economy, we must abandon the untenable
puritanical notion that there exist “pure” economic systems—capitalist economies
without planning, and socialist economies without markets. What we observe in reality
is different and ever-changing mixes of arms-length market exchange and centralized
planning. In other words, IBM is an internally planned corporation that also competes
in horizontal markets externally. With the demise of the USSR, the Pentagon moved up
one notch to become the largest centrally planned military-industrial complex in the
world!
The USSR had significant market activity—legal, semi-legal, or illegal. Enterprise-
enterprise, enterprise-collective, enterprise-household, and household-collective
economic relations were also market-like or “horizontal.” They took three forms: (1)
rationing according to the Plan (you buy authorized quantities at official prices), (2)
market exchanges (buyers and sellers negotiate prices and quantities), and (3) communal
transfers (free acquisition or besplatnyi).
How can we then talk of markets in a system that supposedly went out of its way to
suppress them? Consider the following ideas about “market colors” in the Soviet
economy.
1. Legal Markets that are designed to meet the diverse needs of households and
enterprises:
a. Red markets where prices are determined by planners centrally
b. Pink markets where participants have some freedom to alter official
reference prices
c. White markets where participants freely and jointly set prices.
d. Semilegal Markets that are designed to correct over-tautness and other
planning deformities. Let us call them Gray Markets where transactions

63
are illegal, but tolerated by the authorities because they are useful for the
first economy.
2. Illegal Markets that are actively discouraged or suppressed
a. Brown markets where penalty is less severe than criminal prosecution
b. Black markets where the penalty is a criminal prosecution.
The horizontal interactions, through these multicolor markets by sellers and by buyers,
of the three economic entities (Enterprises, Collectives, and Households) yields nine
possible economic nexuses (see Table 3.1)
A. The Shadow Market
The shadow economy is the legal and semi-legal market economy where benign plan
violations take place—activities that are wholly tolerated, even encouraged, by the
authorities. These involve the state sector engaging in non-authorized hoarding or
changing the commodity assortment of the plan to sell the extra output in the de facto
market economy. It also includes informal production and exchanges among households
and cooperatives—personal services, food production, subletting of apartments, etc.
Why and how do state-owned enterprises engage in the shadow economy? SOEs make
use of "tolkach" (expediters or pushers) on their staff to scour the informal economy for
the following reasons:
1. Procuring Critical Supplies. Given the pervasiveness of shortage, low quality
of goods and delivery problems, diligent socialist managers may engage in
semi-legal activities in order to fulfill the plan. They use the

64
Table 3.1
The Matrix of Horizontal Interactions in the Soviet Economy

65
four "b"s to achieve these goals: barter, black market, blat (personal connections), and
bribe.
2. Rent Seeking. Managers may more than compensate for the loss of bonus by
diverting high-quality goods to the informal markets which often pays higher
prices. The cash thus raised can be used to purchase inputs that are
insufficiently provided by the plan while a portion is shared among colluding
Party officials, workers, and managers—all under the table.
The economic effects of these activities, on the whole, are good for the system: they help
correct plan disproportionality. They also redistribute income toward enterprising
groups (good) and to politically connected individuals (bad). Finally, these activities
introduce statistical distortions—the living standards in the socialist countries tend to be
grossly understated because of the large size of the underground economy and the
undervaluation of many services in the above-ground economy.
B. The Underground Market
This illegal part of the second economy encompasses activities that involve breaking the
law solely for private gain. They involve three activities: illegal production with state
property, illegal production with private property, and illegal distribution of state
production.
IV. Reflections on the Shortage Economy and Transition
With the help of the theory of economic systems and insights from some 25 years after
the demise of central planning, we are in a better position to appraise the performance of
Soviet-type economies. As underscored above, the classical socialist economy had three
basic features: (1) predominance of state property under the control of a single Marxist-

66
Leninist Party, (2) central planning of major economic decisions in an autarkic
environment, (3) propensities toward super-industrialization, (4) quantity drive and
bureaucratic perfectionism or paternalism, and (5) unprecedented equality and job
tenure.
4.1. How Shortage Breeds Shortage
According to Janos Kornai, the Soviet-type shortage economy was caught up in a classic
vicious circle. Shortage arguably started as a result of the early days of pressure (fast-
growth) planning, as a byproduct of bureaucratism (rent seeking, empire building, the
politicization of economic life), and as part of the psychology of war-time privations.
Parenthetically, Kornai defines "shortage" as the difference between intention and
realization rather than as the difference between downwardly-revised demand and
realized supply. As the economy gets accustomed to it, a shortage equilibrium or normal
shortage emerges. What firms and planners then consider a problem is "above normal"
shortage. Shortage was perpetuated by a number of behavioral responses by firms and
households alike:
Defensive hoarding—firms respond to tale-tale signs such as stock levels,
queue length, orders, waiting time, etc. Households do the same.
Excessive vertical integration—in order to become self-sufficient.
Forced substitution—changing the mix of production and consumption, and
altering quality
Expansion drive—due to soft budget constraints with the limited exit-entry
mechanism, fear of losing surplus through cross-subsidization, political
influence positively correlated with the size of one's empire, and investment
projects in place partly as bargaining chips for more funds.
Control by norms—as shortage reproduces itself and becomes
institutionalized; planners and firms react only to restore "normal" level of
shortage.

67
(i) The Failure of Bureaucratic Perfectionism
As noted earlier, the economic failure of Soviet socialism became undeniable as early as
1960. The Soviets acknowledged as much in the so-called Liberman reforms by
introducing piecemeal reforms such as introducing profitability as a success indicator in
1965. The Chinese tried the Great Leap Forward as early as 1958. Both reforms are what
we now call "readjustment" which achieved little. Muddle-through "reform" inevitably
arrived in the late 1970s in China and Hungary, and in late 1980s in the rest of the socialist
bloc—the exceptions being North Korea and Cuba.
It helps a lot to remember the behavioral, political, and social legacies of the past,
including:
Dictatorship of the proletariat
Predominance of the collective over the individual
Rampant rent-seeking
Irrelevance of money and prices for resource allocation
Vertical economic links over horizontal ones, etc.
State socialism's crisis of senility was multifaceted indeed:
Productivity Collapse—despite high investment rates (30-40% of GDP), the
Soviet ICOR of 12 was three times as high as that of the middle-income developing
countries.
Legitimation Crisis—widespread public dissatisfaction with the apparatchiks
and the nomenklatura-holders as well as with the low priority given to
consumption goods.
Loss of Confidence—those in power lost confidence in their ability to contain
opposition and to reverse economic trends thereby losing the will to fight.
Plannability Crisis—as the economy became fully urbanized and industrialized,
planning became an untenably complex process. Individual autonomy and better
design of incentives meant that the ossified system would have to give way to

68
something that is menacing to the oligarchy that had benefitted handsomely from
the mono-party system.
The initial response by the Party, typified by Gorbachev’s perestroika of 1985-91, came
in the predictable for the "perfection of control." Examples of Soviet readjustment efforts
include:
Rationalization of bureaucracy: reduction of ministries, reduction of
bureaucrats, creation of ‘bridge’ super-ministries (biuros), decentralization
within (one-man management, contractual among brigades, Worker
Collectives in self-management with a veto power over privatization), and the
1988 Law on State Enterprises which called for respecting the legal autonomy
of state enterprises—to convert them from de facto Partial Khozraschet to Full
Khozraschet!
Political opening—easing of crude repression, greater emphasis on material
incentives, some toleration of dissent within Party, tolerance of an emergent
civic movement, and glasnost with the rest of the world.
Modernization of gigantic agro-industrial complexes. The idea was to
modernize Soviet plants to world standards within ten years. Around 1990, of
the hundreds of thousands of state enterprises, some 2000 of them produced
80% of output and employed 8,500 workers per firm. Avtovaz (largest car
maker, especially the lada) had 552,000 workers—the largest in Europe.
Raise productivity: link reward to productivity, supply-side focus, raises
morale (anti-alcohol campaign, more C-goods, greater inequality; and quality
control as in the case of military goods.
Profitability as the main indicator in the context of contractual state orders
(Goszakazy) rather than plan quotas.
Creation of specialized banks and promises of autonomy for the central
bank: Gosbank (central), Sberbank (savings), Vneshtorgbank (Forex),
Promstroibank (construction and industry), Agroprombank (agriculture),
Zhilsotsbank (social and small enterprise).

69
Some Price decontrols accompanied by an emphasis on User Sovereignty and
State Acceptance Certificates (Gospriyemka) for civilian goods.
The results were rather unimpressive: vertical economic flows cannot be replaced by
horizontal ones over night. Continued softening of budgets, continued ministerial
interference, decentralization without accountability, (bled by the large subsidy to the
empire) the USSR disintegrates (12/91) as did the CMEA (1991), demonetization (barter)
and dollarization (second economy), unsustainable deficits, wage explosion,
decapitalization of firms, a new center of anti-reform power in the form of an Iron
Triangle (bureaucrats, managers, workers), and little Western support for reformers in
the face gloating about having won the Cold War.
4.2. Toward an Economic Evaluation of CPE Performance
As noted earlier, an ideal plan would have to be (a) consistent, i. e., achieves balance
between sources and uses of all resources and commodities; (b) feasible, i. e. it is both
consistent and possible; (c) efficient, i.e., planners cannot reallocate resources so as to
increase one output without having to reduce others, and (d) optimal, i.e., the plan is
the most desirable of all the efficient, feasible plans from planners’ perspective. Actual
planning processes are so cumbersome that all four cumulative attributes are rarely
attained.
As you can see in Figure 4.1 and Figure 7, there was a significant slowdown in economic
growth after 1970 after the extensive phase of industrialization completed. The
sustainably high growth rate in the intensive phase can only be productivity-driven—one
that requires highly decentralized decision-making and a close correspondence between
individual reward and productivity. The Stalinist etatist model soon outlived its
economic usefulness, but could not be supplanted by the Langian market-socialist model
as to the great disappointment of so many social democrats had wished.

70
This system produced unprecedented growth rates in the early decades as mass
mobilization of peasants and small businesspeople accelerated industrialization. After
the scope for reallocation of resources (known as extensive growth) was exhausted,
however, there was a marked growth slow-down and a horrendous productivity collapse.
The very ingredient of success in the early stages, military-style campaigns and
bureaucratic coordination, became ill-suited for a modern economy (intensive growth)
that required a decentralized system for innovation and growth of productivity.

71
Figure 4.1.
The Great Deceleration and Eventual Collapse of Growth in CPEs, 1950-1990

72
Identifying the sources of growth and stagnation
The growth engine of economies has two kinds of fuel aptly called Perspiration
and Inspiration. Perspiration which typically accounts for 40% of growth is all about
accumulation of factors of production. Perspiration which accounts for 60% of growth
is about productivity gains resulting from innovation.
It would be useful to recast the socialist record of growth in a framework of
"growth accounting" to disentangle the contributions of the various sources of growth.
These sources of growth fall into two groups: factor accumulation and productivity
(driven by institutional and technological innovation).
Consider a production function of the Cobb-Douglas type:
Yt = AtKtαNt
1-α (1)
where A is a Hicks-neutral productivity term—also known as total or multi-factor
productivity (TFP level = A = Y/KαN1-α). We did not include other factors such as land
to keep the story simple.
Taking logs and suppressing the time subscript, one can derive the key formula
of growth accounting:
logY = log A + α logK + (1- α) logN (2)
where the parameter α is the share capital in total income in a world where perfect
competition and constant returns to scale prevail.
Equation (2) basically says that output growth is a weighted average of the growth
of factor inputs and the growth of multi-factor or total factor productivity (TFP).
Taking the first derivative of each variable concerning "t", we obtain the familiar
regression equation:
GY =µ+ r(I/Y) + (1-α)n (3)
where GY = the growth rate of output, GA = µ = TFP growth, r(I/Y) = αGK = the income-
weighted growth contributions of capital accumulation (where GK = ∆K/K), n = the
growth rate of the labor force, and r = the rate of return to (or the marginal
productivity of) to capital.
The aggregate formulation can be easily converted into per worker terms by
subtracting logN from both sides of (2):

73
gy = µ + αgk (4)
where gy = the growth rate of output per worker and gk = the growth rate of capital per
worker.
According to (4), the growth rate of output per workers can be decomposed into
the contribution of capital intensity and the contributions of residual factors like
technology (plus institutions, policies, etc.) through its effect on productivity.
What if you are interested in explaining differences in income “levels” rather
than income “growth”? To illustrate development accounting, consider two countries:
country 1 is a rich country and country 2 is a poor country whose living standards are
expressed in per capita terms (y = Y/N):
y1/y2 = A1k1α/A2k2
α (6)
The ratio of per capita incomes can then be decomposed into two: differences in
total factor productivity (A) and differences in capital intensity (k). The gap in A is
larger between developed and developing country. Furthermore, growth in rich
countries is A-driven while growth in poor countries is k-driven.
One way of interpreting the Soviet growth miracle of 1930-70 (>7% GDP growth
per year) is that it was accumulation-driven (much like the extensive phase of growth in
a poor but industrializing economy). Where the Soviets faltered was in the much-needed
switch to a productivity-driven growth which obviously called for inclusive political
institutions and pro-growth market-driven resource allocation. The inability of the
communist political elite to push for robust glasnost led to a great depression and
political collapse. The Chinese communist party was much more successful in
introducing robust perestroika without pluralism which has so far delivered economic
growth under an exclusionary political system which will eventually yield to the incessant
demand of an enlarged middle class.

74
4.3. Post-Socialist Transition: “Reform” versus “Transformation”
As depicted in Figure 5, what the country apparently needed to resume rapid and shared
growth, among other things, was:
Popular political mandate for reformers to undertake front-loading of painful
reforms;
Dual franchise—of ballots (political) and rubles (economic) for citizens;
Careful and deliberate movement toward market-based resource allocation
Orderly and equitable privatization; and
Macroeconomic stabilization by plugging the credit loophole, selectively
reducing expenditure, making the currency convertible, and lobbying for
financial support from abroad.

75
What the country got instead, at least initially, was:
Unstable political equilibrium between Party and the Opposition—one cannot
be half pregnant, after all.
This unleashed cascading forces that eventually knocked down the two pillars
of socialism: the monoparty system and state ownership (by spontaneous
privatization).
Transformational Depression (shortageflation or slumflation) due to the
reallocation of resources across industries and internal restructuring of
enterprises. This took the form of shifts from seller's market to buyer's market,
contraction of investment, disruption of inter-enterprise links via the plan,
disorganization of bilateral trade as cheaper imports flooded the market,
destruction of economic information, financial squeeze due to hardening of
the budget, and asset stripping by rent-seeking bosses (iron triangle) in the
absence of 'rule of law'.
Given the unprecedented nature of the rise of authoritarian “real socialism,” it took
economists several years to make sense of it (industrialization debates, socialist
controversies, shortage, etc.). And due to the equally unprecedented nature of socialism’s
collapse, economists in the West, who are used to analyzing marginal changes, had a little
offer by way of explaining the nature of the non-marginal, systemic changes entailed by
the transition to sometimes authoritarian and sometimes democratic capitalism.
In the final section of the course, we will study the economics of transition in some
detail, but I want to point out some of the challenges by way of introduction:
1. Uniqueness of the post-socialist "transition" economies:
Initial conditions of shortage: soft budget constraint, monetary
overhang and repressed inflation, state ownership, centralized
coordination
Market institutions: virtual absence of market institutions, policy
instruments, and knowledge

76
A rich base of human capital, but a weak appreciation of the role of
entrepreneurship.
2. Choices as to the end-points of systemic reform, there are theoretically many
but actually one or two:
Market Socialism of the Yugoslav type
Managed Capitalism of the corporatist (or oligarchic East Asian type)
Share Economy (market with all stakeholders sharing the risks and
rewards of corporate affiliation)
Capitalism of the Anglo-American type.
The post-socialist transition is best viewed within a political economy framework
and a historical perspective. Trends in key economic variables must be analyzed against
the background of the struggle between different interest groups: most seeking
redistributive rent and others an opportunity to earn a decent living in a free society.
Furthermore, transition is best viewed not as a set of once-and-for-all institutional
changes or a process of short-term stabilization, but as a historic opportunity to solve the
inherited long-term problem of poverty in East-Central Europe, China, Vietnam, and the
former Soviet Union.
Systemic transition entails a massive project of “creative destruction.” Destruction
precedes the possibility of forging superior institutions. The first took 8-15 years, and
nearly the entire socialist reformers have begun to recover by 2000 and become
recognizably capitalist economies. Today, most of them are considered middle-income
countries albeit with a higher degree of industrialization and a lower level of market
sophistication compared with formerly non-socialist developing economies such as
Turkey, S. Korea, Indonesia, Mexico or Brazil.
We will take up the two contrasting case studies of transition, China versus Russia,
in the final set of lectures. These two countries have become reasonably successful
market-oriented economies with China being the largest economy in the world as of 2014!
As you can see from the attachments below, both economies remain authoritarian and

77
corrupt, and the degree of inequality is now unbelievably high by any standards—socialist
or capitalist.
Appendix 1:
A Vocabulary of Key Concepts
Institution
Economic System
Central Planning
Equilibrium (Balances)
Property Rights
Absolutism
Organizational Parallelism
Opportunity Cost
Incentives
Extensive Growth
Intensive Growth
Taut Planning
Troika
Nomenklatura
Apparat
Vertical Integration
Storming
Shortage
Ratchet Effect
Systemic Transition
Transformational Depression/Boom
Kleptocracy
Blat
Guanxi
TVE
Kolkhoz
Khozraschet

78
Appendix 2:
Inequality and the Putin Economy: Inside the Numbers
January 13, 2015
by Jason M. Breslow
6
Throughout his time in power, Vladimir Putin has promised to level the playing field in
Russia, with an emphasis on growing the middle class. In 2008, he described the gulf
between rich and poor as “absolutely unacceptable,” and in 2012 he wrote that “The
differentiation of incomes is unacceptable, outrageously high … Therefore, the most
important task is to reduce material inequality.”
Three years later, however, inequality remains among the most stubborn challenges
facing the Putin economy. The gulf between the nation’s ultra-wealthy and everyone else
is so extreme, Credit Suisse concluded in a recent report, that “it deserves to be placed in a
separate category.” Here is a brief snapshot:
111 people control 19 percent of all household wealth in Russia
If there is one statistic that underscores the depth of wealth inequality in Russia, it may be
that an estimated 111 billionaires control nearly a fifth of all household wealth in the
country. That’s according to the 2014 Credit Suisse analysis, which found that those in the
top 10 percent of the population control a staggering 85 percent of the wealth in Russia.
Worldwide, there is about one billionaire for every $170 billion in household wealth; in
Russia, there is one for every $11 billion.

79
90 percent of entrepreneurs say they’ve experienced corruption
One factor widely seen as contributing to the rise of the uber-rich is the role of corruption
inside Russia. Despite pledges by Vladimir Putin to crack down on corruption, to most
Russians, the problem remains widespread. Surveys by OPORA, a Russian business
association, have found that 90 percent of entrepreneurs have encountered corruption at
least once. Among households, corruption ranked as the second biggest problem in the
country — behind housing — in a survey by the Institute of Contemporary Development
in Moscow.
Perceptions are equally troubling when Russia was compared against international peers
such as Brazil, China, India and the 34 member nations of the Organization for Economic
Co-operation and Development. In 2014, Russia ranked lower than each in Transparency
International’s annual corruption perceptions index. Worldwide, it came in at 136 out of
174.
It’s difficult to put a price tag on the economic costs of corruption, but according to one
analysis by the INDEM Foundation, a Moscow-based think tank focused on anti-
corruption, the practice costs the nation’s economy between $300 billion and $500 billion
each year. With a GDP of about $1.5 trillion, that represents roughly a third of Russia’s
economy.
Four out of five Russians have less than $10,000 in wealth
In addition to Russia’s 111 billionaires, it is home to 158,000 millionaires. But for the rest of
the nation of 139 million, the Credit Suisse analysis put median wealth at $2,360 in 2014, up
from $871 the year before. To be sure, missing data meant that the report’s authors could
not factor for real assets — such as how much a person may own in property. But after

80
estimating what those costs may be, the analysis suggests that 83 percent of the population
has less than $10,000 in personal wealth.
The energy sector is fueling income disparity
Looking at inequality from the standpoint of income — what someone earns, as opposed
to what their personal wealth may be — highlights another challenge facing the Putin
economy: the role of the nation’s energy sector in fueling income disparities.
The average middle-class Russian earns between $4,000 and $10,000 per year, according to
a 2012 Forbes analysis of data from Rosstat, the nation’s statistics bureau.
But research by the International Policy Centre for Inclusive Growth has found that income
gains in recent years have primarily benefited Russia’s wealthy energy hubs, while
bypassing the nation’s poorest areas. The research showed that in regions where at least
half of economic output comes from the oil, gas and minerals industries, incomes are one-
third higher, on average, than in the rest of Russia. Four of the five highest-income regions
in the analysis were centers of oil and gas production, and all were home to the greatest
income inequality. As the study noted:
The growth in … incomes does not reflect growth in entrepreneurship or
innovation though. The inequality in the distribution of incomes reflects the
economy’s dependence on rents from resource extraction, which has increased
incomes in the highest income brackets and hindered the expansion of the
middle class.

81
The middle class has grown anyway
Despite the gulf between the earnings of the ultra-wealthy compared to everyone else, the
average Russian salary has grown enough to place a majority of the nation firmly in what
the World Bank defines as the middle class. From 2001, Vladimir Putin’s second year as
president, to 2010, Russia’s middle class grew from 30 percent of the population to 60
percent, one of the highest rates among emerging economies.
But “middle class” is a relative term, and if there’s one caveat to that figure, it’s that the
World Bank sets its threshold for middle class as anyone who lives on at least $10 per day.
Moreover, the growth in average wages has been skewed, dramatically at times, by surging
incomes at the very top of the income ladder, according to Thomas Remington, a professor
of political science at Emory University and author of The Politics of Inequality in Russia.
“The way I look at the middle class, and it’s true for the U.S. too, is if you include the top
10 percent, or the top 5 percent or 1 percent, you can say incomes in the middle class are
growing,” he said. “But that’s not the middle class. Those people at the top, the oligarchs,
they aren’t the middle class anymore than Warren Buffett is in the middle class in the U.S.”
But staying in the middle class can be tenuous
The rise of the middle class has coincided with a sharp drop in poverty rates. Poverty —
which the World Bank defines as anyone living off $5/day or less — fell from 35 percent in
2001 to 11.9 percent by the end of 2013.
But not all households have moved evenly up the social ladder. From 2001 to 2005, and then
again from 2006 to 2010, about 15 percent of the population suffered big enough setbacks

82
to push them into worse financial shape, “suggesting that vulnerability to shocks remains
an issue at all socio-economic levels,” according to the World Bank. In 2010, for instance,
30 percent of Russians who were considered middle class just five years earlier were
financially vulnerable or even poor.
Economic headwinds have arrived
Despite a growing middle class and the decline in poverty rates, 2015 could pose one of the
toughest tests to date for the Putin economy. Oil and gas exports account for about half of
Russia’s budget revenue, but with oil prices currently trading near five-year lows and the
bite from international sanctions keeping the ruble near similar lows against the dollar,
Russia’s economy appears set to slide into recession in the months ahead. To make matters
worse, consumer prices are expected to rise by double digits, putting additional pressure
on already strained household budgets.
The question is, what happens if recession does hit? As prime minister from 2008 to 2012,
Putin made expanding the middle class a national priority. But in the aftermath of mass
demonstrations against him in 2012, his rhetoric on strengthening working-class families
has become noticeably quiet, according to Remington.
“He switched tack,” Remington told FRONTLINE. “His whole strategy is now not
promoting the interests of the middle class, but the interests of lower classes and small
town people, people in industrial towns that need the state to prop them up … He’s not
interested in building the middle class now in his political strategy because he thinks the
middle class is ungrateful.”

83
Appendix 3: Historical Timelines
A) China: Economic Timeline (PBS)
1910-1927: The fall of the last emperor leaves China's economy disorganized and chaotic. The weak Nationalist government appeals to the United States for funds but is turned down. The Soviet Union provides the first backing that will help the Nationalists drive out warlords and unify the nation.
1928-1936: After splitting with the Communists, Chiang looks to the West for new technologies, science, and medicine. During the "Nanjing Decade," the government invests in construction, modernizes transportation and communications systems, and begins to unify the currency system. Shanghai becomes the trading and financial center of Asia, with foreign tycoons and a thriving stock market.
1937-1945: Chiang Kai-shek and his wife appeal to the world for help in fighting Japan. In 1943 Mme. Chiang visits America to ask for money and supplies. Chiang threatens to sign a separate peace with Japan. The United States sends millions of dollars to the Chinese war effort, with no accounting required. Corruption is rampant as funds are handled by the inner circle of Chiang relatives and friends.
1946-1948: Nationalist financial policies are chaotic, with black market trading and corruption widespread. The currency system changes frequently, from paper money to gold yuan to silver dollars, even American dollars. Inflation rises to 100 percent. With famine in the North and floods in the South, the UN Relief Agency sends China millions of dollars in aid.
1949: When the People's Republic of China (PRC) is established, peasants seize property and kill landlords. Nearly half of China's arable land is distributed to poor peasants. Foreign investment is seized, and private property is nationalized. China is nearly bankrupt, with all of the Central Bank and a huge number of art treasures now moved to Taiwan.
1950-1957: Agriculture is collectivized, and private property is abolished. The government sets quotas for how much grain peasants can keep and fixes low prices for the state portion. U.S.-led trade sanctions are imposed on China for its support of North Korea, pushing Beijing towards Moscow. In 1953 the first Soviet-style five-year plan is adopted, with an emphasis on heavy industry, especially steel.
1958-1960: In an effort to create steel that will speed China's industrialization, people melt woks, tools, and bed frames in backyard furnaces, but the steel they produce is useless. Ideologically zealous farmers over-report farm output. The state takes grain based on false figures, using it to pay off Soviet debt and feed cities. China's economy does not advance, and 30 million people starve to death.
1961-1965: Mao leaves the government in the hands of pragmatists after his disastrous Great Leap Forward, and they initiate programs of careful economic growth which do work. China becomes increasingly prosperous.

84
1966-1976: The Cultural Revolution is a time of intense internal confusion and isolation from the rest of the world. The economy is in shambles as all economic pragmatists are purged from the government.
1977-1979: Deng Xiaoping wrests power from Hua Guofeng and by 1978 outlines an ambitious program for economic reform, including dismantling the communes and allowing peasants to produce food for private sale. This "household responsibility system," designed in response to the drought in Anhui, produces bumper crops. An open-door trade and investment policy is introduced.
1980-1984: Special Economic Zones (SEZs) allow China to accept foreign capital and adopt foreign technologies in controlled phases. Massive construction projects and high wages lure people from all over China to the SEZs. In the countryside, the first markets in decades open to sell surplus produce. Small factories make goods that have been in short supply, fueling the national economy.
1985-1987: State-owned factories are inefficient and heavily subsidized by central government. Agricultural output is exploited to support the failing state-owned enterprises (SOEs), reducing profits for farmers. Rural unemployment increases as factories cannot absorb the population freed from collective farming. The economy enters a period of high-speed growth, with rampant inflation and corruption.
1988-1989: Workers in SOEs used to an "iron rice bowl" of jobs, housing, and benefits for life are encouraged to become entrepreneurs, but few dare. Workers watch inflation eat into their fixed wages, becoming angered by government profiteering and corruption. Deng's plans for price reform plans ignite a run on banks and panic buying. Changing course, he now advocates economic stabilization, not reform.
1990-1991: The Shanghai Stock Exchange is allowed to open, although it is described as an experiment. The Shenzhen exchange follows soon after.
1992: Deng pushes SEZs to accelerate their reforms. China's economy booms, yet problems mount. Urban SOEs are losing money and draining capital from the state budget. Foreign companies do not invest inland, creating a large disparity in income between coastal regions and the rest of China. Millions are unemployed, and village factories often cannot pay their workers.
1993-1996: Zhu Rongji takes charge of the economy, heading the Central Bank and tightening regulatory controls over the stock and other markets. He tries to stem rising inflation after price rises soar more than 21 percent in 1994.
1997: On July 1 Hong Kong is handed back to China after 150 years of British colonial rule. Beijing inherits one of the world's most vibrant capitalist economies and an international financial center. In September Jiang Zemin consolidates his power following Deng Xiaoping's death. The Party begins to focus on reform of SOEs through mergers, acquisitions, bankruptcies, and share issues.
2001-2003: After China joins the WTO, foreign investment surges to a record high. Strong growth masks internal disparities between cities and rural areas, coastal and interior regions. Cuts in tariffs and rules streamline business, but the huge state-owned sector remains deeply troubled and extremely hard to reform. In 2003 the spread of the deadly SARS virus has a severe impact on China's economy.

85
2012: Communist Party holds Congress expected to start a once-in-a-decade transfer of power to a new generation of leaders. Vice-President and heir-apparent Xi Jinping takes over as party chief and assumes the presidency in March 2013. 2014: China became the largest economy in the world with a GDP of $18.5 trillion (relative to that of the U.S. at $18 trillion). 2015: The Communist Party announces it has decided to end the decades-old one-child policy. 2016: Economic growth in 2015 falls to lowest rate in 25 years (6.9%, down from 7.3% in 2014), and IMF predicts further deceleration over the next two years. 2017: Xi Jinping consolidated his power at the 19th CCP Congress in October. He even became the third strongman to have his own “thought” following the examples of Mao and Deng.
B) Russia: Economic and Political Timeline (PBS, BBC)
1689-1725 - Peter the Great introduces far-reaching reforms, including creating a regular conscript
army and navy, subordinating the church to himself and creating new government structures.
1861 - Emancipation Edict ends serfdom; rapid industrialization leads to the growth of working-
class movement and spread of revolutionary ideas.
1864-65 - The area of what is now the Central Asian republics annexed
1904-05 - Russian expansion in Manchuria leads to war with Japan - and the 1905 revolution,
which forced Tsar Nicholas II to grant a constitution and establish a parliament, or Duma.
1917 October - Bolsheviks overthrow provisional government of Alexander Kerensky, with
workers and sailors capturing government buildings and the Winter Palace in St Petersburg, and
eventually taking over Moscow.
1922-91 - Russia part of the Union of Soviet Socialist Republics.
1991 - Russia becomes "independent" as the Soviet Union collapses and, together with Ukraine
and Belarus, forms the Commonwealth of Independent States, which is eventually joined by all
former Soviet republics except the Baltic States.
1992 - Price controls lifted.
1993 - President Boris Yeltsin suspends parliament and calls for new elections following
differences with MPs. MPs barricade themselves inside the parliament building. Yeltsin orders

86
the army to attack parliament, which is recaptured following a bloody battle. Russians approve a
new constitution which gives the president sweeping powers.
1995 - Communist Party wins the largest share of the vote in parliamentary elections, giving it
more than one-third of seats in Duma.
1996 - Yeltsin re-elected for another term.
1998 August - Ruble collapses and the government gives notice of intention to default on foreign
debts.
1999 - Yeltsin sacks Stepashin and replaces him with Vladimir Putin. Putin sends Russian troops
back into Chechnya in the wake of a series of bomb explosions in Russia which are blamed on
Chechen extremists. His tough line increases his popularity among Russians. Yeltsin resigns and
is replaced by Putin as acting president.
2000 March - Putin elected president.
2001 July - Friendship treaty signed with the People's Republic of China during Chinese President
Jiang Zemin's visit to Moscow.
2002 January - Russian and Nato foreign ministers agree on the establishment of the Nato-Russia
Council in which Russia and the 19 Nato countries will have an equal role in decision-making on
policy to counter terrorism and other security threats.
2003 October - Billionaire Yukos oil boss Mikhail Khodorkovsky arrested and held in custody over
investigations into tax evasion and fraud. Mr. Khodorkovsky had supported liberal opposition to
President Putin.
2004 - Mr. Putin wins a second term as president by a landslide. State oil firm Rosneft buys
Yuganskneftegaz.
2005 May - Billionaire former Yukos oil boss Mikhail Khodorkovsky is sentenced to nine years in
prison over charges including tax evasion and fraud. He appeals but succeeds only in having
sentence cut by a year. He is later sent to serve it in a Siberian penal colony.
2005 June - State gains control of Gazprom gas giant by increasing its stake in the company to
over 50%.

87
2005 September - Russia and Germany sign a major deal to build a gas pipeline under Baltic Sea
between the two countries. Gazprom gains overwhelming control of Sibneft oil company by
buying out businessman Roman Abramovich for 13 billion dollars.
2006 July - Rouble becomes convertible currency.
2008 May - Dmitry Medvedev takes over as president from Vladimir Putin, who becomes prime
minister.
2008 August - Tensions between Russia and Georgia escalate into a full-blown military conflict
after Georgian troops mount an attack on separatist forces in South Ossetia.
Russia says its citizens are under attack and pours thousands of troops into South Ossetia, ejecting
Georgian troops. It also launches bombing raids on targets in other parts of Georgia and moves
troops deeper into Georgian territory.
2008 September/October - Share prices fall dramatically at the Moscow stock exchange as Russia
is hit by the world financial crisis and a sudden fall in oil prices.
2011 November - Georgia and Russia sign a Swiss-brokered trade deal which allows Russia to join
the World Trade Organization (WTO), ending Georgia's blockade of Russian membership since
the 2008 war. 2012 March - Prime Minister Vladimir Putin wins the presidential election in the first round with over 63% of the vote, beating veteran Communist opponent Gennady Zyuganov into second place on 17%. 2014 February-May – After a flight from Ukraine of Viktor Yanukovych, Russian forces take over Crimea, which then voted to join Russia in a referendum. 2016 September – Parliamentary elections: The ruling United Russia party increases its majority.
========


