1
The Clorox Company
Back to School ConferenceSeptember 04, 2008
Don KnaussChairman and Chief Executive Officer
2
Safe Harbor Statement
Except for historical information, matters discussed in the attached document, including statements about the success of the company’s strategy and acquisitions as well as future volume, sales and earnings growth, profitability, costs, cost savings, innovation or expectations, are forward-looking statements based on management’s estimates, assumptions and projections. Important factors that could cause results to differ materially from management’s expectations are described in the company’s most recent Form 10-K filed with the SEC, as updated from time to time in the company’s SEC filings. Those factors include, but are not limited to, the company’s costs, including volatility and increases in commodity costs; increases in energy costs; general economic and marketplace conditions and events, including consumer spending levels, the rate of economic growth, and the rate of inflation; the ability of the company to implement and generate expected savings from its programs to reduce costs; consumer and customer reaction to price increases; the success of the company’s previously announced Centennial Strategy; the Company’s actual cost performance and the success of new products.
The company may also use non-GAAP financial measures, which could differ from reported results using Generally Accepted Accounting Principles (GAAP). The most directly comparable GAAP financial measures and reconciliation to non-GAAP financial measures are set forth in the Company’s SEC filings including its Form 10-K and its exhibits furnished to the SEC, which is posted at www.TheCloroxCompany.com in the Investors/Financial Information/SEC Filings section.

2
3
Agenda
Business Review
Centennial Strategy
The Clorox Advantage
Business Review

3
5
FY08 Results
Highest sales growth in 7 years
Sales growth on strong base, foreign currency, and Burt’s Bees
Double-digit sales growth in International
Green Works exceeded plan; expansion to multiple countries
Cost savings/pricing increases offset commodity cost pressures
Free cash flow was strong at 11% of sales
Debt/EBITDA ratio at 3.2x as of July 1 ’08 as expected
GAAP EPS $3.24Gross Margin-190bps vs. YAGOSales growth +9%
6
Continue to Deliver Solid Cost Savings
Clorox has consistently delivered about $100 million per year in cost reduction / productivity improvements.
170bp
93
FY08
230bp
107
FY07
111104108Profit Impact ($MM)
260bp
FY04
250bp
FY06
230bp
FY05
Margin Benefit
FY09: Anticipate $90MM - $100MM in cost savings

4
7
Solid Performance Year-over-YearAccelerating top line and strong free cash flow
11%12%11%(3)14%18%Free Cash Flowas a % of sales
+9%
10%(2)
4%
FY07
+8%(2)10%(2)26%10%EPS growth
5%
FY04
6%
FY06
5%
FY05
9%Sales growth (1)
FY08
-5%(4)EP growth
(1) Reconciliation between sales as-reported and sales excluding divestitures is shown on a later slide.(2) Compares FY06 EPS of $3.05 (excl. $0.11 stock option accounting costs and $0.05 CEO transition costs) plus $0.12 of FAS123-R expense vs. FY05 EPS of $2.88.
Compares FY07 EPS of $3.23 plus $0.02 of incremental FAS123-R expense and $0.09 of ITSM costs vs. FY06 EPS of $3.05 (excl. $0.11 stock option accounting costs and $0.05 CEO transition costs). Compares FY08 EPS of $3.59 (excl. $0.26 restructuring-related charges and $0.09 Burt’s Bees dilution) to FY07 EPS of $3.33
(3) Excludes $150mm IRS settlement in July, 2005.(4) Includes impact from Burt’s Bees acquisition; excluding Burt’s Bees EP growth is +6%
8
FY09 Outlook
Key ConsiderationsExcluding Burt’s Bees, sales growth: +4-6%Volume expected to be about flat for the yearGross margin: Down in 1st half and up in 2nd half
Commodity cost increases of $180-200 millionAnticipate cost savings of $90-100 millionPricing to recover at least 75% of commodity cost increases
GAAP EPS (1)
$3.60-3.75Gross MarginFlat vs. YAGO
Sales growth +6-8%
(1) Current Outlook as of Aug 1, 2008

5
9
Centennial Strategy
We make everyday life better, everyday
Maximize economic profit across categories, customers and countries
Be best at building big-share brands in economically-attractive midsized categories
Double-Digit annual
Economic Profit growth
MISSION
OBJECTIVES
GOAL STRATEGIES
Be a high-performance organization of enthusiastic owners
Win with superior capabilities in Desire, Decide and Delight
Accelerate growth both in and beyond the core
Relentlessly drive out waste
• 3-5% annual Sales Growth
• EBIT +50bp to +75bp annually
10
Delivering on our Centennial Strategy
Innovation with an integrated 3D approach is driving growth behind key consumer trends
Health and Wellness
Sustainability
Convenience
Multicultural marketplace
6
11
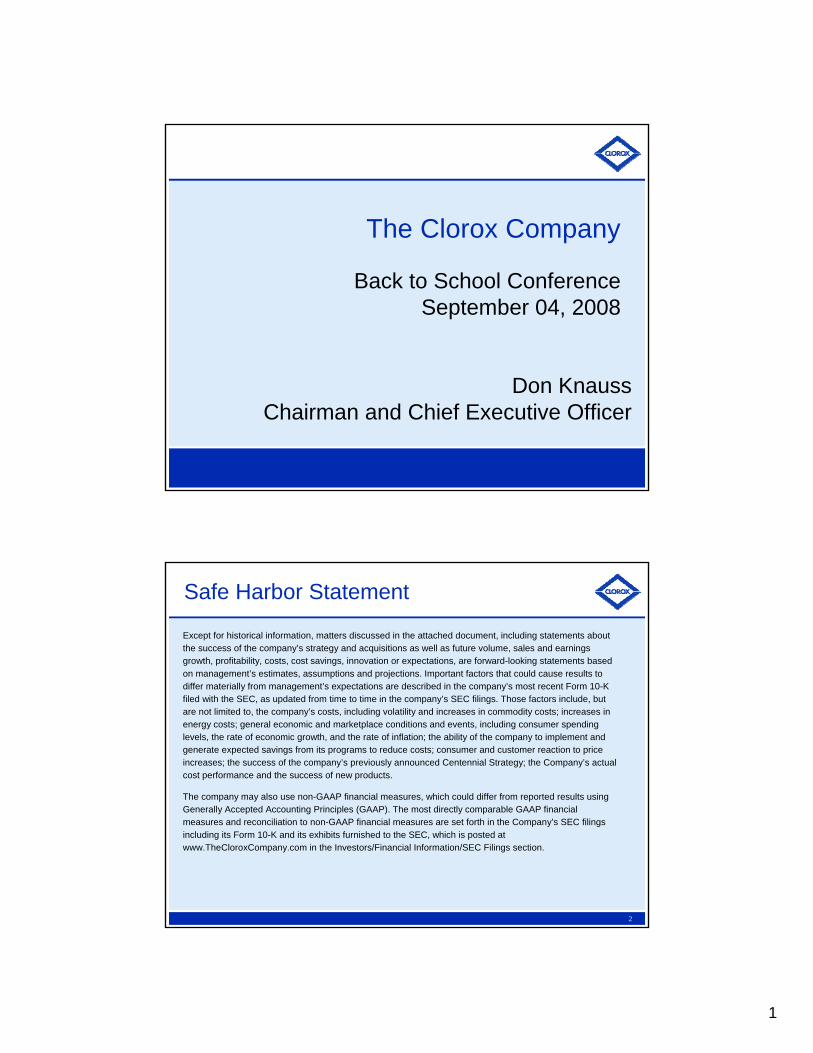
Solid Innovation Track Record
(1) Reconciliation between sales as-reported and sales excluding divestitures is shown in the appendix of this presentation.
+2.0% from InnovationAnnual Goal
FY08FY07FY06FY05FY04
9%4%6%5%5%Total Clorox Sales(1)
(excluding divestitures)
2.8%2.3%2.4%3.4%2.6%Growth from Innovation
12
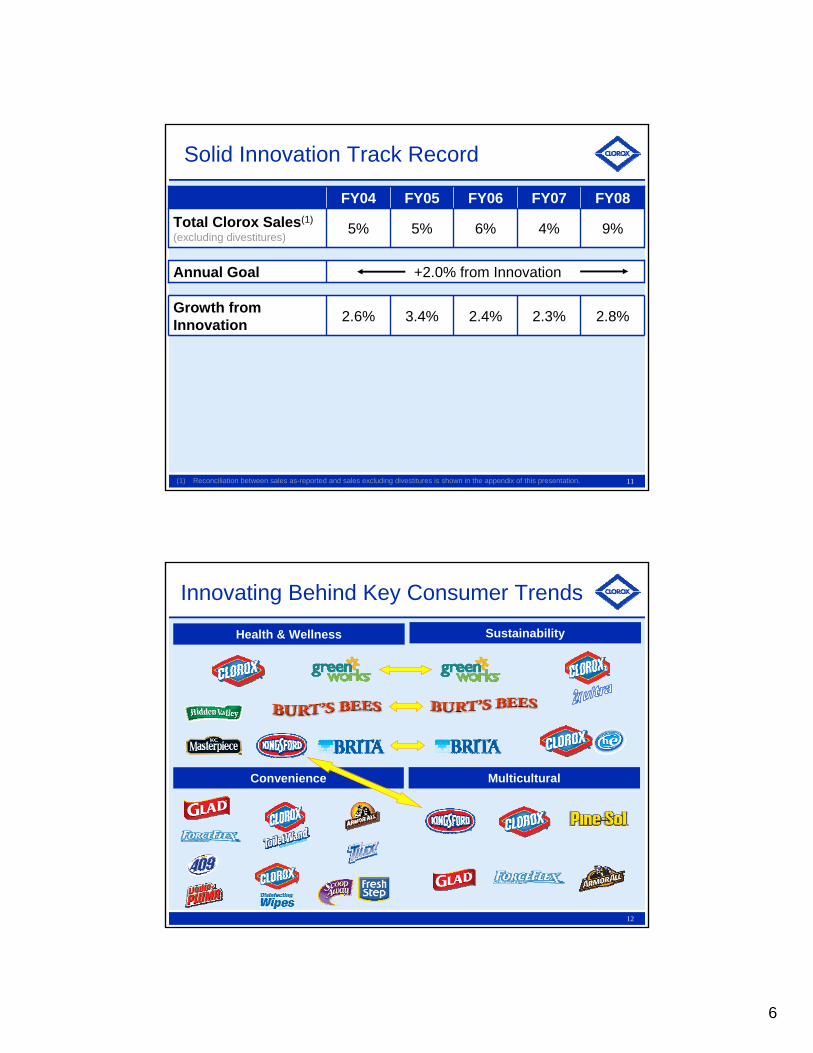
Innovating Behind Key Consumer Trends
Convenience
Health & Wellness
Multicultural
Sustainability

7
13
DelightDesire Decide
Communication
• “Tailgating at Home”
• ESPN Sponsorship
R&D
• Preferred taste to gas
• Burns longer
In-Store
Strong retail activation across
channels
Integrated 3Ds
Insight: Health & Wellness - Meals at home create a healthier environment
Strategy: Inspire and enable shoppers to prepare and enjoy more quality meals at home with family
14
Decide: Strong Retail Activation
8
15
Delivering on our Centennial Strategy
Innovation with an integrated 3D approach is driving growth behind key consumer trends
Resources focused on higher growth and higher margin businesses
16
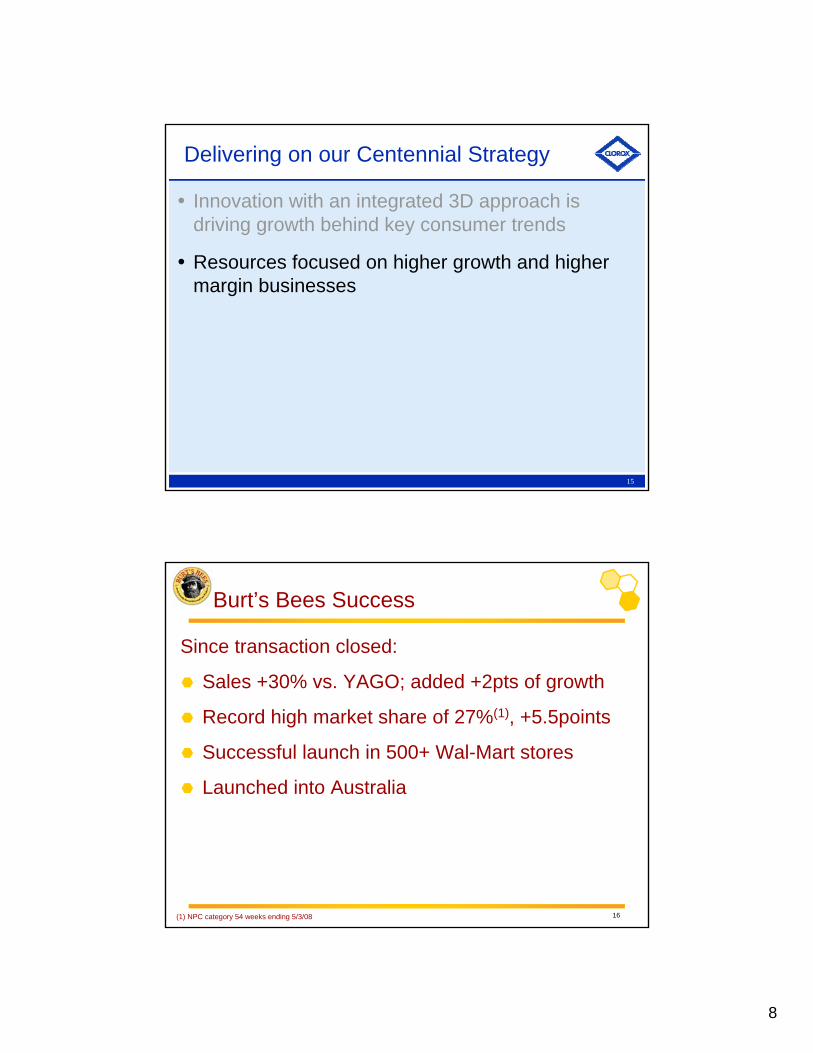
Burt’s Bees Success
Since transaction closed:
Sales +30% vs. YAGO; added +2pts of growth
Record high market share of 27%(1), +5.5points
Successful launch in 500+ Wal-Mart stores
Launched into Australia
(1) NPC category 54 weeks ending 5/3/08
9
The Clorox Company 17
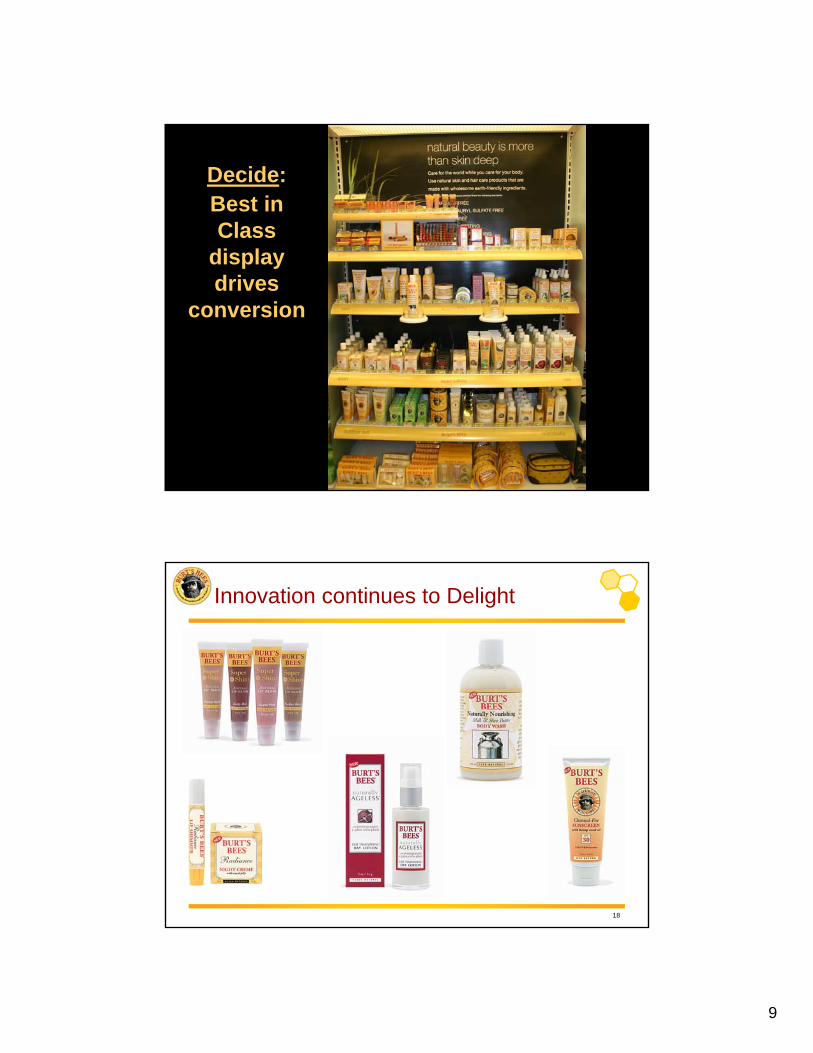
Decide:Best in Class
display drives
conversion
18
Innovation continues to Delight
10
19
20
Consumption FDKT +16% (1)
FY08 Sales +>20%
Record year!
Brita Results
(1) Category Dollar Sales (FDKT) – 52weeks ending 6/29/08
11
21
Leveraging Sustainability across 3Ds
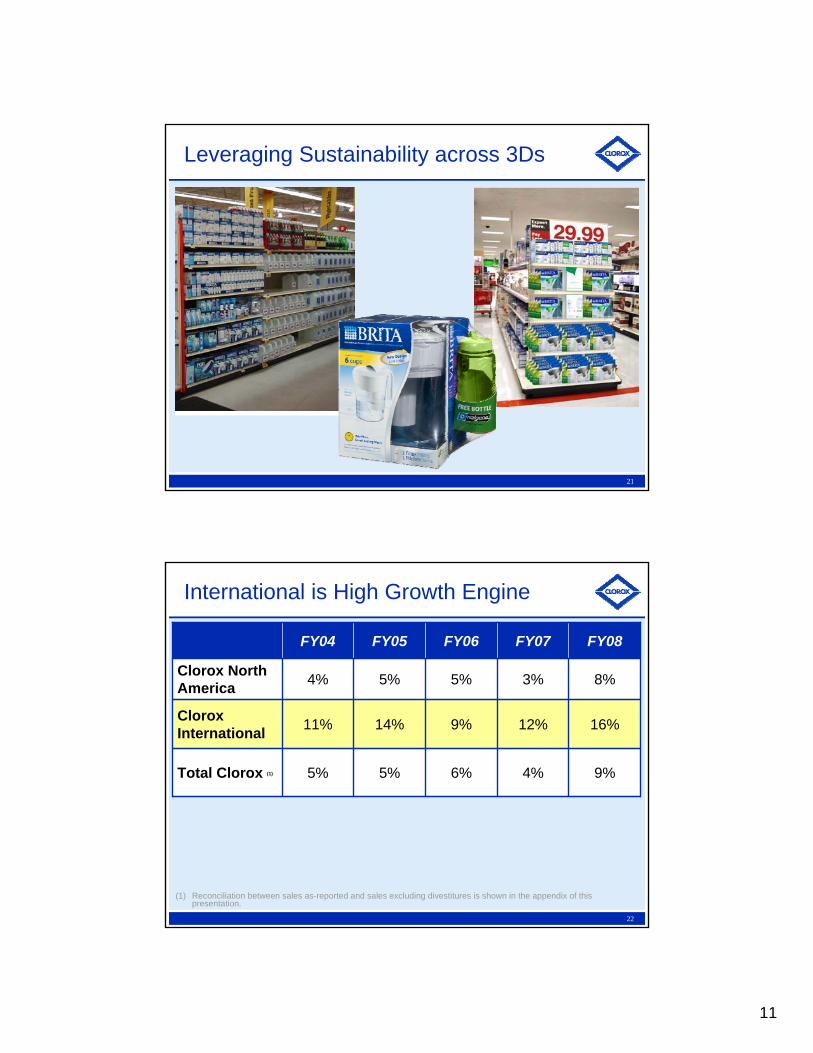
22
International is High Growth Engine
(1) Reconciliation between sales as-reported and sales excluding divestitures is shown in the appendix of this presentation.
FY08FY07FY06FY05FY04
9%4%6%5%5%Total Clorox (1)
12%
3%
16%9%14%11%Clorox International
4% 5%5% 8%Clorox North America
12
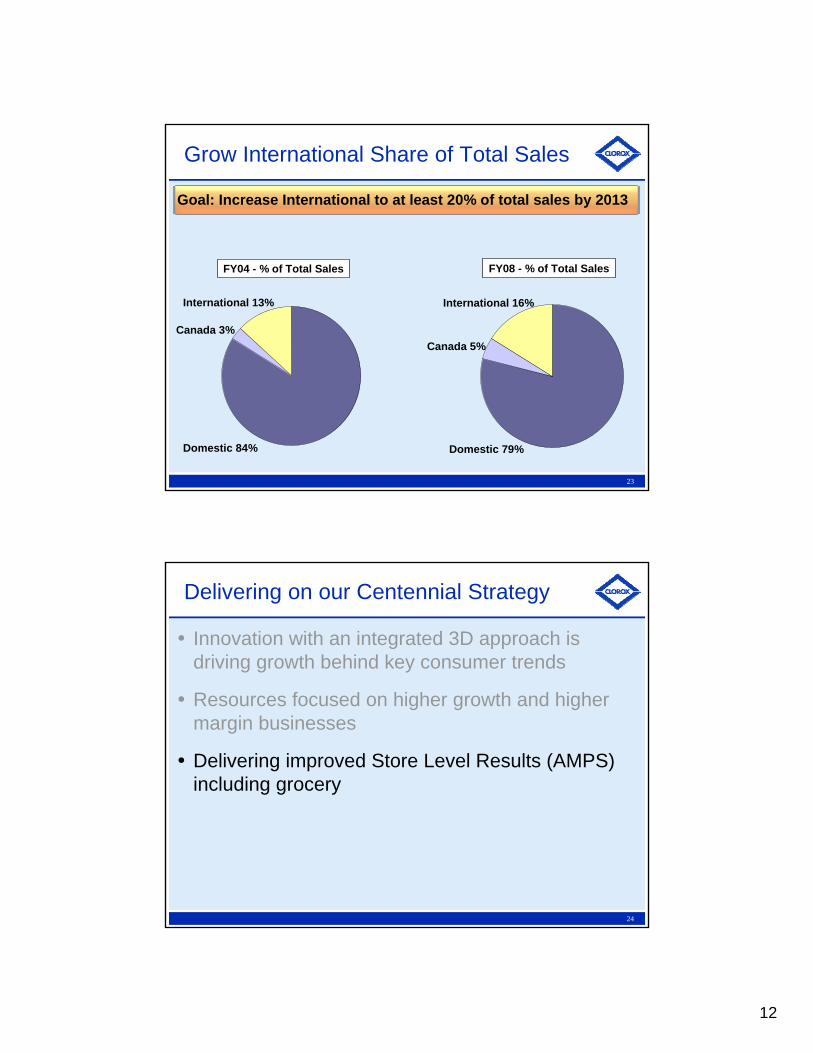
23
Grow International Share of Total Sales
FY04 - % of Total Sales
Domestic 84%
International 13%
Canada 3%
Domestic 79%
International 16%
Canada 5%
Goal: Increase International to at least 20% of total sales by 2013
FY08 - % of Total Sales
24
Delivering on our Centennial Strategy
Innovation with an integrated 3D approach is driving growth behind key consumer trends
Resources focused on higher growth and higher margin businesses
Delivering improved Store Level Results (AMPS) including grocery
13
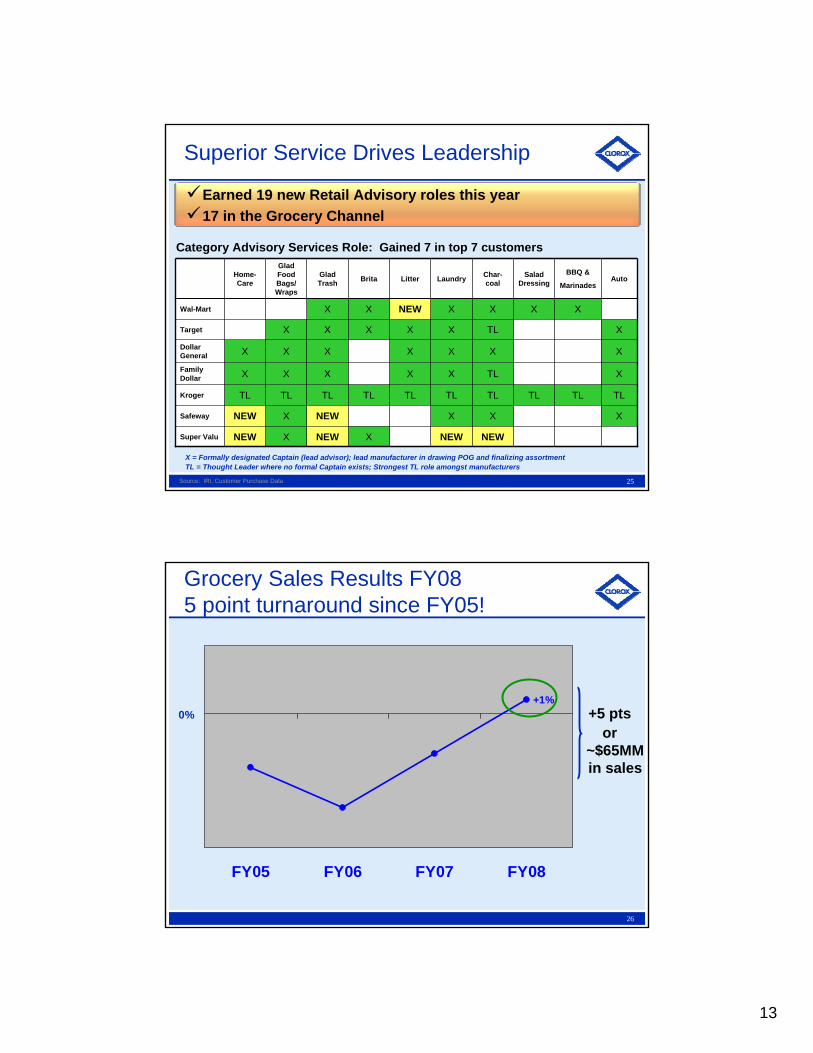
25
X = Formally designated Captain (lead advisor); lead manufacturer in drawing POG and finalizing assortmentTL = Thought Leader where no formal Captain exists; Strongest TL role amongst manufacturers
Source: IRI, Customer Purchase Data
Earned 19 new Retail Advisory roles this year17 in the Grocery Channel
Category Advisory Services Role: Gained 7 in top 7 customers
Superior Service Drives Leadership
NEWNEWXNEWXNEWSuper Valu
XXXNEWXNEWSafeway
TLTLTLTLTLTLTLTLTLTLKroger
XTLXXXXXFamily Dollar
XXXXXXXDollar General
XTLXXXXXTarget
XXXXNEWXXWal-Mart
AutoBBQ &
MarinadesSalad
DressingChar-coalLaundryLitterBritaGlad
Trash
Glad Food Bags/ Wraps
Home-Care
26
+1%
FY05 FY06 FY07 FY08
Grocery Sales Results FY085 point turnaround since FY05!
0% +5 ptsor
~$65MM in sales

14
27
The Clorox Advantage
Strong brands consumers trust
Focus on consumer value equation
Strong brand support to drive 3Ds
Realistic assumptions for managing input costs
28
Focus on Consumer Value Equation
Value is key – pricing only a componentInnovationDecisive product winsPrice relative to competition
In most recent quarter ended, saw share growth in 4 of 8 categories in tracked channels(1)
(1) Based on IRI Custom Scanner data for P13 ended 6/29/08
Building Consumer Lifetime Loyalty
15
29
Strong Brand Support to Drive 3Ds
• Investment in target range 9% - 10% of sales
• Spend differentially by business and by brand
• Improved TV advertising ROI 20% since FY05
• Continued strong investment in trade support
• R&D investment supports decisive product wins
Building Consumer Lifetime Loyalty
30
Managing Input Costs
Pricing & Mix
Cost Savings
Buying powerGlobal sourcing
Supplier diversification
Hedging where available
Innovation and TechnologyExpand/qualify different grades of resin
Materials innovation
Control administrative spending
16
31
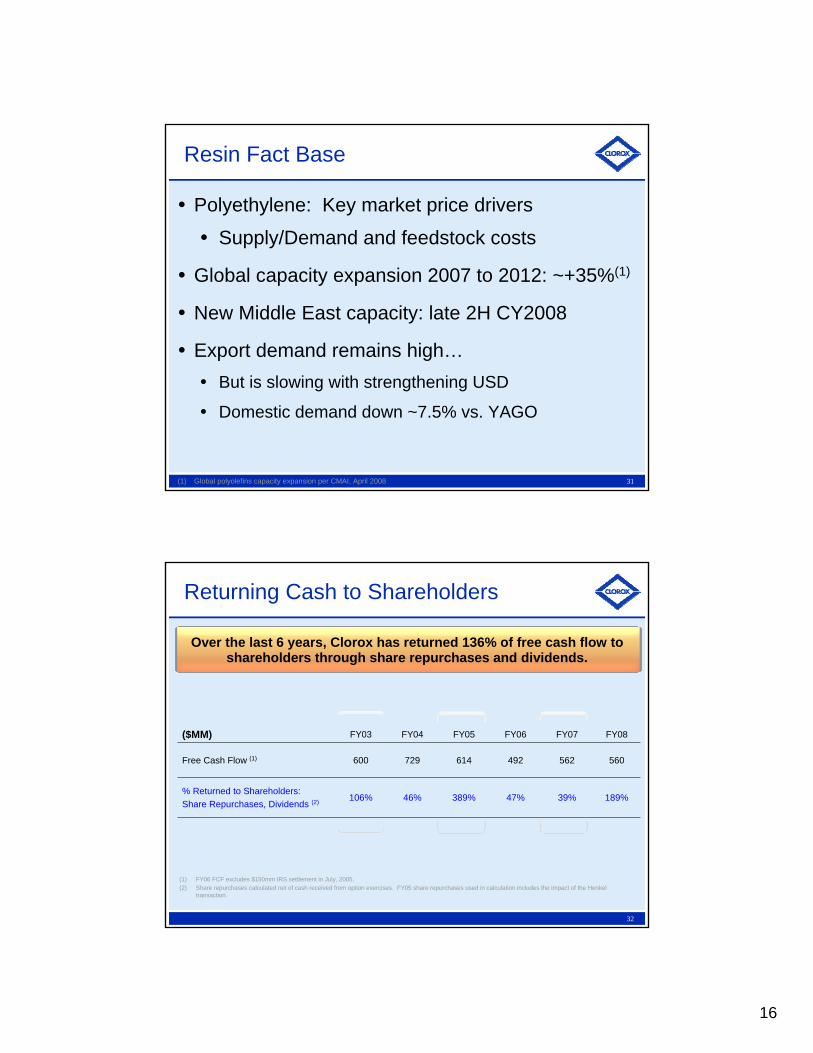
Resin Fact Base
Polyethylene: Key market price drivers
Supply/Demand and feedstock costs
Global capacity expansion 2007 to 2012: ~+35%(1)
New Middle East capacity: late 2H CY2008
Export demand remains high…But is slowing with strengthening USD
Domestic demand down ~7.5% vs. YAGO
(1) Global polyolefins capacity expansion per CMAI, April 2008
32
Returning Cash to Shareholders
(1) FY06 FCF excludes $150mm IRS settlement in July, 2005.(2) Share repurchases calculated net of cash received from option exercises. FY05 share repurchases used in calculation includes the impact of the Henkel
transaction.
Over the last 6 years, Clorox has returned 136% of free cash flow to shareholders through share repurchases and dividends.
39%
562
FY07 FY08FY06FY05FY04FY03($MM)
189%47%389%46%106%% Returned to Shareholders: Share Repurchases, Dividends (2)
560492614729600Free Cash Flow (1)
17
33
Focused on Driving Shareholder Value
Cash flow remains strong
Use cash to pay down debt near term, leverage flexibility longer-term for growth
Support dividend growth
Disciplined capital spending
EP is lens for resource allocation
34
Key Messages
Delivered solid performance in FY08 –accelerated top line growth while managing well through difficult cost environment.
Centennial strategy is working
Clorox continues to be advantaged
Focused on driving shareholder value

18
Appendix
36
Index to Appendix
87-88CCEM………………………………...
56 (US), 65 (International)Big Share Brands………..……..……
80-85Burt’s Bees…………………………..
61-65International………………………….
50-51Gross Margin Mapping….…............
49Restructuring……………………..….
46-48FY09 Outlook………….……..…......
43-45FY08 Reconciliations…………….…PageTopic
723Ds – Grocery……………….……...
55Sales Pie Chart…………….....…..…
52-53Commodities…………..………..….
89-90Pricing………………………………...
76-78Green Works………….……………..

19
FY08 Resultsand FY09 Outlook
38
FY08 Sales Reconciliation
FY08 FY07Base business sales growth 4.7% 3.5%
Foreign Exchange 1.2% 0.2%Private label business exit -0.1% 0
Sales growth before acquisitions 5.8% 3.7%
Burt's Bees 2.1% 0Bleach Acquisiton 0.9% 0.7%
Total Sales Growth 8.8% 4.4%

20
39
FY08 Gross Margin Reconciliation
FY07 Gross Margin 43.1% FY06 Gross Margin 42.2%
Commodities -2.7% Commodities -1.1%Logistics & Manufacturing -1.1% Logistics & Manufacturing -1.0%
Cost Savings 1.7% Cost Savings 2.3%Pricing 0.8% Pricing 1.5%Other 0.3% Other -0.8%
FY08 Gross Margin before one-time charges 42.1% FY07 Gross Margin 43.1%
Burt's Bees Inventory Step-up -0.4% 0%Restructuring-related charges -0.5% 0%
FY08 Gross Margin 41.2% FY07 Gross Margin 43.1%
Change vs. Prior Year -190bp Change vs. Prior Year 90bp
Change vs. Prior Year ex-charges -100bp
40
FY08 Diluted EPS Reconciliation
FY08 FY07Base EPS $3.59 $3.33
Restructuring-related Charges (0.26) -Burt's Bees (0.09) -
IT Services Transition charges and asset impairment - (0.10)Discontinued Ops - 0.03GAAP EPS $3.24 $3.26

21
41
FY09 Outlook
Key ConsiderationsExcluding Burt’s Bees acquisition, sales growth: +4-6%
Includes 2pts from innovation which includes Green Works1st half sales growth stronger than 2nd half due to Burt’s Bees
Announced pricing to recover ~75% of commodity cost increasesVolume expected to be about flat for the year
1st half volume up modestly (Burt’s less pricing impact), 2nd half about flat
Gross margin expected to be down in 1st half and up in 2nd halfCost Savings: $90 to $100 millionCommodities: $180 to $200 million unfavorableRestructuring: Manufacturing network consolidation continuing into FY09, charges of $14-$17 million in COGS vs. FY08 charge of $23 millionBurt’s Bees Inventory Step-Up not repeating: +$19 million benefit to GM
FY09 Outlook
GAAP EPS (1)
$3.60-3.75Gross MarginFlat vs. YAGO
Sales growth +6-8%
(1) Current Outlook as of Aug 1, 2008
42
FY09 Sales Outlook
Base Sales growth before acquisitions(1) 4% 6%
Burt's Bees 2% 2%
Total Sales Growth 6% 8%
Outlook Range
(1) Base sales includes +2% from innovation and also captures impact of pricing, existing private label business and foreign exchange.

22
43
FY09 Diluted EPS Outlook
(1) Outlook is net of restructuring charges of $0.09-$0.11 ($20-25mm pretax) which are primarily related to the previously announced consolidation of the company's manufacturing network.
Initial Outlook (May 1, 2008) GAAP EPS(1) $3.75 $3.90
Greater Commodities / Other -0.15 -0.15
Current Outlook (Aug 1, 2008) GAAP EPS(1) $3.60 $3.75
Outlook Range
44
Restructuring-Related ChargesFY08 & FY09: Supply Chain Consolidation: U.S. Homecare & International
Annual savings of $22MM-$24MM when fully implemented Total capital investment of $52MM (~$29MM in FY08 and ~$23MM in FY09)
FY08:Other charges taken in light of Centennial StrategyExit private label food bags business
--($6 - $8)($36)Restructuring line
Announced Actions
--($20 - $25)($59)Pretax Profit
$22 - $24$18 - $19($14 - $17)($23)COGS
$MM FY11FY10FY09(2)FY08 Actual(1)
(1) FY08 includes ~$48MM in non-cash charges. (2) FY09 as of Aug 1, 2008
Anticipate $20MM - $30MM annually in charges as a normal course of business

23
45
FY’08FY’04
41.3%
OtherFY08Charges
& Burts Inv.(-$42)
Logistics & Manufacturing
(-$180)
Commodities(-$475)
Cost Savings($415)
Pricing($270)
44.0%
33%
37%
41%
45%
49%
53%
57%
Gross Margin Mapping FY04 – FY08
4-Year Change: -270 bps(excluding charges: -150bps)
46
FY’09Outlook*
FY’08
Gross Margin Mapping FY09
* FY09 Current Outlook as of August 1, 2008
$180 to $200MM
$90 to $100MM
GM in FY09 is expected be about flat vs. FY08
Charges &Burt's Inv.
OtherLogistics &
Manufacturing
Commodities
Cost Savings
Pricing

24
47
*FY05
ActualFY06
ActualFY07
ActualFY08
ActualFY09
Outlook
$170
$106
$62
$137
$180 - $200
Commodity Cost Trends FY05 to FY09
* FY09 Current Outlook as of August 1, 2008
Cumulative cost increase FY05 – FY08 = $475million
48
Unfavorablewith 1H > 2H+10%~60%Net impact - Raw Materials & Packaging
~40%Manufacturing, logistics & warehousing
Impact to COGS(% Change vs. YAGO)
% of COGS
About Flat
+19%
+51%
+17%
FY08 FY09 OutlookAug 1, 2008
~30%Other raw materials & packaging (1)
+25% to +30%3-4%Starch, Solvent, Clay
+40% to +50%1-2%Soybean Oil, Corn Syrup, Buttermilk, Egg
+15% to +20%20-25%Resin, Linerboard, Chlor-Alkali
+4% to +6%2-3%Pine Oil, Substrate, Silicone
100%Total COGS
Total raw materials and packaging represents about 60% of COGS
Continued upward pressure from volatile commodity costs
Commodities PressureAnticipate $180-200 million in FY09 on top of ~$135 million in FY08
(1) Includes other commodity items as well as other materials such as triggers, purchased bottles, and labels

25
Clorox Background
50
Total FY08 Sales of $5.3 Billion
* FY08 includes 7 months of sales of Burt’s Bees. **Sales of Professional Products Division allocated to each business unit
International (16%)
Canada (5%)
Burt's Bees (2%)*
Dressings & Sauces (8%)
Charcoal (9%)
Cat Litter (7%)
Glad (16%)
Auto (4%)
Brita (4%)
Laundry (12%)
Home Care (17%)
26
51
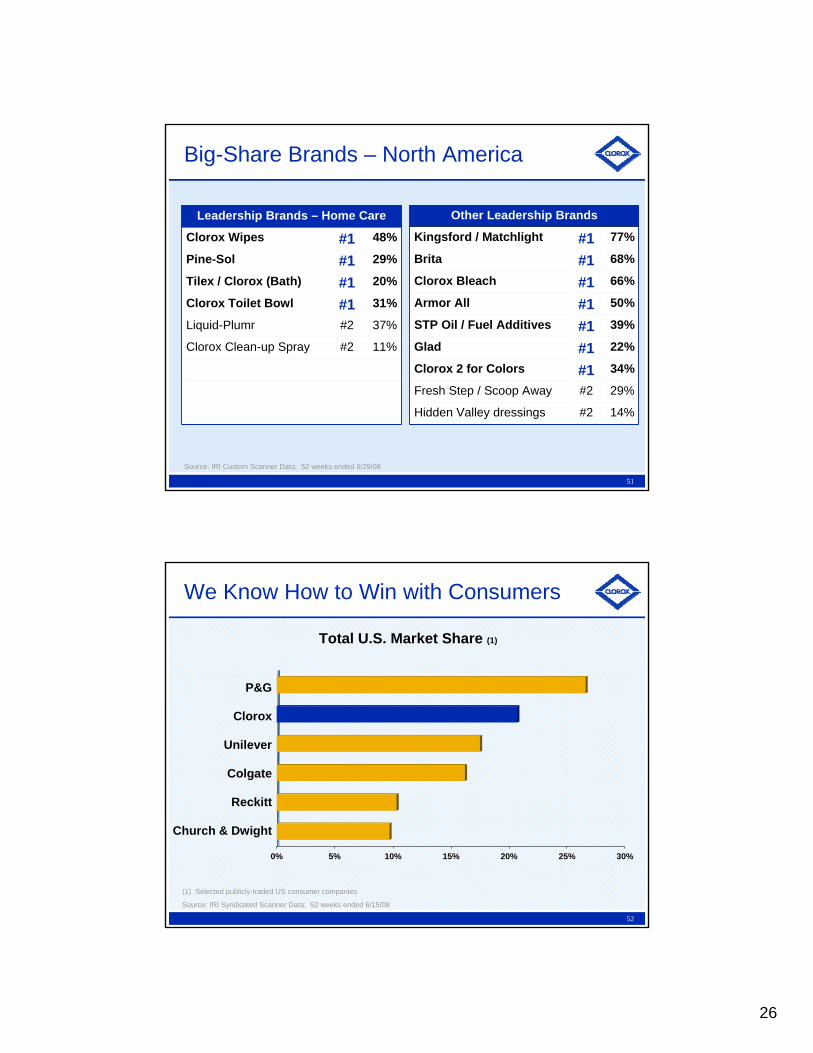
Source: IRI Custom Scanner Data; 52 weeks ended 6/29/08
Big-Share Brands – North America
31%#1Clorox Toilet Bowl
37%#2Liquid-Plumr
11%#2Clorox Clean-up Spray
29%#1Pine-Sol
Leadership Brands – Home Care
20%#1Tilex / Clorox (Bath)
48%#1Clorox Wipes
50%#1Armor All
66%#1Clorox Bleach
39%#1STP Oil / Fuel Additives
22%#1Glad
Other Leadership Brands
14%#2Hidden Valley dressings
29%#2Fresh Step / Scoop Away
34%#1Clorox 2 for Colors
68%#1Brita
77%#1Kingsford / Matchlight
52
Total U.S. Market Share (1)
(1) Selected publicly-traded US consumer companies
Source: IRI Syndicated Scanner Data; 52 weeks ended 6/15/08
P&G
Clorox
Unilever
Colgate
Reckitt
Church & Dwight
0% 5% 10% 15% 20% 25% 30%
We Know How to Win with Consumers
27
53
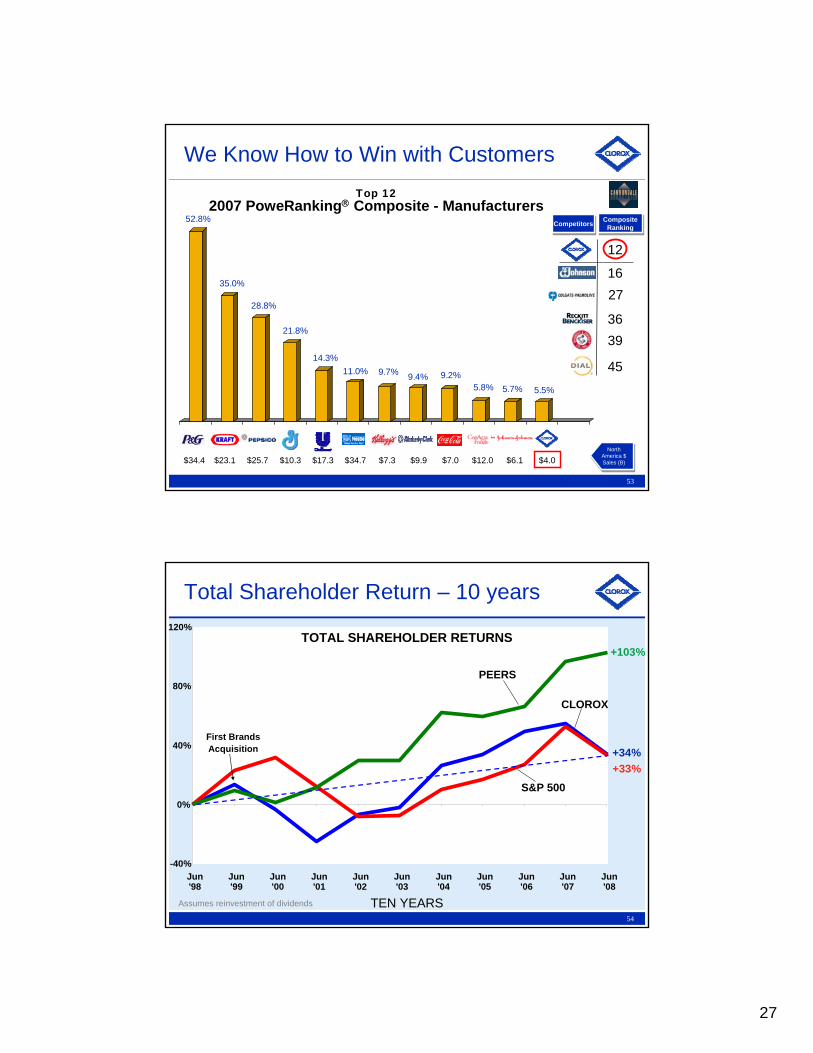
Top 122007 PoweRanking® Composite - Manufacturers
North America $ Sales (B)
North America $ Sales (B)
We Know How to Win with Customers
CompositeRanking
CompositeRanking
45
3639
16
12
CompetitorsCompetitors
27
52.8%
35.0%
28.8%
21.8%
14.3%11.0% 9.7% 9.4% 9.2%
5.8% 5.7% 5.5%
$4.0$6.1$12.0$7.0$9.9$7.3$34.7$17.3$10.3$25.7$23.1$34.4
54
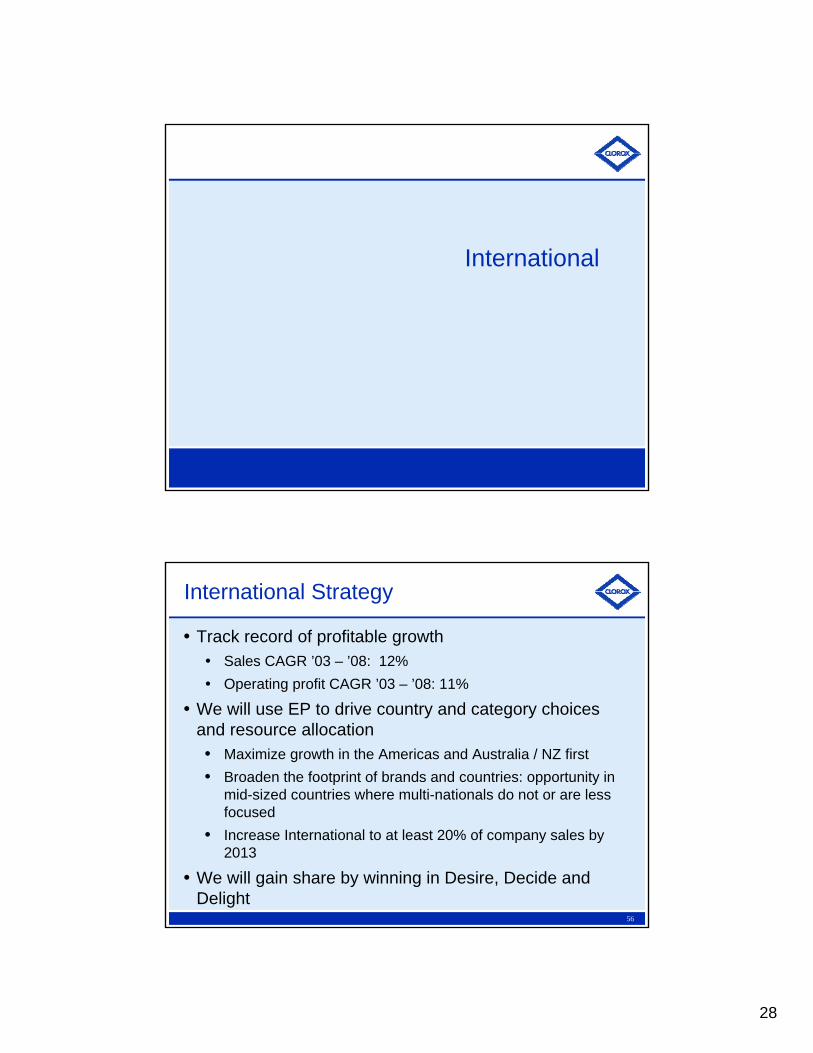
Total Shareholder Return – 10 years
-40%
0%
40%
80%
120%
Jun'98
Jun'99
Jun'00
Jun'01
Jun'02
Jun'03
Jun'04
Jun'05
Jun'06
Jun'07
Jun'08
TOTAL SHAREHOLDER RETURNS
CLOROX
PEERS
S&P 500
First BrandsAcquisition +34%
+103%
+33%
Assumes reinvestment of dividends TEN YEARS
28
International
56
International Strategy
Track record of profitable growthSales CAGR ’03 – ’08: 12%Operating profit CAGR ’03 – ’08: 11%
We will use EP to drive country and category choices and resource allocation• Maximize growth in the Americas and Australia / NZ first• Broaden the footprint of brands and countries: opportunity in
mid-sized countries where multi-nationals do not or are less focused
• Increase International to at least 20% of company sales by 2013
We will gain share by winning in Desire, Decide and Delight

29
57
Mexico
Australia
Puerto Rico
Argentina
S. Korea
Chile
Key:
Tier II 14 %
Tier I 80 %
Venezuela
Peru
Colombia
Costa Rica/Panama
New Zealand
Hong Kong
S. Africa
Philippines
Tier III 6 %
China ( south)
11
Ecuador
Uruguay
Dominican Rep.
Where we play outside of U.S.
58
Where we play - International
FY08 ActualNet Customer Sales by Region
Latin America
67%
EME8%
Asia5%
ANZA20%
Bleach & Laundry35%
Other6%
Auto9%
Bags & Wraps17%
Home Cleaning
33%
FY08 ActualNet Customer Sales by Category
30
59
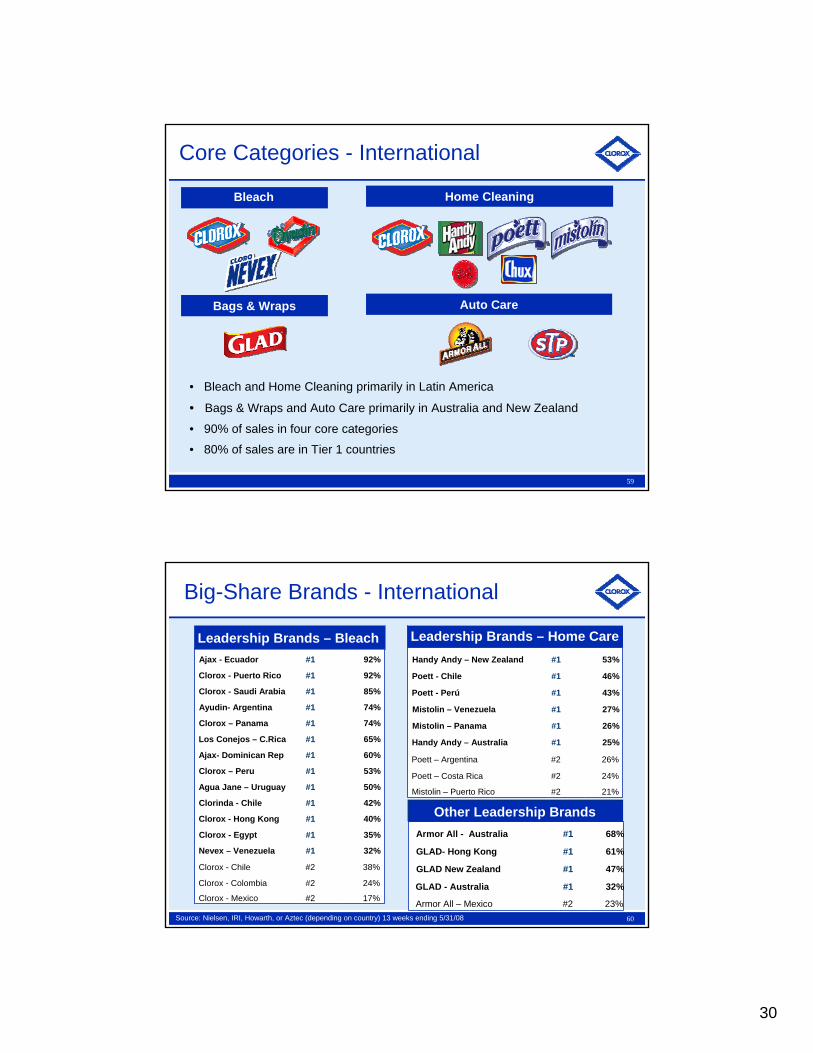
• Bleach and Home Cleaning primarily in Latin America
• Bags & Wraps and Auto Care primarily in Australia and New Zealand
• 90% of sales in four core categories
• 80% of sales are in Tier 1 countries
Bleach
Core Categories - International
Home Cleaning
Bags & Wraps Auto Care
60
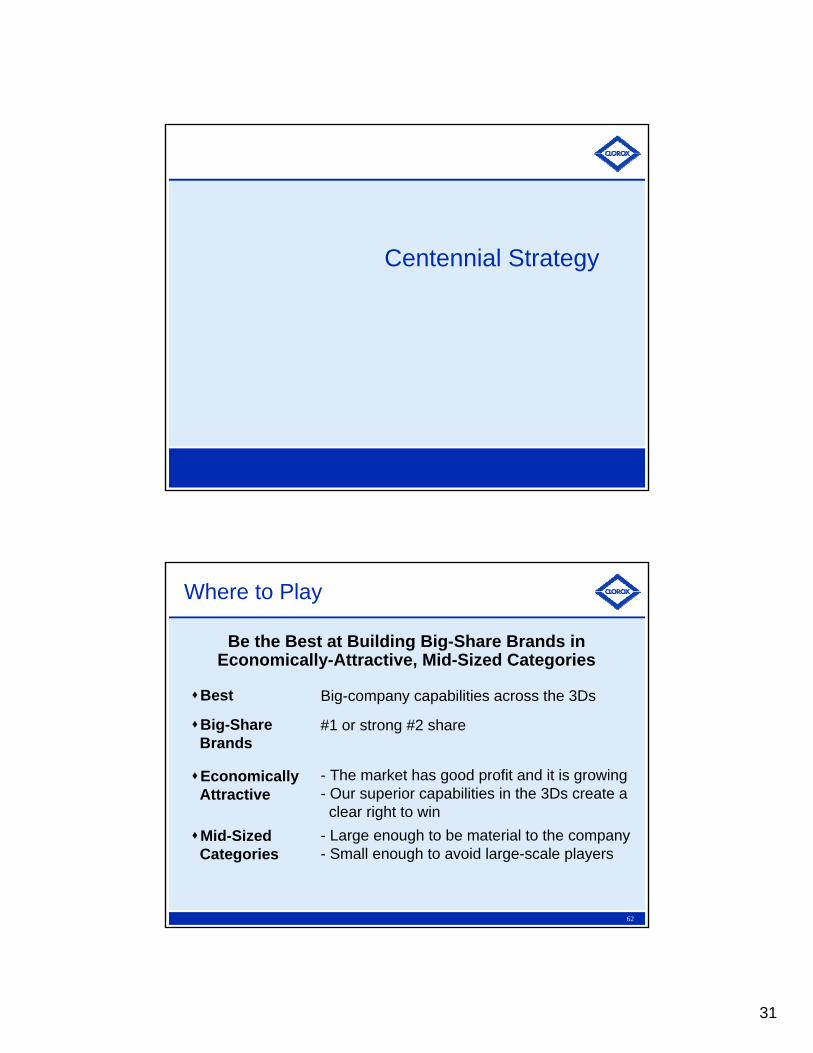
Big-Share Brands - International
Handy Andy – New Zealand #1 53%
Poett - Chile #1 46%
Poett - Perú #1 43%
Mistolin – Venezuela #1 27%
Mistolin – Panama #1 26%
Handy Andy – Australia #1 25%
Poett – Argentina #2 26%
Poett – Costa Rica #2 24%
Mistolin – Puerto Rico #2 21%
Leadership Brands – Home CareAjax - Ecuador #1 92%
Clorox - Puerto Rico #1 92%
Clorox - Saudi Arabia #1 85%
Ayudin- Argentina #1 74%
Clorox – Panama #1 74%
Los Conejos – C.Rica #1 65%
Ajax- Dominican Rep #1 60%
Clorox – Peru #1 53%
Agua Jane – Uruguay #1 50%
Clorinda - Chile #1 42%
Clorox - Hong Kong #1 40%
Clorox - Egypt #1 35%
Nevex – Venezuela #1 32%
Clorox - Chile #2 38%
Clorox - Colombia #2 24%
Clorox - Mexico #2 17%
Leadership Brands – Bleach
Armor All - Australia #1 68%
GLAD- Hong Kong #1 61%
GLAD New Zealand #1 47%
GLAD - Australia #1 32%
Armor All – Mexico #2 23%
Other Leadership Brands
Source: Nielsen, IRI, Howarth, or Aztec (depending on country) 13 weeks ending 5/31/08
31
Centennial Strategy
62
Where to Play
Be the Best at Building Big-Share Brands in Economically-Attractive, Mid-Sized Categories
Best
Big-Share Brands
Economically Attractive
Mid-SizedCategories
Big-company capabilities across the 3Ds
#1 or strong #2 share
- The market has good profit and it is growing- Our superior capabilities in the 3Ds create a clear right to win
- Large enough to be material to the company- Small enough to avoid large-scale players

32
63
Annual Financial Goals
Annual Goals
+50bp to +75bpEBIT Margin2.
3% - 5%Organic Sales Growth1.
Incremental or Adjustments to Goals:M&A activity and any new geographies would be incrementalImpact of any portfolio reshaping would be adjustments to targets
64
Targeted Capital Structure
Over time - Operate at higher leverage levelsRange 2.5x to 3.0x Debt/EBITDA
Interim - Return cash to shareholders if not needed for the business
Share repurchasesCompleted ASR Q1 FY08 (Aug. 2007)
Dividend increase: +15% May 08 on top of +29% May 07Payout ratio: 57%(1)
Yield: 3.2%(2)
(1) Based on FY08 Diluted EPS of $3.24 (continuing operations).(2) Based on stock price as of close Aug 27, 2008 ($58.42)
33
65
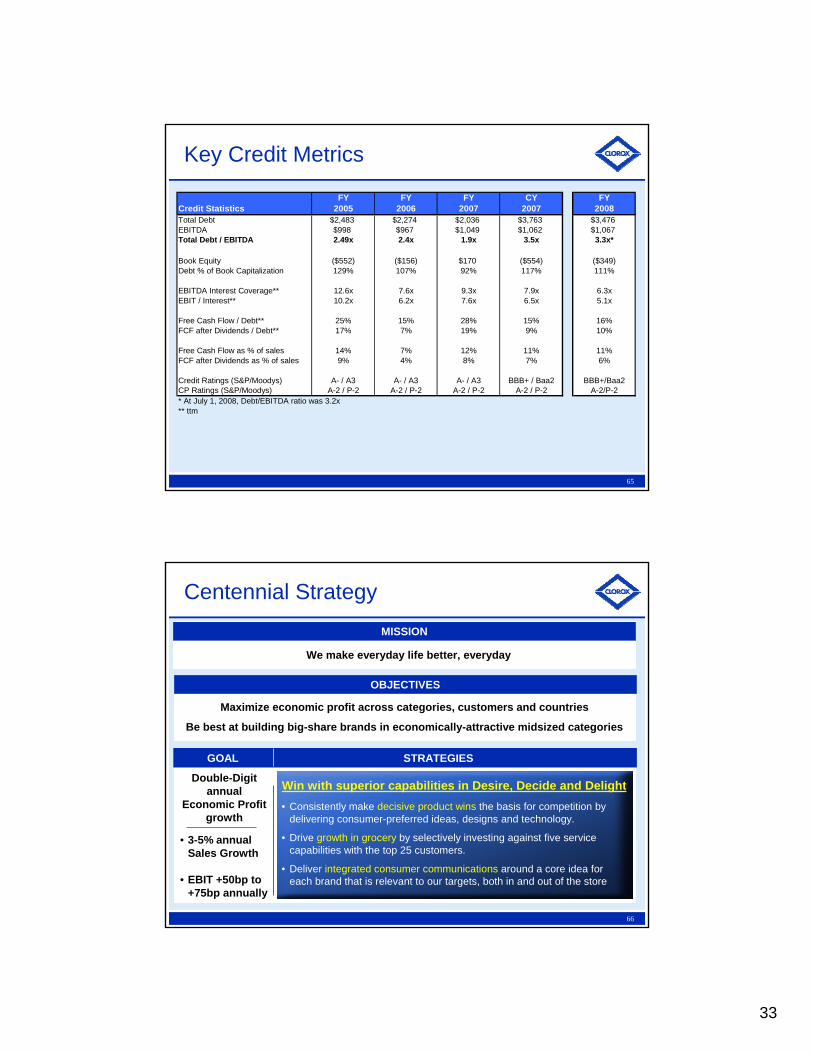
Key Credit Metrics
FY FY FY CY FYCredit Statistics 2005 2006 2007 2007 2008Total Debt $2,483 $2,274 $2,036 $3,763 $3,476EBITDA $998 $967 $1,049 $1,062 $1,067Total Debt / EBITDA 2.49x 2.4x 1.9x 3.5x 3.3x*
Book Equity ($552) ($156) $170 ($554) ($349)Debt % of Book Capitalization 129% 107% 92% 117% 111%
EBITDA Interest Coverage** 12.6x 7.6x 9.3x 7.9x 6.3xEBIT / Interest** 10.2x 6.2x 7.6x 6.5x 5.1x
Free Cash Flow / Debt** 25% 15% 28% 15% 16%FCF after Dividends / Debt** 17% 7% 19% 9% 10%
Free Cash Flow as % of sales 14% 7% 12% 11% 11%FCF after Dividends as % of sales 9% 4% 8% 7% 6%
Credit Ratings (S&P/Moodys) A- / A3 A- / A3 A- / A3 BBB+ / Baa2 BBB+/Baa2CP Ratings (S&P/Moodys) A-2 / P-2 A-2 / P-2 A-2 / P-2 A-2 / P-2 A-2/P-2* At July 1, 2008, Debt/EBITDA ratio was 3.2x** ttm
66
Be a high-performance organization of enthusiastic owners
Win with superior capabilities in Desire, Decide and Delight
Accelerate growth both in and beyond the core
Relentlessly drive out waste
Centennial Strategy
We make everyday life better, everyday
Maximize economic profit across categories, customers and countries
Be best at building big-share brands in economically-attractive midsized categories
Double-Digit annual
Economic Profit growth
MISSION
OBJECTIVES
GOAL STRATEGIES
Win with superior capabilities in Desire, Decide and Delight• Consistently make decisive product wins the basis for competition by
delivering consumer-preferred ideas, designs and technology.
• Drive growth in grocery by selectively investing against five service capabilities with the top 25 customers.
• Deliver integrated consumer communications around a core idea for each brand that is relevant to our targets, both in and out of the store
• 3-5% annual Sales Growth
• EBIT +50bp to +75bp annually
34
67
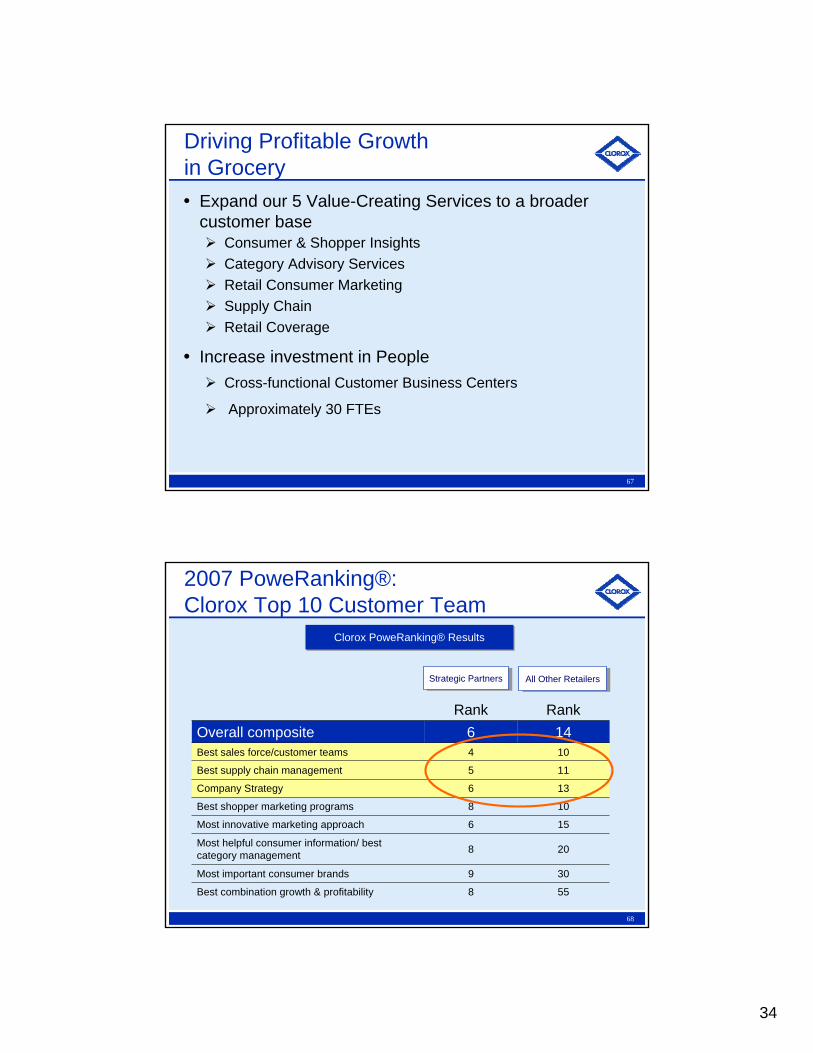
Driving Profitable Growth in Grocery
Expand our 5 Value-Creating Services to a broader customer base
Consumer & Shopper InsightsCategory Advisory ServicesRetail Consumer MarketingSupply ChainRetail Coverage
Increase investment in PeopleCross-functional Customer Business Centers
Approximately 30 FTEs
68
2007 PoweRanking®:Clorox Top 10 Customer Team
Clorox PoweRanking® ResultsClorox PoweRanking® Results
Strategic PartnersStrategic Partners All Other RetailersAll Other Retailers
309Most important consumer brands
208Most helpful consumer information/ best category management
156Most innovative marketing approach
108Best shopper marketing programs
104Best sales force/customer teams
136Company Strategy
115Best supply chain management
558Best combination growth & profitability
146Overall compositeRankRank
35
69
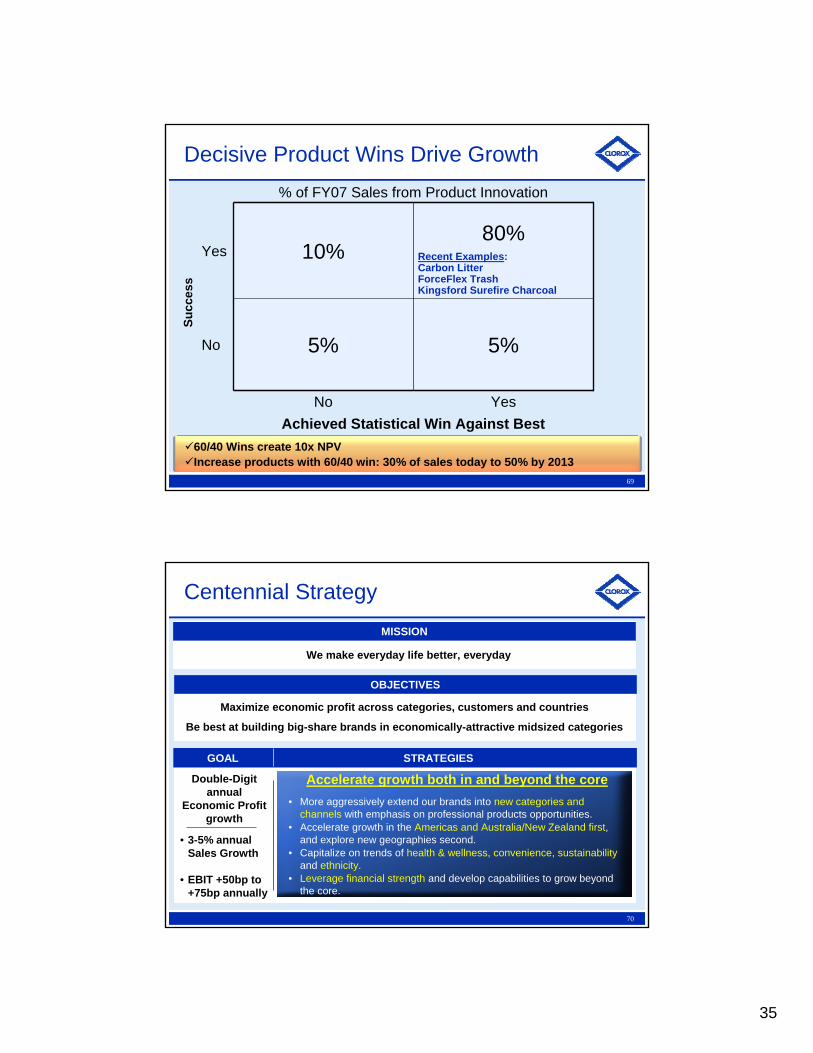
Decisive Product Wins Drive Growth
YesNoAchieved Statistical Win Against Best
Competition
5%5%No
80%Recent Examples:Carbon LitterForceFlex TrashKingsford Surefire Charcoal
10%Yes
% of FY07 Sales from Product InnovationSu
cces
s
60/40 Wins create 10x NPVIncrease products with 60/40 win: 30% of sales today to 50% by 2013
70
Be a high-performance organization of enthusiastic owners
Win with superior capabilities in Desire, Decide and Delight
Accelerate growth both in and beyond the core
Relentlessly drive out waste
Centennial Strategy
We make everyday life better, everyday
Maximize economic profit across categories, customers and countries
Be best at building big-share brands in economically-attractive midsized categories
Double-Digit annual
Economic Profit growth
MISSION
OBJECTIVES
GOAL STRATEGIES
Accelerate growth both in and beyond the core• More aggressively extend our brands into new categories and
channels with emphasis on professional products opportunities.• Accelerate growth in the Americas and Australia/New Zealand first,
and explore new geographies second.• Capitalize on trends of health & wellness, convenience, sustainability
and ethnicity.• Leverage financial strength and develop capabilities to grow beyond
the core.
• 3-5% annual Sales Growth
• EBIT +50bp to +75bp annually
36
71
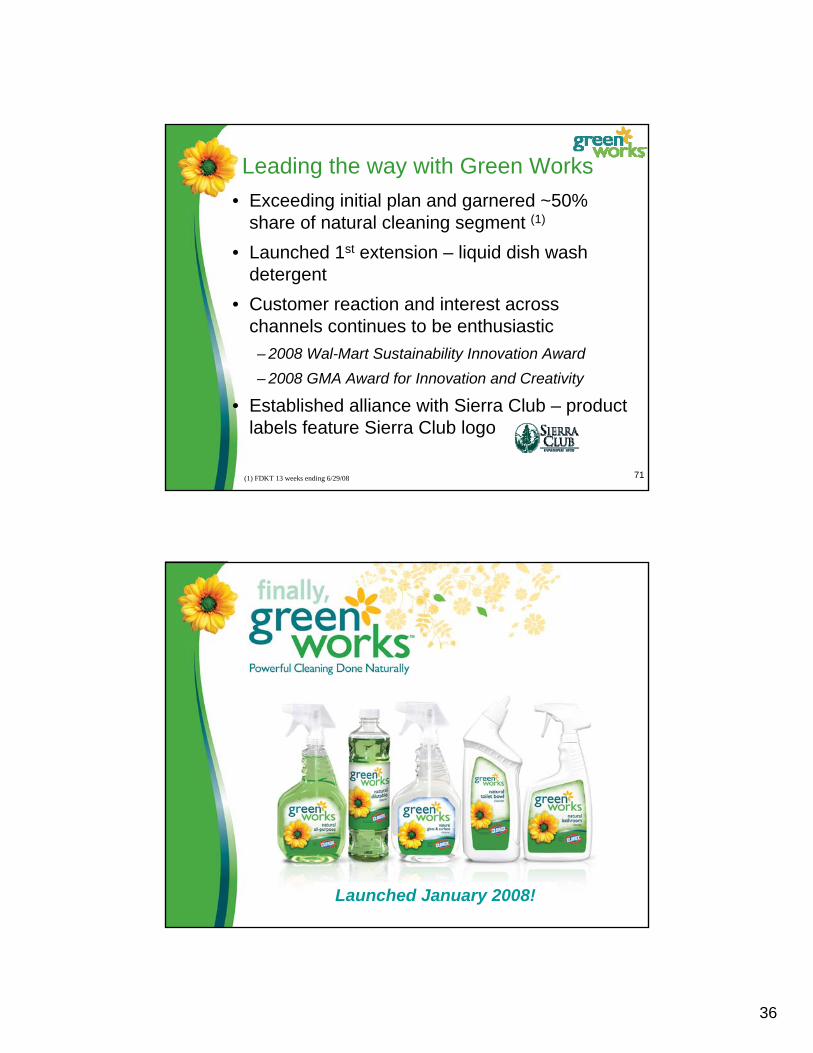
• Exceeding initial plan and garnered ~50% share of natural cleaning segment (1)
• Launched 1st extension – liquid dish wash detergent
• Customer reaction and interest across channels continues to be enthusiastic– 2008 Wal-Mart Sustainability Innovation Award– 2008 GMA Award for Innovation and Creativity
• Established alliance with Sierra Club – product labels feature Sierra Club logo
Leading the way with Green Works
(1) FDKT 13 weeks ending 6/29/08
72Launched January 2008!
37
73
Introducing Dish DetergentLaunched August ‘08
Burt’s Bees AcquisitionExtending our Reach

38
75
Burt’s Bees Overview
A leading brand in the growing $6.4B Natural Personal Care (NPC) segment
Products across many Natural Personal Care categories including lip care, facial care and body care
Unique capability in developing and manufacturing products with natural ingredients
$170MM in 2007 (est.) net sales with roughly 90% in US and balance concentrated Canada, UK and Taiwan
Profitability metrics at the high-end of Personal Care
30%+ EBITDA Margin
385 employees. 1 manufacturing facility, 1 distribution center and headquarters in Raleigh-Durham, North Carolina
76
Other
Re vlon I nc
Co lomer U SA
Co mbe In c
Estee Lauder
John Fri eda
Wella Corp
Alberto-Culver Co
John Paul Mitchell
Clairol Inc
Unilever
Procter& Gamble
L'Oreal
Other
LVMH
AM C osm etics I nc
Neutr ogen a C orp
Chanel SAMary Kay Inc
Del Pharmaceuticals Inc
Avon Products Inc
CliniqueLaboratories Inc
Procter& Gamble
Revlon Inc
EsteeLauder
L'Oreal
Other
Private Label
Beiersdorf Inc
Kao Brands CoMary Kay Inc
Johnson & Johnson
Limited Brands Inc
UnileverNeutrogena Corp
CliniqueLaboratories Inc
Estee Lauder
AvonProducts Inc
Procter& Gamble
L'Oreal
Other
Na tur e's Gat e
Tom's of Maine
Burt's BeesHain- Celestial*
AvedaThe Body Shop
Other
Clinique Lab oratories Inc
Liz Claiborne Inc
LVMHCosmopoli tan Cosmetics
Chanel SACoty Inc
Elizabeth Arden Co
AvonProducts Inc
LimitedBrands Inc
LancasterGroup
EsteeLauder
L'Oreal
Other
Johnson& Johnson
Roche
Allergan
AvonProducts Inc
EsteeLauder
L'Oreal
Procter&
Gamble
OtherChurch &
Dwight Co Inc
PrivateLabel
Johnson& Johnson
GlaxoSmithKline
PfizerInc
Colgate-Palmol ive Co
Procter&
Gamble
Other
ClairolInc
L'Oreal
B eier sdor f I nc
R evlon I nc
Bic Corp
SC Jo hnson & So n Inc
Private LabelColgate-Palmolive Co
Combe Inc
Schick-WilkinsonSword
Unilever
Procter&
Gamble
Other
Jo hnson & Jo hnson
Avo n Pr oducts In c
Procter& Gamble
Colgate-Palmolive Co
DialLimitedBrands
Inc
Unilever
Other
K ao B ra nds C o
A von
P rodu cts I nc
RevlonInc
Church& DwightCo Inc
Col
gate-
Pal
mol
ive
Co
Uni lever
Procter&
Gamble
Oth er
Est eeLaud er
L'O real
Tann
ing
Resea
rch
Neu
tro
gena
Cor
pSu
n P
har
mac
eut
ical
s C
orp
Other
Pri
vate
Label
BicCorp
SC
Joh
nson
& S
on
Inc
Sch
ick-
Wil
kins
on Sw
ord
Oth
erRoc
he
Alle
rgan
Avo
n Pro
du
cts I
nc
Est
ee L
aud
erL'
Ore
alPr
octe
r & G
amble
Hair Care Cosmetics Skin Care NaturalPersonal
Care
Fragrances Cosme-ceuticals
OralCare
Men'sCare
Bath &Shower
Deod
ora
nts
Sunca
reD
epila
tori
es
Baby
care
$10.1B $8.1B $7.6B $6.4B $6.0B $5.7B $4.7B $4.6B $4.4B $2.2
B
$1.1
B$0.9
B$0.
8B
Total =$62.4B
0%
20%
40%
60%
80%
100%
Perc
ent
of T
ota
l
Share of Top 5 62% 65% 41% 17% 50% 49% 80% 64% 57%
90%
57%
74%
48%
U.S. Natural Personal Care Market Is Highly Fragmented & Lacks Entrenched Scale Players
U.S. Retail Personal Care Product Market, 2006
*Notes: Hain-Celestial includes Jason, Para, Zia, Alba and Avalon brands.Uses 2005 competitor share on total 2006 sales. Tom’s of Maine is owned by Colgate-Palmolive and The Body Shop is owned by L’Oreal.
Source: Euromonitor; Datamonitor; Nutrition Business Journal

39
77
Natural Personal Care Is Large and Rapidly Growing
Cosm
ece
utica
ls
Natu
ral
Per
sonal Care
Men
's C
are
Baby C
are
Sunca
re
Deo
dora
nts
Skin
Car
e
Del
ipato
ries
Hairca
re
Colo
r C
osm
etic
s
Fra
gra
nce
s
Ora
l Car
e
Bath
and S
how
er
11.0%
9.3%
5.9% 5.7%
4.3%
3.6%3.1%
1.7% 1.5% 1.5%
0.9%
-0.1%-0.5%
-3%
0%
3%
5%
8%
10%
13%
2003-2
006 C
AG
R
U.S. Personal Care Product Category Growth Rates, 2003-2006
Projected growth of natural personal careis 7.7% for 2006-2010
U.S. Personal Care market was $62B in 2006, with historical growth rates of 3.2% (2003-2006)Natural Personal Care (NPC) is large ($6.4B) and one of the fastest growing sub-categoriesNPC is also global – NPC growing double digit rates across Europe and Asia
Source: Euromonitor; Datamonitor; Nutrition Business Journal
78
Burt’s Bees Market Share by Category, Natural Food Channel Only
Source: SPINS as of 10/07
Burt’s Bees Has Leading Presence
Lip Care Foot Care Kits/Gifts Baby Care Other Skin Care
45.2%42.7%
39.6%
17.8%
10.2%
0%
10%
20%
30%
40%
50%
Burt
's B
ees
Mar
ket
Shar
e
Market Position No. 1 No. 1 No. 1 No. 2 No. 2

40
79
Lip
• Lip Balm
• Lip Shimmers
• Lip Gloss
Face
• Day Creams
• Night Creams
• Eye Creams
• Serums
• Cleaners
• Toners
• Scrubs
• Acne
Body
• Body Lotions
• Hand Creams
• Foot Creams
• Oils
• Moisturizing Mists
• Body Wash
• Soaps
• Scrubs
Hair
• Shampoos
• Conditioners
• Hair Treatment
Baby
• Powder
• Oil
• Lotions
• Ointments
• Bath
• Shampoo
• Soap
Outdoor & Natural
Remedies
• Ointments
• Insect Relief
• Sun Care
• Lip Balm
GiftsKits
Burt’s Bees Portfolio
80
DelightDesire Decide
Build a truly authentic brand with sustained
marketing support
Enhance product innovation and
expand into new segments
Expand distribution and
in-store presence
How We Will Grow The Business
International Component – Continue to grow in existing markets; look to enter new, high potential markets

41
81
Be a high-performance organization of enthusiastic owners
Win with superior capabilities in Desire, Decide and Delight
Accelerate growth both in and beyond the core
Relentlessly drive out waste
Centennial Strategy
We make everyday life better, everyday
Maximize economic profit across categories, customers and countries
Be best at building big-share brands in economically-attractive midsized categories
Double-Digit annual
Economic Profit growth
MISSION
OBJECTIVES
GOAL STRATEGIES
Relentlessly drive out waste• Continue to drive value through the CCEM program, with
significant focus on Buy, Make and Ship.• Minimize the cost of processes that are not a source of our
competitive advantage• Use environmental sustainability lens to accelerate cost
savings and reduce the Company's environmental footprint
• 3-5% annual Sales Growth
• EBIT +50bp to +75bp annually
82
Solid Track Record in Delivering Savings
Clorox has consistently delivered about $100 million per year in cost reduction / productivity improvements.
170bp
93
FY08
230bp
107
FY07
111104108Profit Impact ($MM)
260bp
FY04
250bp
FY06
230bp
FY05
Margin Benefit
Anticipate $80MM - $90MM ongoing annual savings

42
83
Cost Management Program (CCEM)is SustainableMajor Initiatives
World Class Manufacturing & Distribution
Network Optimization
Materials and Product Sourcing
Product Design Optimization
Trade Spending Efficiency
Productivity/Sourcing
84
Pricing
Clorox has aggressively taken pricing to offset rising inflationary and commodity cost increases.
150bp
77
FY07
55944520Profit Impact ($MM)
30bp
FY04
160bp
FY06
70bp
FY05 FY08
80bpMargin Benefit
Note: During FY08 and FY09, Clorox will have taken pricing on slightly more than 50 % of its portfolio. List of price increases by brand and date can be found at Clorox’s investor page at http://investors.thecloroxcompany.com

43
85
Example: Price Premium Trend
(1) Total US FDmx
Wtd Base Price Per Volume For Glad Base Kitchen Trash Bags AndPrivate Label Kitchen Trash Bags in Total U.S (Fdmx)
0.00
0.04
0.08
0.12
0.16
10/0
7/05
02/0
7/06
06/0
7/06
10/0
7/06
02/0
7/07
06/0
7/07
10/0
7/07
02/0
7/08
06/0
7/08
Wtd
Bas
e Pr
ice
Per V
olum
e
Clorox
Private Label
Kitchen Trash – Pricing per Volume (1)
Wtd Base Price Per Volume For Clorox Bleach AndPrivate Label Bleach In Total U.S. - Fdmx
0.00
0.01
0.01
0.02
0.02
0.0310
/07/
05
02/0
7/06
06/0
7/06
10/0
7/06
02/0
7/07
06/0
7/07
10/0
7/07
02/0
7/08
06/0
7/08W
tdB
ase
Pric
e Pe
r Vol
ume
Clorox
PrivateLabel
Liquid Bleach – Pricing per Volume (1)
In most categories
where we track
private label,
trend is base
price gap is flat or
declining
over last 3 years
Other

44
87
Private Label ShareUS total PL share has been relatively flat in recent years; with only a modest increase in recent monthsGrowth in private label is in Club (16% share of PL); plays to Clorox’s strength as Club typically carries private label and #1 brand.
US Private Label Share of CPG Spending: All Outlet
15.9%21.3%2007
21.1%21.1%20.6%20.5%Unit15.2%
2004
15.7%
2006
15.5%
2005 200852wks ending 3/30/YY (1)
16.4%Dollar
(1) IRI June 2008 and Mar 2008
Private Label Share in Clorox Categories: FDMx
14.3%
2007
13.2%
2004
14.2%
2006
13.7%
2005 200852wks ending 6/15/YY (1)
14.5%Dollar
Private Label share in Clorox categories has seen only modest growth.
88
Reconciliation:Sales excl. Divestitures & Acquisitions
($MM) FY02 FY03 FY04 FY05 FY06 FY07 FY08
Sales - as reported 3,859 3,986 4,162 4,388 4,644 4,847 5,273Sales growth 3% 4% 5% 6% 4% 9%
Less: Divested businesses 64 16 0 0 0 0 0Less: Acquisitions 0 0 0 0 0 31 146
Sales - excl. divestitures & acquisitions 3,795 3,970 4,162 4,388 4,644 4,816 5,127Sales growth 5% 5% 5% 6% 4% 6%
45
89
Environmental SustainabilityEnvironmental stewardship has always been a core value and focus of The Clorox Company
The Chlorine Institute in 2005 recognized The Clorox Company's U.S. bleach plants for "master" environmental achievement. Most recently, in 2007, the Institute recognized Clorox’s domestic plants with Chlorine Institute's Safety and Environmental Excellence Award for nine years without a reportable chlorine release (reportable release standard is very low, at only +10 lbs. of chlorine released).
In 2006, The Clorox Company created the position of Vice President – Sustainability & Innovation. This executive is responsible for leveraging Clorox’s environmental sustainability opportunities.
The Clorox Company recently increased its commitment to address it’s greenhouse gas (GHG) emissions. We are currently undertaking a comprehensive inventory of our energy usage and emissions at 35 of our manufacturing plants, warehouses and key offices in North America.
The Clorox Company is an active member of two Wal*Mart Sustainable Value Networks: Packaging and Chemical-Intensive Products.
In 2006, the West Virginia Department of Environmental Protection recognized our Kingsford plant in Parsons, West Virginia with an Environmental Excellence Award. We were the only company in West Virginia with more than 100 employees to receive this award.
90
Environmental SustainabilityPackaging
More than 90 percent of our product cartons (not corrugated cases) are now made from 100 percent recycled content (minimum 35 percent post-consumer content and the remainder reused scraps/waste).
Plastic resin in the 96oz Clorox® liquid bleach bottles was reduced by 10g in 2005, translating to about 3.8MM less lbs of HDPE resin used per year.
Clorox ® Liquid Bleach
The Clorox Company is recognized as having best practice chlorine handling practices by the U.S. EPA and Homeland Security government agencies. We share our patented chlorine rail car safety valve with other companies free of charge.
Glad® ProductsGlad® ForceFlex® technology provides a stronger trash bag that stretches while saving over 1 million pounds of plastic film per year.
The Glad business does not throw out any rejected product or scrap plastic. Almost all waste resin is either reclaimed or sent to a third party for recycling.
Bleach has saved more lives than any other substance made by man** Due to reduction in waterborne disease as reported by Dr. Abel Wolman, Former
President, American Public Health Association

46
91
Environmental SustainabilityKingsford® Charcoal
Kingsford® charcoal with Sure Fire Grooves®, introduced in FY 05, enabled a 10% decrease in material use and 5% reduction in transportation from its previous briquette.
Kingsford® charcoal is an industry leader in environmental controls and sustainability. Operations include:State-of-the-art air-emission controls that include a post-combustion chamber for the wood-charring operation, and dust collectors in other parts of the operation to control particulate emissions.
Recycling of recovered dust and broken briquettes generated during manufacturing.
Containment and reuse of process water in the manufacturing operation.
Char is produced in retort kilns that recycle energy and minimize air emissions.
Plants purchase waste wood for our charcoal from area wood products businesses diverting it from the waste stream.
Brita® ProductsPlastic: A single Brita® pour-through filter can replace 300 standard 0.5 L (16.9 ounce) containers of bottled water.
A Brita® pour-through filter and pitcher (40 gal or 151 liter capacity) uses only about 1 lb. of plastic resin.
300 bottles needed for that same 40 gallons would use about 15 lbs. of plastic resin.
Transportation: One truck can only hold ~ 40,000 lbs. or 5,000 gallons of bottled water.In contrast, a truck can hold 120,960 filters, or the equivalent of 4.8 Million gallons of filtered water.
92
Diversity Leadership
Diversity partnerships with 25 professional organizations
No. 6 in California for percentage of female executive leaders
100% on Human Rights Campaign’s Corporate Equality Index for 2nd year
Hosted 10 Bay Area Diversity Summits events
Employees featured in: Black EOE Journal, Diversity Matters, Ebony, Hispanic Business, Hispanic Network, Oakland Tribune, Out Now, Professional Woman’s, San Francisco Chronicle, and Wall Street Journal

47


