Download - THE CORRELATION COEFFICIENT - cankaya.edu.tr
1
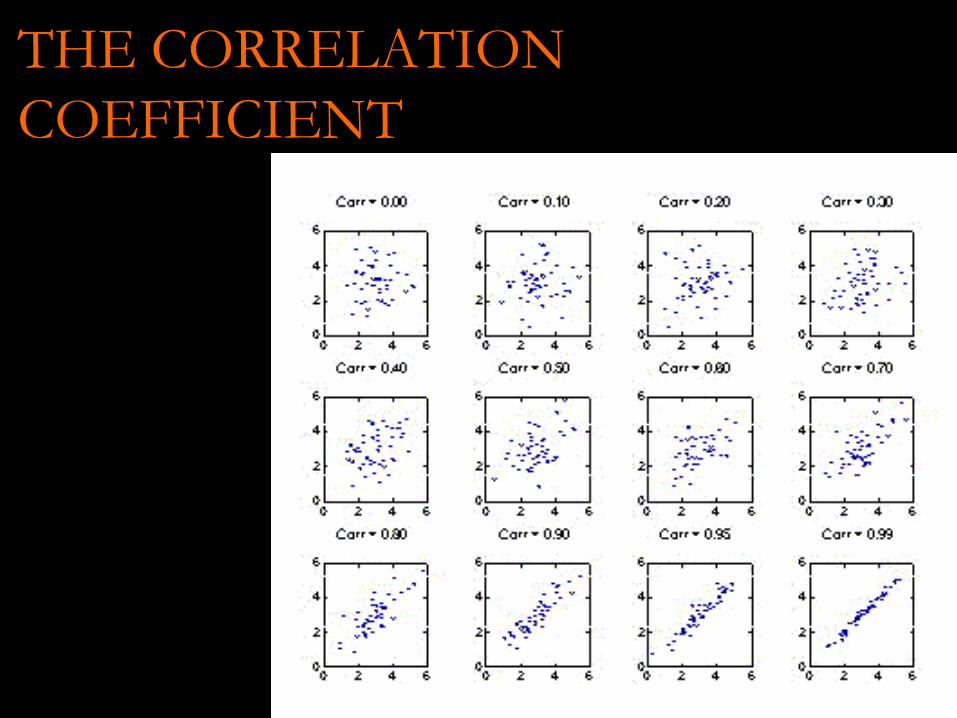
THE CORRELATION
COEFFICIENT
2
More Statistical Notation
Correlational analysis requires scores from two
variables. X stands for the scores on one
variable and Y stands for the scores on the
other variable. Usually, each pair of XY scores is
from the same participant.

3
Correlation Coefficient
• A correlation coefficient is the descriptive
statistic that, in a single number, summarizes
and describes the important characteristics in
a relationship
• It does so by simultaneously examining all
pairs of X and Y scores

4
Understanding Correlational Research

5
Drawing Conclusions
• The term correlation is synonymous with
relationship
• However, the fact that there is a relationship
between two variables does not mean that
changes in one variable cause the changes in
the other variable

6
Plotting Correlational Data
• A scatterplot is a graph that shows the
location of each data point formed by a pair
of X-Y scores
• When a relationship exists, as the X scores
increase, the vertical height of the data points
changes, indicating that the Y scores are
changing

7
Strong Relationship

8
No Relationship

9
Types of Relationships
10
Linear Relationships
• In a linear relationship as the X scores
increase, the Y scores tend to change in only
one direction
– In a positive linear relationship, as the scores
on the X variable increase, the scores on the Y
variable also tend to increase
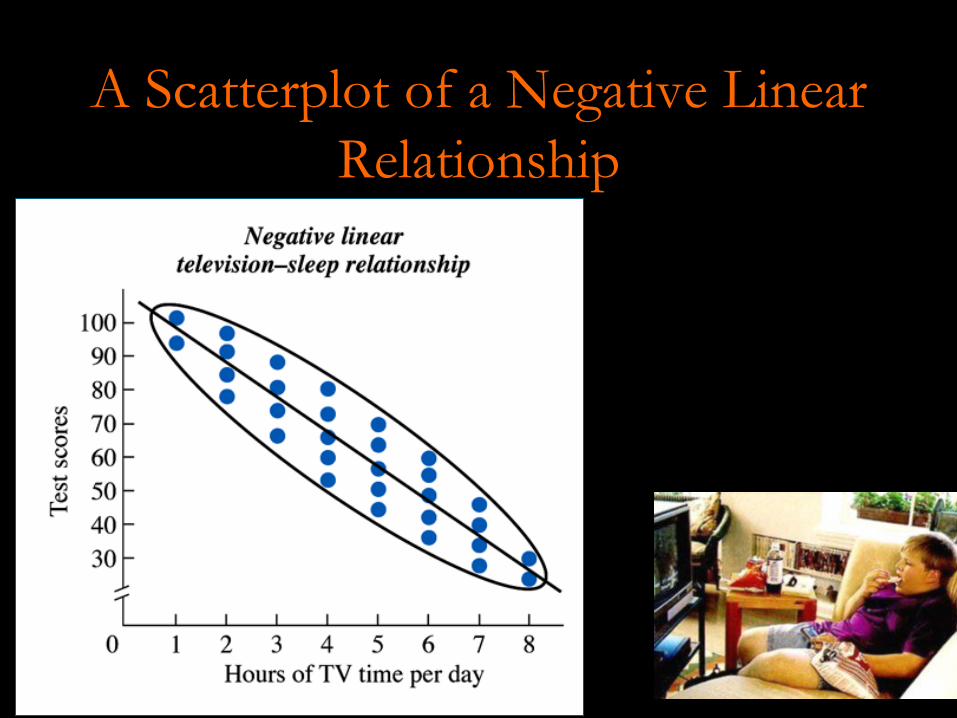
– In a negative linear relationship, as the scores
on the X variable increase, the scores on the Y
variable tend to decrease

11
• When values on two variables tend to go in the
same direction, we call this a direct relationship.
• The correlation between children’s ages and heights
is a direct relationship.
• That is, older children tend to be taller than younger
children.
• This is a direct relationship because children with
higher ages tend to have higher heights.
Direct Relationship
12
• When values on two variables tend to go in opposite
directions, we call this an inverse relationship.
• The correlation between students’ number of
absences and level of achievement is an inverse
relationship.
• That is, students who are absent more often tend to
have lower achievement.
• This is an inverse relationship because children with
higher numbers of absences tend to have lower
achievement scores.
Inverse Relationship

13
A Scatterplot of a Positive Linear
Relationship
14
A Scatterplot of a Negative Linear
Relationship
15
Nonlinear Relationships
In a nonlinear, or curvilinear, relationship, as
the X scores change, the Y scores do not tend
to only increase or only decrease: At some point,
the Y scores change their direction of change.

16
A Scatterplot of a Nonlinear
Relationship
17
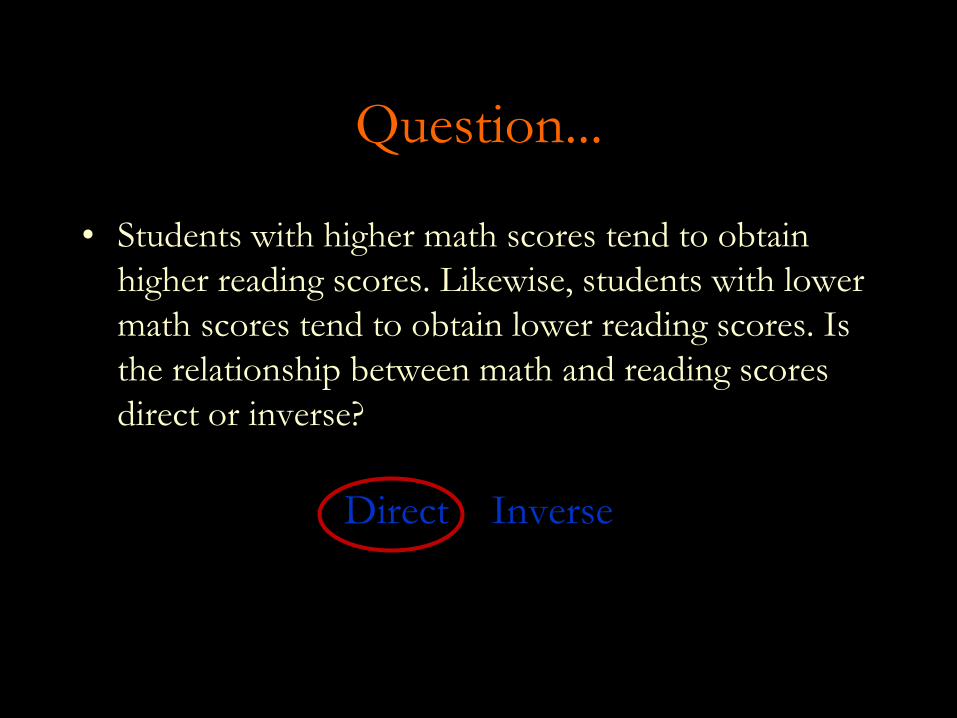
Question...
• Students with higher math scores tend to obtain
higher reading scores. Likewise, students with lower
math scores tend to obtain lower reading scores. Is
the relationship between math and reading scores
direct or inverse?
Direct Inverse
18
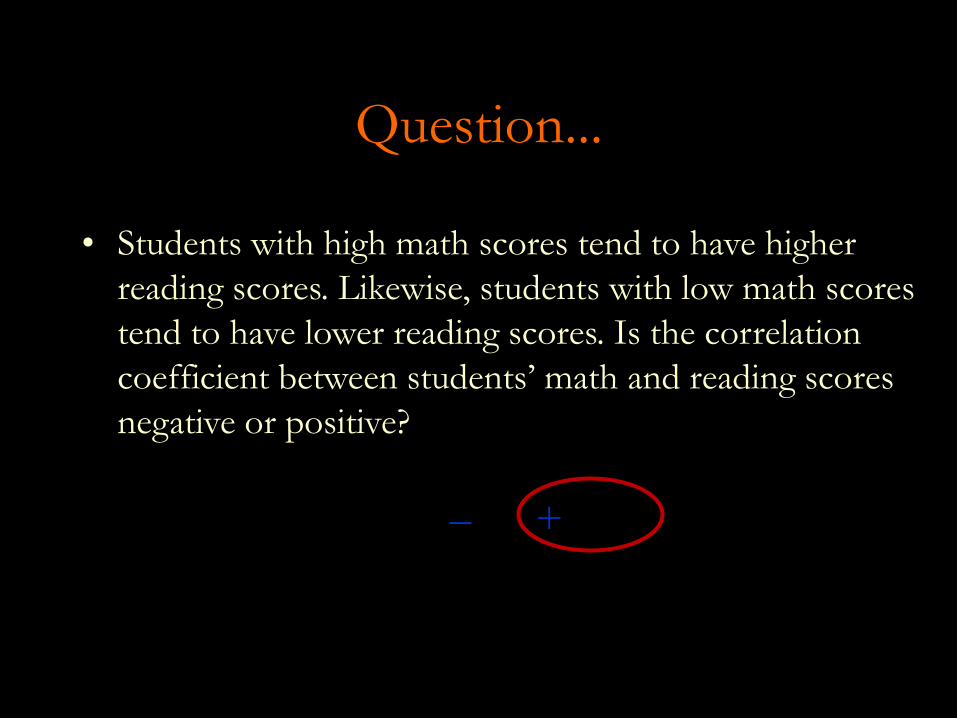
Question...
• Students with high math scores tend to have higher
reading scores. Likewise, students with low math scores
tend to have lower reading scores. Is the correlation
coefficient between students’ math and reading scores
negative or positive?
– +

19
Strength of the Relationship
20
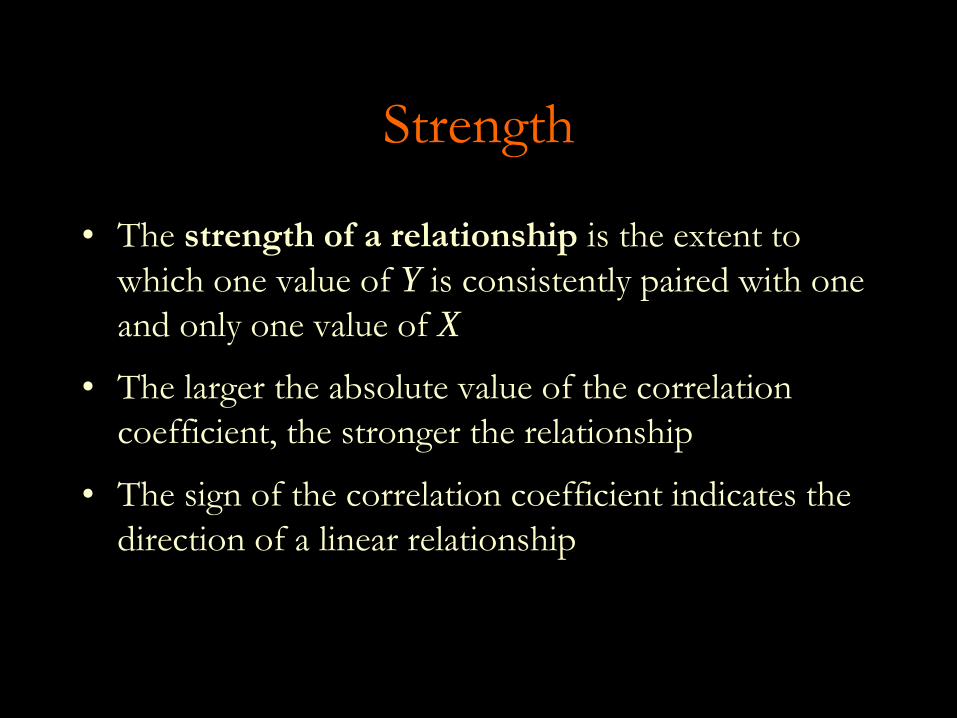
Strength
• The strength of a relationship is the extent to
which one value of Y is consistently paired with one
and only one value of X
• The larger the absolute value of the correlation
coefficient, the stronger the relationship
• The sign of the correlation coefficient indicates the
direction of a linear relationship
21
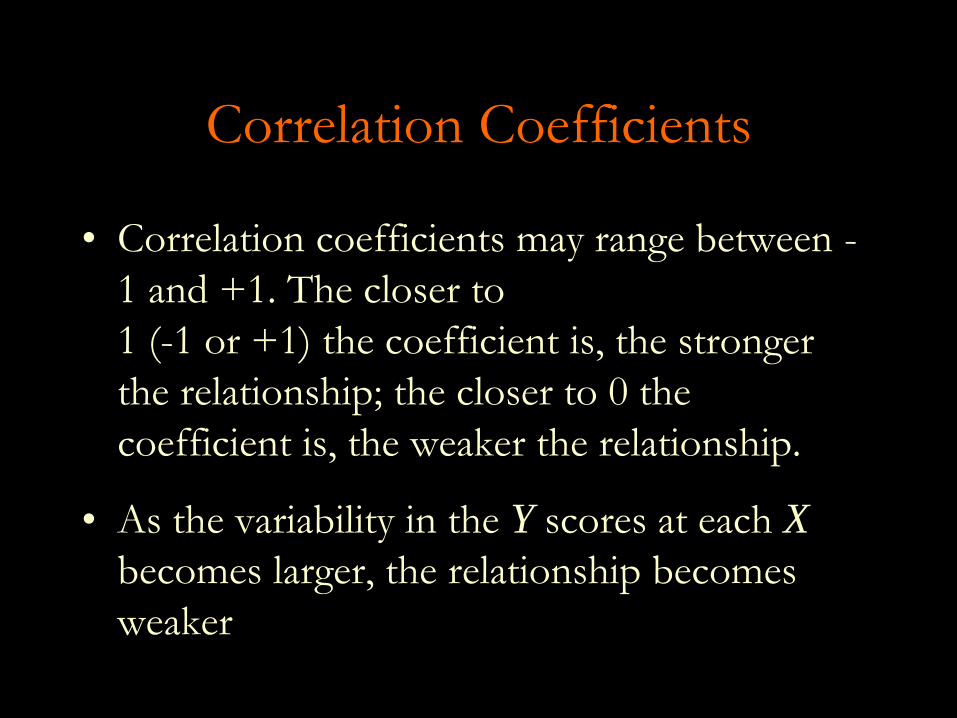
Correlation Coefficients
• Correlation coefficients may range between -
1 and +1. The closer to
1 (-1 or +1) the coefficient is, the stronger
the relationship; the closer to 0 the
coefficient is, the weaker the relationship.
• As the variability in the Y scores at each X
becomes larger, the relationship becomes
weaker
22
Computing Correlational Coefficients
23 ])()([])()([
))(()(
2222 YYNXXN
YXXYNr
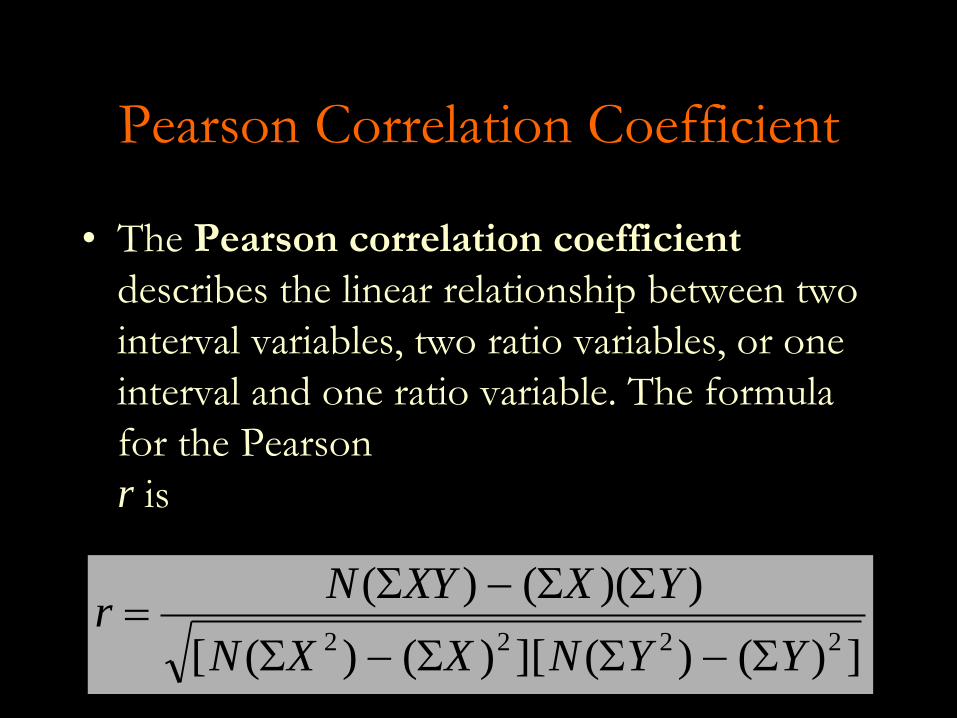
Pearson Correlation Coefficient
• The Pearson correlation coefficient
describes the linear relationship between two
interval variables, two ratio variables, or one
interval and one ratio variable. The formula
for the Pearson
r is

24
Spearman Rank-Order
Correlation Coefficient
)1(
)(61
2
2
NN
Drs
• The Spearman rank-order correlation
coefficient describes the linear relationship
between two variables measured using ranked
scores. The formula is
where N is the number of pairs of ranks and D is
the difference between the two ranks in each pair.
25
X Y
1 8
2 6
3 6
4 5
5 1
6 3
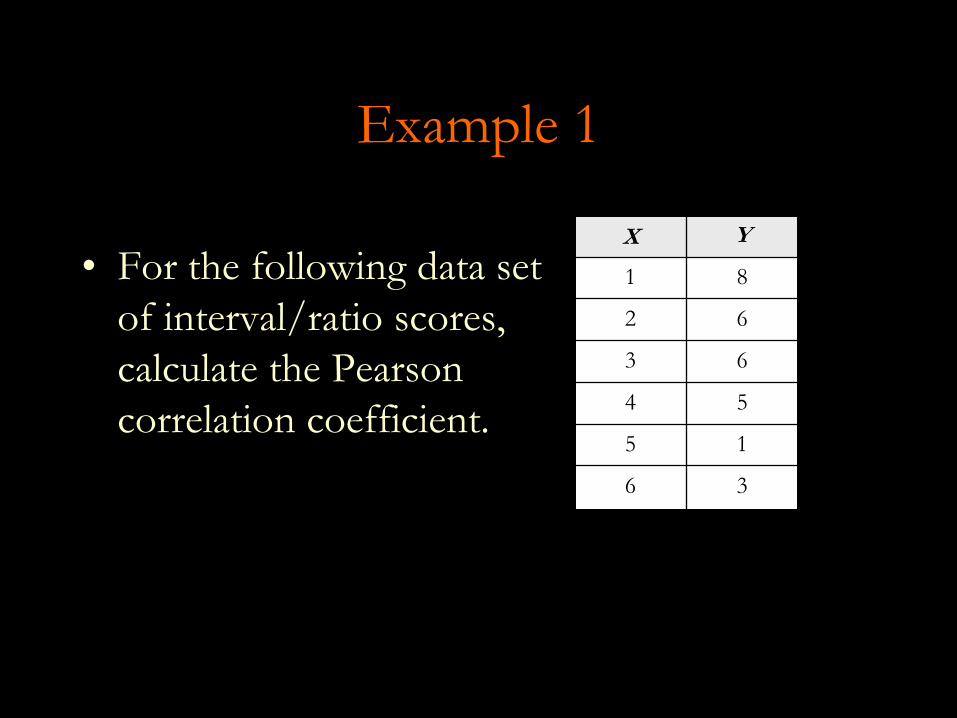
Example 1
• For the following data set
of interval/ratio scores,
calculate the Pearson
correlation coefficient.
26
])()([])()([
))(()(
2222 YYNXXN
YXXYNr
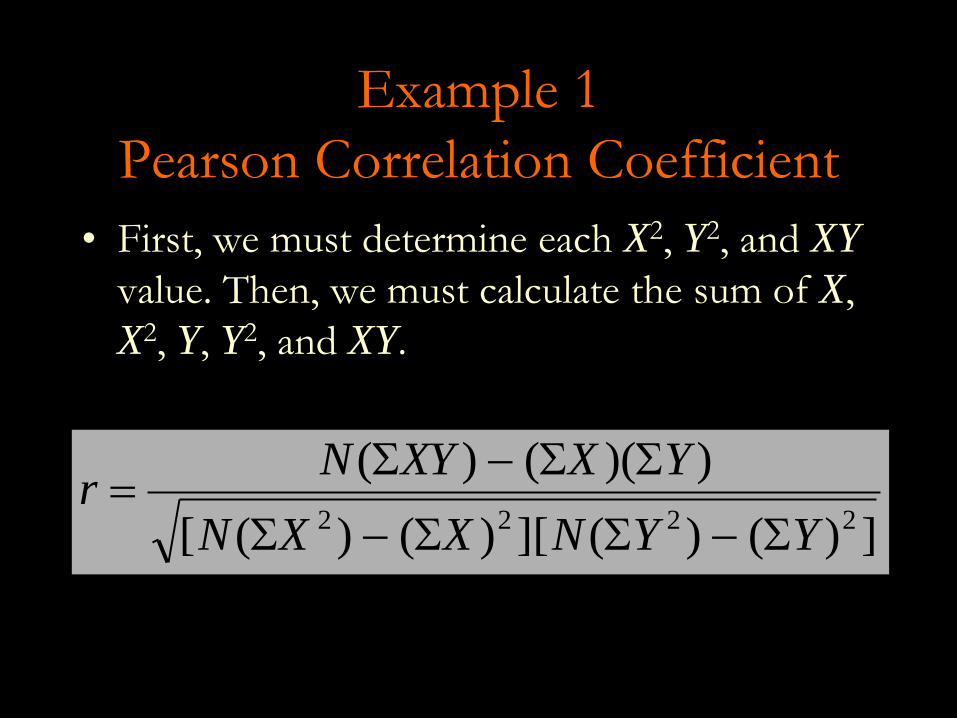
Example 1
Pearson Correlation Coefficient
• First, we must determine each X2, Y2, and XY
value. Then, we must calculate the sum of X,
X2, Y, Y2, and XY.
27
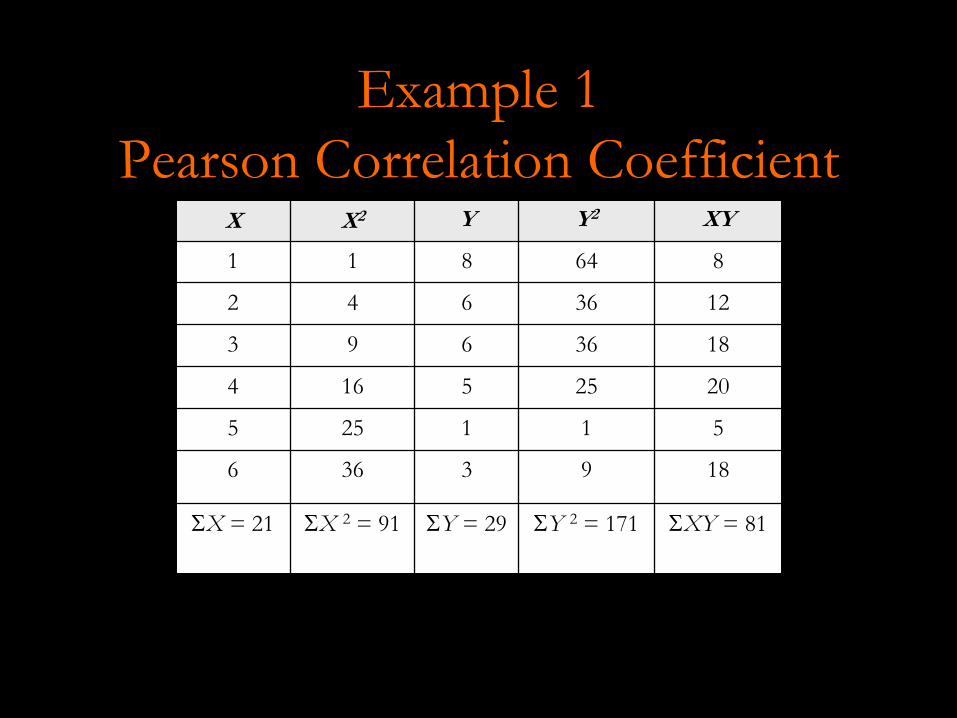
X X2 Y Y2 XY
1 1 8 64 8
2 4 6 36 12
3 9 6 36 18
4 16 5 25 20
5 25 1 1 5
6 36 3 9 18
X = 21 X 2 = 91 Y = 29 Y 2 = 171 XY = 81
Example 1
Pearson Correlation Coefficient
28
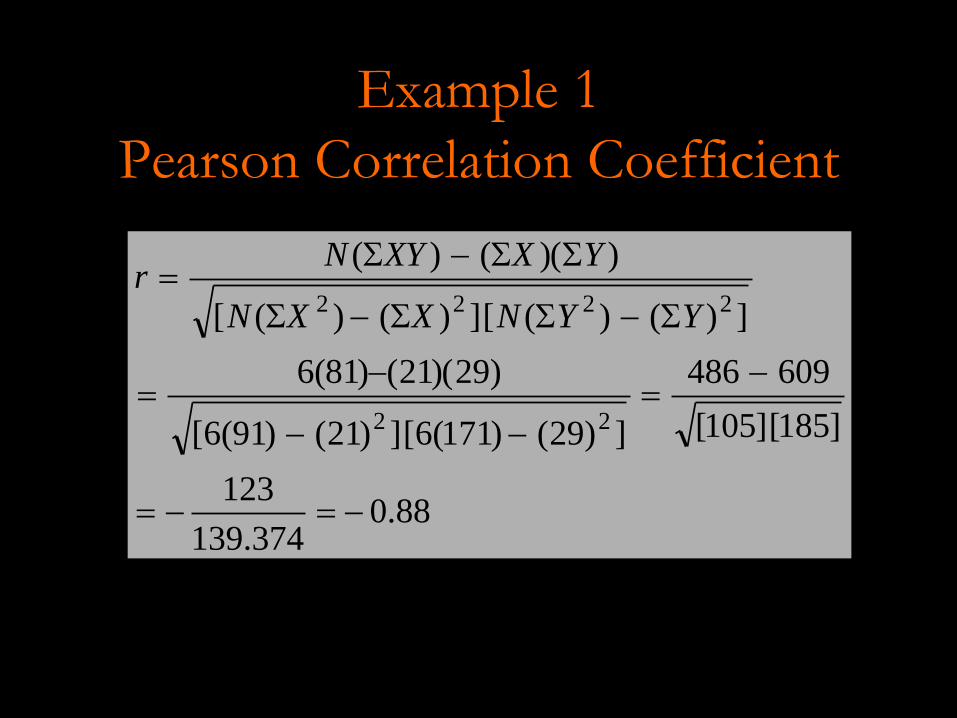
88.0374.139
123
]185[]105[
609486
])29()171(6[])21()91(6[
)29)(21()81(6
])()([])()([
))(()(
22
2222
YYNXXN
YXXYNr
Example 1
Pearson Correlation Coefficient
29
X Y
1 5
2 2
3 6
4 4
5 3
6 1
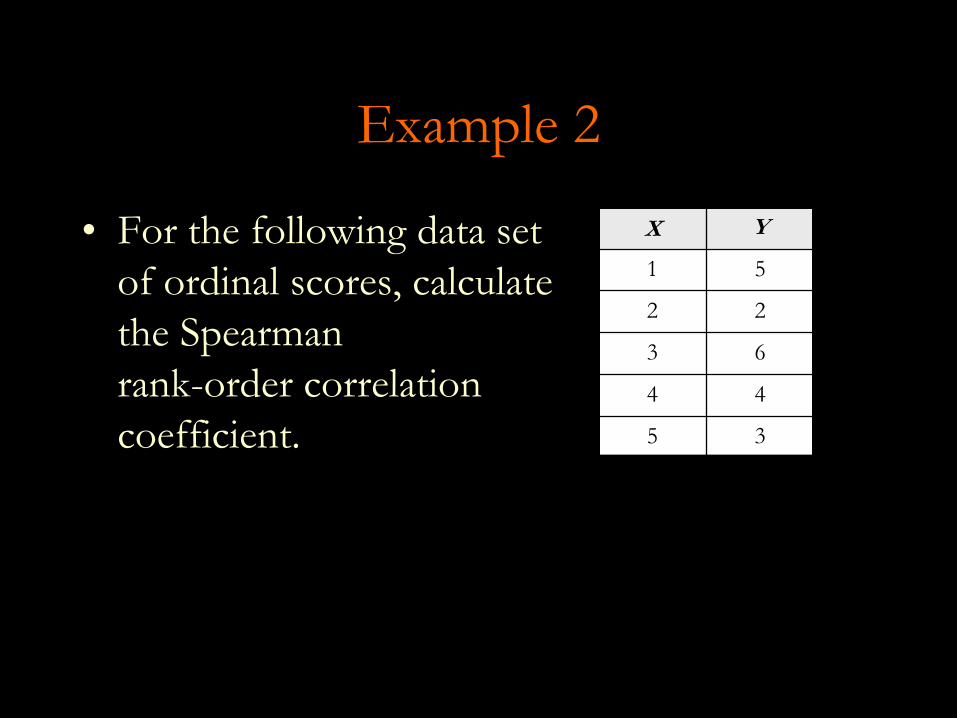
Example 2
• For the following data set
of ordinal scores, calculate
the Spearman
rank-order correlation
coefficient.
30
)1(
)(61
2
2
NN
Drs
X Y D
1 5 -4
2 2 0
3 6 -3
4 4 0
5 3 2
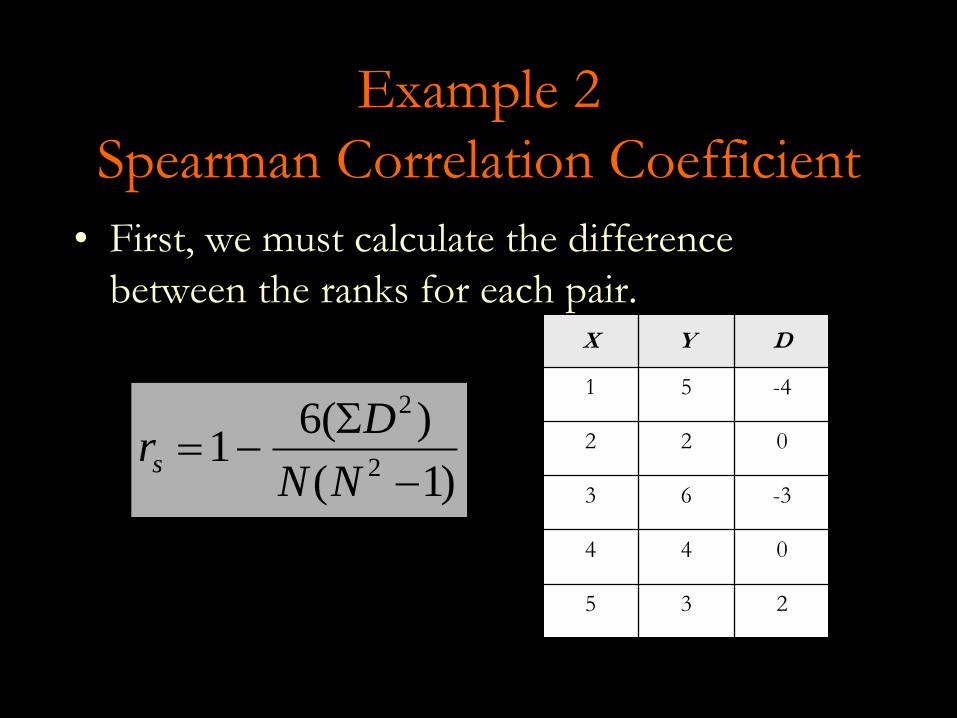
Example 2
Spearman Correlation Coefficient
• First, we must calculate the difference
between the ranks for each pair.

31
X Y D D2
1 5 -4 16
2 2 0 0
3 6 -3 9
4 4 0 0
5 3 2 4
D2 = 29
Example 2
Spearman Correlation Coefficient • Next, each D value is
squared.
• Finally, the sum of
the D2 values is
computed.

32
45.045.11
120
1741
)125(5
)29(61
)1(
)(61
2
2
NN
Drs
Example 2
Spearman Correlation Coefficient

33
• The illustration on the right
involves scores on a reading
readiness test, and scores
later obtained by these same
students on a reading
achievement test.
Reading
ReadinessScores
Reading
AchievementScores
Todd 10 19
Andrea 16 25
Kristen 19 23
Luis 22 31
Scott 28 27
Example 3
34
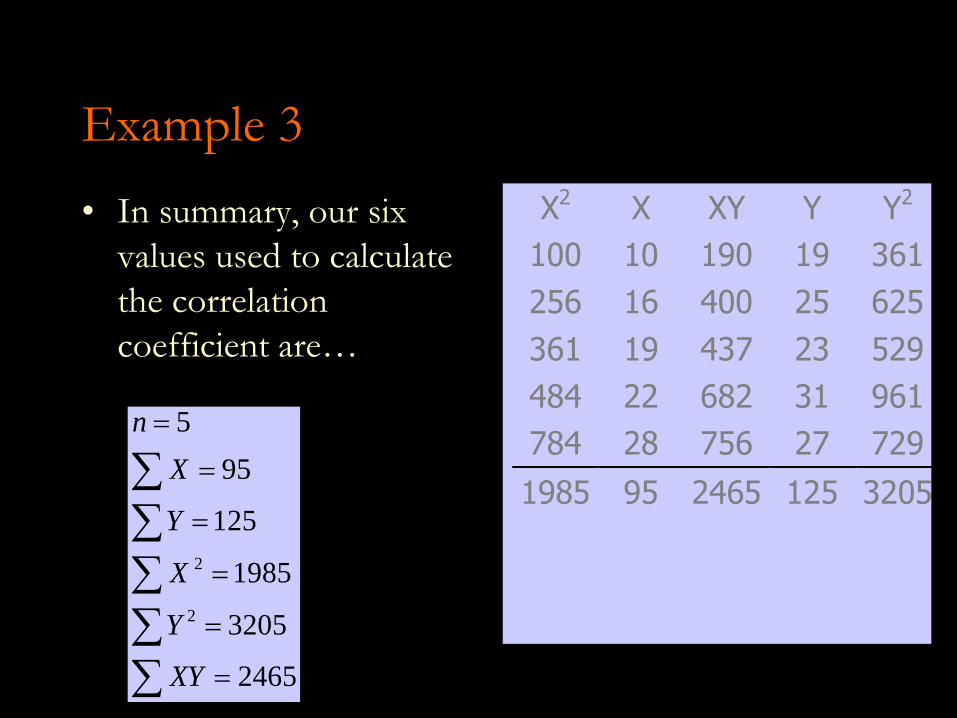
• In summary, our six
values used to calculate
the correlation
coefficient are…
X2 X XY Y Y2
100 10 190 19 361
256 16 400 25 625
361 19 437 23 529
484 22 682 31 961
784 28 756 27 729
1985 95 2465 125 3205
Example 3
2465
3205
1985
125
95
5
2
2
XY
Y
X
Y
X
n

35
The correlation between these students reading readiness
scores and later reading achievement scores is 0.75
75.0600
450
000,360
450
400900
450
625,15025,1690259925
875,11325,12
125320559519855
1259524655
22
r
r
r
r
rXReadingReadinessScores
YReading
AchievementScores
Todd 10 19
Andrea 16 25
Kristen 19 23
Luis 22 31
Scott 28 27

36
• Find the correlation
between spelling and
vocabulary
XY
Y
X
Y
X
n
2
2
XSpelling
YVocabulary
Sandra 8 10
Neil 5 6
Laura 4 7
Jerome 1 3
Example 4
37
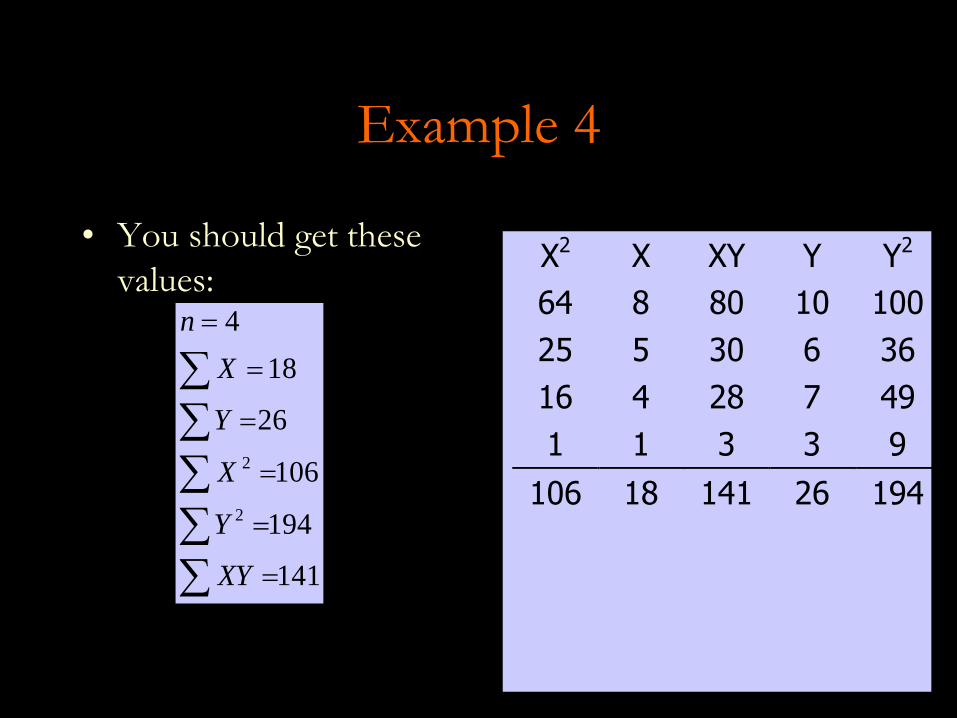
• You should get these
values:
141
194
106
26
18
4
2
2
XY
Y
X
Y
X
n
X2 X XY Y Y2
64 8 80 10 100
25 5 30 6 36
16 4 28 7 49
1 1 3 3 9
106 18 141 26 194
Example 4

38
Example 4
2222 YYnXXn
YXXYnr
96.0100
96
000,10
96
100100
96
676776324424
468564
261944181064
26181414
22
r
r
r
r
rX
Spelling
YVocabulary
Sandra 8 10
Neil 5 6
Laura 4 7
Jerome 1 3

39
What is a high correlation?
• Correlations above 0.80 generally are
regarded as high correlations
• Correlations between 0.50 and 0.80 are
typically considered a medium or moderate
correlations
• Correlations below 0.50 typically are regarded
as low correlations
• These ranges are not exact. Various people
associate somewhat different ranges with
high, moderate, and lower correlations.

40
Restriction of Range
Restriction of range arises when the range
between the lowest and highest scores on one
or both variables is limited. This will reduce the
accuracy of the correlation coefficient,
producing a coefficient that is smaller than it
would be if the range were not restricted.

41
Test 1(X)
Test 2(Y)
96 95
92 86
90 9888 91
86 93
85 8583 96
82 87
81 9080 92
78 94
77 88
76 9174 84
73 90
71 8169 83
67 8963 88
Heterogeneous students...
• Here are the scores of 19
students who obtained a
wide range of scores on two
tests
• When calculated, the
correlation between scores
on the two tests is 0.49
42
Test 1(X)
Test 2(Y)
96 95
92 86
90 9888 91
86 93
85 8583 96
82 87
81 9080 92
78 94
77 88
76 9174 84
73 90
71 8169 83
67 8963 88
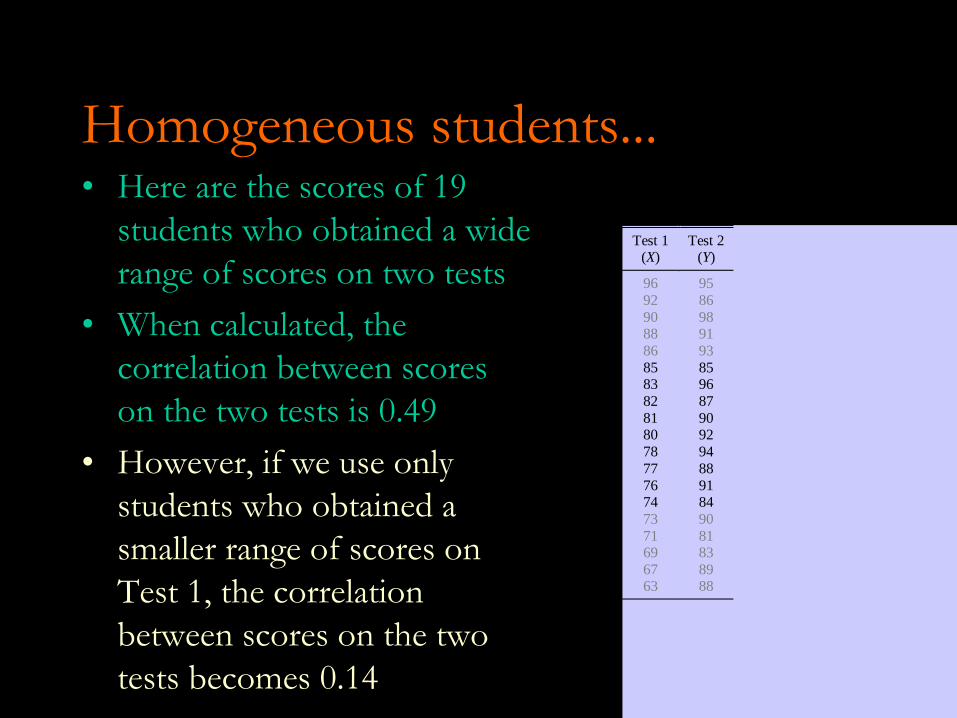
Homogeneous students... • Here are the scores of 19
students who obtained a wide
range of scores on two tests
• When calculated, the
correlation between scores
on the two tests is 0.49
• However, if we use only
students who obtained a
smaller range of scores on
Test 1, the correlation
between scores on the two
tests becomes 0.14
43
Test 1(X)
Test 2(Y)
96 95
92 86
90 9888 91
86 93
85 8583 96
82 87
81 9080 92
78 94
77 88
76 9174 84
73 90
71 8169 83
67 8963 88
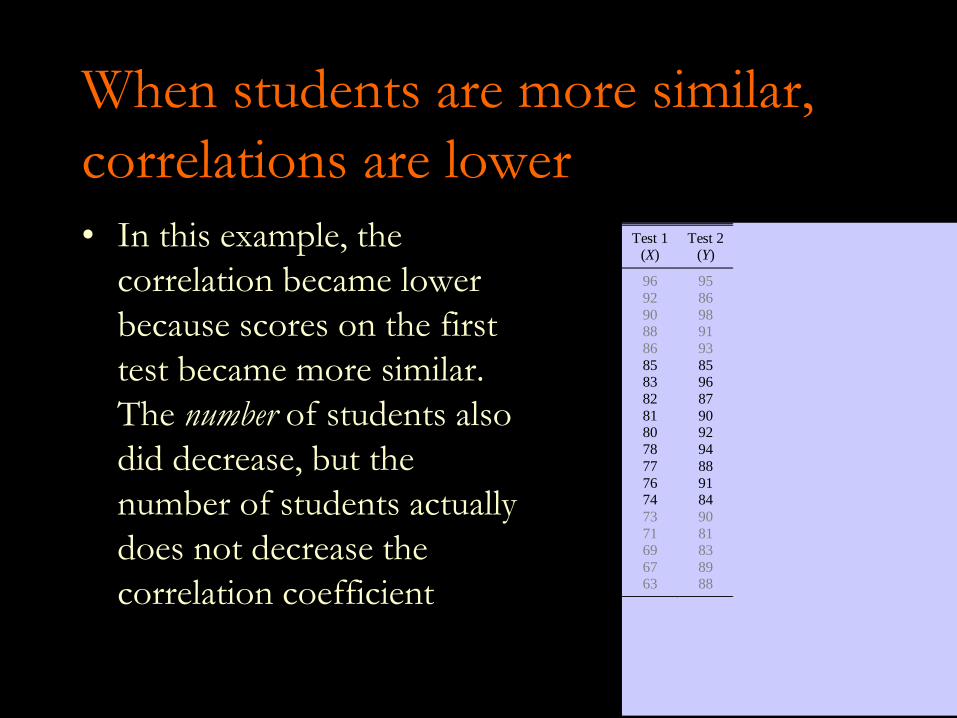
When students are more similar,
correlations are lower
• In this example, the
correlation became lower
because scores on the first
test became more similar.
The number of students also
did decrease, but the
number of students actually
does not decrease the
correlation coefficient
44
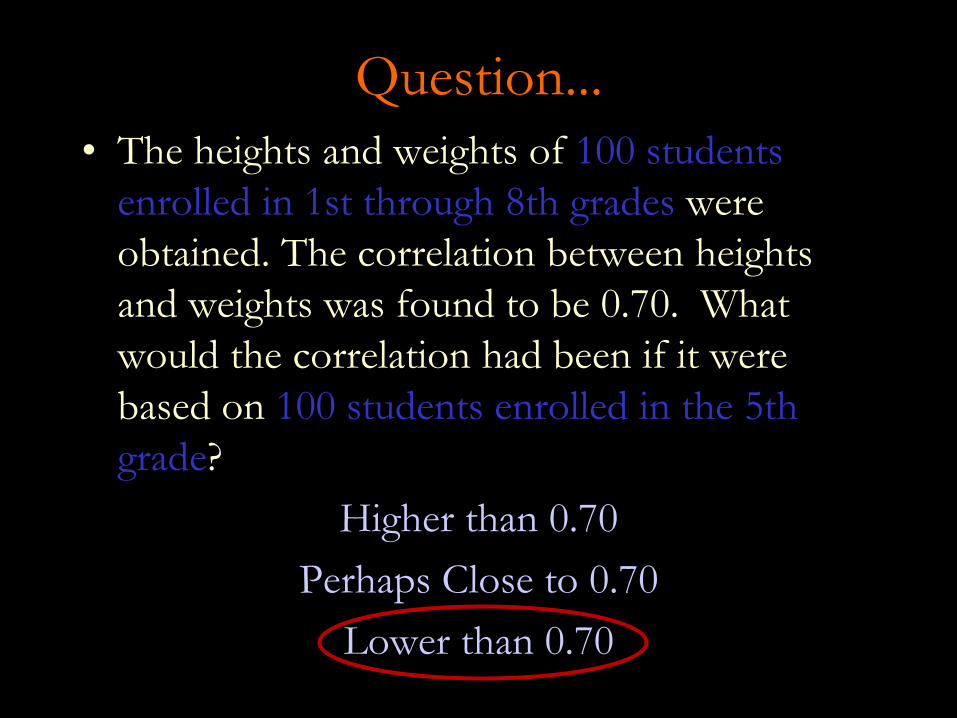
Question...
• The heights and weights of 100 students
enrolled in 1st through 8th grades were
obtained. The correlation between heights
and weights was found to be 0.70. What
would the correlation had been if it were
based on 100 students enrolled in the 5th
grade?
Higher than 0.70
Perhaps Close to 0.70
Lower than 0.70
45
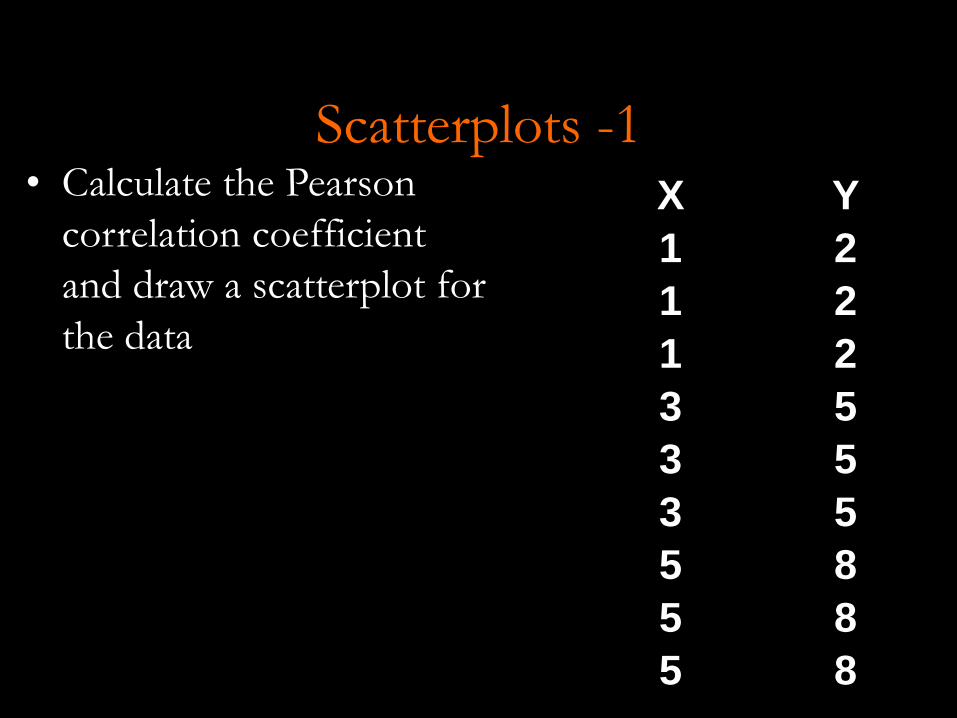
Scatterplots -1
X Y
1 2
1 2
1 2
3 5
3 5
3 5
5 8
5 8
5 8
• Calculate the Pearson
correlation coefficient
and draw a scatterplot for
the data

46
Scatterplots -1
0
1
2
3
4
5
6
7
8
9
0 1 2 3 4 5 6
• r= +1.00

47
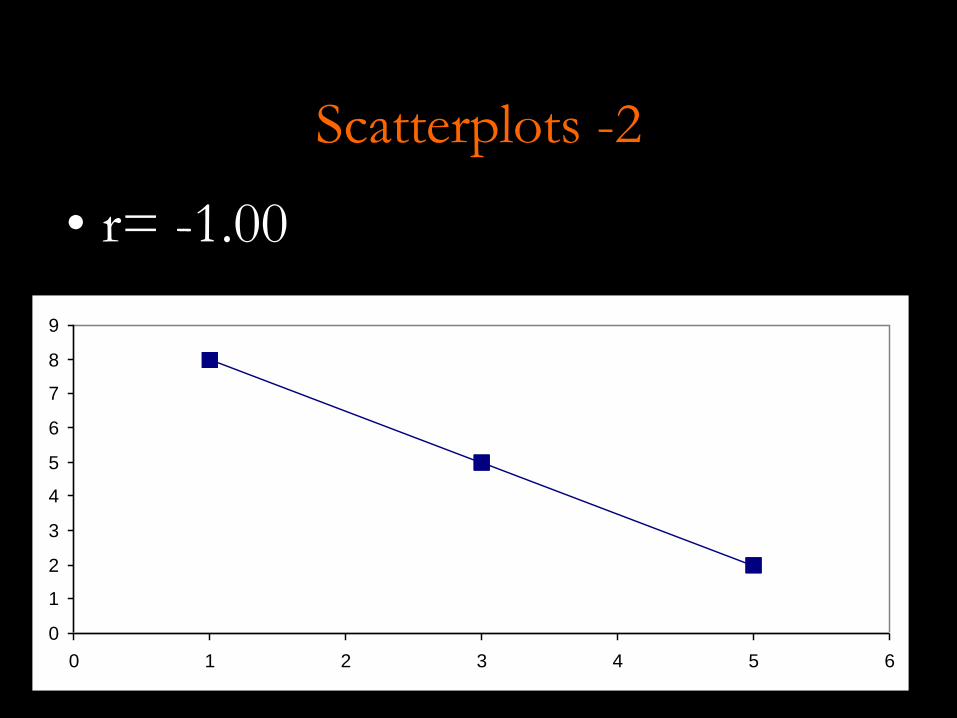
Scatterplots -2 • Calculate the Pearson
correlation coefficient
and draw a scatterplot for
the data
X Y
1 8
1 8
1 8
3 5
3 5
3 5
5 2
5 2
5 2
0
1
2
3
4
5
6
7
8
9
0 1 2 3 4 5 6
48
Scatterplots -2
• r= -1.00
0
1
2
3
4
5
6
7
8
9
0 1 2 3 4 5 6

49
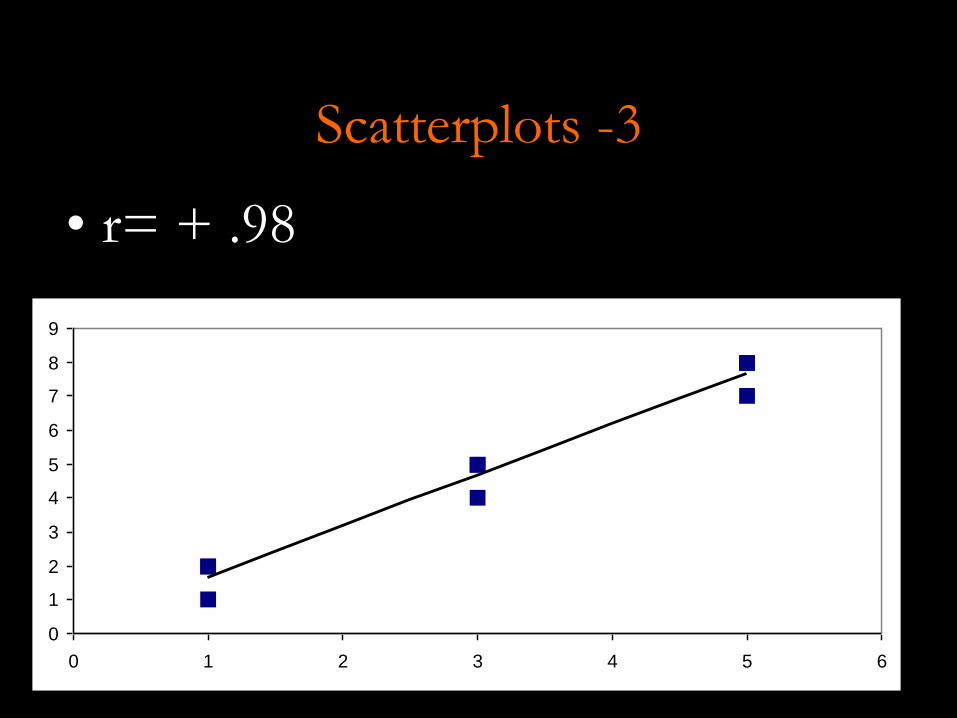
Scatterplots -3 • Calculate the Pearson
correlation coefficient
and draw a scatterplot for
the data
X Y
1 1
1 2
1 2
3 4
3 5
3 5
5 7
5 8
5 8
50
Scatterplots -3
• r= + .98
0
1
2
3
4
5
6
7
8
9
0 1 2 3 4 5 6

51
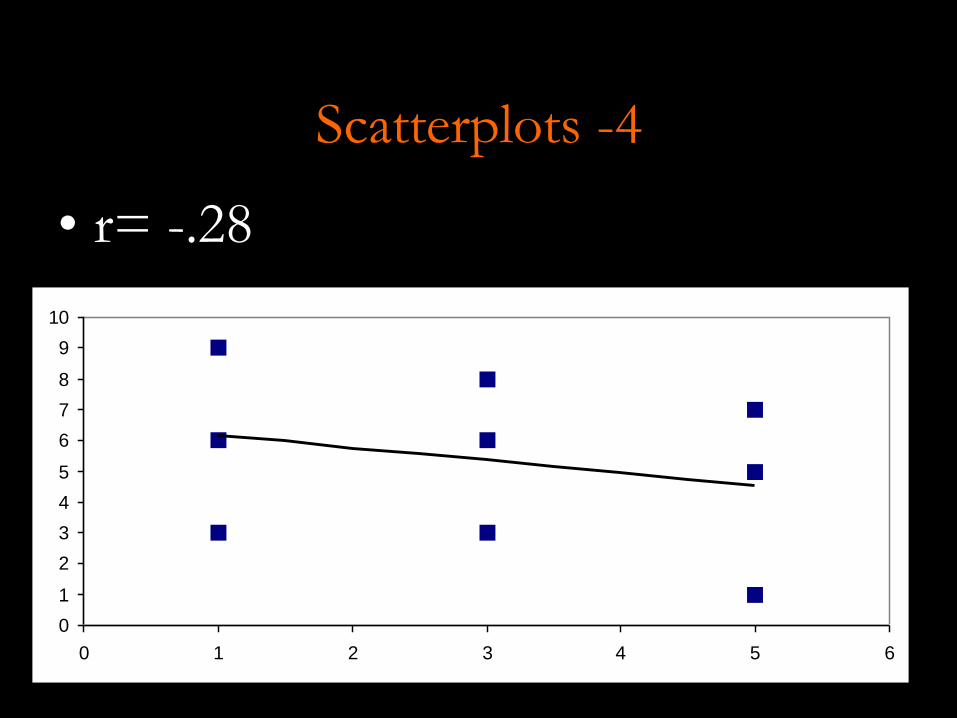
Scatterplots -4 • Calculate the Pearson
correlation coefficient
and draw a scatterplot for
the data
X Y
1 9
1 6
1 3
3 8
3 6
3 3
5 7
5 5
5 1
52
Scatterplots -4
• r= -.28
0
1
2
3
4
5
6
7
8
9
10
0 1 2 3 4 5 6

53
Scatterplots -5 • Calculate the Pearson
correlation coefficient
and draw a scatterplot for
the data
X Y
1 3
1 5
1 7
3 3
3 5
3 7
5 3
5 5
5 7

54
Scatterplots -5
• r= 0
0
1
2
3
4
5
6
7
8
0 1 2 3 4 5 6

55


