The decline of the Puerto Ricanfulltime faculty at the City University of New York (CUNY) from 1981–2002
FELIPE PIMENTEL, PH.D., HOSTOS COMMUNITY COLLEGE, CUNY
Centro de Estudios PuertorriqueñosHunter College (CUNY) POLICY BRIEF | VOLUME 2 | NO. 3 | FALL 2005
FacultyBrief(Cover).qxd 3/11/06 8:46 PM Page 3

Centro de Estudios PuertorriqueñosHunter College (CUNY)695 Park Avenue, Room E-1429New York, New York 10021212.772.5686www.centropr.org
The New York Latino Research and ResourcesNetwork (NYLARNet), is a consortium which bringstogether the combined expertise of U.S. LatinoStudies scholars and other professionals to work onspecific research projects in four target areas:Health, Education, Immigration, and Politics andPublic Policy. NYLARNet was intiatiated by apartnership between the the Center for Latino, LatinAmerican and Caribbean Studies (CELAC) at theUniversity at Albany, SUNY, the Center for PuertoRican Studies (Centro) at Hunter College, CUNY, andthe Institute for Urban Minority Education (IUME) atTeacher's College, Columbia University.
The production of this policy brief was funded by the New York Latino Research Network (NYLARNet)sponsored by NY State Assemblyman Peter Rivera,Chair of the Puerto Rican/Hispanic Legislative Task Force.
FacultyBrief(Cover).qxd 3/11/06 8:46 PM Page 4

The issueWe show in this brief how the Puerto Rican
fulltime faculty at CUNY has been steadily
declining while the number of Puerto Ricans
earning doctorates has increased considerably
since the early 1980s. This analysis intends to
draw attention to this paradoxical situation by
examining statistical information from different
data sources. Policy-makers at the City
University have insufficiently addressed the
historical underrepresentation of Puerto Rican
fulltime faculty at this institution—to the point
where this issue has become a serious question
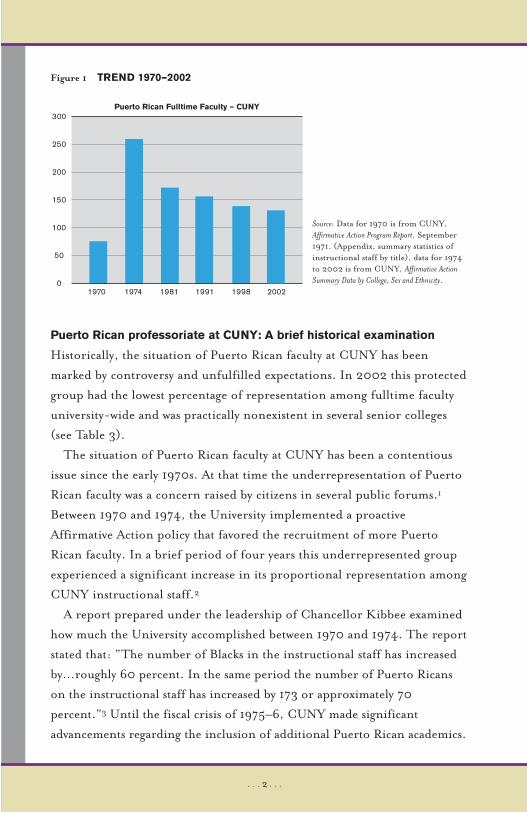
that needs to be thoroughly analyzed. Figure 1
gives a general view of the evolution of the
Puerto Rican fulltime faculty at this public
institution of higher education during the
past three decades.
. . . 1 . . .
FELIPE PIMENTEL, PH.D.
Hostos CommunityCollege, (CUNY)
The decline of the Puerto Ricanfulltime faculty at the CityUniversity of New York (CUNY)from 1981–2002.
FacultyBrief(R3).qxd 3/11/06 8:53 PM Page 1
. . . 2 . . .
Figure 1 TREND 1970–2002
Puerto Rican professoriate at CUNY: A brief historical examination
Historically, the situation of Puerto Rican faculty at CUNY has been
marked by controversy and unfulfilled expectations. In 2002 this protected
group had the lowest percentage of representation among fulltime faculty
university-wide and was practically nonexistent in several senior colleges
(see Table 3).
The situation of Puerto Rican faculty at CUNY has been a contentious
issue since the early 1970s. At that time the underrepresentation of Puerto
Rican faculty was a concern raised by citizens in several public forums.1
Between 1970 and 1974, the University implemented a proactive
Affirmative Action policy that favored the recruitment of more Puerto
Rican faculty. In a brief period of four years this underrepresented group
experienced a significant increase in its proportional representation among
CUNY instructional staff.2
A report prepared under the leadership of Chancellor Kibbee examined
how much the University accomplished between 1970 and 1974. The report
stated that: “The number of Blacks in the instructional staff has increased
by…roughly 60 percent. In the same period the number of Puerto Ricans
on the instructional staff has increased by 173 or approximately 70
percent.”3 Until the fiscal crisis of 1975–6, CUNY made significant
advancements regarding the inclusion of additional Puerto Rican academics.
Puerto Rican Fulltime Faculty – CUNY300
250
200
150
100
50
01970 1974 1981 1991 1998 2002
Source: Data for 1970 is from CUNY,Affirmative Action Program Report. September1971. (Appendix, summary statistics ofinstructional staff by title), data for 1974to 2002 is from CUNY, Affirmative Action
Summary Data by College, Sex and Ethnicity.
FacultyBrief(R3).qxd 3/11/06 8:53 PM Page 2

According to Rodríguez-Fraticelli: “Between 1970 and 1975, Puerto Rican
instructional staff more than doubled (from 247 to 537). Of those 537, 425
were faculty, the majority of whom were fulltime professors (303).”4
Other researchers have analyzed the social, economic and institutional
consequences of the fiscal crisis that CUNY experienced at that time and
how the so-called “retrenchment policies” disproportionably affected
Puerto Rican faculty and minority students at this public institution.5 They
have suggested that the decline of Puerto Rican fulltime faculty accelerated
after the massive lay-off of teaching staff at CUNY during the late 1970s.6
Underrepresented groups among the professoriate at CUNY
It should be pointed out that CUNY has made significant progress
diversifying its faculty by recruiting more women and minorities after 1970.
Those efforts, however, have not benefited all underrepresented groups
equally. Regarding the presence of Puerto Rican scholars among the ranks
of the fulltime faculty, after more than 30 years of proactive Affirmative
Action policies defining recruitment practices, the situation of this group
of Latino U.S. citizens at CUNY looks uncertain. Data about instructional
staff —gathered by the University to comply with Federal laws— indicate that,
though protected groups have experienced significant progress, the Puerto
Rican faculty has remained marginal and, ironically, has gradually declined.
During the period examined (1981–2002), the fulltime faculty decreased more
than 20 percent, while the part-time faculty increased considerably (from 42
percent to almost 60 percent).7 Regarding the composition of the fulltime
faculty, disaggregated data show that the proportion of the so-called federally
protected groups (Asian, Black and Hispanic faculty) did augment from 18
percent in 1980 to 28 percent in 2003.8 Likewise, the gender ratio for female
faculty has improved steadily, and CUNY today is one of the few top public
institutions of higher education in which women represent more than 40 percent
of the fulltime faculty. According to recently released data for 2004, female
fulltime faculty constitute 44 percent of the professorial staff in tenured and
tenure-track positions at the University.9 Considering that back in 1970 women
in those lines represented less than 30 percent of the entire faculty, one should
not overlook that the University has made significant advancements in this area.10
. . . 3 . . .
FacultyBrief(R3).qxd 3/11/06 8:53 PM Page 3

. . . 4 . . .
What has taken place at CUNY, regarding the gender, racial and ethnic
diversification of the professoriate is a reflection of structural changes that have
affected all public and private universities of the nation in different degrees
during the past decades. Data presented in Table 1 show how the composition
of the faculty in U.S. universities has changed since the early 1970s. At that
point in time, white faculty represented 95 percent of the teaching staff while
racial and ethnic minorities held about 5 percent of those teaching positions.
According to a large national survey completed in 2003 which was sponsored
by the National Center for Educational Statistics (part of the U.S. Department of
Education), minority faculty’s representation has grown to almost 20 percent
while the white faculty moved down to about 80 percent of the professoriate.11
From a comparative perspective the percentage of representation of ethnic,
racial minorities and women among fulltime faculty at CUNY is higher.
a All institutions, college and university teaching faculty.b Fulltime Faculty in degree-granting, post-secondary institutions, ranked aslecturers, instructors, assistant professors, associate professors, and professors.Category of “other faculty” was omitted, (Chronicle of Higher Education, 2000).c Fulltime Faculty in Higher Education by Race, Ethnicity and Gender.(Minorities in Higher Education, 2003).d NCES, “2004 National Study of Postsecondary Faculty. Report on Facultyand Instructional Staff in Fall 2003.”(May 2005).
1972a
88.6
21.4
95.0
1.3
1.3
0.7
0.4
1989a
71.7
28.3
90.9
2.1
2.1
0.8
1.2
1997b
65.1
34.9
84.4
4.9
4.9
0.4
2.6
1999c
62.5
37.5
85.6
5.1
5.1
0.3
3.0
2003d
61.7
38.3
80.3
5.5
8.7
-
3.5
Men
Women
White
Black-AfricanAmerican
Asian & PacificIslander
Native-American
Hispanic-Latino
TRENDS IN THE COMPOSITION OF FACULTY IN AMERICAN UNIVERSITIESBY GENDER, RACE, AND ETHNICITY (IN PERCENTAGES).
Table 1
FacultyBrief(R3).qxd 3/11/06 8:53 PM Page 4

The evidence
Analyzing disaggregated data, this policy brief reveals that Puerto Rican
fulltime faculty members who have retired or left the institution have not
been replaced at CUNY in proportion to other underrepresented groups.
The Office of Faculty and Staff Relations of the University kept
disaggregated data about Puerto Rican staff and faculty from the early
1970s until 2002, when it decided to eliminate this underrepresented
group as a separate category for the purpose of data collection. Since
2003 a new category is being used in the official reports, in which Puerto
Rican faculty has been merged with other Hispanic/Latino groups.
Unfortunately, the University has not provided a rationale for this new
data collection policy practice. And we cannot ignore that this policy
change was made at a juncture in which Puerto Rican fulltime faculty
represented about 2.5 percent of the entire fulltime instructional staff
university-wide, and was already declining. As we show in this brief, this
detrimental decision has blurred rather than clarified the situation of the
Puerto Rican professoriate at the University.
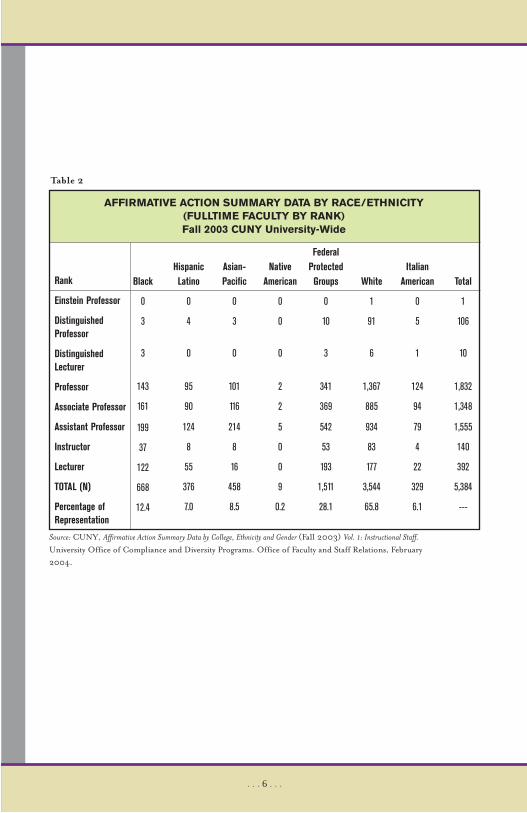
We begin by examining the composition of the fulltime faculty. Data
offered in Table 2 give an account of the totality of the ranked fulltime
faculty distributed by race and ethnicity in Fall 2003. The allocation
of data by categories is identical to the one used by CUNY in its report
for that year.
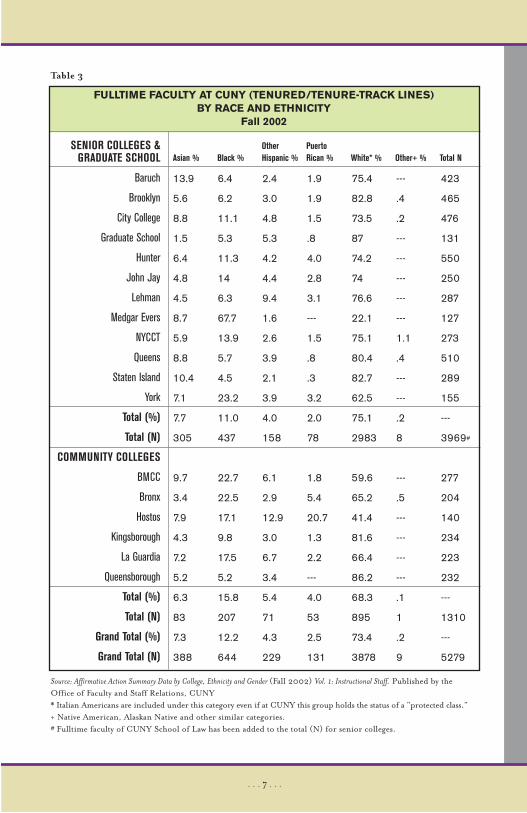
The data being reported in Table 3 is based on the University’s
official report for 2002,12 but we have redefined some categories.
In this table we have included “Italian-American” within the category
“white,” even though this group is a protected class at CUNY.13 We
should mention that the Calandra Institute at Queens College claims that
Italian-American faculty have experienced a decrease among fulltime
faculty at CUNY during the past decade.14 But in comparison to other
underrepresented groups (like Italian-Americans) the situation of
Puerto Rican fulltime faculty has deteriorated even further.
Table 3 shows the number of Puerto Rican faculty members in
comparison to all other racial and ethnic categories in the fulltime faculty
university-wide. One sees that in 2002 (the last year for which data were
. . . 5 . . .
FacultyBrief(R3).qxd 3/11/06 8:53 PM Page 5
. . . 6 . . .
Black
0
3
3
143
161
199
37
122
668
12.4
HispanicLatino
0
4
0
95
90
124
8
55
376
7.0
Asian-Pacific
0
3
0
101
116
214
8
16
458
8.5
NativeAmerican
0
0
0
2
2
5
0
0
9
0.2
FederalProtectedGroups
0
10
3
341
369
542
53
193
1,511
28.1
White
1
91
6
1,367
885
934
83
177
3,544
65.8
ItalianAmerican
0
5
1
124
94
79
4
22
329
6.1
Total
1
106
10
1,832
1,348
1,555
140
392
5,384
---
Rank
Einstein Professor
DistinguishedProfessor
DistinguishedLecturer
Professor
Associate Professor
Assistant Professor
Instructor
Lecturer
TOTAL (N)
Percentage ofRepresentation
AFFIRMATIVE ACTION SUMMARY DATA BY RACE/ETHNICITY (FULLTIME FACULTY BY RANK) Fall 2003 CUNY University-Wide
Table 2
Source: CUNY, Affirmative Action Summary Data by College, Ethnicity and Gender (Fall 2003) Vol. 1: Instructional Staff.
University Office of Compliance and Diversity Programs. Office of Faculty and Staff Relations, February2004.
FacultyBrief(R3).qxd 3/11/06 8:53 PM Page 6
. . . 7 . . .
13.9
5.6
8.8
1.5
6.4
4.8
4.5
8.7
5.9
8.8
10.4
7.1
7.7
305
9.7
3.4
7.9
4.3
7.2
5.2
6.3
83
7.3
388
6.4
6.2
11.1
5.3
11.3
14
6.3
67.7
13.9
5.7
4.5
23.2
11.0
437
22.7
22.5
17.1
9.8
17.5
5.2
15.8
207
12.2
644
2.4
3.0
4.8
5.3
4.2
4.4
9.4
1.6
2.6
3.9
2.1
3.9
4.0
158
6.1
2.9
12.9
3.0
6.7
3.4
5.4
71
4.3
229
1.9
1.9
1.5
.8
4.0
2.8
3.1
---
1.5
.8
.3
3.2
2.0
78
1.8
5.4
20.7
1.3
2.2
---
4.0
53
2.5
131
75.4
82.8
73.5
87
74.2
74
76.6
22.1
75.1
80.4
82.7
62.5
75.1
2983
59.6
65.2
41.4
81.6
66.4
86.2
68.3
895
73.4
3878
---
.4
.2
---
---
---
---
---
1.1
.4
---
---
.2
8
---
.5
---
---
---
---
.1
1
.2
9
423
465
476
131
550
250
287
127
273
510
289
155
---
3969#
277
204
140
234
223
232
---
1310
---
5279
SENIOR COLLEGES &GRADUATE SCHOOL
Baruch
Brooklyn
City College
Graduate School
Hunter
John Jay
Lehman
Medgar Evers
NYCCT
Queens
Staten Island
York
Total (%)
Total (N)
COMMUNITY COLLEGES
BMCC
Bronx
Hostos
Kingsborough
La Guardia
Queensborough
Total (%)
Total (N)
Grand Total (%)
Grand Total (N)
FULLTIME FACULTY AT CUNY (TENURED/TENURE-TRACK LINES) BY RACE AND ETHNICITY
Fall 2002
Table 3
Source: Affirmative Action Summary Data by College, Ethnicity and Gender (Fall 2002) Vol. 1: Instructional Staff. Published by theOffice of Faculty and Staff Relations, CUNY* Italian Americans are included under this category even if at CUNY this group holds the status of a “protected class.”+ Native American, Alaskan Native and other similar categories.# Fulltime faculty of CUNY School of Law has been added to the total (N) for senior colleges.
Asian % Black %OtherHispanic %
PuertoRican % White* % Other+ % Total N
FacultyBrief(R3).qxd 3/11/06 8:53 PM Page 7

available) there were 131 Puerto Rican faculty members in tenured and
tenure-track lines at the City University, while in 1981 there were 175 in the
same categories, a reduction of more than 25 percent during this period.
Ironically, this decline has taken place at a time in which the University has
been hiring minority and female faculty in a relatively high proportion.
Figure 2 shows the distribution of new fulltime faculty hired in tenured and
tenure-track positions in 2003.
According to data provided by CUNY to the National Center for Educational
Statistics (NCES) in 2003, the University hired more than 500 new fulltime
faculty members. Of those new hires, 321 were reported to the NCES as
faculty hired in tenured and tenure-track lines.15 Racial and ethnic data
were reported only for 288 individuals from this group while gender
information was available for all of them. Roughly, 45 percent of the new
hires were women and 32 percent (of the 288 for which data were
reported) belonged to underrepresented groups. Data in Figure 2 give a
visual sense of the distribution of the new hires by ethnic and racial
categories. Following a pattern that reflects national trends, CUNY has
been hiring Asian academics in relatively large numbers. For instance,
this group has increased its representation university-wide in more than 2
points during the last two years (from 7.3 percent in 2002 to 9.5 percent
. . . 8 . . .
NEW FULLTIME FACULTY (TENURED & TENURE-TRACK LINES)
AT CUNY, 2003
Source: National Center for EducationalStatistics (NCES) N=288.
= Asian
= White
= Hispanic
= Black
= Native American
Figure 2
FacultyBrief(R3).qxd 3/11/06 8:53 PM Page 8

in 2004).16 Comparatively speaking, for Hispanic and Black scholars at
CUNY progress has been much slower.
Before concluding with this section we should say that the situation of
underrepresented faculty at CUNY is a complex one. There are significant
differences among CUNY campuses and even sharper differences between
senior and community colleges (see Table 3). Overall, the situation for
minority and female faculty is more favorable in community colleges and,
with the exception of Hunter, John Jay, Lehman, York, NYCCT, Medgar
Evers and City College, the presence of Hispanic and black fulltime faculty
in the rest of the senior colleges remains really low.
Table 4 reports data about the situation of Puerto Rican fulltime faculty
in 1981, 1991 and 2001. The evidence shows that this underrepresented
group suffered a significant reduction of fulltime faculty members in a
period of two decades (from 175 to 134). Proportionally, this has been the
segment of the professoriate experiencing the greatest loss of core faculty
among all underrepresented groups at CUNY.17
It seems that the decrease of Puerto Rican fulltime faculty after 1981
has been the sequel of a process that had started the previous decade.
The difference, however, is that during the 1970s the human capital of
this group was the lowest among all underrepresented groups.18 After
the mid-1980s the educational attainment at the doctoral level of
Puerto Ricans improved tremendously (see Appendix). During the
mid-1970s the annual average of Puerto Ricans earning doctorates —in
relation to the total number of doctorate recipients among U.S.
citizens— was about 0.2 percent.19 In contrast to that gloomy picture,
the proportion of Puerto Ricans earning doctorates augmented to
about 1.2 percent of the total number of doctorates awarded to U.S.
citizens and permanent residents in 2002.20 Additional data available
in the Appendix indicate that the pool of qualified Puerto Rican
candidates for academic jobs in many fields has increasingly expanded
during the past two decades.
Figure 3 shows the trend of the number of doctorates awarded to
Puerto Ricans, Mexicans and other Hispanics between 1985 and 2002.
The data indicate a steady increase of the number of qualified candidates
. . . 9 . . .
FacultyBrief(R3).qxd 3/11/06 8:53 PM Page 9

. . . 1 0 . . .
10
15
18
---
14
8
14
4
9
10
2
1
105
7
7
34
7
11
4
70
175
2.1
1.8
2.8
---
2.2
3.4
3.1
3.5
2.1
1.3
0.6
0.7
2.0
2.5
2.3
30
2.8
5
1
4.4
2.6
10
10
11
---
23
11
15
2
9
7
2
2
102
8
5
34
4
5
2
58
160
2.0
1.6
1.7
---
3.7
4.5
4.2
1.9
2.7
1
.6
1.3
2.2
2.9
2.6
22.7
1.7
2.2
.7
4.0
2.6
7
10
7
1
23
7
9
---
6
5
1
4
80
6
10
31
3
4
---
54
134
1.7
2.1
1.5
.8
4.3
2.8
3.2
---
2.2
.8
.3
2.5
2.0
2.2
4.9
22.6
1.3
1.7
---
4.1
2.5
-3
-5
-11
+1
+7
-1
-5
-4
-3
-5
-1
+2
-25
-1
+3
-3
-4
-7
-4
-16
-41
SENIOR COLLEGES &GRADUATE SCHOOL
Baruch
Brooklyn
City College
Graduate School
Hunter
John Jay
Lehman
Medgar Evers
NYCCT
Queens
Staten Island
York
Total
COMMUNITY COLLEGES
BMCC
Bronx
Hostos
Kingsborough
La Guardia
Queensborough
Total
Grand Total
PUERTO RICAN FULLTIME FACULTY AT CUNY (TENURED & TENURE-TRACK LINES)
1981, 1991, 2001
Table 4
Source: Affirmative Action Summary Data by College, Sex and Ethnicity (Fall 1981, 1991 & 2001) Vol. 1: Instructional Staff. Publishedby the Office of Faculty and Staff Relations, CUNY
N % N % N %Change
1981–20011981 1991 2001
FacultyBrief(R3).qxd 3/11/06 8:53 PM Page 10
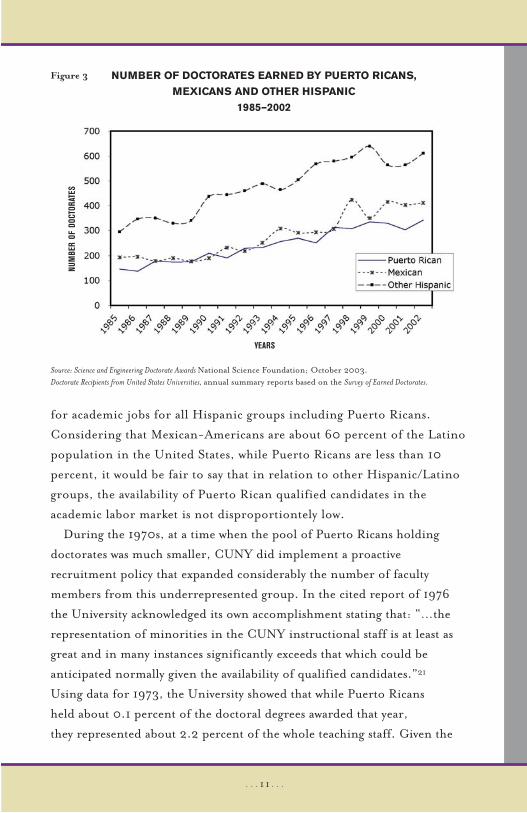
for academic jobs for all Hispanic groups including Puerto Ricans.
Considering that Mexican-Americans are about 60 percent of the Latino
population in the United States, while Puerto Ricans are less than 10
percent, it would be fair to say that in relation to other Hispanic/Latino
groups, the availability of Puerto Rican qualified candidates in the
academic labor market is not disproportiontely low.
During the 1970s, at a time when the pool of Puerto Ricans holding
doctorates was much smaller, CUNY did implement a proactive
recruitment policy that expanded considerably the number of faculty
members from this underrepresented group. In the cited report of 1976
the University acknowledged its own accomplishment stating that: “…the
representation of minorities in the CUNY instructional staff is at least as
great and in many instances significantly exceeds that which could be
anticipated normally given the availability of qualified candidates.”21
Using data for 1973, the University showed that while Puerto Ricans
held about 0.1 percent of the doctoral degrees awarded that year,
they represented about 2.2 percent of the whole teaching staff. Given the
. . . 1 1 . . .
NUMBER OF DOCTORATES EARNED BY PUERTO RICANS,
MEXICANS AND OTHER HISPANIC
1985–2002
Figure 3
Source: Science and Engineering Doctorate Awards National Science Foundation; October 2003.Doctorate Recipients from United States Universities, annual summary reports based on the Survey of Earned Doctorates.
NUM
BER
OFDO
CTOR
ATES
YEARS
FacultyBrief(R3).qxd 3/11/06 8:53 PM Page 11

larger pool of Puerto Rican qualified candidates available for academic
positions, why is the size of this underrepresented group among the
professoriate at CUNY notably smaller than in the mid-1970s?
Table 5 describes the situation of the Puerto Rican professoriate at
different moments between 1970 and 2002. It also shows their statuses within
the instructional ranks of the University. It is worth mentioning that while in
the 1970s and early 1980s the majority of those faculty-members were located
in the lower echelons (mostly in the ranks of instructors, lecturers and
assistant professors), in 2002 about 44 percent of them upheld the statuses of
associate or full professors. The most current data reported in this table
indicate that the number of assistant professors remains notably low.
Moreover, the number of lecturers and instructors has declined progressively.
In Figure 4 we compare data from 1981 and 2002. We observe in
this graph how the distribution of the Puerto Rican fulltime faculty at
CUNY has changed in a period of two decades. Overall, data offered
in Table 5 and in Figure 4 suggest that the Puerto Rican fulltime faculty
is “vanishing” little by little since not enough new hires are replacing
those who are retiring or leaving the institution.
. . . 1 2 . . .
1970
---
4
5
24
29
17
79
1.3
1973–4
---
12
14
63
75*
95
259
2.5
1981
---
16
24
53
33
49
175
2.6
1991
1
17
35
49
10
48
160
2.6
1998
1
35
26
30
6
42
140
2.7
2002
---
34
23
38
2
34
131
2.5
RANK
Distinguished Professor
Full Professor
Associate Professor
Assistant Professor
Instructor
Lecturer
Total (N)
(%) Representation
PUERTO RICAN FULLTIME FACULTY BY RANK AT CUNY
Table 5
* 57 non-tenured instructors• Data for 1970 is from CUNY, Affirmative Action Program Report. September 1971.
(Appendix, summary statistics of instructional staff by title).• Data for 1974 to 2002 is from CUNY, Affirmative Action Summary Data by College, Sex and Ethnicity.
FacultyBrief(R3).qxd 3/11/06 8:53 PM Page 12

While the number of Puerto Rican fulltime faculty has been
decreasing, in contrast, data reported by the University suggest that other
Hispanic faculty have been increasing since the late 1980s (see Figure 5).
Figure 5 shows that the number of Hispanic faculty has increased during
the 1990s. The recruitment of more Hispanic academics by CUNY represents
a positive step in the direction of creating a culturally and racially diverse
. . . 1 3 . . .
DISTRIBUTION BY RANK OF THE PUERTO RICAN
FULLTIME FACULTY IN 1981 AND 2002Figure 4
160
140
120
100
80
60
40
20
01981 2002
= Full/Associate Professors
= Assistant Professors, Lecturers, and Instructors
PUERTO RICAN AND OTHER HISPANIC FULLTIME FACULTY
AT CUNY 1981–2002Figure 5
FULL
TIM
EFA
CULT
Y
Source: CUNY, Affirmative Action Summary Data by College, Sex, and Ethnicity (several years).
FacultyBrief(R3).qxd 3/11/06 8:53 PM Page 13

. . . 1 4 . . .
institution and we applaud this effort. The category “Hispanic”, however, is
too ambiguous and it can conceal unequal treatment against certain Latino
sub-groups, particularly among protected classes.22
In addition to the question of the Puerto Rican fulltime faculty, the other
issue to which the University needs to pay attention to is the state of the
Puerto Rican and Latino Studies Departments at CUNY. In a recent report
Gabriel Haslip-Viera23 has pointed out that these programs have
experienced a serious deterioration during the past 10 or 15 years;
amazingly, it is the same period in which the Puerto Rican professoriate has
decreased. Both phenomena appear to be related. Examining data
superficially, we observe that in most campuses in which Puerto
Rican/Latino Studies have disappeared or have been downscaled from
departments into programs. The situation of the Puerto Rican fulltime
faculty has also deteriorated.
We know that the creation of those departments during the 1970s
expanded academic opportunities for Puerto Rican students and scholars
at CUNY and contributed to increase the number of Puerto Rican faculty
at this institution. In that sense, the closing of some departments and
programs may be a relevant factor explaining why the Puerto Rican fulltime
faculty have lost ground at some colleges of the City University. On the
other hand, we need to explore other possible factors that could also
explain why the Puerto Rican fulltime faculty declined while the number of
qualified candidates for faculty positions expanded during the past two
decades. A hypothetical possibility would be that many Puerto Rican
scholars are not applying to faculty job openings at CUNY and are being
hired elsewhere. To fully address this question further research is needed.
�
FacultyBrief(R3).qxd 3/11/06 8:53 PM Page 14

RECOMMENDATIONS
One of CUNY’s most urgent priorities for the academic year 2005–2006
is to increase the fulltime faculty. Among its targets the University states that:
“Efforts to recruit underrepresented groups to the faculty and staff will be
made.”24 As we have shown, important advancements have been accomplished
regarding the racial and gender diversification of the fulltime faculty.
Nonetheless, Puerto Rican academics at CUNY are a group of citizens that
have not benefited proportionally from those accomplishments.
The evidence offered in this brief suggests that to halt the deterioration
of the Puerto Rican fulltime faculty at CUNY, a different policy approach is
needed. To confront the persistent underrepresentation of this federally
protected group among the professoriate, the University needs to
reconsider the approach it has followed in dealing with the issue. There are
a number of important steps that that the University must undertake
without delay. We offer a number of specific recommendations that we
would like to see translated into concrete policy initiatives.
1. The Office of Faculty and Staff Relations of the University must reinstate
the Puerto Rican faculty and staff as a separate protected class for the
purpose of data collection and to disaggregate this protected class of
citizens from other Hispanic/Latino groups. That was the way CUNY
categorized its Affirmative Action data for more than three decades
(1970–2002), and conditions have not warranted a change.
We cannot understand why the decision of “diluting” this protected class
of citizens within the broad category of Hispanic/Latino was made while
retaining the Italian-American faculty as a disaggregated protected group
for the purpose of data collection. According to Brenda Malone, Vice
Chancellor for Faculty and Staff, between July 2003 and September
2004 CUNY hired 504 new fulltime faculty members (including 169
substitutes). She has stated that 51 percent of these new hires were women
and 35 percent were minorities. Among this group, Blacks and Asians
constituted 25 percent while the remaining 10 percent of the new faculty
members were Hispanic or Puerto Rican.25 How can we actually know
the exact number of new Puerto Rican professors that have been hired
if CUNY does not keep disaggregated data for this group anymore?
. . . 1 5 . . .
FacultyBrief(R3).qxd 3/11/06 8:53 PM Page 15

The only way one could monitor progress regarding the prospects for
Puerto Rican faculty is by keeping separate public information about this
underrepresented group.
2.Though there is not a legal precedent on this question, the University should
consider keeping disaggregated data for all Hispanic/Latino staff employed in
academic positions. By doing so CUNY will be able to better assess the
effectiveness of its policies in promoting the expansion of under-
represented groups among the faculty and how the diversity of New
York’s Latino population is reflected within the institution itself.
3.Despite being named a protected class in 1970, in comparison to other
ethnic and racial underrepresented groups, Puerto Rican academics
have benefited much less from CUNY’s Affirmative Action policies.
Recognizing the overall decline of Puerto Rican full-time facultys,
the University must reexamine some aspects of its recruitment policies
regarding underrepresented groups. The issue at stake here is: why has
the Puerto Rican professoriate decreased while other protected groups
expanded among the fulltime faculty? Don’t forget that such a decline
occurred during a period in which the number of qualified candidates
from this underrepresented group had increased considerably.
The examination of available statistical data does not explain this
phenomenon. We need more systematic research about the situation
of Puerto Rican academics and other underrepresented Latino scholars
at CUNY, such as the Dominican professoriate, for example.
4.Historically, Puerto Ricans have lacked strong professional networks at
the University and have tended to be concentrated in a narrow number
of fields and departments. On the basis of available doctoral pipeline
data, we are convinced that the pool of qualified candidates has improved
considerably in many of the same academic fields in which Puerto Rican
academics are still notably absent at the University. To reverse the trend
of decline that we have documented, CUNY should devote more
resources to the development of a proactive recruitment policy targeting
potential Puerto Rican faculty. College officials and university-wide
decision-makers should make every effort possible to attract more
prospective faculty from this underrepresented group.
. . . 1 6 . . .
FacultyBrief(R3).qxd 3/11/06 8:53 PM Page 16

5. Finally, the University’s commitment to increasing the representation
of Puerto Rican and Latino fulltime faculty will be enhanced by
unequivocally stating priorities and goals regarding underrepresented
groups among the core faculty. It is essential that all colleges within the
City University encourage their departments to hire more qualified
Puerto Rican and Latino scholars in this period of expansion of the
fulltime faculty. The departments should be responsible for ensuring
that their search committees aggressively pursue the recruitment of
qualified Puerto Rican and Latino professors in compliance with the
University’s Affirmative Action/Equal Opportunity guidelines.
ENDNOTES1 An example of this were the public hearings that CUNY organized in 1971–2to address the situation of women at the University. According to a reportdescribing the procedures: “These hearings were meant to deal exclusively withthe problem of sex discrimination at CUNY. Nonetheless, several peopleaddressed themselves to other subjects, primarily the status of Puerto Ricans at CUNY
(emphasis added). See Introduction to Chancellor’s Advisory Committee on theStatus of Women at CUNY. “Public Hearings Testimony: An Edited Summaryand Evaluation,” (September 1972). 2 According to CUNY, “Summary Affirmative Action Data 1970, 1971, 1972,1973: Ethnicity and Sex Variables by College.” University Affirmative ActionOffice, (January 1975), Puerto Rican faculty increased its representation from1.6 percent to 2.2 percent at that time. 3 CUNY, “Affirmative Action at the City University of New York: A SummaryReport of the University Equal Employment Program.” University AffirmativeAction Office, (Summer 1976). The quote is from page C-21.4 Carlos Rodríguez-Fraticelli, “Puerto Ricans and CUNY: Twenty Years AfterOpen Admissions.” Centro de Estudios Puertorriqueños Bulletin. Summer 1989, pages21–31.5 Camille Rodríguez and Ramón Bosque-Pérez, “Puerto Ricans and FiscalPolicies in the U.S. The Case of the City University of New York.” in Puerto Ricans
and Higher Education Policies, edited by C. Rodríguez and R. Bosque-Pérez. (NewYork: Centro de Estudios Puertorriqueños, 1994).6 According to data analyzed by Rodríguez-Fraticelli (Ibid., p. 28) the PuertoRican fulltime faculty declined 45.5 percent between 1975 and 1986. The black facultydeclined 39.2 percent, and the white faculty experienced a reduction of 40.2 percent.
. . . 1 7 . . .
FacultyBrief(R3).qxd 3/11/06 8:53 PM Page 17

. . . 1 8 . . .
7 According to Mary Kim, “CUNY Statistical Profile, 1980–1998 Volume 1:Draft Report”, May 1999 (Prepared for the Mayor’s Advisory Task Force on theCity University of New York). 8 Vincenzo Milione, “The City University of New York Affirmative ActionSummary Data by Race and Ethnicity for Instructional Staff from 1978 to 2003.”November 2004: Calandra Institute, Queens College/CUNY. The full report isavailable on-line: http://qcpages.qc.cuny.edu/calandra/research/restrends.html9 CUNY, Office of Faculty and Staff Relations. “Affirmative Action SummaryData by College, Ethnicity, and Gender (Fall, 2004) Volume I: InstructionalStaff.” (December 2004).10 Data reported in City University of New York, Affirmative Action Program Report:
Program Aimed at Expanding Employment Opportunities for Females and Minority Groups
(September, 1971). Regarding fulltime faculty in 1970 the distribution accordingto this report was the following: “Out of 6,289 positions in this category, 1, 851(29.4%) are held by women. Members of minority groups hold 696 (11.2%) ofthese positions: 413 Blacks, or 6.6%; 79 Puerto Ricans, or 1.3%; 101 Orientals,or 1.6%; 67 other Spanish, or 1.1% and 36 “others”, or 0.6% (Ibid., p. 28).”11 National Center for Educational Statistics, “2004 National Study ofPostsecondary Faculty. Report on Faculty and Instructional Staff in Fall2003”(May 2005).12 CUNY, Office of Faculty and Staff Relations. “Affirmative Action SummaryData by College, Ethnicity, and Gender (Fall, 2002) Volume I: InstructionalStaff.” 13 At CUNY Italian-Americans are considered a “protected class.” OnDecember 9, 1976 Chancellor Robert J. Kibbee issued a directive formallydesignating this group as an Affirmative Action category. This policy wasreaffirmed by Chancellor Joseph S. Murphy in 1986 and again by ChancellorAnn Reynolds in 1994. More recently, (1999) Chancellor Matthew Goldstein hasendorsed the same policy. The way data on faculty and staff is collected by theOffice on Affirmative Action at CUNY disaggregates this group from “whites.”14 “The City University of New York Affirmative Action Summary Data by Raceand Ethnicity for Instructional Staff from 1978 to 2003.” Op. cit. 15 The vast majority of those new faculty members were hired in tenure-trackpositions (312), while only 9 were appointed in tenured lines.16 CUNY, Office of Faculty and Staff Relations. “Affirmative Action SummaryData by College, Ethnicity, and Gender (Fall, 2004) Volume I: InstructionalStaff.” Op. cit.17 Another protected group that had some reduction was the black faculty. In1981 there were 703 blacks among the tenured and tenure-track faculty. In 2001
FacultyBrief(R3).qxd 3/11/06 8:53 PM Page 18
. . . 1 9 . . .
they had declined to 669 faculty members, a reduction of 5 percent during thisperiod. On the other hand, Asians increased from 177 to 359 fulltime facultymembers between 1981 and 2001.18 According to a Josephine Nieves: “A comparison of recipients of doctoratedegrees from 1973 to 1976 shows consistently lower percentage of Puerto Ricansreceiving doctorates than any other racial and ethnic minority.” See J. Nieves,“Puerto Ricans in United States Higher Education.” Puerto Rican StudiesTaskforce #2. (New York: Centro de Estudios Puertorriqueños, 1979), p. 10.19 National Research Council, National Academic of Sciences, “SummaryReport: Doctorate Recipients From United States Universities, 1973, 1974, 1975and 1976.” Reports (Washington, D.C.: National Academic of Sciences).20 That year 27, 582 new doctorates were awarded to citizens or permanentresidents of the United States. The larger share (77.5%) of those degrees went towhites. Regarding ethnic and racial minorities, Asians received almost 8 percentof those doctorates, blacks earned 6.3 percent and Hispanic/Latinos earned 5percent of all. Among Latinos, Mexicans earned 1.5 percent and Puerto Ricansabout 1.2 percent of the total. See T.B. Hoffer, S. Sederstrom, L. Selfa, V.Welch, M. Hess, S. Brown, S. Reyes, K. Webber, and I. Guzman-Barron.Doctorate Recipients from United States Universities: Summary Report 2002. (Chicago: NationalOpinion Research Center, 2003).21 CUNY, “Affirmative Action at the City University of New York: A SummaryReport of the University Equal Employment Program.” University AffirmativeAction Office, (Summer 1976), p. 22.22 Under the category “Hispanic/Latino” the University is grouping all Spanish-speaking people,—including Spaniards who, actually, are European and white.23 “Report on the Status of Departments and Programs in Latino, LatinAmerican and Puerto Rican Studies at the City University of New York,”(Unpublished Manuscript, April 2005).24 CUNY, “University Performance Goals and Targets, 2005–2006Academic Year.”25 The Senate Digest, Vol. XXXV, Num. 1 (December 2004), p. 3 (Published bythe University Faculty Senate of CUNY).
�
FacultyBrief(R3).qxd 3/11/06 8:53 PM Page 19

APPENDIX
. . . 2 0 . . .
1985
2 10
5 0 7 1 0 0 0 12
19
4 17
58
11
146
1986
4 12
11
0 5 4 1 3 2 17
15
4 11
45
4 138
1987
6 18
4 0 26
0 0 6 1 15
10
3 29
52
9 179
1988
2 20
13
0 19
4 0 1 0 26
11
4 23
44
7 174
1989
7 18
7 1 16
3 0 4 0 21
16
4 22
52
5 176
1990
5 24
6 1 20
3 5 2 2 26
21
6 28
56
5 210
1991
0 23
9 0 14
3 0 0 3 20
27
3 30
52
7 191
1992
3 27
13
1 14
5 3 2 1 35
16
4 22
76
7 229
1993
10
27
10
0 14
3 1 1 1 24
21
3 36
71
11
233
1994
5 28
10
0 19
7 0 1 4 43
14
6 38
68
14
257
1995
3 30
13
1 17
3 2 1 0 44
23
12
30
69
21
269
1996
4 32 22 0 9 3 3 3 5 48 13 7 38 52 13 252
1997
4 36 23 0 13 7 6 4 6 56 16 10 49 72 11 313
1998
3 43 17 1 9 1 5 7 2 71 14 7 37 77 14 308
1999
1 47 23 0 18 4 5 2 6 57 21 11 31 90 19 335
2000
6 33 20 0 19 1 5 2 5 74 20 9 44 75 16 329
2001
4 48 13 0 11 3 3 2 1 45 25 5 41 88 14 303
2002
7 55 26 1 11 8 4 3 4 49 25 9 51 79 10 342
FIEL
D OF
STU
DY
Agric
ultu
ral s
cien
ces
Bi
olog
ical
sci
ence
s
Engi
neer
ing
As
trono
my
Ch
emist
ry
Ph
ysic
s
Earth
-oce
an s
cien
ces
M
athe
mat
ics
Co
mpu
ter s
cien
ces
Ps
ycho
logy
Soci
al s
cien
ces*
Heal
th
Hu
man
ities
+Ed
ucat
ion
Pr
ofes
siona
l/oth
er
Gran
d To
tal
NU
MB
ER
OF
DO
CTO
RA
TES
EA
RN
ED
BY
PU
ER
TO R
ICA
NS
BY
AC
AD
EM
IC F
IELD
S (
1985
–200
2)
Sour
ces:
Sci
ence
and
Eng
inee
ring
Doc
tora
te A
war
ds,
Nat
iona
l Sci
ence
Fou
ndat
ion;
Oct
ober
20
03.
Doc
tora
te R
ecip
ient
s fro
m U
nite
d St
ates
Uni
vers
ities
,an
nual
sum
mar
y re
port
s ba
sed
on th
e Su
rvey
of E
arne
d D
octo
rate
s.*
Incl
udes
Ant
hrop
olog
y, E
cono
mic
s, P
olit
ical
Sci
ence
, So
ciol
ogy
and
rela
ted
fiel
ds.
+ In
clud
es A
rt H
isto
ry,
His
tory
, M
usic
, Ph
iloso
phy,
Lan
guag
es,
Lit
erat
ure
and
rela
ted
fiel
ds.
FacultyBrief(R3).qxd 3/11/06 8:53 PM Page 20

Centro de Estudios PuertorriqueñosHunter College (CUNY)695 Park Avenue, Room E-1429New York, New York 10021212.772.5686www.centropr.org
FacultyBrief(Cover).qxd 3/11/06 8:46 PM Page 2


