
Accenture 2013
Global Consumer
Pulse SurveyGlobal & U.S. Key Findings

Copyright © 2013 Accenture All rights reserved. 2
• Executive Summary
– Overview of the “Switching Economy”
• Key Findings
• Methodology and Survey Sample
Contents

Executive Summary
Copyright © 2013 Accenture All rights reserved. 4
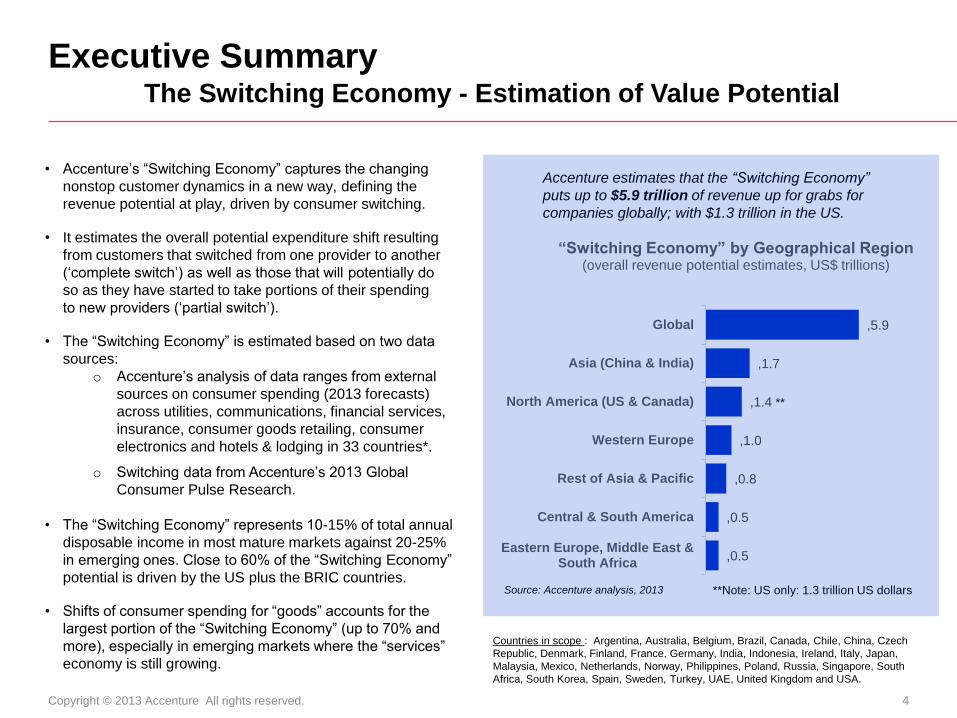
• Accenture’s “Switching Economy” captures the changing
nonstop customer dynamics in a new way, defining the
revenue potential at play, driven by consumer switching.
• It estimates the overall potential expenditure shift resulting
from customers that switched from one provider to another
(‘complete switch’) as well as those that will potentially do
so as they have started to take portions of their spending
to new providers (‘partial switch’).
• The “Switching Economy” is estimated based on two data
sources:
o Accenture’s analysis of data ranges from external
sources on consumer spending (2013 forecasts)
across utilities, communications, financial services,
insurance, consumer goods retailing, consumer
electronics and hotels & lodging in 33 countries*.
o Switching data from Accenture’s 2013 Global
Consumer Pulse Research.
• The “Switching Economy” represents 10-15% of total annual
disposable income in most mature markets against 20-25%
in emerging ones. Close to 60% of the “Switching Economy”
potential is driven by the US plus the BRIC countries.
• Shifts of consumer spending for “goods” accounts for the
largest portion of the “Switching Economy” (up to 70% and
more), especially in emerging markets where the “services”
economy is still growing.
Countries in scope : Argentina, Australia, Belgium, Brazil, Canada, Chile, China, Czech
Republic, Denmark, Finland, France, Germany, India, Indonesia, Ireland, Italy, Japan,
Malaysia, Mexico, Netherlands, Norway, Philippines, Poland, Russia, Singapore, South
Africa, South Korea, Spain, Sweden, Turkey, UAE, United Kingdom and USA.
Accenture estimates that the “Switching Economy”
puts up to $5.9 trillion of revenue up for grabs for
companies globally; with $1.3 trillion in the US.
Source: Accenture analysis, 2013 **Note: US only: 1.3 trillion US dollars
,0.5
,0.5
,0.8
,1.0
,1.4
,1.7
,5.9
Eastern Europe, Middle East &South Africa
Central & South America
Rest of Asia & Pacific
Western Europe
North America (US & Canada)
Asia (China & India)
Global
“Switching Economy” by Geographical Region (overall revenue potential estimates, US$ trillions)
**
Executive SummaryThe Switching Economy - Estimation of Value Potential

Copyright © 2013 Accenture All rights reserved. 5
Executive Summary (cont.)
• The ninth annual Accenture Global Consumer Pulse Survey, which measured the experiences of 13,168 customers in 33 countries and across ten industries to gain insight into the changing dynamics of today’s “nonstop” customers and assess consumer attitudes toward marketing, sales and customer service practices. The survey included 1,256 U.S. customers.
• Despite having more data and insights into consumer desires and preferences, companies in the U.S. have failed to meaningfully improve customer satisfaction or reverse rising switching rates among their customers. As a result, there is a potential $1.3 trillion of revenue at play in the U.S. market represented by the ‘switching economy’, according to Accenture’s analysis of consumer spend forecasts and switching rates.
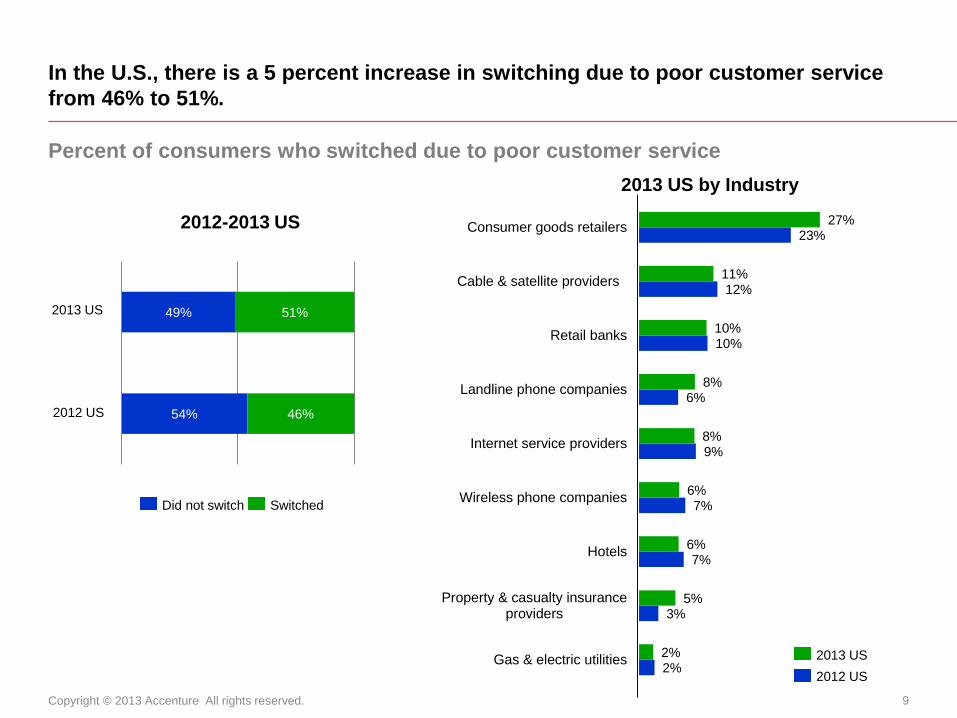
• 51 percent of U.S. consumers switched service providers in the past year due to poor customer service experiences, up five percent from 2012.
• Switching rates were highest among retailers, cable and satellite providers and retail banks – making companies in these sectors the most vulnerable, but also giving them potentially the most to gain.
• The survey found that customers are increasingly frustrated with the level of services they experience: 91 percent respondents are frustrated that they have to contact a company multiple times for the same reason; 90 percent by being put on hold for a long time and 89 percent by having to repeat their issue to multiple representatives.
• There are also frustrations with marketing and sales practices: 85 percent of customers are frustrated by dealing with a company that does not make it easy to do business with them, 84 percent by companies promising one thing, but delivering another; and 58 percent are frustrated with inconsistent experiences from channel to channel.
• While up in some categories, the survey revealed that customer satisfaction levels have generally remained stagnant across industry sectors and, overall, satisfaction fell by one percent since 2012. Additionally, the rate of loyalty barely budged among U.S. customers, rising just one percent since 2012, and customers’ willingness to recommend a company rose by just two percent.

Copyright © 2013 Accenture All rights reserved. 6
Executive Summary (cont.)
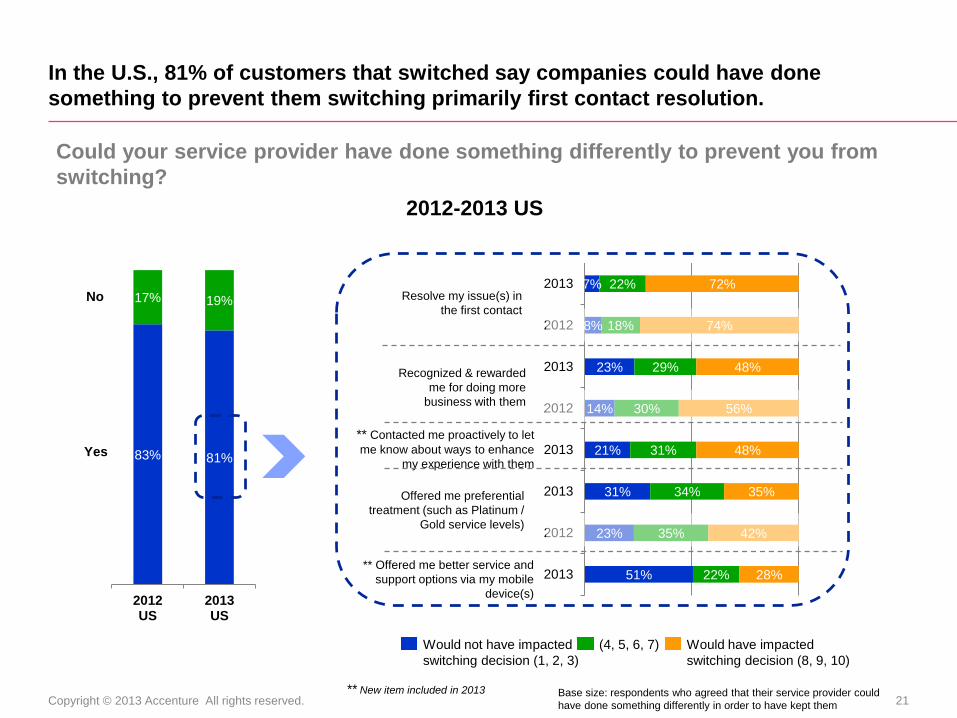
• Against the high percentage of customers reporting they had switched providers in the last year, 81 percent said that the company could have done something differently to prevent them from switching. And while the survey showed that price still plays an important role in the choice of provider, the customer experience is equally important.
• 48 percent of U.S. customers use third-party online sources such as official review sites, and one-quarter (25 percent) use customer reviews and comments from social media sites, to find out information about a company’s products and services.
• Word-of-mouth, including that shared via social media, continues to be the most important and impactful source of company information across industries according and is used by 71 percent of surveyed customers.
• In terms of the number of online channels used, 75 percent of respondents now use one or more online channels when researching companies’ products and services and 33 percent use mobile devices to access these online channels.
• The gap between the use of digital technologies and the ability of companies to use them to improve customer experiences is highlighted by the survey’s findings that, among the 10 industries covered by the report, none made noticeable progress in providing customers with a tailored experience in 2013. In the utilities industry, only 18 percent of customers agreed their provider offered them a tailored experience. And even in industries such as hotels and lodging and retail banking, perceived to be leading in creating more personalized interactions, only 36 percent of customers acknowledge receiving a tailored experience, respectively.
• Yet, while social media and online are regarded as important sources of information, one of the greatest frustrations customers have with companies is the perceived risk to privacy. Eighty-two percent of U.S. customers report that they feel companies they buy from cannot be trusted on how to use personal information they provided them.

Copyright © 2013 Accenture All rights reserved. 7
Executive Summary (cont.)
The report found that companies that delivered valued customer experiences exhibited five common
high impact capabilities, known as the customer-driven digital blueprint. These capabilities include:
• Hyper-relevance: Assure customers that the company is doing all that it can to understand them at a
more personal level, including customizing their channel and interaction preferences. This means
providing a more tailored customer experience with more customization and personalization through
the use of predictive analytics.
• Relationships at Scale: Digital gives businesses rich channels through which to communicate with
customers in much more personal ways and manage relationships with customers at scale. Use digital
to bring the intimacy of the corner store to all customers and then give them more convenient access
and more tailored services that matter to them.
• Seamless Experience: Creating a seamless experience requires a multi-channel approach. Integrate
information and processes that enable customers to flow easily across different channels when and
how they choose.
• Inherently Mobile: Invest in mobile services and support capabilities that are a quick win with
customers, and that help to deliver hyper-relevance and reduce costs.
• Social Media: Harness social media in order to deliver up-to-the-second customer preferences,
greater levels of trust, a mechanism for direct and dynamic interaction and more and more usable data
upon which business decisions can be made.

Key Findings
Copyright © 2013 Accenture All rights reserved. 9
54%
49%
46%
51%
2%
3%
7%
7%
9%
6%
10%
12%
23%
2%
5%
6%
6%
8%
8%
10%
11%
27%
Gas & electric utilities
Property & casualty insuranceproviders
Hotels
Wireless phone companies
Internet service providers
Landline phone companies
Retail banks
Cable & satellite providers
Consumer goods retailers
In the U.S., there is a 5 percent increase in switching due to poor customer service
from 46% to 51%.
Did not switch Switched
2012 US
2013 US
2013 US
2012 US
2012-2013 US
Percent of consumers who switched due to poor customer service
2013 US by Industry

Copyright © 2013 Accenture All rights reserved. 10
6%
8%
9%
9%
10%
10%
10%
12%
22%
15%
23%
19%
11%
20%
26%
29%
30%
36%
10%
14%
13%
10%
14%
17%
18%
20%
28%
Hotels
Cable & satellite providers
Property & casualty insuranceproviders
Gas & electric utilities
Landline phone companies
Wireless phone companies
Internet service providers
Retail banks
Consumer goods retailers
Globally, there is a 4 percent increase in switching due to poor customer service
from 62% to 66%.
Global 2007
Global 2008
Global 2009
Global 2010
Global 2011
Global 2012
Global 2006
Global 2005
Did not switch Switched
2013 Mature Markets
2013 Emerging Markets
2013 Global
Percent of consumers who switched due to poor customer service
51%
48%
41%
33%
31%
36%
34%
38%
34%
49%
52%
59%
67%
69%
64%
66%
62%
66%Global 2013
2005-2013 Global
2013 Global by Industry

Copyright © 2013 Accenture All rights reserved. 11
26%
1%
1%
2%
1%
1%
1%
1%
1%
1%
1%
1%
1%
11%
3%
3%
3%
3%
2%
2%
2%
1%
1%
1%
1%
1%
23%
20%
20%
18%
17%
17%
15%
11%
10%
8%
9%
8%
8%
14%
32%
30%
35%
30%
34%
25%
21%
24%
25%
23%
21%
17%
26%
44%
46%
43%
49%
47%
56%
66%
64%
64%
66%
69%
74%
2%
2%
2%
1%
1%
2%
1%
1%
1%
1%
1%
1%
5%
5%
4%
4%
3%
3%
2%
2%
2%
2%
2%
2%
24%
24%
22%
18%
22%
18%
12%
12%
13%
13%
12%
10%
31%
31%
33%
29%
32%
23%
18%
23%
26%
22%
23%
18%
39%
38%
39%
48%
42%
54%
67%
62%
58%
61%
62%
69%
2013 2012
Frustrations with customer service practices
2012-2013 US
* Slight word changes in 2013
** New item included in 2013
* Having to contact the company multiple times for
the same reason
* Being on-hold for a long time when contacting
the company
* Having to repeat the same information to multiple
employees of the company or through multiple
channels
* Dealing with employees or self-help sites /
systems that cannot answer my questions
Having a company deliver something different than
they promise up front
* Dealing with employees who are unfriendly or
impolite
* Being sold other products or services when I
contact the company with a service request
through any of its channels
Having to wait for a response after I’ve requested
customer service
Running into business policies that get in the way
of my goals
Having to complete a lot of paperwork or electronic
forms
* Not being able to understand information the
company provides me
Running into technology issues that get in the way
of my goals
** Having a company's online channels for
customer service and support not be optimized for
my mobile phone or tablet device
In the U.S., customers are getting increasingly frustrated by customer service
experiences, with the worst being having to contact a company multiple times for the
same reason, long hold times and having to repeat the same information multiple
times.
Not frustrating At all 1 2 3 4 5 Extremely frustrating

Copyright © 2013 Accenture All rights reserved. 12
* Having to contact the company multiple times
for the same reason
* Being on-hold for a long time when contacting
the company
* Dealing with employees who are unfriendly or
impolite
* Having to repeat the same information to
multiple employees of the company or through
multiple channels
* Dealing with employees or self-help sites /
systems that cannot answer my questions
Having a company deliver something different
than they promise up front
Running into business policies that get in the
way of my goals
* Being sold other products or services when I
contact the company with a service request
through any of its channels
Running into technology issues that get in the
way of my goals
Having to wait for a response after I’ve
requested customer service
* Not being able to understand information the
company provides me
Having to complete a lot of paperwork or
electronic forms
** Having a company's online channels for
customer service and support not be optimized
for my mobile phone or tablet device
36%
39%
40%
45%
49%
53%
57%
58%
63%
61%
65%
65%
Not frustrating At all 1 2 3 4 5 Extremely frustrating
2013 2012
Globally, the biggest frustrations with customer service experiences are having to
contact a company multiple times for the same reason, long hold times, dealing with
unfriendly employees and having to repeat the same information multiple times.
Frustrations with customer service practices
12%
2%
2%
1%
1%
2%
1%
3%
1%
1%
1%
1%
1%
10%
5%
5%
4%
5%
5%
4%
4%
4%
4%
4%
3%
3%
28%
22%
22%
20%
20%
19%
18%
14%
15%
15%
14%
13%
12%
23%
34%
32%
35%
31%
28%
29%
22%
28%
25%
21%
22%
19%
27%
37%
39%
39%
43%
47%
48%
58%
52%
55%
60%
62%
65%
3%
2%
2%
2%
3%
2%
3%
2%
2%
2%
2%
2%
6%
5%
5%
5%
5%
4%
4%
4%
4%
3%
3%
3%
22%
22%
21%
20%
18%
16%
12%
13%
14%
12%
13%
12%
34%
32%
32%
28%
25%
25%
19%
24%
23%
17%
22%
19%
36%
39%
40%
45%
49%
53%
63%
57%
58%
65%
61%
65%
* Slight word changes in 2013
** New item included in 2013
2012-2013 Global

Copyright © 2013 Accenture All rights reserved. 13
32%
11%
12%
4%
11%
4%
4%
3%
2%
3%
2%
2%
2%
3%
2%
2%
2%
2%
2%
10%
14%
15%
8%
12%
8%
8%
5%
3%
5%
3%
4%
3%
2%
2%
3%
2%
2%
1%
20%
29%
31%
27%
29%
31%
31%
21%
22%
22%
16%
15%
14%
16%
13%
12%
11%
15%
12%
13%
23%
18%
28%
23%
28%
25%
29%
29%
26%
28%
27%
27%
18%
16%
16%
20%
20%
22%
25%
24%
24%
32%
26%
29%
33%
43%
43%
44%
51%
52%
54%
61%
66%
67%
64%
62%
63%
2013
2012
2013
2012
2013
2012
2013
2012
2013
2012
2013
2012
2013
2012
2013
2012
2013
2012
2013
Not Frustrating At All 1 2 3 4 Extremely Frustrating 5
U.S. customers’ top frustrations during the buying phase are the company not
making it easy to do business with them, followed by a company promising one
thing but delivering another. There is also frustration with different experiences from
channel to channel.
* Slight word changes in 2013
** New item included in 2013
25%
31%
34%
51%
52%
59%Dealing with a company that does not make it
easy to do business with them
* Not being able to access information or buy a
product / service using multiple channels of my choice
Dealing with employees who are not knowledgeable or
do not acknowledge my specific needs and preferences
when I'm considering buying
Realizing that the company is not using the
information it has about me to make interactions and
offers more relevant for me
Having them promise one thing but
deliver another
Realizing that the company cannot be trusted on how
to use personal information I provided them
Being presented with inconsistent offers through
different channels when shopping for the same product
or service
Being exposed to inconsistent experiences or
treatments when using different channels
* Having a company ask me the same questions or
market the same offers to me again and again
** Not being able to access the information, make the
purchase or make the payment using my mobile device at the
time and place I want
2012-2012 US
Frustrations with marketing/sales practices

Copyright © 2013 Accenture All rights reserved. 14
10%
7%
16%
8%
4%
8%
6%
8%
3%
8%
4%
7%
3%
8%
3%
9%
3%
9%
2%
14%
13%
13%
11%
9%
10%
11%
9%
7%
10%
7%
7%
6%
7%
5%
6%
5%
5%
4%
30%
33%
27%
30%
32%
25%
30%
23%
25%
23%
22%
17%
18%
16%
17%
15%
17%
12%
14%
24%
25%
20%
26%
30%
26%
28%
26%
31%
24%
29%
23%
27%
21%
26%
17%
21%
15%
19%
23%
23%
24%
25%
26%
31%
26%
34%
34%
35%
38%
45%
47%
47%
49%
52%
54%
59%
60%
2012
2013
2013
2012
2013
2012
2013
2012
2013
2012
2013
2012
2013
2012
2013
2012
2013
2012
2013
Not Frustrating At All 1 2 3 4 Extremely Frustrating 5
Globally, consumers’ top two frustrations during the buying phase are a company
promising one thing but delivering another and not trusting how a company treats
their personal information.
Frustrations with marketing/sales practices
* Slight word changes in 2013
** New item included in 2013
25%
31%
34%
51%
52%
59%
Dealing with a company that does not make it
easy to do business with them
* Not being able to access information or buy a
product / service using multiple channels of my choice
Dealing with employees who are not knowledgeable or
do not acknowledge my specific needs and preferences
when I'm considering buying
Realizing that the company is not using the
information it has about me to make interactions and
offers more relevant for me
Having them promise one thing but
deliver another
Realizing that the company cannot be trusted on how
to use personal information I provided them
Being presented with inconsistent offers through
different channels when shopping for the same product
or service
Being exposed to inconsistent experiences or
treatments when using different channels
* Having a company ask me the same questions or
market the same offers to me again and again
** Not being able to access the information, make the
purchase or make the payment using my mobile device at the
time and place I want
2012-2013 Global

Copyright © 2013 Accenture All rights reserved. 15
9%
8%
46%
45%
In the U.S., customer satisfaction fell by one percent since 2012.
Additionally, the rate of loyalty rose just one percent and customers’
willingness to recommend a company rose by just two percent.
Overall satisfaction, level of “feeling loyal” towards and willingness to recommend current providers
Very
much
Overall satisfaction with
providers
Not at
all
Feel loyal toward
providers
Will recommend
providers to others
Not at
all
Very
much
Not at
all
Very
much
2013
2012
2012-2013 US
24%
25%
29%
30%
17%
19%
32%
34%
-1% +1% +2%Change

Copyright © 2013 Accenture All rights reserved. 16
19%
21%
11%
12%
23%
24%
11%
13%
11%
14%
20%
21%
20%
22%
22%
24%
26%
27%
21%
23%
30%
31%
26%
24%
33%
32%
22%
21%
29%
26%
29%
24%
29%
27%
27%
23%
25%
22%
23%
20%
27%
25%
18%
18%
12%
12%
8%
8%
13%
14%
6%
7%
7%
9%
13%
13%
14%
15%
15%
15%
15%
16%
14%
14%
18%
18%
36%
32%
38%
36%
31%
29%
37%
34%
36%
30%
39%
35%
37%
32%
35%
31%
34%
30%
36%
33%
30%
28%
24%
26%
25%
27%
25%
28%
21%
23%
23%
24%
21%
21%
23%
26%
26%
27%
26%
30%
25%
26%
30%
32%
25%
23%
22%
20%
24%
21%
22%
20%
20%
18%
32%
31%
28%
23%
25%
23%
25%
22%
27%
25%
23%
22%
Globally, while satisfaction is strong across sectors, there are as many
customers that feel loyal as those who do not, and there is a decrease in
consumers willingness to recommend providers to others.
Very
much
Overall satisfaction with
providersNot at
all
Feel loyal toward
providers
Will recommend
providers to others
Not at
all
Very
much
Not at
all
Very
much
Gas & electric utilities
Wireless phone companies
Landline phone companies
Cable & satellite providers
Internet service providers
Retail banks
Consumer electronics
manufacturers
Consumer goods retailers
* Property & casualty
insurance providers
* Hotels
Global Average
2013
2012
2013
2012
2013
2012
2013
2012
2013
2012
2013
2012
2013
2012
2013
2012
2013
2012
2013
2012
2013
2012
2012-2013 Global Average and by Industry
Overall satisfaction, level of “feeling loyal” towards and willingness to recommend current providers

Copyright © 2013 Accenture All rights reserved. 17
Adoption of loyalty programs and persuasion of programs to stick with providers
In the U.S., the adoption of loyalty programs has declined slightly across most
industries versus last year. The effectiveness of loyalty programs, in terms of
making customer more likely to stay with their provider, was mixed.
2011-2013 US
47%
55%
53%
55%
61%
52%
44%
52%
56%
59%
52%
68%
55%
59%
62%
57%
53%
55%
58%
61%
52%
55%
46%
48%
51%
49%
49%
52%
57%
62%Retailers
Hotels
Wireless/cell phone
companies
Internet service
providers
Airlines
Home telephone service
providers
Utility companies
Cable/satellite television
service providers
* Property & Casualty (P&C)
insurance
9%
5%
9%
12%
16%
15%
30%
29%
33%
64%
12%
8%
12%
16%
17%
17%
32%
33%
41%
67%
9%
10%
11%
15%
15%
16%
29%
32%
33%
69%
2013
2012
2011* Property & Casualty (P&C) insurance included in 2013; previous years
was Life Insurance
Banks
Persuasion (much & very much)Participation (at least 1 program)

Copyright © 2013 Accenture All rights reserved. 18
Adoption of loyalty programs and persuasion of programs to stick with providers
Globally, adoption of programs across industries is in line with last year. The
effectiveness of loyalty programs, in terms of making a customer more likely to stay
with a provider, saw a very small increase since 2011.
2011-2013 Global
51%
49%
50%
48%
53%
51%
55%
57%
53%
57%
50%
50%
51%
49%
52%
50%
55%
56%
53%
56%
54%
54%
51%
51%
58%
56%
56%
57%
55%
58%Retailers
Banks
Wireless/cell phone
companies
Internet service
providers
Airlines
Hotels
Home telephone service
providers
Utility companies
Cable/satellite television
service providers
* Property & Casualty (P&C)
insurance 16%
21%
21%
23%
23%
23%
31%
34%
31%
53%
16%
22%
22%
23%
24%
24%
29%
32%
30%
53%
18%
20%
21%
21%
24%
25%
27%
30%
31%
54%
2013
2012
2011* Property & Casualty (P&C) insurance included in 2013; previous
years was Life Insurance 3
Persuasion (much & very much)Participation (at least 1 program)

Copyright © 2013 Accenture All rights reserved. 19
9%
8%
7%
7%
6%
6%
7%
6%
4%
5%
5%
4%
4%
3%
15%
14%
11%
12%
10%
11%
11%
11%
8%
7%
9%
8%
5%
6%
35%
36%
38%
38%
33%
37%
33%
33%
31%
36%
36%
35%
34%
34%
29%
29%
31%
30%
36%
32%
33%
33%
37%
36%
34%
35%
38%
40%
14%
13%
13%
13%
14%
14%
16%
17%
20%
16%
16%
18%
19%
18%
2012
2013
2012
2013
2012
2013
2012
2013
2012
2013
2012
2013
2012
2013
In the U.S., while up in some categories, customer satisfaction levels have generally remained
stagnant. Satisfaction went down in the important category of accessing customer service and
support through multiple channels.
2Not satisfied At all 3 4 Extremely satisfied
* Being able to access customer service
and support using multiple channels
* Having the service and support
experience match the promise a company
makes to me upfront
* Having access to customer service and
support when I want it and how I want it
* The amount of time it takes to read
and understand information the
company provides me
The amount of time it takes to
completely resolve my issue or problem
* Being able to resolve questions /
issues on my own, without speaking to
a service agent
The amount of time I have to wait
to be served
Genera
l C
hara
cte
ristics
Top 2 boxes
58%
57%
53%
50%
52%
57%
50%
49%
46%
50%
43%
44%
42%
43%
2012-2013 US
Satisfaction with different areas of customer service
Slight word changes in 2013
Excludes “NA” responses

Copyright © 2013 Accenture All rights reserved. 20
13%
13%
11%
8%
7%
7%
11%
10%
9%
8%
7%
6%
6%
5%
5%
5%
5%
4%
5%
5%
4%
19%
17%
17%
14%
14%
13%
17%
15%
14%
14%
13%
12%
12%
11%
10%
12%
10%
10%
10%
9%
8%
35%
35%
36%
40%
39%
40%
37%
35%
37%
38%
37%
40%
37%
35%
39%
36%
35%
38%
39%
36%
38%
23%
25%
26%
27%
28%
29%
25%
28%
28%
29%
31%
31%
31%
34%
33%
32%
35%
34%
31%
35%
37%
9%
10%
10%
11%
12%
11%
10%
12%
12%
11%
12%
12%
14%
15%
13%
14%
15%
13%
14%
15%
13%
2011
2012
2013
2011
2012
2013
2011
2012
2013
2011
2012
2013
2011
2012
2013
2011
2012
2013
2011
2012
2013
Globally, customers were slightly less happy with customer service they received compared to
the previous year, with slight decreases in satisfaction with regards to accessing customer
service and support through multiple channels.
2Not satisfied At all 3 4 Extremely satisfied
Satisfaction with different areas of customer service
* Being able to access customer service
and support using multiple channels
* Having the service and support
experience match the promise a company
makes to me upfront
* Having access to customer service and
support when I want it and how I want it
* The amount of time it takes to read
and understand information the
company provides me
The amount of time it takes to
completely resolve my issue or problem
* Being able to resolve questions /
issues on my own, without speaking to
a service agent
The amount of time I have to wait
to be served
Genera
l C
hara
cte
ristics
Slight word changes in 2013
Excludes “NA” responses
Top 2 boxes
50%
50%
45%
47%
50%
46%
46%
49%
45%
43%
43%
40%
40%
40%
35%
40%
40%
38%
36%
35%
32%
2011-2013 Global
Copyright © 2013 Accenture All rights reserved. 21
83% 81%
17% 19%
2012US
2013US
Offered me preferential
treatment (such as Platinum /
Gold service levels)
Resolve my issue(s) in
the first contact
Recognized & rewarded
me for doing more
business with them
2012-2013 US
Yes
No
Base size: respondents who agreed that their service provider could
have done something differently in order to have kept them
51%
23%
31%
21%
14%
23%
8%
7%
22%
35%
34%
31%
30%
29%
18%
22%
28%
42%
35%
48%
56%
48%
74%
72%
2013
2012
2013
2013
2012
2013
2012
2013
** Contacted me proactively to let
me know about ways to enhance
my experience with them
** Offered me better service and
support options via my mobile
device(s)
** New item included in 2013
Could your service provider have done something differently to prevent you from
switching?
In the U.S., 81% of customers that switched say companies could have done
something to prevent them switching primarily first contact resolution.
Would not have impacted
switching decision (1, 2, 3)
(4, 5, 6, 7) Would have impacted
switching decision (8, 9, 10)

Copyright © 2013 Accenture All rights reserved. 22
85% 82%
15% 18%
2012Global
2013Global
Offered me preferential
treatment (such as Platinum /
Gold service levels)
Resolve my issue(s) in
the first contact
Recognized & rewarded
me for doing more
business with them
Would not have impacted
switching decision (1, 2, 3)
(4, 5, 6, 7) Would have impacted
switching decision (8, 9, 10)
Yes
No
Base size: respondents who agreed that their service provider could
have done something differently in order to have kept them
21%
21%
24%
15%
15%
13%
11%
8%
36%
38%
31%
30%
34%
33%
22%
24%
44%
41%
45%
54%
51%
55%
67%
68%
2012
2013
2013
2012
2013
2013
2012
2013
* Contacted me proactively to let
me know about ways to enhance
my experience with them
* Offered me better service and
support options via my mobile
device(s)
* New item included in 2013
2012-2013 Global
Could your service provider have done something differently to prevent you from
switching?
Globally, 82% of customers that switched say companies could have done
something to prevent them switching, primarily first contact resolution.

Copyright © 2013 Accenture All rights reserved. 23
In the U.S., customers chose their new provider (after switching because of poor
customer service) primarily due to service and price.
Difference between
2012 & 2013 is >= 5%
Factor(s) that made customers choose their new service provider after switching in the past year (Choose all that apply)
57% 57%
39%
34%
30%
23%
11%
18%
14%
10%
58% 58%
42%
34% 35%
22%
14%
8%
US 2013
US 2012
Their
customer
service
Their price Their
product Their
convenience
Their
reputation /
trusted
image
Their
promotion
They are
based in
the same
country
where I live
There was
little
differentiation
among the
competitors
* Their ability
to offer
customer
service and
solutions via
digital / mobile
/ social media
interactions
* Proactive
communi-
cations
from them
Base size: respondents who switched service providers in
the past year due to poor customer service
* New item included in 2013
2010-2013 US

Copyright © 2013 Accenture All rights reserved. 24
Globally, customers chose their new provider (after switching because of poor
customer service) primarily due to service and price.
Base size: respondents who switched service providers in
the past year due to poor customer service
60%
64%
49%
44%
37%32%
27% 27%
20%
10%
63%62%
52%
45%
40%
32%
17%
11%
61%59%
49% 46%
36%
30%
15%
10%
Global 2013
Global 2012
Global 2011
Their
customer
service
Their price Their
product Their
convenience
Their
reputation /
trusted
image
Their
promotion
They are
based in
the same
country
where I live
There was
little
differentiation
among the
competitors
* Their ability
to offer
customer
service and
solutions via
digital / mobile
/ social media
interactions
* Proactive
communi-
cations
from them
* New item included in 2013
2010-2013 Global
Factor(s) that made customers choose their new service provider after switching in the past year (Choose all that apply)

Copyright © 2013 Accenture All rights reserved. 25
In the U.S., despite slightly higher switching due to poor customer service,
expectations declined by 8% this year.
12%
12%
63%
71%
17%
13%
8%
4%
2012
2013
Much/slightly lower The same Slightly higher Much higher
2012-2013 US
Change in customer service expectations as compared to 12 months ago

Copyright © 2013 Accenture All rights reserved. 26
10%
10%
6%
9%
64%
70%
36%
45%
20%
16%
42%
35%
7%
3%
16%
10%
2012 Mature
2013 Mature
2012 Emerging
2013 Emerging
Globally, despite slightly higher switching due to poor customer service,
expectations declined by 9% this year. The rate of increase this year is in line with
2008 rates. Customers in emerging markets continue to have higher expectations
than those in the mature markets.
12%
13%
9%
8%
8%
8%
10%
56%
56%
53%
51%
49%
51%
59%
27%
26%
30%
30%
32%
29%
25%
6%
5%
8%
10%
12%
11%
6%
2007
2008
2009
2010
2011
2012
2013
Much/slightly lower The same Slightly higher Much higher
2007-2013 Global
Change in customer service expectations as compared to 12 months ago
2012-2013 Emerging vs. Mature Markets

Copyright © 2013 Accenture All rights reserved. 27
21%
42%
52%
58%
66%
79%
28%
51%
56%
65%
67%
79%
2013
2012
Customer service factors for which expectations have increased
Among U.S. customers, 51% have much higher expectations of getting specialized
treatment for being a “good” customer than last year.
Base size: respondents whose customer service
expectations are higher when compared to 12 months ago.
2013 US
* I expect customer service
and support to be easier / more
convenient to obtain
* I expect customer service and
support representatives, in-home
service representatives and sales
associates to be more
knowledgeable/better trained
* I expect customer service
and support to be faster
* I expect more options for
obtaining service and support (e.g.,
by phone, online, at store locations,
via mobile devices, etc.)
* I expect specialized treatment
for being a good customer (e.g.,
quicker response or access to
information, services reserved for
best customers)
* I expect customer service and
support representatives, in-home
service representatives and sales
associates to know more about me
/ my preferences * Slight word changes in 2013
Copyright © 2013 Accenture All rights reserved. 28
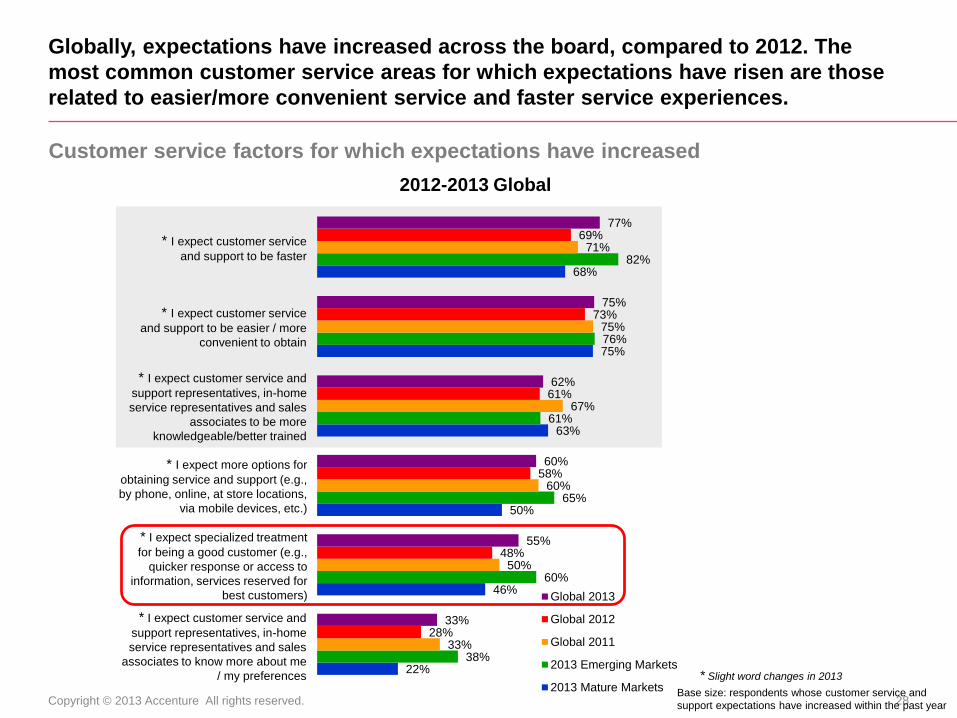
Globally, expectations have increased across the board, compared to 2012. The
most common customer service areas for which expectations have risen are those
related to easier/more convenient service and faster service experiences.
* I expect customer service
and support to be easier / more
convenient to obtain
* I expect customer service and
support representatives, in-home
service representatives and sales
associates to be more
knowledgeable/better trained
* I expect customer service
and support to be faster
* I expect more options for
obtaining service and support (e.g.,
by phone, online, at store locations,
via mobile devices, etc.)
* I expect specialized treatment
for being a good customer (e.g.,
quicker response or access to
information, services reserved for
best customers)
* I expect customer service and
support representatives, in-home
service representatives and sales
associates to know more about me
/ my preferences
Customer service factors for which expectations have increased
Base size: respondents whose customer service and
support expectations have increased within the past year
22%
46%
50%
63%
75%
68%
38%
60%
65%
61%
76%
82%
33%
50%
60%
67%
75%
71%
28%
48%
58%
61%
73%
69%
33%
55%
60%
62%
75%
77%
Global 2013
Global 2012
Global 2011
2013 Emerging Markets
2013 Mature Markets* Slight word changes in 2013
2012-2013 Global
Copyright © 2013 Accenture All rights reserved. 29
I tend to trust comments about
companies/brands on social media
sites posted by people I know
(family, friends, co-workers...)
I tend to trust comments about
companies/brands on social media
sites posted by people I don’t know
Negative comments posted on
social media sites contribute to my
consideration of not buying a given
product or service
Positive comments posted on
social media sites contribute to my
consideration of buying a given
product or service
2013 US
Portion of consumers that posted
negative comments after having a
bad customer service experience
Portion of consumers that posted
negative comments after having a
bad Marketing & Sales experience
Word-of-mouth information from
people I know (family, friends, co-
workers)
Online information from sources like
expert review sites, news sites or
product comparison sites)
Paid advertising on TV or radio
Online information from Social
Media sites like Twitter, Facebook,
Pinterest, User forums and others
Online advertising shown when
making queries on search engines
such as Google, Bing or Yahoo
Direct mail or telemarketing
In-store information from sales
people or displays
Corporate web site (for example, the
company website or a brand or
product website)
Print advertising
(newspaper, magazine)
Online advertising through banner
ads, pop-up ads, ads on Facebook
and so on
* New item included in 2013 survey
5%
10%
9%
11%
13%
31%
18%
32%
30%
25%
45%
13%
25%
25%
33%
43%
48%
49%
50%
52%
58%
71%
Sources used
Source importance(important & very important)
31%
35%
56%
34%
49%
46%
35%
43%
20%
18%
9%
23%
Disagree (1, 2, 3) Neutral (4, 5, 6, 7)
Agree (8, 9, 10)
18%
20%
15%
15%
US 2013
US 2012
* Online reviews and comments from
other consumers on sites like
Travelocity, Amazon, Yelp and others
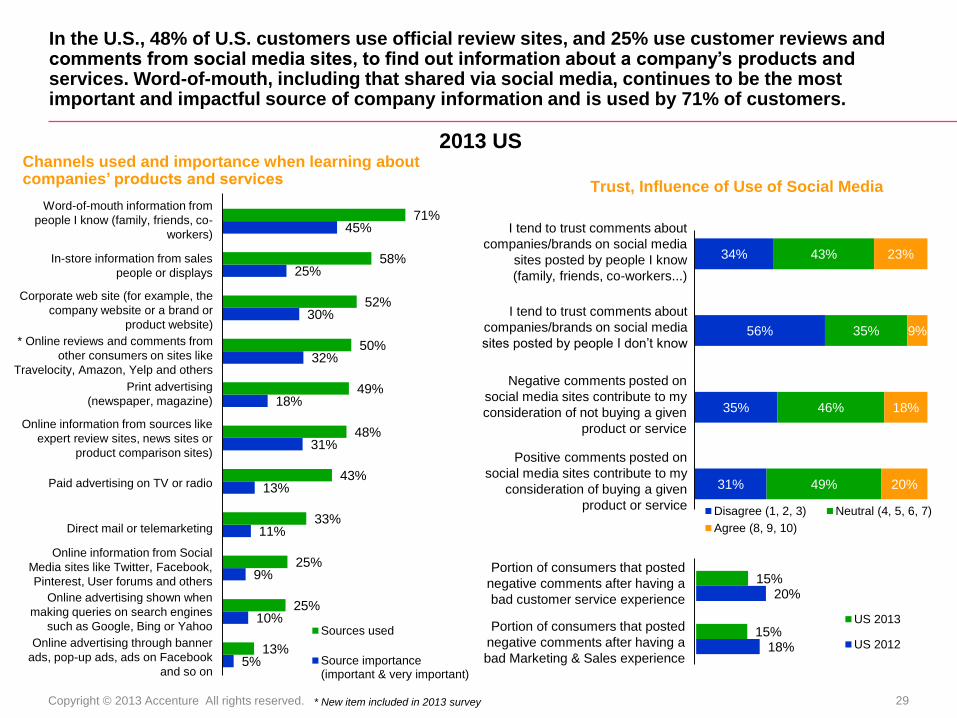
In the U.S., 48% of U.S. customers use official review sites, and 25% use customer reviews and comments from social media sites, to find out information about a company’s products and services. Word-of-mouth, including that shared via social media, continues to be the most important and impactful source of company information and is used by 71% of customers.
Channels used and importance when learning about companies’ products and services
Trust, Influence of Use of Social Media

Copyright © 2013 Accenture All rights reserved. 30
15%
16%
22%
25%
33%
22%
26%
42%
36%
44%
51%
36%
38%
45%
48%
48%
49%
59%
64%
65%
71%
77%
Globally, word-of-mouth and online channels remain the primary information
sources used.
Channels used and importance when learning about companies’ products and services
Sources used
Source importance
(important & very important)
Word-of-mouth information from people I know
(family, friends, co-workers)
Online information from sources like expert review
sites, news sites or product comparison sites
Paid advertising on TV or radio
Online information from Social Media sites like
Twitter, Facebook, Pinterest, User forums & others
Online advertising shown when making queries on
search engines such as Google, Bing or Yahoo
Direct mail or telemarketing
In-store information from sales people or displays
Corporate web site (for example, the company
website or a brand or product website)
Print advertising (newspaper,
magazine)
Online advertising through banner ads, pop-up
ads, ads on Facebook and so on
** Online reviews and comments from other
consumers on sites like Travelocity, Amazon, Yelp
and others
** New item included in 2013
2013 Global

Copyright © 2013 Accenture All rights reserved. 31
Globally, the influence of social media has stabilized globally this year. Positive and
negative comments still hold influence in a consumers and almost one in three trust
comments posted by people they know.
Trust, Influence of Use of Social Media
I tend to trust
comments about
companies/brands
on social media
sites posted by
people I know
(family, friends, co-
workers...)
Negative comments
posted on social
media sites
contribute to my
consideration of not
buying a given
product or service
Positive comments
posted on social
media sites
contribute to my
consideration of
buying a given
product or service.
Agree (8,9,10) Neutral (4,5,6,7) Disagree (1,2,3)
I like seeing
companies get
directly involved in
contributing to
discussions in
social media
environments
The use of social
media sites has
increased my
overall awareness
about products
and services from
providers I did not
know of before
Comments posted
on social media
sites influence my
opinions about
companies or
brands in general
I am more likely
to do business
with a company
that I know I can
interact with in a
social media
environment
The use of social
media sites like
blogs, bulletin
boards, Facebook,
MySpace, Twitter,
etc. has increased
my overall
engagement with
my current
providers and their
brands
I tend to trust
comments about
companies/brands
on social media
sites posted by
people I don't
know
2011-2013 Global
21%18% 17% 19% 17% 16%
22% 19% 18%
28% 26% 25% 28% 26%23%
29%26% 25%
35% 32% 30%37%
34% 33% 35%30% 30%
49%51%
51%52% 55%
55%
51%54% 54%
46%48% 48%
46% 49%50%
47%50% 51%
42% 46%46%
42%45% 45%
49%54% 54%
30% 31% 32%29% 28% 29% 28% 28% 28% 26% 26% 27% 26% 25% 27%
24% 24% 25% 23% 22% 24%21% 21% 21%
17% 16% 16%
2013 2012 2011 2013 2012 2011 2013 2012 2011 2013 2012 2011 2013 2012 2011 2013 2012 2011 2013 2012 2011 2013 2012 2011 2013 2012 2011

Copyright © 2013 Accenture All rights reserved. 32
67%
18%
9%
4%2%
Always access these sites via my mobile device(s)
I access these sites the majority of the time via my mobiledevice(s)
I access these sites about half the time via my mobile device(s)
I access these sites a minority of the time via my mobile device(s)
I never access these sites via a mobile device
In the U.S., 75% of customers use one or more online channels when researching
companies’ products and services and 33 percent use mobile devices to access
these online channels.
33%
2013 US
Percentage of US respondents
who did make use of at least one
online source75%
Amount of time accessing sites to learn about companies’ products and services via
mobile phone or tablet instead of a personal computer or laptop
Base size: Respondents who used (at least one) online source / channel to learn
about the companies products and services

Copyright © 2013 Accenture All rights reserved. 33
38%
20%
54%
24%
24%
24%16%
21%
11%11%
17%
6%11%
18%
4%
Always access these sites via my mobile device(s)
I access these sites the majority of the time via my mobiledevice(s)
I access these sites about half the time via my mobile device(s)
I access these sites a minority of the time via my mobile device(s)
I never access these sites via a mobile device
Globally, 38% of consumers who use one or more online sources to learn about the
companies products and services, access the sites at least half of the time, through
their mobile phone or tablet device.
Amount of time accessing sites to learn about companies’ products and services via
mobile phone or tablet instead of a personal computer or laptop
2013 Emerging
Markets2013 Mature
Markets
2013 Global
Base size: Respondents who used (at least one) online source / channel to learn
about the companies products and services
* New question included in 2013
38%
2013 Global, Emerging and Mature Markets

Copyright © 2013 Accenture All rights reserved. 34
What would motivate you to make use of these channels in future in order to learn more learn about the companies’ products and services? (Choose all that apply.)
42%
4%
9%
10%
17%
20%
24%
38%
None of these would motivate me to
make use of these channels
Getting explanations on how to use
them (e.g. short online tutorials, in-store demo,
telephone & screen sharing tutorials, brochures
etc.)
Having them more tailored to suit my
needs and preferences
Getting some form of guarantee that I
will not be spammed afterwards
Getting rewarded for making use of
these channels (e.g. loyalty points or some
form of discount off my next purchase)
Enabling me to have more control over
them
Other
Learning from family and friends how
easy and effective it is to use them
Base size: US respondents who did not use online sources / channels to
learn about the companies products and services
2013 US
In the U.S., companies able to provide some form of guarantee to customers that
they won’t be spammed may help to motivate them to learn about their products
and services online.
New question included in 2013

Copyright © 2013 Accenture All rights reserved. 35
Globally, companies able to provide some form of guarantee to customers that they
won’t be spammed may help to motivate them to learn about their products and
services online.
What would motivate you to make use of these channels in future in order to learn more learn about the companies’ products and services? (Choose all that apply.)
23%
2%
20%
23%
28%
31%
33%
44%
None of these would motivate me to
make use of these channels
Getting explanations on how to use
them (e.g. short online tutorials, in-store demo,
telephone & screen sharing tutorials, brochures
etc.)
Having them more tailored to suit my
needs and preferences
Getting some form of guarantee that I
will not be spammed afterwards
Getting rewarded for making use of
these channels (e.g. loyalty points or some
form of discount off my next purchase)
Enabling me to have more control over
them
Other
Learning from family and friends how
easy and effective it is to use them
Base size: Respondents who did not use online sources / channels to learn about the
companies products and services
New question included in 2013
2013 Global

Copyright © 2013 Accenture All rights reserved. 36
Did not deliver Tailored Experience
(Does not describe at all: 1, 2, 3)
Did deliver Tailored Experience
(Describes very well: 8, 9, 10)
In the U.S., the gap between the use of digital technologies and the ability of
companies to use them to improve customer experiences is highlighted by the
survey’s findings that, among the 10 industries covered by the report, none made
noticeable progress in providing customers with a tailored experience in 2013.
38%
36%
28%
33%
28%
25%
21%
19%
35%
36%
22%
24%
23%
21%
22%
21%
28%
25%
19%
18%
17%
15%
23%
19%
18%
18%
25%
25%
13%
19%
26%
28%
29%
29%
30%
33%
23%
26%
40%
41%2013
2012
2013
2012
2013
2012
2013
2012
2013
2012
2013
2012
2013
2012
2013
2012
2013
2012
2013
2012
* Hotels
Retail banks
** Property & casualty insurance
providers
Cable & satellite providers
Landline phone companies
Gas & electric utilities
Wireless phone companies
Internet service providers
Consumer electronics manufacturers
Consumer goods retailers
2012-2013 US
Consumers agreeing/disagreeing their provider delivers tailored experience

Copyright © 2013 Accenture All rights reserved. 37
Did not deliver Tailored Experience
(Does not describe at all: 1, 2, 3)
Did deliver Tailored Experience
(Describes very well: 8, 9, 10)
Globally, many industries still fall short on delivering a more tailored experience
and, for others, there is not much change compared to last year.
Consumers agreeing/disagreeing their provider delivers tailored experience
32%
28%
27%
24%
25%
22%
24%
20%
23%
20%
23%
22%
22%
19%
22%
19%
20%
18%
16%
14%
15%
16%
21%
24%
23%
25%
18%
20%
25%
29%
25%
26%
20%
23%
26%
30%
29%
32%
37%
41%2013
2012
2013
2012
2013
2012
2013
2012
2013
2012
2013
2012
2013
2012
2013
2012
2013
2012
2013
2012
* Hotels
Retail banks
** Property & casualty insurance
providers
Cable & satellite providers
Landline phone companies
Gas & electric utilities
Wireless phone companies
Internet service providers
Consumer electronics manufacturers
Consumer goods retailers
2012-2013 Global

Methodology and Survey Sample

Copyright © 2013 Accenture All rights reserved. 39
10%
8%
2%2%2%3%2%2%2%2%2%2%2%3%2%2%3%
3%2%2%
4%
3%
3%2%2%3%
4%
2%3%
4%
3%
3%2%
Methodology and Survey Sample
This year, Accenture surveyed 13,168 consumers in 33 different countries via the Internet
between May 28 and July 16, 2013. Respondents were asked to evaluate 10 industry sectors
(up to four industries per respondent).
Argentina
AustraliaBelgium
Brazil
CanadaChile
ChinaCzech Republic
Denmark
FranceFinland
Germany
IndiaIndonesia
IrelandItaly
JapanMalaysia
MexicoNetherlands
NorwayPhilippines
RussiaSingapore
South AfricaSouth Korea
SpainSweden
TurkeyUAE
UK
USA
Distribution by country and industry of global sample of respondents (n=13,168)
16%
20%
26%
29%
30%
30%
34%
52%
57%
58%
Landline phone companies
Internet service providers
Hotels
Consumer electronics manufacturers
Property & casualty insurance providers
Cable and satellite providers
Gas & electric utilities
Consumer goods retailers
Retail banks
Wireless phone companies
** Property & casualty insurance
providers replaced Life Insurance
Providers in 2013
* Hotels replaced Travel &
Tourism in 2013
Poland

Copyright © 2013 Accenture All rights reserved. 40
Respondent Sample Size Breakdown:
Countries & Number of Respondents
2013 Emerging
Markets
(n= 5985)
2013 Mature
Markets
(n=7183)
2005 2006 2007 2008 2009 2010 2011 2012 2013
Argentina 303 308 304 305
Australia 300 303 302 375 400 403 430
Belgium 304 331 401 400 400
Brazil 311 314 316 345 302 504 500
Canada 300 302 306 354 404 405 430
Chile 339 320
China 320 325 302 303 332 504 520
Czech Republic 303 410 421
Denmark 201 202
Finland 201 208
France 321 328 300 377 405 401 401
Germany 307 302 355 408 401 400
India 303 304 300 326 500 503
Indonesia 309 329 301 317
Ireland 306 301 314 314
Italy 359 405 400 400
Japan 349 418 400 402
Malaysia 311 314 322 320
Mexico 354 308 300 302
Netherlands 302 401 400
Norway 293 300
Philippines 305 302 301
Poland 301
Russia 303 304 321
Singapore 300 302 320 301 319
South Africa 305 326 314 301 319
South Korea 319 317 330 302
Spain 348 409 414 405
Sweden 203 201
Turkey 306 300 313
UAE 300 328 300 301
UK 1003 1007 1000 1003 1003 317 801 1003 1034
USA 1006 1018 1000 1004 1006 440 804 1200 1256
Total 2009 2025 3552 4189 5050 7383 10173 12662 13168


