
The Economic Effects of theOpioid Crisis in West Virginia
John Deskins, Ph.D.
November 2017
Bureau of Business & Economic Research
College of Business & Economics
West Virginia University
www.be.wvu.edu/bber
Copyright ©2017 by WVU Research Corporation
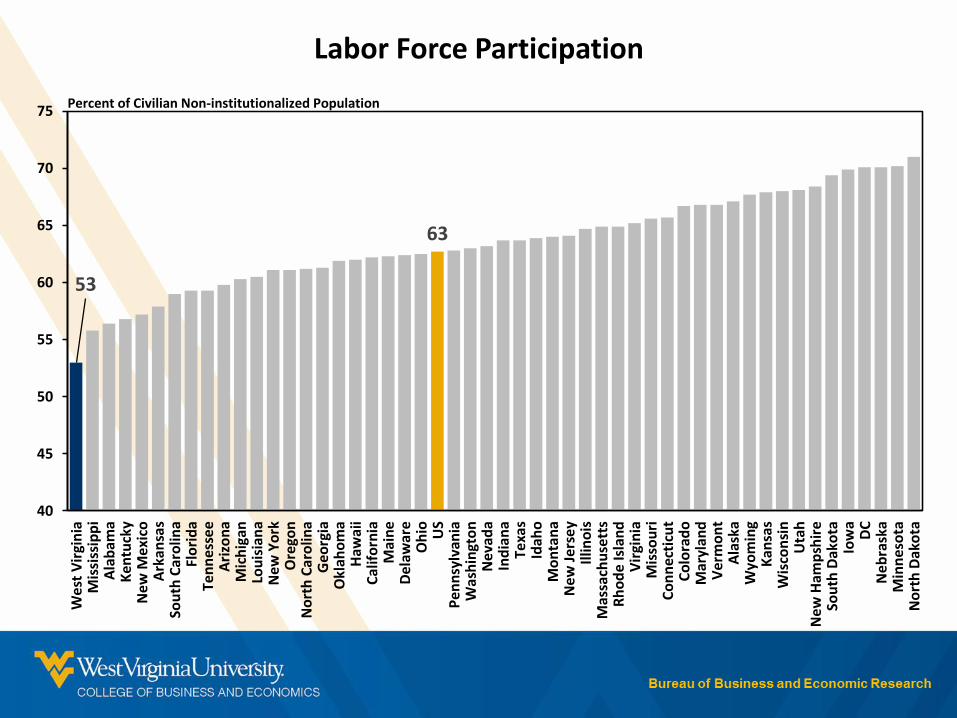
53
63
40
45
50
55
60
65
70
75
We
st V
irgi
nia
Mis
siss
ipp
iA
lab
ama
Ken
tuck
yN
ew
Me
xico
Ark
ansa
sSo
uth
Car
olin
aFl
ori
da
Ten
nes
see
Ari
zon
aM
ich
igan
Lou
isia
na
Ne
w Y
ork
Ore
gon
No
rth
Car
olin
aG
eorg
iaO
klah
om
aH
awai
iC
alif
orn
iaM
ain
eD
elaw
are
Oh
io US
Pen
nsy
lvan
iaW
ash
ingt
on
Ne
vad
aIn
dia
na
Texa
sId
aho
Mo
nta
na
Ne
w J
erse
yIl
lino
isM
assa
chu
sett
sR
ho
de
Isla
nd
Vir
gin
iaM
isso
uri
Co
nn
ecti
cut
Co
lora
do
Mar
ylan
dV
erm
on
tA
lask
aW
yom
ing
Kan
sas
Wis
con
sin
Uta
hN
ew
Ham
psh
ire
Sou
th D
ako
taIo
wa
DC
Ne
bra
ska
Min
nes
ota
No
rth
Dak
ota
Labor Force Participation
Percent of Civilian Non-institutionalized Population

0
2
4
6
8
10
12
1999 2000 2001 2002 2003 2004 2005 2006 2007 2008 2009 2010 2011 2012 2013 2014 2015
U.S.
Opioid-Overdose Deaths, U.S.Deaths per 100,000 Population
Source: Kaiser Family Foundation analysis of Centers for Disease Control and Prevention (CDC), National Center for Health Statistics.Note: Rates are age-adjusted, except those for 2005 and 2009, which are calculated using data from WV Health Statistics Center.

0
5
10
15
20
25
30
35
40
1999 2000 2001 2002 2003 2004 2005 2006 2007 2008 2009 2010 2011 2012 2013 2014 2015
West Virginia
U.S.
Source: Kaiser Family Foundation analysis of Centers for Disease Control and Prevention (CDC), National Center for Health Statistics.Note: Rates are age-adjusted, except those for 2005 and 2009, which are calculated using data from WV Health Statistics Center.
Opioid-Overdose Deaths, U.S. and WVDeaths per 100,000 Population

WV, 2.8 in 2000 and 36.0 in 2015
US, 3.0 in 2000 and 10.4 in 2015
0
10
20
30
40W
VN
HO
H RI
MA KY
ME
CT
NM
MD
TN UT
DE
DC
NV
MI
VT
NC
MO SC OK
PA
WI
AK
NY IL US
AZ
VA NJ
FLW
AC
O IN GA
OR
AR LA
MN AL ID KS
CA TX HI
2000 2015
Deaths per 100,000 Population
Opioid-Overdose Deaths by State
Source: Kaiser Family Foundation analysis of Centers for Disease Control and Prevention (CDC), National Center for Health Statistics.Note: Rates are age-adjusted. States with missing values are not shown.

0
100
200
300
400
500
600
700
800
900
1000
2001 2002 2003 2004 2005 2006 2007 2008 2009 2010 2011 2012 2013 2014 2015
Source: WV Health Statistics Center, Vital Statistics System 2015 Preliminary DataNote: The number of deaths is higher than the number of victims as one person can consume more than one type of opioid.
Opioid-Overdose Deaths by Type, WVNumber of Deaths
Oxycodone
FentanylHydrocodone
Other Opioid Drugs
Heroin

Heroin201
Oxycodone182
Fentanyl180
Hydrocodone113
Morphine76
Methadone32
Others132
638 Opioid Overdose Deaths in WV, by Type, 2015
Source: WV Health Statistics Center, Vital Statistics System 2015 Preliminary DataNote: The total adds to more than 638 as one person sometimes consumes more than one type of opioid.

72.4
66.5
129.9
96.0
50
60
70
80
90
100
110
120
130
140
150
160
2006 2007 2008 2009 2010 2011 2012 2013 2014 2015 2016
West Virginia
U.S.
Opioid Prescribing Rates, WV and the U.S.
Prescriptions per 100 People
Source: Centers for Disease Control and Prevention

Opioid Prescribing Rates, WV Counties, 2015
Source: Centers for Disease Control and Prevention

Direct Economic Costs of the Opioid Crisis
1. Healthcare Costs2. Substance Abuse Treatment Costs 3. Criminal Justice Costs
Police protection costs Legal costs Correctional facilities costs Property loss due to opioid-related crimes
4. Productivity Loss Permanent income loss due to overdose death Reduced productive hours due to abuse/dependence Reduced productive hours due to incarceration
Source: Florence et al., Medical Care, 2016, 54: 901-906

Direct Economic Impacts of Opioid Crisis - Healthcare, Substance Abuse, and Criminal Justice, West Virginia, 2015
Jobs That Could Be Freed For Other Pursuits:
4,318
Productive Capacity That Could Be Devoted to Other Pursuits:
$322 Million

Economic Impact of Productivity Loss, Non-Fatal, 2015

Economic Impact of Productivity Loss for 2006-2015 Fatalities, 2015


