
q, to'cc8
THE EFFECT OF CYTOTOXIC CHEMOTHERAPY
THE MUCOSA OF THE SMALL INTESTINE
Dorothy MarY Kate Keefe
M.B. B.S, F.R.A.C.P.
JT]NE 1998
Thesis submitted for the degree of
Doctor of Medicine
within the FacultY of Medicine
The UniversitY of Adelaide
Departments of GastroenterologY
and HaematologY/OncologY
The Queen Elizabeth HosPital
by
Woodvitle South, South Australia
TABLE OF CONTENTS
Table of Contents
Abstract
Declaration
Acknowledgments
Abbreviations
Chapter I Introduction and Hypothesis
1.1 Introduction
1.2 Definition of mucositis
1.3 Hypothesis
1.4 Aims
1.5 Research Plan
Chapter 2 Review of the Literature Concerning Chemotherapy' the Small fntestine
and Mucositis
viii
xi
xii
xüi
1
2
2
J
4
2.t
2.2
Principles of the action of chemotherapy on tumours
Overview of the side effects of chemotherapy
Mucositis
5
6
72.3
ll
2.4
25
Gastrointestinal side effects of chemotherapy I
Small intestinal morphology and function 9
Assessment of the structure and function of the small intestine 14
2.6I Historical 14
2.62 Current 'state of the art' assessment 14
2.62.1 Direct 14
2.62.2 Indirect assessment of the small intestine ... 15
2.62.3 Duodenal disaccharidases 16
2.62.4 Intestinal permeability 16
2.62.5 Breath testing to assess bacterial overgrowth and oro-caecal
transit time 18
2.63 Animal versus human l8
Nutrition arid malignancy 19
Immunology of the gastrointestinal tract and nutrition... ., - 2l
Response of the small intestine to injury 2I
Apoptosis versus necrosis 22
Comparison with Coeliac disease 24
Bacterial translocation '- 25
Stem cells and regeneration of intestinal crypts after cytotoxic exposure 26
Effects of irradiation on the small intestine 26
Structure of the small intestinal mucosa following chemotherapy... ... 28
Histology of the small intestine following chemotherapy . . .. 31
Oral chemotherapy 38
Dose of chemotherapy and crypt survival 39
2.6
2.7
2.8
2.9
2.70
2.tl
2.t2
2.t3
2.t4
2.r5
2.16
2.t7
2.r8
2.r9
2.20
2.21
2.22
2.23
2.24
2.25
2.26
lll
Bone marrow transplantation and the small intestine
Irinotecan: A special case?
Functional changes in the small intestine following chemotherapy
The effect of chemotherapy on small intestinal permeability
Treatment of chemotherapy-induced small intestinal damage
Trials of oral and small intestinal mucositis prevention
2.24.1 Glutamine
2.24.2 Transforming growth factor B
2.24.3 Interleukin-11
2.24.4 Keratinocyte growth factor.
2.24.5 GM-CSF and G-CSF
2.24.6 Whey growth factor extract
2.24.7 Total parenteral nutrition
2.24.8 Other special dietary modifications
2.24.9 Epidermal growth factor
2.24.10 Growth hormone and IGF-1
2.24.T1 Other potential agents to prevent ottreaf mucositis
2.24.12 Combinations of growth factors to prevent mucositis ..
Safety issues in mucositis prevention ... .
Summary
39
4T
42
45
48
51
51
53
55
57
57
58
58
59
62
62
62
66
67
68
lv
Chapter 3 The Effect of High Dose Chemotherapy and Autologous Stem Cell
Transplantation on Small Intestinal Permeability in Humans
3 1 Introduction
3.2 Methodology
3.3 Results
3.4 Discussion
Chapter 4 An investigation into abdominal and oral symptoms and small intestinal
function following cytotoxic chemotherapy
4.1 Introduction 85
Methodology 86
4.21 Assessment of nutrition and symptoms.... 89
4.22 Intestinal sugar permeability test 94
4.23 Endotoxin assay 95
4.24 Breath testing: combined lactulose breath hydrogen and l4C-D-xylose
breathtest 96
4.24,I Test principles 97
4.24.2 Methodology 98
4.24.3 Result analysis 99
4.25 Statistical analysis 100
4.2
69
72
76
82

4.3
4.4
v
Results
4.30 DemograPhics
4.37 Nutrition and sYmPtoms
4.32 Intestinal sugarpermeability
4.33 Serum endotoxin
4.34 Assessment of bacterial overgrowth
Discussion
128
t02
102
105
732
132
t34
t40
142
142
t43
t45
746
147
r47
t57
762
chapter 5 small Intestinal Morphological changes after chemotherapy
5.1 Introduction
5.2 MethodologY
5.21 Disaccharidases
5.22 Light microscoPY
5.23 ElectronmicroscoPY
5.24 Statistics
5.3 Results
5.31 Disaccharidases
5.32 Light microscopy
5.33 ElectronmicroscoPY
5.4 Discussion
5.5 Summaryr64
v1
Chapter 6 Development of the Dark Agouti Rat Mammary Adenocarcinoma Model
to Assess Small Intestinal and Tumour Effects of Chemoprevention
6.I Generalintroduction t66
6.2 A study to find the optimum dose of methotrexate to cause nonJethal small
intestinal mucositis in the dark agouti rat 168
6.21 Introduction 168
6.22 Methodology 169
6.23 Results l7o
6.24 Discussion 775
6.3 The effect of glutamine in preventing small intestinal mucositis in the dark
agouti ratmammary adenocarcinoma model 176
6.31 Introduction 176
6.32 Methodology 176
6.33 Results 181
6.34 Discussion 196
Chapter 7 Summary and Conclusions 197

vll
Appendix (I) Breath Test Result Examples
Appendix (II) Chemotherapy Drug Regimens Used
Appendix (ITt) Toxicity Grndes
Bibliography
Pubtications arising from this thesis
20r
203
207
2t0
235
vlll
Abstract
This thesis investigated the effect of chemotherapy on the mucosa of the small intestine both in
humans and in rats.
Introduction: Mucositis after chemotherapy for cancer is becoming increasingly important,
both as a cause of patient morbidity and occasional mortality, and because the resulting toxicity
potentially limits the dose, and therefore the chance of cancer cure. The reasons for mucositis
becoming more predominant are two-fold, protection from bone marrow toxicity by colony
stimulating factors has led to increased doses of drugs being given, and there is a drive to
increase doses in order to increase cure rate. The aims of the project were to investigate the
prevalence, duration and severity of mucositis in the gastrointestinal Iract following
chemotherapy.
Literature review: this covers the areas of mucositis, small intestinal morphology, apoptosis,
nutrition and malignancy, intestinal sugar permeability, and the effects of chemotherapy on the
small intestine. Most chemotherapeutic agents kill rapidly dividing cells, making the
gastrointestinaltractparticularþ vulnerable. C¡otoxic agents kill cells at different levels of the
crypt hierarchy, leading to crypt hypoplasia followed by regeneration. The exact mechanism of
mucositis is not known, nor is it apparent if there are functional abnormalities of absorption,
and how these correlate with symptoms such as bloating, abdominal pain and diarrhoea.
tx
Research plan: the project is split into four areas
l. Mucositis was studied after high dose chemotherapy and autologous blood stem cell
transplantation in forty patients. Symptoms were recorded and mucositis assessed indirectly by
an intestinal sugar permeability test. Oral mucositis occurred in 100% of patients, with 50%
having grade 3 or 4 oral mucositis. Small intestinal symptoms (diarrhoea, vomiting) of gracle 3
or 4 occurred in 4lYo, permeability peaking at an increase over baseline value of 6.8-fold at
day 14. The conclusion from this study was that high dose chemotherapy causes a transient
increase in intestinal permeability associated with small intestinal symptoms.
2. A second study was undertaken of small intestinal mucositis after both standard and high-
dose chemotherapy, to further define the prevalence, duration and symptom severity at
intervals of 3 days up to 14 days, and then at 28 days after chemotherapy. Symptoms were
scored by questionnaire, and mucositis was assessed by an iso-osmolar sugar permeability test.
Nutritional changes were small. Serum endotoxin and combined breath tests for bacterial
overgrowth were unhelpful.
3. A third study assessed small intestinal mucosal histology following chemotherapy.
Morphological changes began with a transient increase in crypt apoptosis at day I after
chemotherapy, followed by a reduction in villus area, crypt length and mitotic index by day 3,
the latter two rebounding to greater than baseline levels at day 16. Thus the new finding of this
study was that mucositis is due to induction of early crypt apoptosis that precedes hypoplastic
villous atrophy.

X
4. The effect of oral glutamine on ameliorating intestinal mucositis was assessed in the dark
agouti (DA) rat given subcutaneous implants of isogeneic mammary adenocarcinoma and
treated with methotrexate (MTX) Glutamine had no significant effect on tumour growth' nor
did it ameliorate mucositis as assessed by apoptosis and villus area, crypt length and mitotic
count. The conclusions were that this is a good model for further study of mucositis, and that
glutamine does not protect against small intestinal mucositis.
concrusions: The conclusion of this thesis is that small intestinal mucositis occurs
symptomatically in a significant number of patients, and peaks 3-7 days after treatment' The
principal mechanism is apoptosis of intestinal crypts that results in intestinal hypoplasia'

xr
Declaration
This work contains no material which has been accepted for the award of any other degree or
diploma in any university or other tertiary institution and, to the best of my knowledge and
belief, contains no material previously published or written by another person, except where
due reference has been made in the text.
I give consent for this copy of my thesis, when deposited in the University Library, being
available for loan and photocopying.
Dorothy Keefe

xll
Acknowledgments
I performed the work described in this thesis while employed as a Gastroenterology Research
Fellow in the Department of Gastroenterology at The Queen F;lizabeth Hospital, Woodville
South, South Australia. I was supported by The Anti-Cancer Foundation of the Universities of
South Australia, with a Grant-in-Aid for 1995, and with a Research Associateship from 1996-
1997. Other support came from the University of Adelaide (83 funding t997) and The Queen
Elizab eth Ho spit al Re se arch F ound ati on (l 9 9 7 ) .
I wish to acknowledge the important role played by Dr. Adrian G. Cummins, ffiY supervisor,
who was avery encouraging, supportive and enthusiastic mentor. Dr. Ian Roberts-Thompson,
Director of the Department of Gastroenterology, and Dr. R. Edward Sage, Director of the
Department of Haematology/Oncology, have also been most supportive. I am very grateful to
the following for their assistance with this work: Dr. Chris Karapetis and Sr. Vinny Pegoli for
patient recruitment and follow-up; Mr. Gary Goland for the apoptosis assay and laboratory
knowledge; Mr. John Brealey for electron microscopy; Dr. Fiona Thompson for
histomorphometry; Drs. Geoff Regester and Julie Clark at CHRI for collaboration with the
Dark Agouti model; Mr. Ben Edwards at CHRI for the animal handling; and Mr. Phil Leppard,
Department of Statistics, University of Adelaide for the statistical analysis.
Finaþ, I am most grateful to Robert J. Prowse and Catherine M. Prowse for their belief in me
and for their wonderful support.
IGF
G-CSF
GM-CSF
PDGF
CRTZ
TGF
TNF
EGF
NCI
TIPTLC
HPLC
ECOG
CMF
GVHD
wHo
xlll
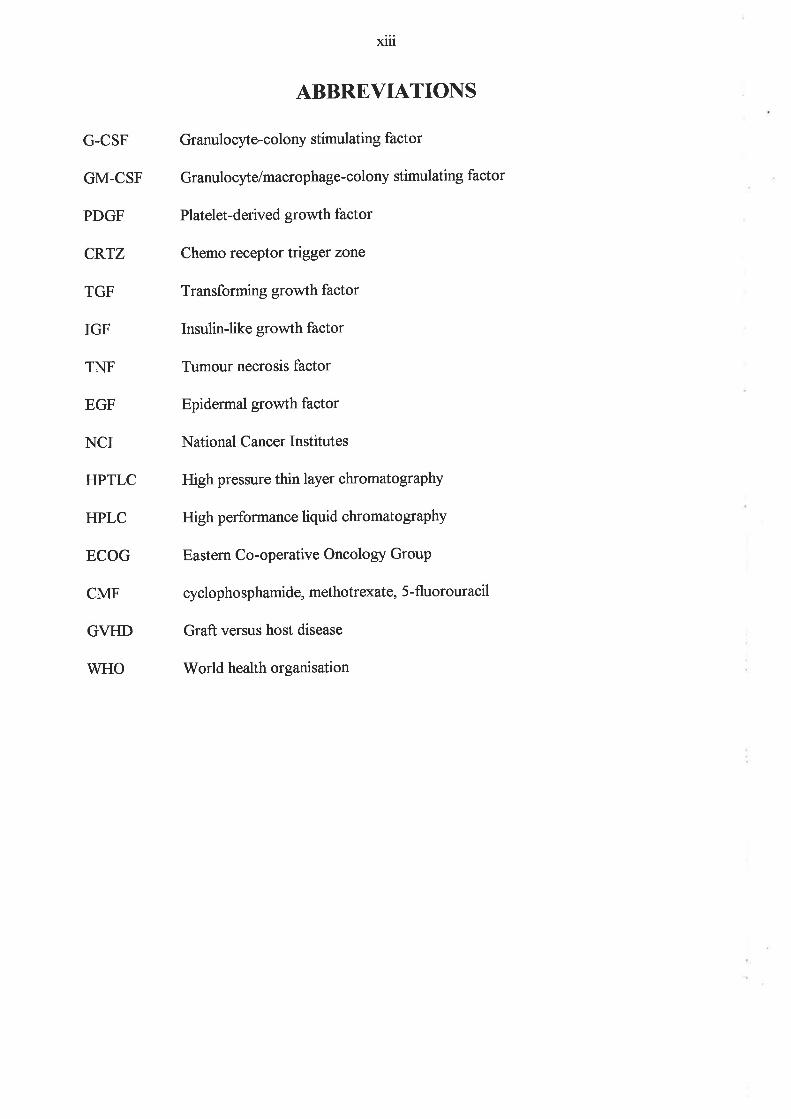
ABBREVIATIONS
Granulocyte-colony stimulating factor
Granulocyte/macrophage-colony stimulating factor
Platelet-derived growth factor
Chemo receptor tngger zone
Transforming growth factor
InsulinJike growth factor
Tumour necrosis factor
Epidermal growth factor
National Cancer Institutes
High pressure thin layer chromatography
High perforrnance liquid chromatography
Eastern Co-operative Oncology Group
cyclopho sphamide, methotrexate, 5 -fluorouracil
Graft versus host disease
World health organisation

1
CHAPTER I
CYTOTOXIC CHEMOTHERAPY AND THE SMALL INTESTINE
1.1 Introduction
Cytotoxic drugs are used to treat malignancy to eradicate neoplastic cells. Treatment with
these drugs may, however, result in side effects as cytotoxic drugs do not always distinguish
between normal and malignant cells. The efficacy of chemotherapy relies firstly on the
sensitivity of the neoplasm to treatment, and secondly on the ability of normal cells to recover
more quickly than cancer cells. Certain tissues, such as the bone marrow and the
gastrointestinal tract, are more affected by chemotherapy, but also recover rapidly. The
maximum dose of chemotherapy is limited by toxicity to normal organs. The 'dose-limiting
toxicity' is that toxicity which prevents a higher dose being used. Until recently this was most
commonly bone marrow suppression, with doses not reaching a level where life-threatening
gastrointestinal toxicity was a major issue. Since the advent of colony-stimulating factors,
which stimulate bone marrow recovery, higher doses of chemotherapy are able to be used, in
an attempt to increase cancer cure rates. This has lead to an increase in prevalence of
gastrointestinal toxicity, which has become dose-limiting.
Mucositis is a clinical term used to describe damage to mucous membranes after cancer
chemotherapy. It is often used synonymously with oral stomatitis, but is not confined to the
oral mucosa (l). It rather occurs throughout the gastrointestinal tract, and to a lesser extent in
other mucosal surfaces. It is common after cancer chemotherapy, with severþ and duration
varying with the dose and the chemotherapeutic drugs used. The mechanism and exact
anatomical distribution have not been clearly defined, although increasing work is being done

2
in this area. The importance of mucositis is that it limits the dose of chemotherapy. Once the
exact mechanism of gastrointestinal mucositis has been defined, it should be possible to prevent
mucositis without reducing the efficacy of chemotherapy, and to increase the dose of
chemotherapeutic drugs in order to increase cure rates'
1.2 Definition
Mucositis refers to mucosal damage after cancer chemotherapy. The term is usually used
interchangeably with oral stomatitis, but strictly applies to the entire gastrointestinal and
genitourinary tracts. It is herein used to describe the damage to the small intestinal mucosa
caused by chemotherapy for cancer. This thesis concentrates on small intestinal mucositis.
1.3 Hypothesis
The hypothesis of this thesis is that chemotherapy for cancer causes a dose-dependent,
transient abnormality in the small intestinal mucosa, which is clinically manifest by abdominal
pain, bloating and diarrhoea, by abnormal intestinal function and by morphological changes.
J
1.4 Aims
l. To assess the prevalence, severity and duration of gastrointestinal symptoms and nutritional
changes in patients receiving cancer chemotherapy
2. To measure functional changes in the small intestine using intestinal permeability and
associated changes in serum endotoxin.
3. During these studies, to assess bacterial overgrowth using a combined lactulose breath
hydrogen, and rac-D-xylose breath test.
4. To measure morphological changes of mucositis in the small intestine by histomorphometry
(villus area, crypt length, mitotic count), apoptotic cell count per crypt (TUNEL method),
by enterocyte cell height, by brush border enterocyte height, and by integrþ of enterocyte
tight gap junctions.
5. To correlate gastrointestinal symptoms with functional changes, (including nutritional
changes), morphological changes, dose and type of chemotherapy used, and diagnosis'
6. To assess the efücacy of oral glutamine in reducing small intestinal mucositis in the dark
agouti rat mammary adenocarcinoma model.

4
1.5 Research Plan
The study is divided into four main stages,
l. The first study (Chapter 3) investigates the eflect of high dose chemotherapy and
autologous blood stem cell transplant on intestinal sugar permeability'
Z. The second study (Chapter 4) investigates the symptoms, nutritional changes, and
functional changes in the small intestine after chemotherapy of varying doses.
The third study (Chapter 5) investigates the effects of chemotherapy on the histology of the3
mucosa of the small intestine
4. The fourth study (Chapter 6) investigates the effect of glutamine on tumour growth and
proliferation, and on methotrexate-induced small intestinal mucositis in the dark agouti rat
mammary adenocarcinoma model.

5
CHAPTER TWO
A REVIEW OF THE LITERATURE CONCERNING CHEMOTHERAPY'
MUCOSITIS AND THE SMALL INTESTINE
..The small intestinal mucosa consists of a single layer of polarised cells. This sheet of cells is
rnoulded during embryogenesis into a complex-shaped series of villi and crypts, forming a
folding of the mucosa that causes further polarisation, since the villi are the differentiated
functional aspect of the tissue from which cells senesce, die and are shed into the lumen' At the
opposite pole, this cell loss is precisely balanced by cell replacement in the crypts. As a
consequence, there is a constant movement of cells from the crypt to the villus. This cell
migration can be studied..." Potten (2).
2.L Principles of the action of chemotherapy on tumours
The term .chemotherapy' was coined by Paul Ehrlich, in the 1890's, in referring to the use of a
drug for a selective action, the so-called 'magic bullet'. Chemotherapy for use in the treatment
of cancer was introduced in the 1940's and 50's (3). The major problem with chemotherapy is
the unwanted toxicity to normal tissues, as chemotherapeutic agents are unable to distinguish
between normal and malignant cells. However, tumour cells are more vulnerable to the
cytotoxic action of drugs than normal cells, and when drugs are used in combination, and at
regular intervals, some cancefs can be cured, and even more are palliated' The aim of cancer
chemotherapy is to reduce the tumour cell population to zero. The 'fractional cell kill'
hypothesis has been shown to be true for haematological malignancies, and has been assumed
to apply to solid tumours. This hypothesis states ïhat a particular concentration of drug for a
particular time will kill a fixed proportion of tumour cells, which is independent of the absolute
number of cells. With each successive cycle of chemotherapy, a fixed fraction of the remaining

6
cells is eliminated. So the efficacy of the treatment depends on the dose of drug, the number of
cycles, and the frequency of those cycles. Six cycles of treatment will reduce a tumour size of
l0l1cells to less than one cell,if 99Yo of cells are killed per cycle. The timing of cycles depends
o¡ the ability of normal tissues, such as bone marrow and gastrointestinal tract, to recover, and
this usually takes 3 or 4 weeks.
Most chemotherapeutic agents act only on dividing cells, and are therefore more effective in
tumours with rapidly dividing cells. Others are cell-cycle specific and act only on cells in a
particular phase of the cell cycle, while a few drugs act on non-dividing cells. A large reduction
in tumour size by surgery, radiotherapy or chemotherapy, may increase cell division and
theret-ore increase the growth of the tumour and also its response to chemotherapy, so-called
.Gompertzian growth'. Combination chemotherapy is used in most tumours because it reduces
the effect of drug resistance, and may allow reduced toxicity without sacrificing efficacy.
2.2 Ovewiew of side effects of chemotherapy
As stated above, the major problem with cancer chemotherapy is the unwanted side effects on
normal tissues. Traditionalþ the bone marrow has limited the dose of chemotherapy due to
toxicity, but this has been improved with the introduction of colony stimulating factors. The
conìmon bone marrow side effects are anaemia, thrombocytopaenia and neutropaenia, with
recovery being required before further doses of chemotherapy can be given. G-CSF, GM-CSF
and pDGF can ameliorate all of these toxicities, and since their development the doses of
chemotherapeutic drugs have increased, leading to toxicity of other organ systems, particularþ
the gastrointestinal tract, the genitourinary system, the nervous system and the heart. The
gastrointestinal crypt epithelium is particularly vulnerable to chemotherapeutic toxicity, with

7
symptoms including nausea and vomiting (although these are also centrally mediated),
abdominal pain, distension and diarrhoea. There is currently no successful prevention nor any
cure. Treatment is limited to palliation of symptoms using oral mouth washes, antifungal
agents, analgesics and resting of the bowel (4).
2.3 Mucositis
Mucositis is defined as inflammation of a mucous membrane. A dictionary sub-entry is for
mucositis necroticans agranulocytica, which is defined as necrotic inflammation of mucous
membranes associated with agranulocytosis. However, there is no evidence of inflammation
(65). The term 'mucositis' has, through usage, come to mean the damage to the oral mucosa
caused by cytotoxic chemotherapy (5), which would be more correctly called oral mucositis or
stomatitis. The remainder of the gastrointestinal (GI) tract may also be involved, but it is more
inaccessible and consequently has often been overlooked. Certain symptoms such as abdominal
pain, bloating and diarrhoea suggest gastrointestinal involvement. The prevalence of
gastrointestinal mucositis is thought to be about the same as oral mucositis, which occurs in
about 20-25 yo of patients after chemotherapy. In this work, mucositis is acknowledged to
occur in the whole of the gastrointestinal and genitourinary tracts, but interest focuses the
small intestine rather than the mouth.
While oral mucositis is discussed and acknowledged in textbooks of Oncology (1), the rest of
the gastrointestinal tract receives little coverage, instead having to make do with a passing
reference under particular drug regimens. Nowhere is the mechanism and course of
gastrointestinal toxicity described in full, because up until now other more important toxicities
have curtailed treatment long before gastrointestinal toxicity became limiting. More than half
8
the papers on mucositis (oral) have been published since 1990 (4), with most of the remainder
being published after 19g0, although the number of publications in general is increasing rapidly.
Small intestinal mucositis causes morbidity, and occasional mortality (6)'
When gastrointestinal toxicity has been reported in the Literature (7;8), toxicities are listed as
diarrhoea, nausea and vomiting, and stomatitis. No reference is made to abdominal pain nor
bloating which are the indicators of small or large bowel involvement, and can be quite sinister.
The drugs most often implicated in causing mucositis are methotrexate, 5-fluorouracil'
actinomycin-D, adriamycin, bleomycin and vinblastine (6), however most cytotoxic drugs do
have some effect on the small intestine (9).
2.4 Gastrointestinal side effects of chemotherapy
Chemotherapy has both direct and indirect effects on the gut (10). The direct effects are due to
the actual injury, and depend on the drug and dose given. Diarrhoea is reported to be the
primary gut symptom. The indirect effects result from the lack of enteral intake, and
attenuation in secretion of gastrointestinal hormones secondary to the bowel injury. D-xylose
absorption is reduced within 7 days of methotrexate administration in children with acute
lymphoblastic leukaemia (ll;12). Using a cellobiose/mannitol permeability test, Daniele (13)
showed a correlation between change in permeability ratio and number of days with diarrhoea
following 5-fluorouracil and folinic acid in sixteen patients with advanced colon cancer,
implying a small intestinal origin to the diarrhoea.
The effects of chemotherapy are probably prolonged by the lack of oral intake. Anorexia, pain,
mucositis, diarrhoea and the use of intravenous fluids all compromise the exposure of the
gastrointestinal mucosa to food. But even if patients do eat, damage to the enteroendocrine
9
cell population may interfere with secretion of gastrointestinal hormonal growth factors. Small,
frequent meals will provide the best trophic effect on the bowel, and as symptoms reduce,
appetite and oral intake increase, and any weight lost is usually regained between cycles of
chemotherapy.
In a comprehe¡sive review of gastrointestinal injury due to drugs, Lewis (14) includes
chemotherapy as a cause of injury through-out, but there is little information on any specific
area. He reports that much of the nausea and vomiting due to chemotherapy arises from
stimulation of the chemoreceptor triggeÍ zoîe (CRTZ), rather than through direct bowel
toxicity. This is true, but it is the combination of symptoms associated with bloating and
diarrhoea which points to the small bowel, and tends to happen later than the CRTZ-induced
problems.
2.5 Small intestinal morphology and function
The mucosa of the gastrointestinal tract has two main functions (15;16): firstly, the digestion
and absorption of dietary nutrients, and secondly, defence against noxious dietary substances
and bacteria. The intestinal surface area is 200-300 r* and is the interface between the external
and the internal environment. The digestive function acts at two levels. Firstly, luminal
digestive enzymes (secreted by the pancreas) reduce starch and protein to oligomeric forms,
which can then be hydrolysed by brush border enzymes. Secondly, basolateral enterocyte
membrane pumps control salt and water balance and absorption.

10
The small intestine is protected by defences that comprise physical barrier mechanisms and
immunological responses. Mucus with an alkaline pH acts as a physical barrier; saliva buflers
and lubricates luminal contents. Tight intercellular junctions maintain an impermeable barrier to
bactena and large molecules, while the rapid mucosal turnover quickens adaptive responses
a'd prevents bacterial translocation. These factors comprise the mucosal barrier that modulates
the passage of molecules from the lumen to the lamina propria and also from the lamina
propria to the lumen. The immunological defences consist of non-selective cells such as
granulocytes, macrophages and Paneth cells which phagocytose and recycle medium-sized
intracellular particles. More selective activity is provided by the expression and secretion of
IgA and IgM immunoglobulin in Peyer's patches or in T cell populations in intramucosal
epithelium (MALT),
Crypts are the proliferative units of the small intestine, and villi are the functional units. The
crypts are small flask-shaped structures, with 6-10 crypts supporting eachvillus (Figure 2.1).
The crypt to villus ratio is 7:I inthe duodenum and 4:I inthe ileum. The epithelial monolayer
comprises four cell types: columnar enterocytes, mucus-secreting goblet cells, the Paneth cells
at the base, and the rare enteroendocrine cells. The cells of the mucosal epithelium derive from
stem cells which reside near the bases of the crypts (level 4). There are between 4 and 16 stem
cells at the base of each crypt in the small intestine (17), but there are probably a further 30-40
potential stem cells (clonogenic cells) which could take over stem cell functions in a crisis.
Estimates of stem cell numbers vary from 3 to 80, but that given by Potten is most reasonable
(1g). potten (17) defines stem cells as a particular population of undifferentiated cells, which is
able to proliferate, self-maintain, produce large numbers of differentiated, functional progeny,
regenerate the tissue after injury, and be flexible. The true stem cell has not
11
been isolated, but the available evidence favours its existence (19). Gap junction
communication is most effective in the stem cell zone, reducing higher up the crypt. It is
thought that the stem cells produce all four crypt cell types, with the Paneth cells migrating
downwards, and the others migrating upwards. Paneth cells live for approximateþ 25 days,
and differentiate when they reach the inner part of the crypt (20), the other three cell types
divide in 24-96 hours. It is possible that induction of development of the various cell
phenotypes may be due to the influence of various cytokines and growth factors as well as
contact with the extracellular matrix.
Stem cells dMde without maturation, every 72 to 32 hours. The daughter cells of the stem
cells migrate up the crypt and onto the villus, moving at about 0.75 cell positions per hour,
with differentiated cells confined to the top third of the villus. Cells approaching functional
competence mature but do not divide. These cells are able to digest and absorb nutrients. They
produce enzymes and acquire the apical microvillar brush border membrane. Transit cells are
intermediate, and both dMde and mature. The more severe the injury to the small intestinal
mucosa, the more differentiated transit cells can be triggered to renew stem cells and
regenerate a crypt. Crypts probably start off oligoclonal, but become monoclonal following
injury (21), as the remaining stem cell divides. If the number of stem cells exceeds that allowed
for a crypt, the crypt may undergo stochastic fission and produce a new gland (15).

l2
Mouse 2 x10⁸ cells shed/small intestinelday
Man - 1011 cells shed/small intestine/day
1,400 cells/villus/day
Villus3,500 cells
CRYPT250 cells
.;;i¿ii,:,.
G
6-10 crypts/villus
NS
i¡*tui::
cells/
15
crypt
i'N
1 50 proliferative cellsTc = 12h
10
5<16 stem cellsTc =24h
-32 clonogeniccells
Diagrammatic representation of the three-dimensional gross architecture, histolggicalcellbrganisation and cell kinetic hierarchy of the mouse ileum. Redrawn withpermission from Potten (Development I 1 0, 100 1- I 020 I99O).In longitudinaliections, the crypt cells can be identified by their position (I-20).P = Paneth cells. Tc = cell cycle duration. G = goblet cell.
The capillary network in the villus is shown on the right.
P
è
--
Figure 2.1
13
There are many growth regulatory molecules, acting both locally and systemically' The
transforming growth factors, TGF-cr, TGF-P, and the insulin-like growth factors, IGF-I and
IGF-II, are all thought to be importafi (22;23). TGF-cr and TGF-B are produced by epithelial
cells that express corresponding receptors on their surfaces, allowing for autocrine or paracrine
regulation of cell proliferation. TGF-a is produced at the villus tip, leading to an increase in
differentiated villus cells. TGF-p conversely inhibits growth. Its location however has not been
so precisely defined, with both crypt and villus being possibilities. TGF-p stimulates the
production of basement membrane constituents such as collagen, laminin and fibronectin'
Endogenous TGF-B may play a role in promoting repair after epithelial injury. Despite its
known inhibitory effects on proliferation, TGF-P has been shown to stimulate IEC-6 cell
migration to reconstitute the integrity of model wounded monolayers (21), and could be
important in repair a.fter any damage. IGF-I is synthesised in the small intestine under growth
hormone control, leading to proliferation of the small intestine (2\.IGF-I and II receptors are
found in crypt cells and on villous enterocytes (25;26). TGF-cr shares a common receptor with
epidermal growth factor (EGF), but TGF-cr, is probably the more important ligand (23).
However, the presence of food in the small intestine is actually the most important factor in
maintaining the small bowel mucosa. Cessation of oral intake leads to hypoplasia. The full
story still requires much investigation. Trefoil factors could also play a role in controlling
epithelial cell turnover. They are increased in sites adjacent to mucosal ulceration and are
thought to be produced by Goblet cells. Booth and Potten (27) developed an in vitro culture
model using tissue obtained from the developing rat small intestine. Using this model, epithelial
I4
gfowth and interaction with stromal cells can be studied. No single growth factor had
overriding importance, as there were contributions from several. Insulin' IGF-I, EGF, TGF-cr
and pDGF were stimulating. TGF-p inhibited cell proliferation. Transferrin and glucose also
stimulated the epithelium and stroma'
proliferation in the small intestine is variable, and it is uncertain whether it is controlled more
by cell loss (pull phenomenon) or by cell development in the crypt (push phenomenon)' High
proliferation and the high loss rate of terminally differentiated villous cells by apoptosis may
protect the small intestine from malignancy. If there is a high cell mutagenicity rate, but also a
high expulsion rate, there will be a low tumour tate (21)
2.6 Assessment of the structure and function of the small intestine
2.61 Historical
The small intestine has always been one of the more inaccessible areas of the body. It cannot be
inspected directþ, except at surgery; it does not show up on plain X-rays, and barium
examinations are of low yield. The Crosby capsule allowed biopsy but not direct vision, so that
yield was not particul arly great,and it was not possible to tell exactly what was being biopsied'
2.62 Current 'state of the art' assessment
2.62.1Direct
The development of upper gastrointestinal endoscopy has revolutionised our ability to inspect
the small intestine, albeit only to the duodenum and sometimes the upper jejunum' It is now
t5
possible to biopsy the duodenum under direct vision, and this correlates with results of biopsies
from the jejunum.
Intestinal proliferation can be studied by metaphase arrest in vivo, or by uptake of tritiated
thymidine and bromodeoxyr¡ridine in vivo and in vitro (16).In humans, microdissection, flow
cytometry, incubation with tritiated thymidine or bromodeoxyuridine, or incubation with
monoclonal antibodies against antigens expressed on dividing nuclei such as Ki67 or PCNA
(28) can be performed.
2.62.2Indirect assessment of the small intestine
Barrier function is assessed by the ease of access of molecules moving from the lumen into the
circulation. ln health, it depends on the molecular weight and shape of the molecule. Intestinal
cells have the unusual ability to gain access to nutrients both from the lumen and from the
circulation. In the small intestine the lumen contributes up to half of the supply of glutamine
and glucose. Reduced enteral intake leads to reduced proliferation of the small intestinal
mucosa, down-regulation of digestive and absorptive enzymes, and mucosal atrophy (10).
Bacterial microflora stimulates proliferation. Intestinal resection leads to a compensatory
intestinal hypertrophy if the subject is allowed to feed enterally.
There are many indirect methods of measuring intestinal function, but it is not always easy to
distinguish between small and large intestine using these methods. Symptoms such as
abdominal pain, bloating, diarrhoea, constipation, nausea and vomiting do not distinguish
between large and small intestine. Indeed, nausea and vomiting following chemotherapy are
often centrally mediated. Functional measures such as xylose absorption and three-day faecal
fat are either not specific or are cumbersome. Measurement of serum endotoxin is elevated if
bacteria cross a malfunctioning mucosal barrier anywhere along the gastrointestinal tract, but

l6
particularþ in the colon. Small bowel bacterial overgrowth, however, may increase endotoxin
crossing the small bowel mucosa.
2.62.3 Duod en al disaccharidases
The disaccharidases (lactase, sucrase and maltase) are present in the microvilli (brush border)
of enterocytes. Duodenal biopsy specimens can be assayed for disaccharidase activþ' A loss
of disaccharidase activity indicates enterocyte damage and villous atrophy (29) Any loss of
eîzyme activity is usually pemanent, although methotrexate has been shown to cause a
significant but transient reduction in disaccharidase activity in the rat (30)'
2.62.4 Intestinal PermeabilitY
Intestinal permeability measurements have been used for nearþ 30 years to indirectþ assess
small intestinal mucosal function. To study permeabilþ the probe must be non-toxic and
metabolically inert. It must be able to be measured sensitiveþ, accurately and easily. There are
many different combinations of test sugars (31), but usualþ intestinal permeability is measured
(32;33) by a monosaccharide (mannitol and rhamnose) and a disaccharide (lactulose).
However, it does have the disadvantage of a rather sweet taste, which some subjects cannot
tolerate. Other probes are polyethylene glycol (PEG), given orally and quantified in urine by
gas liquid chromatography (34) and ttcr-EDTA (3a). The site of increased ttcr-EDTA
absorption varies with the disease under consideration: Coeliac disease is associated with
increased absorption in the jejunum, Crohn's disease with the ileum, and pan-ulcerative colitis
with the colon (35).

t7
The intestinal sugar permeability test (ISPT) relies on the principle that there are two distinct
pathways of aqueous permeation in the small intestinal mucosa: the high incidence "small-
pore" pathway for water, urea and rhamnose, and the low incidence, large-pore pathway for
larger molecules including lactulose, cellobiose, dextran, and EDTA (36). An ideal probe sugar
is not metabolised, is fully excreted by the kidney, ancl is concentrated therefore in the urine.
This is easily measured and reflects the small amount that is absorbed across the mucosa.
permeation of a test sugar depends on transit time, mucosal surface area and concentration
gradient. Differences of these variables are cancelled by the use of a ratio of two probe sugars'
Urine is collected for only five hours after sugar ingestion, because, after this time, colonic
breakdown of lactulose will occur. The absorption ratio thus determined will be solely affected
by the permeability of the small intestine.
The intestinal sugar permeability test result is expressed as a ratio of lactulose to rhamnose
excreted in the urine following the ingestion of a combination sugar solution. The ratio
increases in the presence of either villous atrophy or increased leakiness of the intracellular
tight junctions. It was initially thought that the lactulose was absorbed via the tight junctions
and that rhamnose was absorbed transcellularþ, and this explains the changes seen in diseases
such as coeliac disease, that is: an increased ratio in villous atrophy and with leaþ tight
junctions, with recovery of both permeability and morphology on treatment (37)' However,
there is controversy over the existence of the transcellular pathway (31;38)'
l8
2.62.5 Breath testing to assess bacterial overgrowth and oro-caecal transit time
Bacterial overgrowth has not previously been investigated in patients undergoing
chemotherapy, and its role, if any, is yet to be defined. It is possible that bacterial overgrowth
could increase absorption of antigens that are usually excluded, and thus set up a prolonged
immune or inflammatory reaction in the small intestine. Assessment of small bowel bacterial
overgrowth is problematic. The gold standard test has been bacterial culture ofjejunal aspirates
(39), which is difficult to do, withthe more recent introduction of bacteriological analysis of
mucosal biopsy specimens (40), which is also invasive. It was hoped that the use of the toC-D-
xylose breath test would obviate the need for invasive procedures, but although specificity is
high, sensitivity is disappointing. There is, however, also a poor sensitivity for jejunal culture
(39). Riordan (40) showed a 9O%o sensitivity and lO}Vo specificity for the analysis of mucosal
biopsy specimens, but these are harder to do because of the need for a sterile procedure.
Using lactulose breath hydrogen to assess oro-caecal transit time is similarly problematic, with
the acknowledged gold standard being a nuclear medicine test, which is invasive. This is
obviously not as practical as the lactulose breath hydrogen, which is non-invasive and relatively
easy to perform. The rate of hydrogen non-production is estimated to be between 30Yo and
6OYo, w\th less hydrogen production in adults. And in malignancy, the problem is further
compounded by the fact that the malignancy itself may cause bacterial overgrowth (41).
2.63 Animal versus human
Most of the research into the small intestine has obviously been in animals (See Table2.l),
because of the relative ease of access to the sight of interest. But animal work cannot be
directly translated to humans, nor can one assess symptoms in animals, thus making correlation
between symptoms, function and histology even more difficult.

19
2.7 Nutrition and malignancY
Malnutrition in cancer is common, but varies in severity from a mild abnormality to the severe
form known as cachexia. Its aetiology remains uncertain (2). Weight loss at diagnosis is a
poor prognostic factor, but the severity does not necessarily correlate with tumour size,
indicating that protein catabolism represents a metabolic adaptation of the host rather than
metabolism witlún the tumour. Malignancy-related malnutrition is multifactorial (43), with
causes including loss of appetite, loss of taste, increased protein turnover, insulin resistance
(44), the direct effects of chemotherapy and the presence of a humoral 'cachectic factor'
(tumour necrosis factor[TNF] aþha) Metabolic changes are most probably mediated mainly
by the cytokines TNF-cr,, interleukins I & 6 (IL-l II--6), and interferon gamma (IFN-y) (a5)'
There is increased whole body protein turnover without a change in resting energy expenditure
in cancer patients with malnutrition, whereas starvation is associated with decreased resting
energy expenditure. protein-calorie malnutrition is the most important form of malnutrition in
cancer patients because it leads to loss of body mass (46). Chemotherapy can cause a
malabsorption syndrome by damaging rapidly dividing cells in the gut'
Cancer cachexia is most common in patients with advanced cancer, and is associated with
anorexia (47). Indeed, it is a very cofnmon cause of death in cancer patients (48)' Treatment of
anorexia is diffïcult, but progestational drugs such as megestrol acetate produce some increase
in appetite and food intake. Corticosteroids also have a temporary effect' If the patient has
nausea as well as anorexia, then gastric emptying agents such as metoclopramide and cisapride
are useful.
An increase in calories may reduce malnutrition but it doesn't treat the primary cause'
Cachexia may progress in spite of adequate protein and calorie intake, without evidence of

20
malnutrition, and even when the tumour seems to be responding to treatment. There is no
definite way of preventing this situation. Le Bricon conducted studies in tumour-bearing and
healthy rats, comparing the effects of four chemotherapeutic agents given in single high dose,
on weight, appetite and nitrogen balance (49). Chemotherapy caused transient weight loss,
anorexia and nitrogen imbalance, but these returned to normal in all but the rats treated with
cisplatin. Drug induced anorexia was worse in the tumour bearing rats, as was the nitrogen
imbalance. Learned food aversions can occur in up to 48Yo of patients who receive drugs that
are toxic to the gastrointestinal system, and the repeated association of gastrointestinal
discomfort to a specific food lasts after chemotherapy is stopped.
Dewys (50) analysed the prognostic effect of weight loss prior to chemotherapy, looking at
more than three thousand people enrolled in 12 ECOG trials. The frequency of weight loss
ranged from 3 lvo to g7yo. Median survival was significantly reduced in the weight loss versus
non-weight loss groups. Chemotherapy response rate was also lower in the weight loss groups,
but only reached significance for breast cancer. Weight loss correlated with reduced ECOG
performance status except for gastric and pancreatic cancer. Within the different performance
status categories, weight loss was still associated with reduced median survival. The frequency
of weight loss was correlated with an increase in number of metastatic sites. Big weight loss
tended to be associated with tumours that present late such as gastric and pancreatic tumours.
Malnutrition can afFect survival by muscle wasting and increased susceptibility to pulmonary
complications, or by reducing immune reactivity and therefore increasing risk of infections.
2T
2.S Immunology of the gastrointestinal tract and nutrition
The immunological functions of the gut are to produce secretory IgA and to provide local
cellular immunity, while down-regulating the systemic reaction to antigens presented through
the gut (oral tolerance) (51). Lymphoid tissue is intrinsic to the gut mucosa, and neither food
nor intestinal bacterial flora is required for the acquisition of this lymphoid tissue' Indeed' the
gut is the largest lymphoid organ in the body. Intestinal bacterial flora is more important than
diet in expanding the size of the gut associated lymphoid population, although the exact
relationship between mode of feeding, nutritional state and immunological function is not well
defined. Long-term elemental diets predispose to the development of gut hypersensitMty: the
high absorptive efficiency of these diets reduces caecal microflora, alters gastric acid secretion
and alters small bowel motility, all of which may contribute to changing the composition of the
gut flora. So alterations in luminal nutrition, increased tissue damage and increased mucosal T-
cell function are all interrelated.
2.9 Response of the small intestine to injury
There is only a limited number of ways in which the small intestinal mucosa responds to injury.
Small intestinal failure results in failure of digestion. cell death results in compensatory
alterations in stem cell activity with increases in frequency of cell division, first to repopulate
the stem cell numbers, and second to increase daughter cell production to repopulate the
crypt/villus. If a critical number of stem cells is lost, villous atrophy will occur as the remaining
ones afe unable to repopulate. Members of the EGF family, trefoil peptides and
enteroglucagon are all involved in both normal call renewal and in repair after cell damage
(s2).

22
2.10 Apoptosis v¿rsøs necrosis
There are two major mechanisms of cell death, namely: necrosis and apoptosis. Necrosis
occurs in response to injury, and is characterised by swelling of internal and plasma membranes
leading to rupture and disintegration of organised structures. There is associated inflammation.
It results from injury by agents such as toúns and ischaemia, and affects groups of cells rather
tha' individual cells (53). Apoptosis (known as programmed cell death, or cell suicide) is not
associated with inflammation. It is an active process, where there is rapid condensation of the
nucleus and cytoplasm, with preservation of the organelles, followed by nuclear and surface
budding to produce apoptotic bodies, which are phagocytosed intact and digested by
surrounding cells. It occurs in normal animals, and can be induced by certain pathological
stimuli. It is more a case of active self-destruction than degeneration, and RNA and protein
synthesis are required for it to occur. It was originaþ called shrinkage necrosis, but the term
apoptosis was coined in the early 1970's by Wyllie's group (53), and it has been described as
having a role that is the opposite of mitosis in tissue homeostasis. Allan (54) showed
hyperthermia lead to cell death solely by apoptosis.
Apoptosis is used both to remove healthy but unwanted cells, and to remove damaged cells. It
is therefore vital for tissue homeostasis. Development of malignancy may occur because of
failure of homeostatic mechanisms of apoptosis. Damaged or mutated cells are normally
removed by apoptosis. If this process fails then carcinogenesis may result (55)- In the normal
small intestine, the focus has traditionally been on the proliferative end of the crypt/villus unit.
But control of cell death may actually be even more important than proliferation as a regulator
of cell number, and as a preventer of malignant transformation. Potten(56) describes apoptotic
cells occurring predominantly in the lower (stem cell) regions of the crypts, at the rate of about
1 apoptotic cell every five histological longitudinal crypt sections. This is about 10olo of stem

23
cells. Following irradiation, there is an initial hypoplasia, followed by a rebound hyperplasia,
and finally a decreased proliferation to reach steady state again. This second decrease
apparently coincides with an increase in apoptosis at the stem cell level (55).
Hall (57) argues that the long-held belief that cell loss in the gastrointestinal tract occurs by
shedding of cells from the tips of the villi into the gut lumen is not actually true, and that
apoptosis along the villi (particularly towards the tip) is the major mechanism. This is,
however, still controversial, as most authors have failed to find significant apoptosis towards
the villus tip.
Tumours are known to undergo both apoptosis and necrosis. F{owever, apoptosis is probably
the predominant method by which tumour cells die, even without chemotherapy or
radiotherapy (58). Cytotoxic chemotherapy generally causes apoptosis, but necrosis does
occur at higher doses (5a). Cells at different levels in the hierarchy of differentiation show
varying sensitivity to the different agents (59). Radiotherapy causes an initially dose-dependent
increase in apoptosis in the small intestinal crypt cells at 3 to 6 hours after exposure, acting
mainly at the stem cell level. Apoptosis and necrosis can be difficult to distinguish
histologically, because features such as condensation and fragmentation are shared (53). It is
now possible to better identify apoptosis histochemically. Using the method of Gavrieli (60),
TdT-mediated dUTP-biotin nick end labelling (TUNEL), it is now possible to measure
apoptosis on formalin-fixed, paraffin-embedded tissue sections.
24
2.LL Comparison with coeliac disease
Moss (61) found apoptosis increased along the flattened surface of villi in untreated coeliac
disease, and correlated with proliferation. After 3-6 months on a gluten-free diet, there was a
reduction in apoptosis, and this almost normalised by 12 months, even though the architecture
was slower to recover. Apoptosis increased to a similar degree in both sub-total and total
villous atrophy, and many patients didn't return completely to normal on a gluten-free diet.
Two-thirds of the apoptotic cells were found near the villus tip, 20Yo near the crypt base and
the rest scattered in between, which gives some support to Hall's suggestion (57) that
apoptosis rather than shedding is more important for cell loss into the lumen. Apoptosis was
also found in the adjacent lamina propria, possibly of the intraepithelial lymphocytes. The
increased epithelial apoptosis in coeliac disease may explain the paradox, that although coeliac
disease is a disease of hyperproliferation, the mucosa is flat. It is the balance between
proliferation and cell loss that is critical for mucosal structure, and cell loss is made up of
apoptosis, necrosis and shedding in as yet uncertain proportions.
When the gut is exposed to radiation or chemotherapy, apoptosis increases at the crypt base.
This suggests that apoptosis in the crypt prevents mutated cells from dividing. Apoptosis in the
small intestine is very close to the stem cell level, whereas in the colon it is several positions
away from the stem cell. This is thought to contribute to the fact that there is a low incidence
of primary tumours in the small intestine, but a high incidence in the colon (55). Mutated stem
cells in the small intestine do not survive to propagate and develop into neoplasia.
25
2.12 Bacterial translocation
One function of the small and large intestinal mucosa is to act as a barrier to the entry of
pathogenic and commensal bacteria. The breakdown of this barrier function leads to bacterial
translocation, the systemic spread of bacteria from the gut to systemic organs. Bacterial
translocation is a significant cause of sepsis in critically ill patients (62). Both intact bacteria
and endotoxin cause systemic infection and multi-organ failure, although there is some animal
evidence that endotoún has an anti-tumour effect which more than outweighs its negative
effects (ó3) The causes of bacterial translocation are bacterial overgrowth,
immunosuppression and loss of physical barrier (62). The route of translocation is not
necessarily between the cells, and even for quite large organisms can be transcellular. Simple
malnutrition alone is not sufücient to cause bacterial translocation, but parenteral nutrition and
elemental diets can cause it, perhaps by inducing immunosuppression. Translocation is reduced
by feeding complete enteral diets, glutamine, bombesin and by prevention of intestinal
ischaemia. Chemotherapy is known to cause barrier breakdown, and therefore may increase
bacterial translocation.
Berg (64) found that cyclophosphamide and prednisolone increased translocation more than
did methotrexate, 5-fluorouracil and cytosine arabinoside, which is interesting because the
latter drugs cause more physical damage to the mucosal barrier. This suggests that
cyclophosphamide and prednisolone might act via immunosuppression.
26
2.13 Stem cells and regeneration ofintestinal crypts after cytotoxic exposure
After exposure to cytotoxic drugs, the crypt decreases in size and proliferation (55)' Minimum
proliferation and crypt size values are seen from l0 to 14 hours after exposure' This cellular
depletion is due to continued emigration of cells onto the villus in the presence of acute cell
death and in the absence or reduction of mitosis. Thereafter there is a compensatory increase in
cell cycle activity, labelling and mitosis, driven by the stem cells which starts from about 15
hours. Several authors have published work on the effects of chemotherapy on the structure
and function of the small intestinal mucosa. These are summarised in tables 2.1 (structure) and
2.2 (tunction).
2.llBflectof irradiation on the small intestine
Because of the difEculty in knowing the precise time at which a chemotherapeutic drug is
present at a cytotoxic concentration at the intracellular targets, it is much easier to study the
effects of single doses of irradiation, although they may not be exactly the same (59)' Radiation
leads to apoptotic cell death. Following the death of even one stem cell in a crypt, the other
stem cells detect this, probably by recognition ofa factor released during apoptotic death, and
respond by reducing their own cycle time to 9 to l0 hours. This transiently increases their selÊ
renewal probability in order to ensure enough stem cells are produced to repopulate the crypts
(thus also tending towards monoclonality). SelÊrenewal is only increased transiently or there
will be an unwanted reduction in differentiated cells. After five to six days there may be an
overshoot in the number of stem cells and more so in the number of total cells. Radiation can
also cause some cells to die through pfemature ageing rather than apoptosis'

27
Author Drugs Subject Results
Trier (65;66)
Taminiau (67)
Ecknauer (68)
Perkkio (69)
MTX
MTX
cyclophosphamide
ALL maintenance
human rat
rat
human
hypoproliferation then
hyperproliferation
Pradja (70)
Moore (71)
Shaw (72)
Gwavara (73)
Smith (74)
alþlating agents
vanous
vanous
MTX
combinations
rat
mouse
human
human
human
crypt lvillus damage
Ramadan (75)
Bessler (76)
IjiriÆotten (77'
7e)
MTX
oral agents
varlous
mouse
mouse
mouse
mitochondrial changes,
conflicting
Ijiri / Potten (77'
7e)
vanous mouse mitotic fall and apoPtotic rise,
variable order
Cunningham
(80)
CMF human crypt vacuolation
Sartori (81) platinum/etoposide human reduced brush border height
Table 2.1 Summary of publications concerning small intestinal morphology following
chemotherapy. MTX: methotrexate. CMF : cyclophosphamide, methotrexate, 5-fluorouracil'
ALL : acute lymphoblastic leukaemia.
28
2.15 Structure of the small intestinal mucosa following chemotherapy
Trier
In 1961, Trier presented his observations of the mucosa of the human small intestine by light
and electron microseopy, following the administration of 2-5mglkg methotrexate (65;66)
Biopsies were taken before treatment and then at l-3 hours, 3-48 hours, 48-96 hours and >4
days after treatment itt 14 patients (total +8 biopsies). By light microscopy the villi were
normal at all intervals. However the crypt epithelial cells showed a marked reduction in mitoses
from 3 to 48 hours after methotrexate, increasing again to baseline or to slightly elevated levels
by 48 to 96 hours (Figure 2.2). There was also a simultaneous appearance of discrete spherical
bodies, suggestive of apoptotic bodies, within the crypt cell cytoplasm, containing nuclear
DNA. These disappeared as the mitotic count returned to normal. The abnormality did not
reach the villi at any stage. The mitotic count per crypt fell from 0.82 pretreatment to 0.02 at
six to forty-eight hours after the drug. At beyond 96 hours, the mean mitotic count had
returned to 0.87. In four patients, who had five or more biopsies, at least one of the recovery
phase biopsies showed an increased mitotic count compared to baseline. Villus shortening did
not occur and there was no individual epithelial cell enlargement, impþing there was little cell
destruction, with many epithelial cells outJiving their normal life-span. It is thought that the
surviving cells lived longer in order to allow time for new cells to be generated.
Gastrointestinal symptoms were mild: transient nausea, diarrhoea and vomiting only twice.
Thus the human small intestine survives despite no cell replacement for at least 48 hours, with
stem cells replenishing their own numbers before repopulating the crypts. In contrast, latge
changes were shown on electron microscopy, with patchy areas of cytoplasmic vacuolation in
crypt and villus epithelium, swelling and fragmentation of the microvilli, and clumping of
material within the nucleus. These had returned to normal at day 4. The damage was very

29
patchy, with normal cells next to severely damaged ones, indicating a marked variability in
sensitivity of the cells to methotrexate.
Smith
Smith (74) studied malabsorption, and its relation to changes on jejunal biopsy in nine patients
receiving chemotherapy. Absorption was measured using folate, 812, cârotene, calcium,
prothrombin time, Schilling's test, three-day faecal fat and five-hour d-xylose absorption test.
Five patients had serial biopsies under fluoroscopic control. The patients were investigated
prior to treatment, 2 to 5 days into the treatment, and in the recovery phase. There were no
definite abnormalities in the absorptive studies after chemotherapy. Mitotic counts in the
crypts, however, fell from 0.25 before treatment to 0.05 during therapy (p<0.01) and rose to
0.24 in the recovery biopsy These were lower mitotic counts with a smaller fall than Trier
found. No change was seen in epithelial surface lengfh at any time. A single patient receiving
oral cyclophosphamide for 2 out of 4 weeks had no changes on biopsy. Cyclophosphamide has
been shown to cause small intestinal crypt damage (77;78), as well as to have an additive
immunosuppressive action. No correlation existed between degree of myelosuppression and
degree of mitotic suppression in the crypts, which highlights the fact that mucositis is not
associated necessarily with neutropaenia. This work confirms that of Trier, and substantiates
the apparent rapid reversibilþ of the chemotherapeutic eflect on small intestinal morphology.
Chemotherapy
30
Time (hours)
72 96Baseline
483 15 24
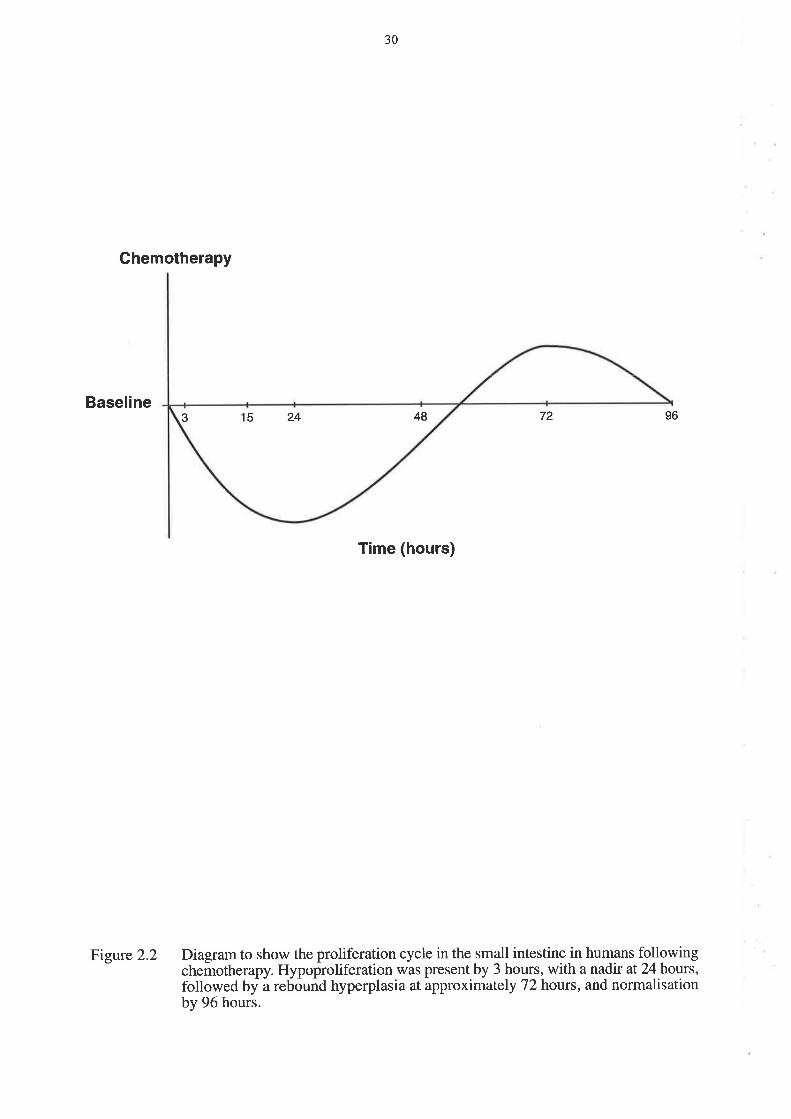
Figure 2.2 Diagram to show the proliferation cycle in the small intestine in humans followingchemotherapy. Hypoproliferation was present by 3 hours, with a nadir at 24 hours,followed by a rebound hyperplasia at approximately 72 hours, and normalisationby 96 hours.

31
Mitchell
Mitchell (6) reports that epithelial changes persist during chemotherapy, but resolve within two
weeks of stopping, slightly longer than other work would suggest. The sequence of events is:
l). Initial injury during the first three days, 2). progressive injury over the next seven days, and
3). regeneration and repair starting a few days after the therapy is stopped. This is in contrast
to the work by Trier (65;66) and especially Potten (77;78) which show evidence of injury
occurring in the flrst24 hours.
2.16 Histology of the small intestine following chemotherapy
Ijiri and Potten
Much of the major work on the effect of chemotherapy on the small intestine has been done in
animals by Ijiri and Potten (9;59). They studied the effects of different drugs on intestinal
crypts and the cell hierarchy in mice. Not all chemotherapeutic agents act on the stem cells
(level 4 of the crypt cell hierarchy), so that the picture is more complex than the simple idea of
destruction at the stem cell level followed by regeneration from there with increased cell
division and selÊregeneration. Irradiation, bleomycin and adriamycin act at positions 4-6, ie the
stem cells. Actinomycin D and cyclophosphamide act at positions 6-8, and mechlorethamine,
vincristine,5-fluorouracil, hydroxyurea and methotrexate act at positions 8-11 in the crypt
(Figure 2.1). Antibiotics and radiation injure cells at the lower end of the crypt, antimetabolites
and alþlating agents injure higher cell positions. Apoptosis and mitosis in the crypts were
scored over time after chemotherapy, and largely mirrored each other, with an initial drop in
mitosis coinciding with or just preceding the rise in apoptosis after most cytotoxic drugs. A
minority showed mitosis decreased after apoptosis increased, and vincristine caused metaphase

32
arrest so that all cells died in mitosis rather than by apoptosis. This general pattem is followed
by a decrease in apoptosis and rise in mitosis, as recovery begins. It is further postulated that
diurnal variations in cell susceptibility to chemotherapy may be important. It may be that some
of the drugs that affect cells higher up the crypts damage the stem cells if given at a different
time of day, when for example more of the stem cells are in S-phase. However, the results of
altering the time of administration are not yet known. 0300 is the best time for irradiation (82).
potten also reports (2) that stem cells respond to damage by an immediate reduction in cell
cycle duration and increase in self-renewal probabihty. If the stem cell numbers are still low
after this division, they continue with the rapid cell cycles, but the self-renewal probability has
to reduce a little, or not enough dillbrentiated cells would develop.
There may be a related differential in potential for killing tumour stem cells. Drugs that kill
cells in the upper crypt might have good palliative effects but not be curative, whereas drugs
that affect the crypt stem cells may be able to cure cancers. However, the drugs may not affect
tumour cell hierarchies in the same way as crypt cell hierarchies.
Al-Dewachi
Al-Dewachi (83) showed that hyperproliferation starts in the stem cell region of the crypt, then
extends into the mid- and upper crypts. It is associated with a reduction in cell cycle time,
particularþ in the Gr and S-phases.
-t -)
Perkkio
perkkio (69) biopsied the jejunum in nine children at the end of their 3 year maintenance
treatment for acute lymphoblastic leukaemia. The biopsies were taken several days after the
last chemotherapy dose, and were compared to normal controls. He measured disaccharidase
activity i1 the specimens as well as morphometry and intra-epithelial lymphocytes. Villus
height, crypt depth and mitotic activity were increased. These findings are consistent with
those of Trier (84), with biopsies being taken in the rebound hyperplastic phase. There is a
suggestion that the suppression of the intestinal mucosa may last for longer after prolonged
cytostatic chemotherapy. Disaccharidases were reduced in three of nine patients. Intraepithelial
lymphocyte numbers were reduced, as were IgA cells. A few patients also had reduced serum
IgA and IgM. It is suggested that the defect in the mucosal barrier may allow more intestinal
micro-organisms to penetrate into the blood stream.
Cunningham
Cunningham (8O)studied six patients receiving CMF chemotherapy for breast cancer,
performing biopsies via Crosby capsule before and 48 hours after chemotherapy. There was no
change in brush border disaccharidases a.fter chemotherapy. Pre-treatment biopsies were
normal, even though all patients had received previous cycles of chemotherapy, (day 1 and day
8, every 28 days), thus impþing normalisation within 2l days. Post-treatment biopsies showed
a normal villus pattern, but there were focal changes in the crypts, and occasionally on the
lowest parts of the villi. There were occasional vacuolated cells. Under electron microscopy
the cells were seen to contain large secondary lysosomes containing cell debris. The vacuoles
were membranelimited and contained variable amounts of partially degraded cellular debris
suspended in electron lucent background material, again suggestive of apoptotic bodies. No

34
significant abnormalities Ìvere seen in the mature enterocyte population of the post-
chemotherapy villus. Five of the six patients developed vomiting, two also had diarrhoea and
one had oral mucositis, but there was no correlation between the development of diarrhoea and
biopsy changes. There was no significant reduction in absorption of water, sodium nor
chloride. It would be expected that function should be abnormal later than morphology,
because of migration of functionally immature enterocytes onto the villi. These fin<lìngs again
agree with those of Trier.
In the small intestine of the adult, cell proliferation occurs in the crypt region, the cells then
migrating to the villus tip. The cell cycle takes approximately 48 hours and the migration some
5 days. There are theretbre two potential periods of mature enterocyte dysfunction after
chemotherapy, first a direct effect on the non-dividing cells of the villous region, evolving
within hours, and second an effect incurred in the crypt but only evident after villous migration,
ie, delayed for 5 to 7 days. However, no changes were seen in the villus even at days 5 to 7, as
the unaffected cells remain longer in order to compensate, with increased mitoses, thus giving
the appearance of rebound hyperplasia in the villi, without individual cells growinglatger.
Gwavava
Gwavava (73) compared jejunal biopsies in ten children with acute lymphoblastic leukaemia on
methotrexate, with those from ten children being investigated for failure to thrive or diarrhoea.
The time from chemotherapy administration in the methotrexate group varied from 3 to 96
hours. The major abnormalities were between 24 and 72 hours after methotrexate, and
consisted of cellular atrophy in the upper and middle regions of the villi, with marked
enlargement of the lateral basal intercellular spaces. There was also extensive vacuolar
degeneration, and some basement membrane blebbing. There was a relationship between the
35
time since methotrexate and severity of damage, up to 72 hours, and between dose of
methotrexate and severity of damage. In the upper and middle regions of the villi there was
most damage between 24 and 72 hours, and in the lower villi there was less damage at 3 and
96 hours than in the middle of the villi. This contrasts with Trier's work in that the changes are
occurring in the villi rather than the crypts. The timing however is still consistent with the two-
stage hypothesis above.
Sartori
Sartori (gl) studied the effects of cisplatin and etoposide (in ten patients with lung cancer) on
the duodenal brush border before chemotherapy, 8 days after its start, and one month after the
third cycle of treatment. No significant light microscopic changes \ryere seen, but brush border
height was reduced on electron microscopy at eight days after chemotherapy, and there was
villous rarefaction and variable villous heights. Damage caused to the small intestine resolved
one month after chemotherapy, and there was no difference in number of episodes of vomiting
between patients with or without changes to the brush border.
Shaw
Shaw (72) took biopsies before chemotherapy and again 2 days before the expected white
count nadir. He saw no abnormalities prior to chemotherapy, but there was villous blunting in
post treatment biopsies. There was also swelling and dilation of the mitochondria and
endoplasmic reticulum, with shortened microvilli. There were no problems with absorption.

36
Smit
In a paper by Smit (85), seventeen patients with metastatic melanoma were studied while
receiving bleomycin, dacarbazine, vindesine and dactinomycin. All had enteral tube feeding
starting from 5 to 1l days before chemotherapy and lasting at least 3 weeks. Ñne patients
were given normal alimentation and eight were given hyperalimentation. Peroral jejunal
biopsies were taken before treatment and 5 to 9 days after chemotherapy. In six patients on the
normal alimentation, a third biopsy was taken 5 to 6 weeks after treatment' After
chemotherapy, diarrhoea of grade 2 or greater occurred in three out of nine patients on normal
alimentation and one of eight on hyperalimentation. Disaccharidases were reduced more in the
hyperalimentation group, and they also had increased crypt depth in contrast to the normal
alimentation group. Both groups showed reduced villus height and mitotic indices. There was
no correlation between disaccharidases and morphology, and in the six biopsies post treatment,
morphology had returned to normal.
There was no correlation between disaccharidases and diarrhoea, nor between mucosal
morphology and diarrhoea, so the diarrhoea is probably not due to the loss of mucosal tissue,
rather perhaps to an increase in small intestinal fluid and electrolyte secretion by the damaged
intestine. Hyperalimentation increased the loss of maltase, sucrase and palatinase, but not
lactase. This could be due to the lysosomal lactase contribution. Thus hyperalimentation
caused increased migratory activity from the crypt to the villus, and it is postulated that the
immature cells reaching the villus cannot produce the normal amounts of brush border
enzymes. Overall there was not shown to be any benefit from hyperalimentation by the
elemental diet.
37
Taminiau
Taminiau (67) studied jejunal epithelial structure and function after methotrexate
administration in the rat. Thymidine kinase is an enzyme confined to intestinal crypt cells.
Acutely, at 24 and 48 hours, there were reduced mitoses in crypt cells, shortened villi, and
decreased thymidine kinase activity. At 96 hours, with methotrexate no longer detectable in
serurn, there was increased proliferation characterised by increased crypt mitoses, accelerated
migration of enterocytes along the villi, and the presence on the villi of cells with the enzyme
profile of crypt cells (decreased disaccharidase, alkaline phosphatase and sodium/potassium-
ATpase, with increased thymidine kinase). Crypts depth was increased as was villus height.
Villus cell numbers \ryere decreased 1rom24 to 96 hours, and crypt cell numbers from 24 to 48
hours with an increase at 96 hours. Pair fed controls had similar weight losses as nutrient
intake decreased, and regained weight at the same rate, indicating that malnutrition is not an
important cause of the abnormalities. Occasional loose stools were seen on days 2 to 4 post
methotrexate in the treatment group only. All the above studies are consistent with a pattern of
transient suppression of proliferation in the crypt from 3 to somewhere between 10 and 48
hours, depending on the author, followed at 48 hours by the onset of a hyperproliferative
phase. This is earlier than the changes seen in humans by Trier.
Ecknauer
Ecknauer administered cyclophosphamide to rats at a dose of 100 mdkg (68), and then
sacrificed them at various times. ^t
24 hours, there was a reduction in cell number per crypt,
but not in crypt depth. There was a reduction in mitotic index and villus size. At 48 hours, the
morphology had returned to normal with a slight increase in crypt cell count and mitotic index,
but the villi were smaller then controls. At 48 hours, he also found an increase in thymidine

38
kinase, protein and DNA" which had not been present at 24 hours. There was no change in
disaccharidases throughout.
Ramadan
Ramadan (75) found a variable reduction in size and number of mitochondria in the small
intestine of mice following methotrexate, which is in direct contrast to the work by Trier.
2.17 Oral chemotheraPY
Bessler (76) studied three oral chemotherapeutic agents and their effects on the small intestinal
mucosa under electron microscopy. Unfortunately, no direct comparison with intravenous
chemotherapy was made. Methotrexate, cyclophosphamide and S-fluorouracil all increased
mitochondrial size, and amount of rough endoplasmic reticulum, with 5-fluorouracil having the
greatest effect and methotrexate the least. Methotrexate had the smallest effect on
mitochondri al size,but the biggest effect on the small intestinal cell as a whole. In mice injected
with methotrexate, DNA synthesis was suppressed by 90Yo at 3 hours. Cyclophosphamide acts
via induction of immunosuppression or by a direct effect on the cell, and 5-fluorouracil acts via
inhibition of thymidilate synthetase. It is possible that all three drugs affect mitochondrial DNA
synthesis. Fluid retention in the small intestine due to the cytotoxic drugs was suggested as a
mechanism. A single large dose of methotrexate (40 mglÍÔ given to rats induced fluid
retention in the small intestine with subsequent prostaglandin E2 (PGE2) formation. PGEz has
an entero-pooling effect, so that fluid accumulation may cause diarrhoea. In his electron
microscopy work, Trier (66), using intravenous methotrexate, reported swelling and
fragmentation of the internal structure of some of the mitochondria, suggesting that the change
seen by Bessler may not be due to the oral administration of the drug.

39
2.18 Dose of chemotherapy and crypt survival
Moore (71) constructed dose-survival curves for different chemotherapeutic agents in the
mouse, and assessed regeneration of jejunal crypts. He constructed a mathematical model to
calculate the survMng fraction of crypts after a single dose of the agent. He showed that
cyclophosphamide, vincristine, and hydroxyurea do not kill arry crypts, whereas
mechlorethamine and BCNU caused a 3-1og reduction in crypts over the dose ranges used. He
also constructed a table of comparison of doses required to ablate marro\il versus those
required to kill via gut toxicþ. This calculates the gastrointestinal toxicity safety margin when
using marrow ablative chemotherapy, assuming it is applicable to humans. Cyclophosphamide
has a high gastrointestinal safety margin, but mechlorethamine is very gut toxic.
Thus the intestinal changes seen following chemotherapy consist of an initial increase in
apoptosis and reduction in mitosis, leading to crypt hypoplasia. Regeneration follows with
stem cells dividing to repopulate the crypt and then the villi, leading to a hyperplastic phase
before homeostasis is restored. In man this takes four to seven days, but in rodents the cycle is
only four days.
2.19 Bone marro\il transplantation and the small intestine
In 1995, Forbes published two papers on gastrointestinal changes in patients undergoing bone
marïow transplantation (86;87). He showed that screening upper gastrointestinal endoscopy is
safe at 30 days after bone maffow transplantation. Fifty-one percent of the forty-one patients
had an abnormality requiring a change in treatment either before or after transplantation. A
higher number of patients had abnormalities requiring an alteration of therapy at day 30 (31%)
and at day l2O (32%) than pre-transplanr (24Yo). These findings supported those of

40
Williams (88). The majority of the patients was asymptomatic or had only minor symptoms at
the time of the biopsies, and would not normally have had endoscopies' The abnormalities
found included graft versus host disease (GVHD), infection, and erosive or ulcerative disease'
Twenty-two patients also had sigmoid mucosal biopsies before and 30 days after
transplantation (11 allogeneic and I I autologous transplants)' Both groups had a rise in lamina
propria CDl6+ mononuclear cells post transplantation, but the rise was higher in the allogeneic
group. These cells appeared histologicalþ like tissue macrophages, but there was no rise in
total macrophage numbers (CDl++¡. In patients with acute GVHD, the lamina propria
CD4+:CD8+ lymphocyte ratio fell with a decrease in CD4+ lymphocytes. There was also a fall
of intraepithelial lymphocyte (EL) numbers. Thus, lamina propria tissue macrophages were
upregulated after transplantation, which may be related to the development of acute GVHD'
These changes v/ere present 30 days after chemotherapy, and are therefore likely related to
bone marrow transplantation itself. However, GVHD is rare in the autologous setting as bone
mafrow cells are 'self, and so there may be some prolonged effect of chemothetapyl
radiotherapy involved.
In a study by Johansson (89), disruption of barrier function, as measured by stCr-EDTAv
preceded clinical findings in eighteen patients undergoing bone marrow transplantation'
Permeability was significantly increased 2 days after starting chemotherupy, and remained high
l0 days post stem cell infusion, while peak clinical toxicity was delayed until 7 days after stem
cell reinfusion. Gastrointestinal but not oral toxicity was correlated with abnormal ttCr-EDTA
permeability, which confirms the view that the oral mucosa has a poor correlation with
gastrointestinal mucositis. Permeability changes were, however, unable to predict the severity
of the gastrointestinal toxicity. The correlation between translocation of endotoxin and
increased ttCr-EDTA absorption was shown by Ferry (90)'
4l
2.20 Irinotecan: A sPecial case?
Irinotecan (91) is a semi-synthetic derivative of camptothecin, which is derived from an
oriental tree. It is a topoisomerase-I inhibitor, and acts by blocking the rejoining of broken
DNA. One of its major doselimiting effects is diarrhoea, and it is thought to have a different
mechanism from other agents. Following the administration of irinotecan to the mouse (91),
the morphological changes in the ileum included epithelial vacuolation, dilation of blood
vessels, polymorphonuclear leucocyte cell infiltration, and villous shortening. However, there
was also goblet cell hyperplasia and excess sulphomucin in the caecum, probably leading to
hypersecretion of mucin, as well as malabsorption of water and electrolytes presumably due to
epithelial vacuolation and villous shortening. Mucin hypersecretion ïvas postulated by the
authors to be the major cause of irinotecan-induced diarrhoea, in contrast to cisplatin, which in
the same study did not produce goblet cell hyperplasia, although it produced the same mucosal
atrophy. Cisplatin also produced similar changes throughout the bowel whereas irinotecan
affected the ileum more than the jejunum, and both more than the colon. High dose loperamide
controls the diarrhoea induced by irinotecan in most cases. Hypersecretion of mucin, however,
has not previously been thought to cause diarrhoea'

42
2.21 Functional changes in the small intestine following chemotherapy
The literature is summarised inTable 2'2'
Mizuno
Mizuno (g2) studied the effects of mitomycin c (MMC), 5-fluorouracil (5FU) and
cyclophosphamide on the small intestine by treating rats with a single dose of the agent and
then assessing absorption of sulphanilamide and l-tryptophan. Thymidine kinase activity was
also measured. MMC and 5FU significantþ reduced the absorption of both drugs whereas
cyclophosphamide had no eflect. The absorption was decreased in parallel to a reduction in
wet weight of the intestine. with MMC, thymidine kinase activity fell by SoYo at 24 hours and
a further SoYoby 48 hours, returning to normal by 96 hours. 5FU effect was only measured at
48 hours and both alkaline phosphatase and thymidine kinase were depressed' Again'
cyclophosphamide had no effect. In parallel to the reduction in wet weight with MMc and
5FU, there was also a reduction in total phospholipid and more so in free cholesterol'
Interestingly the use of a prodrug for MMc with the same antitumour activity did not produce
the same reduction in absorption of sulphanilamide nor salicylic acid'
The lack of effect of cyclophosphamide is probably due to poor distribution of the drug to the
small intestine. MMC and 5FU both have effects in intravenous as well as oral forms, which
implies that the systemic administration of the drug can have small intestinal effects' The
plasma halÊlives of the drugs are short, being minutes only, so only a small amount of drug
shourd remain in the intestinar tissue at 4g hours when the drug absorption of sulphanilamide is
most depressed. This implies that the action of MMC is not a direct toxic efflect on mature
enterocytes, but an indirect effect secondary to the mitotic inhibition of dividing cells' The
reduction of thymidine kinase supports this theory, as thymidine kinase is related to cell
43
proliferation and is found mostly in the crypts. Alkaline phosphatase was less depressed, and is
associated with the differentiated intestinal cells. The authors also measured the release rate of
D-glucose from mucosal lipid liposomes as a measure of mucosal permeability, which
increased.
Mitchell
Mitchell (6) measured absorptive function of small intestine, before, during and after
chemotherapy with BI2, carotene, calciunq prothrombin, Schilling's test, three day faecal fat
and 5 hour D-xylose, and biopsies were also performed in five patients. Mitotic counts reduced
during chemotherapy and returned to normal on recovery. There were no changes in
absorptive function nor any cumulative toxicity at 6 months'
Kralovanszky
Kralovanszky (93) studied the effects of different platinum drugs on the small intestine in rats.
Thymidine kinase was used as the marker of crypt cell proliferative activity, and alkaline
phosphatase, sucrase and maltase were used as digestive function markers. Once again, they
showed that thymidine kinase activity reached a nad\r 24 hours before the other enzï/mes,
suggesting that platinum acted via the crypt cells, and that the decrease in functional activity
was only secondary. Due to inhibition of disaccharidase function, osmoticalþ active substances
can remain in the lumen thus causing diarrhoea. Thymidine kinase rebounded rapidly on day 3
implying compensatory cell proliferation, although complete recovery took more than four
days. There was some difference in severity between the different platinum analogues, with
iproplatin being most toxic, cisplatin being intermediate, and carboplatin being least toúc.
Allan (94) showed similar results but with a longer time course in the mouse.
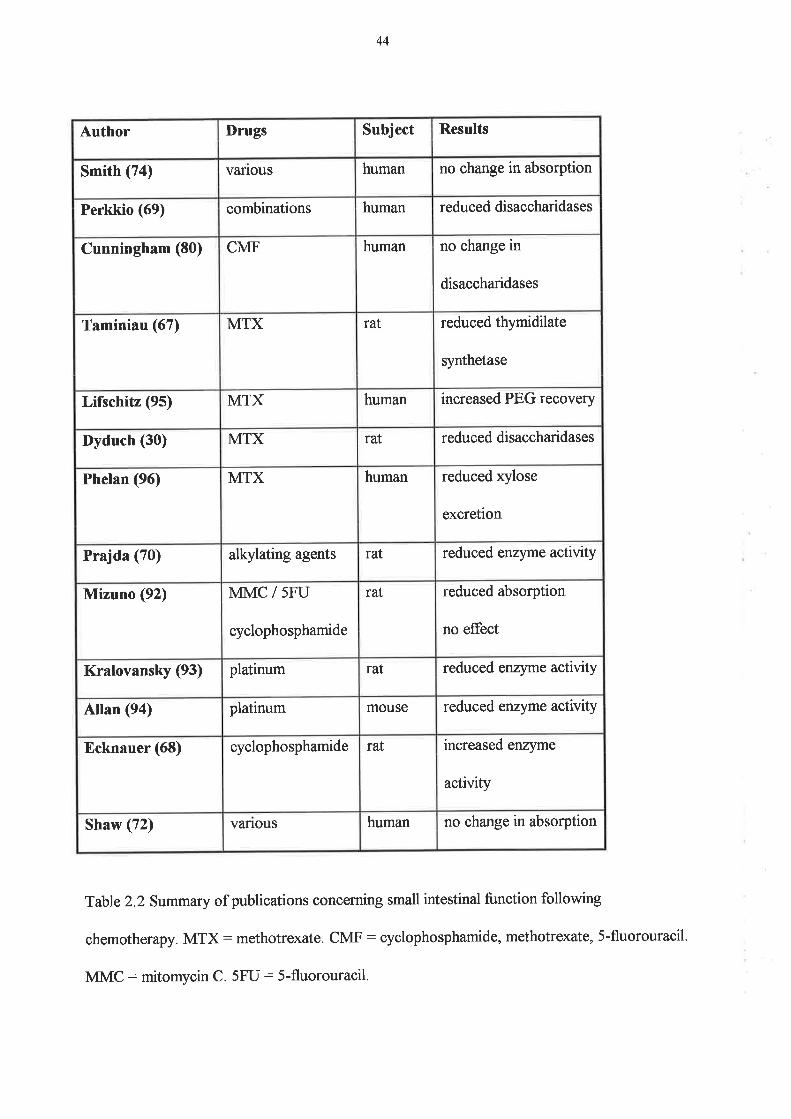
44
Author I)rugs Subject Results
Smith (74) vanous human no change in absorption
Perkkio (69) combinations human reduced disaccharidases
Cunningham (80) CMF human no change in
disaccharidases
Taminiau (67) MTX raI reduced thymidilate
synthetase
Lifschitz (95) MTX human increased PEG recovery
Dyduch (30) MTX rat reduced disaccharidases
Phelan (96) MTX human reduced xylose
excretion
Prajda (70) alþlating agents raI reduced enzyme activity
Mizuno (92) MMC / 5FU
cyclophosphamide
rat reduced absorption
no effect
Kralovansky (93) platinum rat reduced enzyme activity
Allan (94) platinum mouse reduced enzyme activity
Ecknauer (68) cyclophosphamide rat increased enzyme
activþ
Shaw (72) vanous human no change in absorption
Table 2.2 Svmmary of publications concerning small intestinal function following
chemotherapy. MTX: methotrexate. CMF: cyclophosphamide, methotrexate, S-fluorouracil.
MMC: mitomycin C. 5FU: 5-fluorouracil.

45
Prajda
Prajda (70) studied the effects of two alþlating agents on the functional and proliferating
zones of the small intestine by measuring activity of thymidine kinase, xanthine oxidase,
alkaline phosphatase, sucrase and maltase in isolated rat gut cell homogenates. He showed a
transient decline in protein content to approximately 6OYo at 48 hours, which returned to
normal by 5 days. Enzyme activity was also reduced, particularly for thymidine kinase (80%
reduction), with the nadir at 24 hours. Xanthine oxidase was reduced less with the nadir at 48
hours, and the others much less so. Again, the timing implies that the damage to the villi was
secondary to damage to crypt cells. Morphologically, there was erosion of the epithelium at the
top of the villi on day 1, along with crypt degeneration and coalescence, in parallel with
reduction of thymidine kinase activity. On day 2, there was a progressive destruction of the
epithelium with denuding of the villi. These changes are more pronounced than those seen
elsewhere in reports in the literature. Brush border enzymes decreased in parallel. On day 7 the
biochemical changes had resolved but the morphology was still abnormal, particularþ in the
villi. This contrasts with the work by Trier, where mucosal recovery began at 48 hours, and
others where it began even earlier.
2.22The effect of chemotherapy on small intestinal permeability
Low-dose continuous methotrexate given on a weekly basis to children with acute
lymphoblastic leukaemia (95) was studied by intestinal permeability as measured by
polyethylene glycol (PEG) recovery after oral administration. There was a significant increase
in PEG recovery in the post-dose tests, impþing increased transmucosal passage of the PEG.

46
In an animal study (30), methotrexate was found to reduce the activity of the brush border
disaccharidases lactase and maltase in rats after oral or intramuscular methotrexate. The
reduction was only transient, however, and returned to normal by one to two months. Phelan
(96) investigated the cumulative effects of low dose methotrexate on xylose permeability in
patients with rheumatoid arthritis receiving weekly methotrexate for at least I year. There was
a significant reduction in the urinary xylose excretion ratio in patients on methotrexate
compared with controls, but there were no changes on biopsies taken 72 to 96 hours after
methotrexate. This is perhaps explained by either the dose being too small, or more likely, by
the biopsies being taken too late in the recovery phase. Koninlor (97) found a change in the
mucins produced by the goblet cells tbllowing methotrexate, with a predominance of neutral
mucin and sialomucin during the hyperproliferative phase, and neutral and sulphomucin at
recovery (144 hours) This contrats with the excess sulphomucin following irinotecan (32).
Siber (98) measured urinary excretion of toc poþinyl pyrrolidone and tobramycin, given
orally to assess gastrointestinal permeability to large molecules, in ten patients having 5-
fluorouracil (days l-5 every 28) for metastatic colorectal carcinoma. He found a dose-related
increase in permeability, but there was a range of responses from 2 to 20-1old. The maximum
increase in permeability was I to 15 days after the start of treatment, which correlated with
gastrointestinal symptoms. However, there wasn't a very good correlation with severity. The
prevalence of infections correlated with neutropaenia during the period 17 to 24 days after
treatment, but did not correlate with the peak of intestinal permeability, which makes bacterial
translocation an unlikely cause of febrile neutropaenia.

47
pegues (99) in 1984 reported a study where patients receiving intensive chemotherapy for
acute leukaemia had D-xylose absorption measured before and immediately after
chemotherapy. A big fall in excretion (implying dysfunction of the jejunal mucosal barrier) was
associated with risk of severe infection, but again the timing of infection did not always
correspond the the nadir of reduced D-xylose absorption. Gastrointestinal symptoms were
only moderate and didn't predict well for reduced absorption.

48
2.23 Treatment of chemotherapy-induced small intestinal damage
Most agents act as potential preventers of mucosal damage, or protectors, rather than as cures
for damage once it has occurred. Many different remedies have been tried in an attempt to cure
the gastrointestinal side effects of chemotherapy, but none has so far been effective. See Table
2.3.Itis hard to compare trials because of the multitude of different toxicity grading scales, but
the most commonly used are the NCI Common Toxicity Criteria, or the wHo scales which are
very similar (4). Each potential remedy has its devoted followers, but there is no evidence in
randomised controlled trials, that any is of any benefit. Some treatments for oral mucositis are
sucralfate (100;101), chamomile (102), and GM-CSF mouth wash (103). A recent overview by
Sonis (4) showed that there was no proven treatment, and that all were still palliative' using
pain relief, anti-fungal agents and good oral hygiene. There is, however, much interest in such
agents as keratinocyte growth factor (KGF), interleukin-1l (IL-11) and transforming growth
factor beta (TGF-B) for prevention of both oral and small intestinal mucositis- These will be
discussed below
Successful chemoprotectants do exist for other organ systems such as bone marrow, bladder,
nervous system and heart (104). Nothing yet exists for the gastrointestinal tract. All current
agents being investigated in mucositis are preventive agents. Any agent is unlikely to quickly
reverse apoptosis or necrosis of cells once they were committed to that pathway'

49
Agent Site of action Result
AzelastÍne (105) oral mucosa eflective in small studY
Benzydamine HCI
(106)
oral mucosa success not reproducible
Sucralfate (100;101) oral mucosa no benefit in controlled
trials
GM-CSF (103;107-
1oe)
oral mucosa no benefit and poorþ
tolerated
Elemental diet (110) small intestine no benefit
Glutamine (111-117) oral mucosa and
small intestine
conflicting evidence
Parenteral nutrition
(118;1le)
small intestine no effect
Interleukin-ll (120-
124)
small intestine effective
Keratinocyte growth
factor (KGF) (125-129)
oral mucosa and
small intestine
effective
TGF-F (82;130-132) small intestine effective
Whey growth factor
extract (WGFE) (133)
oral mucosa and
?small intestine
effective
Amifostine (134-1,36) small intestine no evidence
Misoprostol (137) small intestine no effect
Bombesin (138) small intestine promotes tumour growth
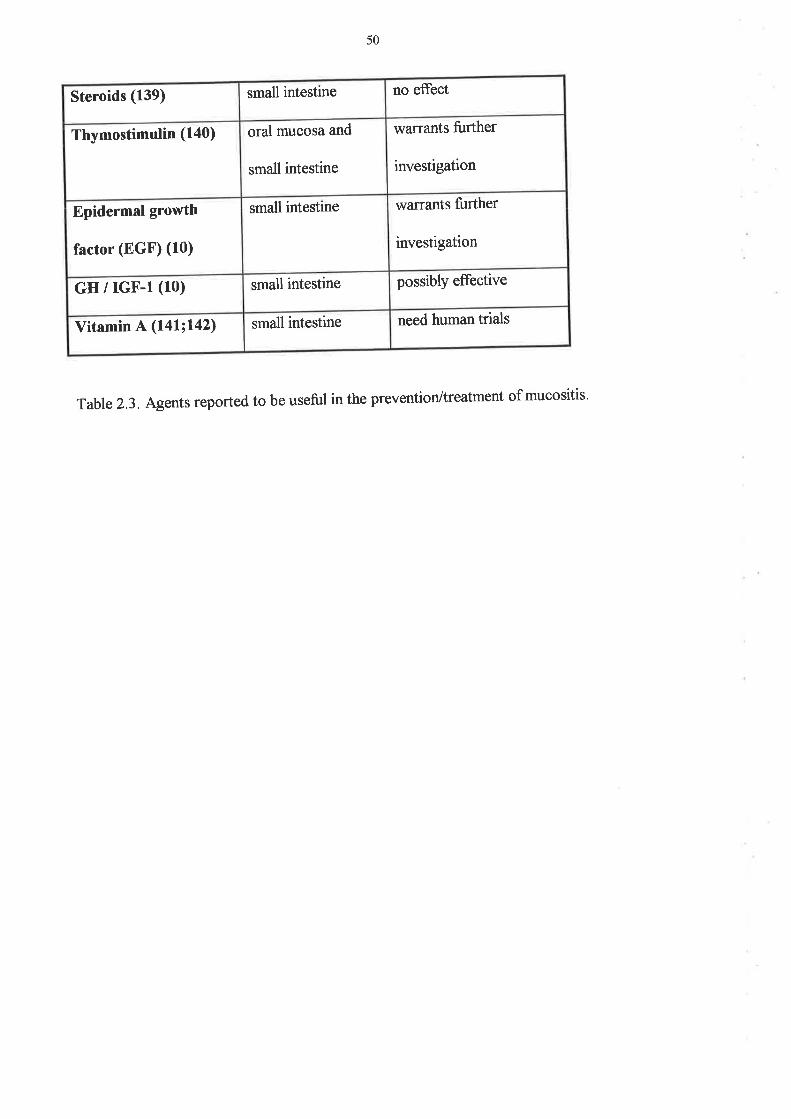
50
Steroids (139) small intestine no eflect
Thymostimulin (140) oral mucosa and
small intestine
warrants further
investigation
Epidermal growth
factor (EGF) (10)
small intestine warrants fuither
investigation
GH / rGF-l (10) small intestine possibly effective
Vitamin A Qa\laz) small intestine need human trials
Table 2.3. Agents reported to be useful in the prevention/treatment of mucositis'
51
2.24 Trials of oral and small intestinal mucositis prevention
2.24.1Glutamine
Glutamine is the most abundant amino acid in the blood and the free amino acid pool
ea3;Ia\.It is the principal fuel used by the gastrointestinal ttact acting both as an ammonia
scavenger and as a precursor to DNA synthesis' It is thought to be required for normal
intestinar mucosal growth and function. It is also a principar fuel used for growth by most
rapidly dividing tumours, and the stealing of glutamine from the host by the tumour may have a
role in the development of cachexia. Supplementing glutamine appeafs to increase the host's
glutamine metabolism without increasing that of the tumour, and work by Klimberg (l I l) in
the rat has suggested that tumour shrinkage to methotrexate is greater in the presence of
glutamine supplementation, and morbidity to the host is decreased. Glutamine also protects
against radiation damage (I44), and promotes healing of small intestinal mucosa after radiation
(145). Glutamine stimulates the proliferative fesponse of enterocytes (10), increases nutrient
transport and increases enteral absorption of glucose in normal animals' It increases the
absorption of water, sodium and chloride in animals with experimental diarrhoea. Glutamine
may also be ratelimiting for synthesis of glutathione, the most important intracellular
antioxidant in the bodY
Intestinal mucosal epithelial cells obtain glutamine from two sources: the arterial blood across
the basolaterar cell membrane, and after food from the intestinal lumen across the brush border.
Glutamine in the lumen depresses the rate of utilisation from the blood, but the combination is
still greater than that from the arterial supply alone. Glutamine suppresses the use of glucose. It
is metabolised locally to prevent it reaching neurotoxic levels in the blood' Glutamine

52
utilisation decreases in sepsis and increases in thermal injury. Ziegler (ll2) has shown that
adding glutamine to total parenteral nutrition (TPN) improves nitrogen balance and decreases
clinical infection. If given before damage occurs, it prevents deterioration of gut permeability
and preserves mucosal structure. It reduces hospital stay which has marked effects on cost'
van der Hulst added glutamine to TPN and showed that it prevented an increase in
gastrointestinal permeability and preserved mucosal structure (118)' Reduction of the muscle
free glutamine pool appears to be the hallmark of response to injury (146)' The extent and
duration of this reduced glutamine source are proportional to the severity of the illness'
Shloerb (l41)reported a randomised double-blind study of TPN with or without glutamine in
bone marrow transplantation. The length of hospital stay was reduced 5'8 days in the
glutamine arm, but there was no difference in the number of positive bacterial cultures'
infection rate nor mortality. Unfortunately there was no control arm not receiving TPN'
Growth hormone increases the uptake of glutamine from the small intestine, and therefore
increases it actions (148).
However, high unphysiological doses of intravenous glutamine have been associated with
neurotoúcity. It is postulated that a lower oral dose would be beneficial if it is delivered
directly to the small intestine, where it would be metabolised locally' Recent work in humans
using oral glutamine has been contradictory. Skubitz has reported a reduction in oral mucositis
in 13 out of 14 patients given oral glutamine as a'swish and swallow'preparation (113), but
Jebb (114) found no effect of oral glutamine in the prevention of oral mucositis in bone
maffow transplantation. In the small intestine, however, Bozzetti has found no reduction in
chemotherapy induced diarrhoea in patients taking glutamine supplements (115)' whereas

53
Elia (114) reports a possible beneficial efilect on small intestinal mucositis. A recent phase III,
placebo-controlled trial failed to show any benefit from glutamine (117) in reducing mucositis,
but the glutamine was given concurrently and not as pretreatment.
2.24.2 Transforming growth factor-p (TGF-P)
TGF-p plays an important role in the control of cellular proliferation, and inhibits lymphocyte
proliferation (la9). Among the earliest events detectable in human lymphocyte stimulation are
an increase in intracellular calcium and the activation and translocation of protein kinase C,
both of which can be induced by anti-CD3 antibodies. Porcine TGF-PI and -þ2, and milk
growth factor significantly inhibit proliferation of human lymphocytes induced by anti-CD3
antibodies (150) without inhibiting the increase of intracellular calcium nor the activation of
protein kinase C. TGF-p I is a potent growth inhibitor of cultured jejunal epithelial cells (151)'
It is found at highest concentration in the crypt cells but also in lesser amounts at the villus
tips, and expression in the epithelium may arrest growth of cells emerging from the crypt, and
induce or maintain the terminally differentiated state. In contrast, TGF-cr is found at the villus
tips, and not in the crypts. TGF-c¿ and-p may play significant roles in the regulation of the
balance between proliferative and differentiated cell compartments in the intestinal epithelium.
In an epithelial barrier model (130), TGF-P is able to decrease the capacþ of IFN-Y to disrupt
epithelial barrier function. This protective effect lasted for several days after a single dose of
TGF-p, and worked better if it was applied to the basolateral rather than the apical epithelial
membrane. TGF-p also reduced the barrier dysfunction caused by Cryptosporidium pãrvum
which implies that it is able to maintain and/or improve the barrier function of human
enterocytes. potten (82) showed that TGF-ft given over 24 hours prior to iradiation,

54
increased the number of crypts surviving the irradiation by 4 to 6 fold. After 14.5 Gy, only
35Yo of anmals survived 12 days, whereas 95Yo survived >30 days when pretreated with TGF-
Ê.. TGF-fu inhibits cell cycle progression through Gl by inhibition of the cdk-/cyclin-
dependent kinase activity, btÍ 24 hour exposure is necessary in order to protect all the cells.
Giving the TGF-B¡ after the irradiation abolished the effect. There is some evidence from
potten that the stem cells in the crypts have a very strong circadian rhythm compared with the
other crypt cells. The stem cells have their peak DNA synthesis at 0300h with a cell cycle
duration of 24 hours. When the irradiation was given at 0300h there was better protection than
when it was given at 0900 or 1200h. The effects of circadian rhythms on the tumour are
thought to be less, but are not very well defined.
Sonis (152) showed that the administration of TGF-ft to hamsters before chemotherapy
reduced the incidence and severity of cheek pouch mucositis, reduced weight loss and
increased survival. Theoretically it would not be advantageous to suppress proliferation during
the recovery phase after injury, as this would delay healing rather than promote it.
puolakkainen developed a delivery system using alginate beads (153), in order to deliver the
TGF-P directly to the gastrointestinal mucosa. There was no release in the acid stomach, but
good release and good effect in the small bowel, with stem cell quiescence. As mentioned
previously, epithelial cells secrete TGF-B and have TGF-P receptors, which implies there might
be an inhibitory autocrine loop. TGF-B inhibits the proliferation of T and B lymphocytes, but
stimulates fibrosis and angiogenesis. It is possible that secretion by tumours could be important
for angiogenesis and development of tumour stroma. Thus the inhibitory effects of TGF-p on
immune surveillance and the stimulatory effects on angiogenesis might promote an
environment that is conducive to tumour cell growth. Rowe (154) reviewed the diverse and
55
often contradictory actions of TGF-B's1-3. Suppression of breast cancer by tamoxifen has been
attributed to induction of TGF-B secretion in pre-cancerous mammary duct epithelium. TGF-
B,s1-3 Írre endogenous mediators of growth, maintenance and repair processes. They are
expressed by most cells and have a wide range of autocrine, paracrine and endocrine functions
via interaction with a signalling receptor complex on the cell surface. It is not certain why
TGF-p3 would be better than TGF-Êr and TGF-Fz' which also show chemoprotective effects'
both for the gastrointestinal and bone marrow stem cells. The role of TGF-F in tumour
promotion/ suppression is still not resolved and will need proper safety studies, although TGF-
Fs has entered phase I studies in humans (132).
2.24.3Interleukin-ll
Interleukin-ll is a stroma derived multifunctional cytokine (123), which acts by limiting cell
death. It shares many of its biological properties with IL-6. The gene is on chromosome 19. It
may be up-regulated by TGF-B and IL-l, and promotes colony growth and differentiation in
haemopoetic cells, plasmacytoma proliferation, and T-cell dependent development of
immunoglobulin producing B cells. It would be interesting to consider the opposite approach
to the one we consider with most of the chemopreventive agents, that is: are there any
stimulatory factors which speed up the cell cycle following exposure to cytotoxics, and that
could therefore speed up regeneration, and be administered after the injury?. IL-ll may
perhaps quali$r (124).
Interleukin-I1 is becoming increasingly popular as a potential chemoprotectant, which reduces
gut toxicity without reducing cytotoxicity on tumour in several animal models. Du (121)

56
showed that recombinant human IL-I1 increased survival of mice treated with previousþ lethal
doses of 5-fluorouracil and irradiation. It reduced the incidence of sepsis, and increased
recovery of intestinal epithelium. The same group (120) showed that IL-11 reduced apoptosis
and increased mitosis, u,hile increasing villous length and reducing the crypt to villus ratio after
irradiation.
peterson (rzz)assessed ll-ll's ability to reduce cellular proliferation on a rat intestinal cell
line (IEC-6), because reduction of proliferation can be cytoprotective' He found that IL-ll
reduced proliferative rate as measured by cell counts and ff4ttrymidine incorporation' and that
was not mediated through TGF-Ê. There was delayed entry into S-phase of the cell cycle and
suppression of retinoblastoma protein phosphorylation'
potten (l23)showed that IL-I1 protects mouse small intestine from radiation damage' when
administered prior to and during radiation therapy, by increasing the survival of intestinal
clonogenic stem cells, although the mechanism of protection has not been elucidated' It was
not however due to reduced proliferation. An intact epithelium can be regenerated from one
cell surviving every two to five crypts. There would appear to be a hierarchy of stem cells in
the crypts. firstly, six steady state stem cells which are highly radiosensitive, secondly another
six more resistant cells the can regenerate the crypt (clonogenic cells), and thirdly 24 even
more resistant reserve clonogenic cells. Potten reports that it is the latter group which is
protected by the IL-l1 Sonis (Iz4)treated hamsters given chemotherapy and buccal irritation
with IL-l I for 12 days after treatment, and showed a reduction in incidence' severity and
duration of mucositis in the IL-r1 treated animals, along with ress weight loss, morbidity and
mortatity. Thus IL-ll may also treat established mucositis. IL-ll has now reached phase I
testing in humans, for its platelet elevating effect (155)'

57
2.24.4 Keratinocyte growth factor (KGF)
Keratinocyte growth factor is a member of the heparin-binding fibroblast growth factor family
It acts by binding to the KGF receptor, which is a variant of fibroblast growth factor (FGF)
factor 2. KGF receptor and KGF 'RNA are found within the entire gastrointestinal tract,
suggesting the entire gUt both synthesises and responds to KGF' KGF acts predominantly on
epithelial cells, and produces various effects such as increased proliferation' migration and
morphogenesis (156). Among other actions, it has been shown to promote healing of the oral
mucosa, gastric mucosa (125;726), and small intestinal mucosa (127)' and has begun clinical
trials in humans to prevent mucositis following chemotherapy' Farrell (125;129) has shown
that KGF given prior to treatment but not after treatment, increased mouse survival following
5-fluorouracil. It reduced hepatic ulcers and weight loss, and increased oral intake' The effect
does not seem to be confined to 5-fluorouracil, but probably holds for most chemotherapeutic
agents.
playford (157) showed that KGF reduces basal acid secretion but does not prevent
indomethacin-induced gastric damage. There is arso a possibility that it can increase growth of
certain tumours, as it increases CEA production by a colon cancer cell line (L26)'
2.24.5 GM-CSF and G-CSF
GM-CSF mouthwash has had some recent popularity after anecdotal reports that patients
receiving GM-CSF suffered less mucositis. However, this was not confîrmed in clinical trials
(103,107) and indeed it was poorly tolerated by patients, who had less than 5QYo compliance
with either the treatment or placebo arm in one study (107). However, a recent study (109)
suggests that GM-CSF mouthwash can reduce severity and duration of oral mucositis in non-
58
neutropaenic cancer patients if given once mucositis has occurred. There is also a report that
G-CSF can work after the event (158). This would be a very useful effect if proven'
2.24.6Whey growth factor extract (WGFE)
Whey growth factor extract is a by-product from the manufacture of cheese. It is a very rich
source of growth factors, but its contents have not yet been fuþ characterised. However, it is
known to contain TGF-p, IGF-I and II, and fibroblast growth factor. The growth factor
extract is prepared by ion exchange chromatography of cheese whey, that removes 99Yo of
whey.protein, but enriches the growth factor extract. Howarth has shown that WGFE
ameliorates small intestinal mucositis in the rat (133). WGFE or vehicle was fed to the rats, for
5 to 12 days, starting on the first of three methotrexate treatment days' Weight gain, food
intake, and small intestinal weight were not affected by the \ryGFE, but there was a reduction
in severity of villous atrophy by about 5o%o, patticularly in the mid-jejunum and proximal
ileum. Sucrase was higher in the ileum of the WGFE fed rats, and bacterial translocation was
significantly reduced. There are no results in humans yet, although phase I and II studies are
under way.
2.24.7 Total Parenteral Nutrition (TPN)
The role of TpN itself in reducing the side effects of chemotherapy is controversial. There is no
difference in side effects of chemotherapy between normally nourished and malnourished
patients with respect to myeloto*icity and gastrointestinal toxicity. There is also no change in
nutrition of normally nourished patients with chemotherapy. But in patients who are
malnourished to start with, prealbumin, retinal-binding protein and nitrogen balance are

59
improved when TPN is given with chemotherapy. TPN, however, causes mucosal atrophy in
rats (10); glutamine reduces this atrophy. In inflammatory bowel disease in humans, glutamine
maintained the mucosa and prevented the increased permeability induced by TPN (118). It also
improved survival in rats undergoing abdominal irradiation (58;159), or chemotherapy (116).
In an unpublished study, we (160) studied 60 patients undergoing high dose chemotherapy and
autologous peripheral blood stem cell transplantation. The first twenty patients received TPN,
the second twenty received an electrolyte solution equivalent to TPN minus the intralipid, and
the final twenty received simply normal saline with electrolyte supplements as required. There
was no dif[erence in outcome between the three groups with respect to grade of oral mucositis,
days in hospital, neutropaenic days nor infective episodes.
Cummins (161) described partial villous atrophy and rhamnose malabsorption in patients
receivìng enteral feeding via percutaneous endoscopic gastrostomy, due to poor 'luminal drive'
associated with the liquid enteral feeding. Luminal drive is the stimulation to small intestinal
growth and integrity that is provided by normal dietary intake.
2.24.8 Other special dietary modiflrcations
Kehoe (162) studied the effect of a chemically defined liquid diet on rats treated with
methotrexate compared to normal chow. The rationale was that both chemotherapy and diet
influence the intestinal epithelium, and that controversy existed as to whether they each had the
same or opposite effects. The rats received one of the two diets for 14 days, and were then
given intraperitoneal methotrexate 25-50 mglkg, and continued on the same diets. Autopsies
were performed on rats that died, and survivors were followed for late toxicity. After the

60
methotrexate, the chemically defined liquid diet-fed rats stopped eating by day 3, developed
diarrhoea, and died between 60 and 90 hours after methotrexate. The normal chow fed rats
continued normal consumption in the next 3 days and maintained weight. None of them died
within a two rveek period. At autopsy of the ehemically defined liquid diet rats, the small bowel
and colon appeared attenuated and almost translucent. There was evidence of intraluminal
blood with pooling in the caecum. The lining of the gastrointestinal tract showed varying
degrees of focal necrosis and sloughing.
In a second study, rats were fed the same two diets, and were given methotrexate or saline on
day 14. Blood was taken for aerobic and anaerobic culture, small intestinal luminal contents
were aspirated for culture, and segments of small and large bowel were biopsied. The chow fed
rats had more positive small bowel cultures than the liquid diet fed rats both in the
methotrexate and saline groups. The flora changed in the rats fed liquid diet, with increased
E.coli, whereas the normally fed rats grew mostly Lactobacillus species and non-haemolytic
Streptococci. There was no difference in either group between cultures from methotrexate or
saline treated rats. The small bowel of the liquid treated rats that received methotrexate
showed severe enteritis. The mucosa was thin and villi were flattened. Multiple mucosal
erosions and areas of focal haemorrhage were seen. There was a polymorphonuclear leucocyte
infiltrate in the crypts, and the inflammation extended through the muscularis mucosae. The
colons of the same animals had only very mild mucosal erosions with disruption of the normal
colonic architecture. Small areas of focal inflammation were seen in the crypts. The small
bowel of the regular diet fed rats showed only minor changes, with a few flattened villi and
minimal destruction of architecture. There was no difference in histology of the intestine
between the rats given the two different diets and not given methotrexate, so diet alone had no
effect on the mucosa, whereas methotrexate affected the mucosa dependent on the type of diet

6L
fed. In summary, feeding a chemically defined diet to rats receiving methotrexate was lethal'
and produced severe small bowel toxicity. It could be that the altered bowel flora caused
bacteraemia of more toxic organisms in the presence of the severe enteritis, but there was no
increase in bacteria cultured from the blood of these animars, either from the portal vein nor
the inferior vena cava, and any bacteria that were cultured in all groups were lactobacilli' not
the more toxic coliforms. The autopsies showed that the rats died from intraluminal bowel
haemorrhage secondary to severe inflammation and destruction of small bowel mucosa after
methotrexate in chemically defined liquid diet-fed rats, indicating more severe mucositis. A
further study showed that the methotrexate levels in the serum remained high for longer (48
vefsus 24 hours) in the chemically defined liquid diet-fed rats, and this may be the cause of the
increased toxicity, as methotrexate toxicity is directly related to a tissue's duration of
exposure, once a critical threshold level is reached'
In contrast, Malhotra (110) has recentþ presented work in patients undergoing bone marrow
transplantation who were fed an elemental diet. The diet (8N9444) is composed of protein
(67g/t), îat (23gll),carbohydrates (198g/l) and short chain fatty acids @PA/DFIA) at a calorific
concentration of 1.3 KcaVml. Patients either received an ad libitum diet, or EN9444 as the sole
source of calories rromT}hours before the start of treatment and throughout therapy' Forty-
five patients wefe randomised. Two weeks after the bone marrow transplant' the elemental diet
group had lower permeability than the normal diet group. The elemental diet increased earþ
nausea and diarrhoea but reduced severity of post-bone maffow transplantation mucositis
defi ned symptomaticallY'
62
2.24.9 Epidermal Growth Factor (EGF)
EGF is a peptide hormone secreted by the salivary glands and the specialised enteroendocrine
cells in the small intestine. It is a potent mitogen for mucosa (163), but shares a receptor with
TGF-cr, which may be the more important cytokine for growth of the small intestine'
Glutamine is an essential nutrient for EGF-stimulated intestinal cell proliferation, and the
trophic effects of glutamine and EGF are additive (164). However there have been no human
trials reported and the results in animals have been contradictory (165;166).
z.z4.I}Growth Hormone and Insulinlike growth factor-I (IGF-l)'
Growth hormone causes mucosal hypertrophy after resection, and increases amino acid
transport in the small intestine due to an increased number of functional carriers in the brush
border membrane (1aS;167). It regulates water and sodium transport in the small intestine and
colon. IGF-I is produced in a number of tissues after stimulation by growth hormone' It
mediates most of the anabolic effects of growth hormone. It increases the weight and length of
the small and large intestines (24), reduces the mucosal atrophy associated with TPN and
maintains bowel integrity. IGF-I and glutamine combined produce much more protein
deposition in resected bowel than either IGF-I or glutamine alone (10)'
2.24.ll,other potential agents to prevent or treat mucositis
Azelastine
Azelastine, a cell membrane stabiliser and leucocyte suppressor, has been tested as a treatment
for mucositis in humans by osaki (105). Subjects, who were about to receive combined
chemo-radiotherapy for head and neck cancer, were given either a mouthwash containing

63
Azelastine plus Vitamin C, vitamin E and glutathione, or the same mixture without Azelastine.
In the Azelastine gfoup, there were fewer cases of mucositis, with later onset and shorter
duration of symptoms. However the numbers were small, with only twenty-six in the treatment
group; there was no group receiving no treatment, and further studies are needed. In 1985'
Sonis reported a pilot study of benzydamine hydrochloride mouth wash (106), with a beneficial
effect on oral mucositis. Unfortunately the results have not been reproduced in randomised
studies. Sucralfate initially showed promise, but a randomised controlled trial showed no
benefit (101).
Amifostine
Amifostine is a chemoprotectant that has been shown to protect against organ toxicities of
chemotherapy (134-136), particularly kidney and bone mafrow, while also offering protection
from radiotherapy induced damage.It is an organic thiophosphate derivative of cysteamine.
While it is thought to protect the small intestine from radiotherapy-induced damage, there is no
evidence that it protects the small intestine from chemotherapy-induced damage. It is thought
to act as a free radical scavenger and also by attacking charged carbonium ions of activated
alþlating agents, so protecting critical nucleic acids. It is accumulated more slowly and less
efficiently by tumour cells, allowing it to protect the normal cells during exposure to
chemotherapy or radiotheraPY.
Misoprostol
Misoprostol is a prostaglandin E1 analogue. It has been used to prevent duodenal ulcers
induced by non-steroidal anti-inflammatory drugs (NSAIDs) or alcohol, and therefore was
investigated for a potential role in preventing the damage induced by chemotherapy (137)'
Eighteen patients undergoing intrahepatic arterial infusion of 5-FUDR and mitomycin C for

64
metastatic colorectal carcinoma were randomised to receive either misoprostol or placebo, to
protect against gastrointestinal mucosal injury Endoscopy-proven mucosal injury developed in
four of ten patients on misoprostol, and three of eight patients on placebo, showing no
protective effect (p>0.1). The high incidence of this toxicity (between 8 and 4O%) was due to
the inadvertent infusion of part of the stomach due to aberrant blood vessels (168). The toxic
effects were confined to the duodenum, and ranged fi'otr solitary ulcers to inflammation of the
entire mucosa.
Steroids
Single injections of prednisolone (139) reduce thymidine labelling and mitotic index in rat
jejunal mucosa due to reduced cell production rate. Recovery occurs over 7 days. If continued
on a daily basis, there is a more sustained reduction in proliferation. This would make the use
of steroids to protect the gut very unlikely to work, unless a much shorter acting agent were
available. Allan (94)compared the toxicity of cisplatin and its analogues, and the effect of
dexamethasone on cisplatin-induced toxicity. Platinum is an extremely emetogenic drug, and
acts both centrally and locally on the small intestinal mucosa. Dexamethasone, however, had
no protective effect on the mucosal damage, with even a suggestion that it might worsen the
damage induced by cis-platin in particular.
Hyperthermia and glutathione depletion
Laskowitz (169) assessed the effect of melphalan, hyperthermia and glutathione depletion on
tumour killing and toxicity. Both hyperthermia and glutathione depletion have previousþ been
shown to enhance melphalan effect and toxicity. The mortality rate for the mice given
melphalan plus glutathione depletion plus hyperthermia was higher (53%) than for any
combination of treatments or single treatment (highest mortality 135%). There was marked

65
increase in small intestinal damage with the triple therapy, consisting of crypt necrosis and
epithelial denudement, whereas neither hyperthermia nor glutathione depletion alone caused
increased small intestinal toxicity. Gavage of sterile water twice daily completely prevented
mortality in the triple treated mice and these latter mice also showed the biggest delay in
tumour growth, but the mechanism of action of this phenomenon is not understood.
Cyclophosphamide priming prior to high-dose melphalan
The use of high dose melphalan for multiple myeloma is limited by the occuffence of severe
oral mucositis and diarrhoea. Priming with a low dose of cyclophosphamide, given
approximately one week prior to melphalan, has been used in some centres to protect the gut
from damage (170-172). The exact timing of the dose varies between centres, but there is
agreement that only one dose is beneficial whereas multiple doses are deleterious. However,
the use of cyclophosphamide is controversial (173), and has not been confirmed in randomised
controlled trials. The mechanism is also not known, although it may relate to aligning the cell
cycle in gastrointestinal mucosal cells, so that they are not susceptible to melphalan when it is
administered.
Bombesin
Bombesin (138) is a tetradecapeptide originally isolated from the skin of the frog Bombina
bombina. It is analogous to mammalian gastrin-releasing peptide. Among other actions, it
stimulates growth of the gut and pancreas in neonatal rats. In adult rats it prevents the mucosal
atrophy of the small intestine which is produced by a liquid elemental diet. Fox (116) showed
that glutamine in an elemental diet significantly improved survival after methotrexate. The
effects of bombesin and glutamine are due to their trophic effects on the small intestinal
mucosa. Maintenance of gut mucosal structure is probably crucial to survival from the

66
enterocolitis produced by methotrexate. The actual mechanism of action of bombesin is
unknown, but it may be acting through the release of other gut hormones. Unfortunately,
however, bombesin also stimulates the growth of small cell lung cancer, breast cancer, prostate
cancer, stomach cancer, gastrinoma and some colon and pancreas canc.ers. It is therefore of no
use m man.
Vitamin A
There is some evidence that vitamin A protects the small intestine from methotrexate-induced
damage in rodents (l4l;142), but no human trials are reported.
Thymostimulin
Thymostimulin (extracted thymic hormone) was used to try to prevent febrile neutropaenia
(140). It failed in that regard but the patients on the thymostimulin had fewer episodes of
mucositis and diarrhoea, which should be further investigated.
2.24.12. Combinations of growth factors to prevent mucositis
There is a variety of peptides associated with regulation of the small intestinal mucosa, and the
challenge is to find the best strategy for chemoprevention. GlucagonJike peptide-2 is derived
from pro-glucagon and is synthesised in the L cells of the small and large intestine. It increases
bowel weight and villus growth in the jejunum and ileum, and shows promise as part of a
possible strategy. Interactions between the different growth factors are very complex. ['-12,
for example protects the bone marrow from radiotherapy, but makes gastrointestinal toxicity
lethal therefore precluding its use (174). Subcutaneous GM-CSF may protect the oral mucosa

67
from radiation-induced mucositis (108), but it has no effect on chemotherapy-induced
mucositis when given orally (107)
Gut protection during chemotherapy was reviewed by Wilmore (10). He suggested a mixture
of various factors in an attempt to protect the gut. Glutamine was suggested due to its ability
to stimulate gut growth and promote gut health. The other components were growth hormone,
IGF-I, glucagonJike peptide-Z, and IL-l1, and one should consider WGFE and KGF. Byrne
(175) describes a new treatment for patients with short bowel syndrome, using a combination
of low-fat, complex carbohydrates, moderate protein, glutamine and growth hormone. This
combination has had very promising results with increased mucosal growth, increased
absorption across the remnant bowel and a reduced need for TPN. It may lead to further
developments in mucosal protection.
2.25 Safety issues in mucositis prevention
Of critical importance with any agent that might potentially prevent or treat mucosal damage
from chemotherapy, is that it should not adversely effect the way that chemotherapy acts on
the tumour. Therefore studies of new agents must also assess tumour growth, as well as
mucosal protection. Animal studies obviously must precede human studies. Although
glutamine is preferentially taken up by the tumour, it is thought to enhance the effect of
methotrexate on the tumour, but this has not previously been tested in a model that can assess
the small bowel mucosa and the tumour simultaneously.

68
2.26 Summary
As can be seen from the above review of the literature, there have been many small studies of
various aspects of small intestinal reactions to chemotherapy, and large amounts of data have
been collected. However, there is no definitive account that covers all aspects of this problem'
The above studies provide much information about oral and small intestinal mucosal damage
following cytotoxic chemotherapy, particularþ in rodent models, but to some extent in
humans. we know that chemotherapeutic agents act on the stem cells and some other cells in
the small intestinal mucosa to cause hypoproliferation foilowed by a rebound hyperplasia,
which overcompensates for the defect before settling to normal. we do not know, however'
the exact time course of these changes in humans following chemotherapy, nor how these
changes relate to the symptoms of small intestinal and oral mucositis that patients experience
after treatment, nor yet to the nutritional and other functional changes that occur'
This project, therefore, set out to assess symptoms, function and morphology in a large group
of patients undergoing cytotoxic chemotherapy, in an attempt to provide answers' and then to
set up an animal model that would enable us to simultaneousþ assess the effect of any
chemoprotective agent on both tumour and small bowel, so that human studies would only be
attempted with agents that could be shown not to promote tumour growth'

69
CHAPTER TIIREE
THE EFFECT OF HIGH.DOSE CHEMOTHERAPY ON SMALL INTESTINAL
SUGAR PERMEABILITY IN HUMANS
3.1 INTRODUCTION
Mucositis is a clinical term describing a syndrome defined by mucosal ulceration and
gastrointestinal symptoms (1), which is a common side effect of many forms of cancer
chemotherapy. It is uncertain whether inflammation is present' Most of the limited research
carried out on mucositis has been confined to the oral mucosa' as examination is easy and
results of treatment afe evident. Despite its common occufÏence in patients having
chemotherapy, the exact mechanism is unclear and there is no definitive treatment' It has
become the main factor that limits higher doses of chemotherapy as bone marrow toxicity is
reduced and recovery improved by the use of colony stimurating factors. some symptoms such
as nausea, abdominal pain and particularþ diarrhoea would suggest an intestinal origin'
Intestinal function has been traditionally measured by xylose absorption. This monosaccharide
sugar undergoes passive mediated absorption in the jejunum (37;L76;177)' An alternative
monosaccharide test sugar is rhamnose which is passively absorbed throughout the whole of
the smail intestine. In this respect, it is a better measure of intestinal function- A further
development has been to combine rhamnose with the disaccharide sugar lactulose. The ratio of
lactulose to rhamnose is termed 'sugar permeability'.

70
By using the ratio of the two sugars, effects such as altered gastrointestinal transit time or mild
renal impairment are cancelled out. Neither sugar is metabolised except by bacteria' Rhamnose
is believed to be absorbed transceilurarþ by passive diffi,sion across enterocytes with little
intestinal resefve, and thus absorption reflects total intestinal absorptive capacity (176)' Thus'
rhamnose is a better measure of carbohydrate absorption than >cylose' There is' however' some
controversy about the exact path of the monosaccharide absorption (38)' Lactulose is normallv
excluded(<2%absorbed)withanyabsorptionthatdoesoccurbeingparacellular,and
presumed to involve leakiness of tight epitheriar junctions between enterocytes. The advantages
of this double sugar test are that it is well.tolerated, non.invasive, and that it may be repeated
sequentialþ.Inthefutureitcouldbeusedtoassesspossibletreatmentsofmucositis.See
figure 3.1 1
our aims in this study were to assess the severþ and time-course of changes in intestinal
permeability after high-dose chemotherapy and autologous blood stem cell transplantation' to
assess ease of administration and patient tolerance of the test, and to assess incidence and
severity of mucositis.
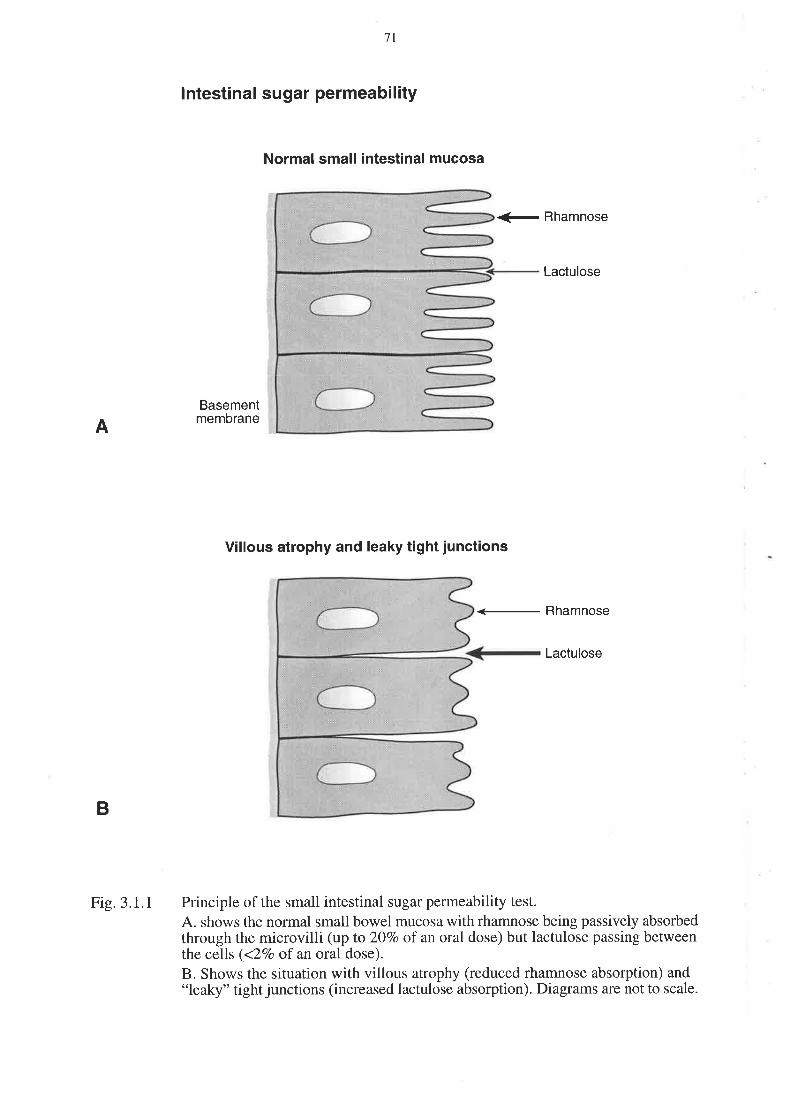
A
7l
lntestinal sugar permeability
Normal small intestinal mucosa
<- Rhamnose
Lactulose
Basementmembrane
Villous atrophy and leaky tight junctions
Rhamnose
Lactulose
Principle of the small intestinal sugar permeability test.
A. shows the normal small bowel mucosa with rhamnose being passively absorbedthrough the microvilli (up to 20Vo of an oral dose) but lactulose passing betweenthe cells (<ZVo of an oral dose).
B. Shows the situation with villous atrophy (reduced rhamnose absorption) and"leaky" tight junctions (increased lactulose absorption). Diagrams are not to scale.
B
Fig.3.1.l

72
3.2 METHODOLOGY
Subjects
Al1 patients receiving high dose chemotherapy and autologous stem cell transplantation at The
Queen Elizabeth Hospital were eligible, and the study was approved by the Ethics of Human
Research Committee at The Queen Elizabeth Hospital. The study was carried out in
accordance with the Declaration of Helsinki. Informed consent was obtained from each patient
prior to enrolment in the study. Patients were excluded if they had pre-existing small bowel
disease (such as coeliac disease, inflammatory bowel disease or small bowel malignancy), or
were unwilling to participate in the study. Insulin dependent diabetes was also an exclusion
criterion as the sugar solution contained glucose. The characteristics of the thirty-five patients
enrolled in the study are given in Table 3. l. Four patients underwent the procedure twice. The
chemotherapy involved combinations of drugs in marrow ablative doses given over several
days. Most patients received combinations of drugs such as busulphan, cyclophosphamide,
epirubicin and melphalan (Table 3.2).Patients were studied prior to receiving chemotherapy,
and at 7, 28, 60 and 90 days after stem cell infusion. They underwent an intestinal sugar
permeability test (ISPT) and an assessment of gastrointestinal toxicity on each occasion.

73
SEX
Male
Female
TREATMENT
EPISODES
13 (10 patients)
26 (25 patients)
AGE (Years)
median (range) 3e (16-61)
DISEASE TREATMENT
EPISODES
Breast cancer 18 (17 patients)
Acute myeloid leukaemia 6
Non-Hodgkin's lymphoma 5
Sarcoma
Germ cell tumour
Multiple myeloma
Hodgkin's disease
5 (3 patients)
2 (1 patient)
Small cell lung cancer I
TOTAL 39 (35 patients)
1
1
Table 3.1. Patient characteristics and type of malignancy present
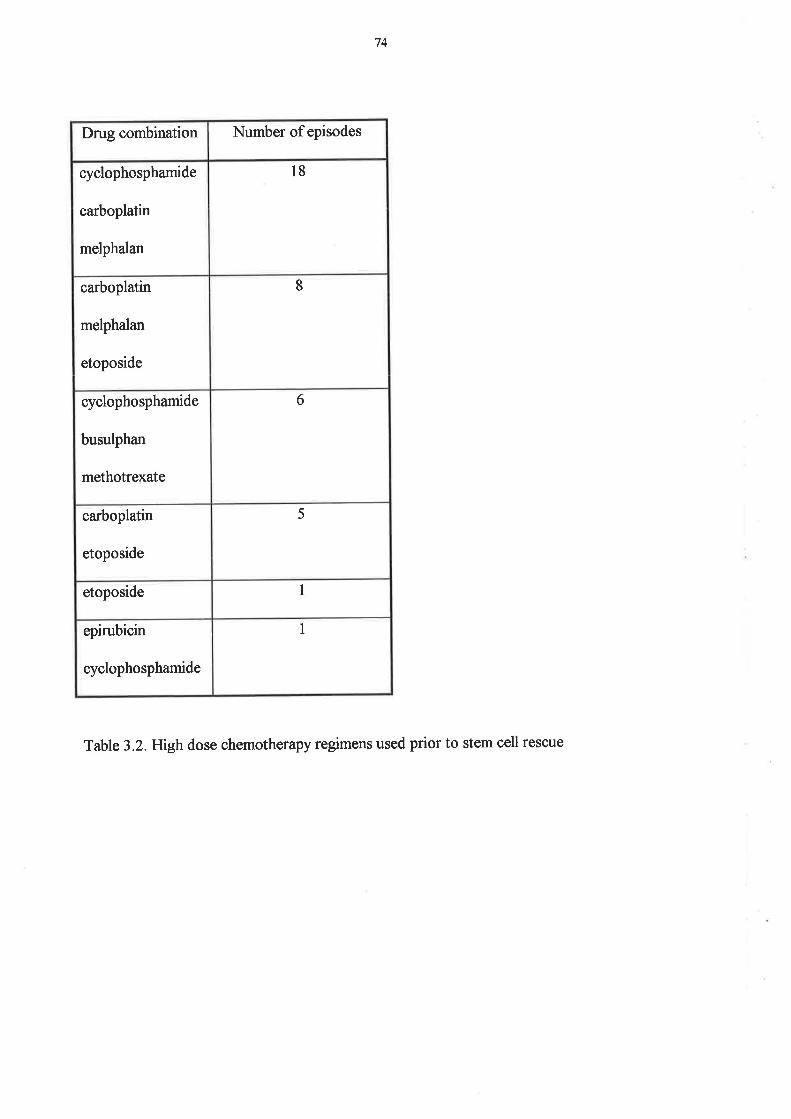
74
Drug combination Number of episodes
cyclophosphamide
carboplatin
melphalan
l8
carboplatin
melphalan
etoposide
8
cyclophosphamide
busulphan
methotrexate
6
carboplatin
etoposide
5
etoposide 1
epirubicin
cyclophosphamide
I
Table 3.2.Htghdose chemotherapy regimens used prior to stem cell rescue

75
fntestinal PermeabilitY
After an overnight fast (water was allowed throughout), the patient was given a solution to
drink comprising 59 lactulose, 1g rhamnose and 22.69 glucose in 100 ml water. The glucose
acts as an osmotic stressor on the tight junctions. All urine was collected for the next 5 hours,
the total volume was recorded and a 10 ml aliquot was stored for later analysis by high
performance thin layer chromatography (37). Rhamnose was measured in urine using a method
originally designed for plasma but with a modification to correct for urinary urea which co-
elutes with rhamnose in this system (37). A quadratic equation was derived for rhamnose
versus urea concentrations which had been previously established in the laboratory. Standards
were regularþ applied to the chromatograph plates in the analysis. Intestinal permeability was
expressed as the mg ratio of urinary lactulose to rhamnose, with each expressed as the
percentage of ingested dose.
The National Cancer Institute common toxicity criteria were used for assessing oral mucositis,
diarrhoea, nausea and vomiting. Toúcities are graded from 1 to 4, following the convention
that 1 : mild, Z: moderate, 3 : severe and 4: life-threatening (178). See also Table 4.21.2.
Statistics
Results were analysed using Peitz' F test, which is a robust measure of differences in the
group means, where the group sizes are not identical (179). Permeability ratios and both
lactulose and rhamnose absorption values were transformed to logro(x+l) to normalise the data
and stabilise the variance before analysis. A p value of <0.05 was used across Pentz' analysis
for significance testing, but an adjusted p value was calculated for pairwise comparison. For
ease of presentation, median values were also calculated as the measure of central tendency.

76
3.3 RESULTS
Forty-four courses of high-dose chemotherapy and autologous blood stem cell transplantation
were performed in forty patients. Two patients declined to be enrolled, one patient was
withdrawn for medical reasons, and two were excluded because they only had the test prior to
treatment. Thus thirty-five patients \ryefe available for the study, with four undergoing the
treatment twice, giving thirty-nine treatment episodes. Their characteristics are shown in Table
3.1. The female preponderance was due to a higher proportion of patients being treated for
breast cancer. Thirty-four of the patients received chemotherapy as priming prior to stem cell
harvesting from peripheral blood. only one patient did not have chemotherapy prior to
enrolment.
Patient accePtabilitY
Four patients found the test sugar solution unacceptably sweet and were unable to swallow the
solution on day 7. They were able to swallow it by day 9' No other adverse effects were
experienced from the test.
Oral mucositis
Oral mucositis occurred in all patients, with toxicity reaching coflrmon toúcity criteria grade 3'
4 in 5Iyo.Diarrhoea with a grading of 3-4 occurred in 4ryo and grade 3-4 nausea and vomiting
in l6Yo. These symptoms peaked at 7 days after chemotherapy' Table 3'3 shows the
percentage of patients reaching each mucositis grade'
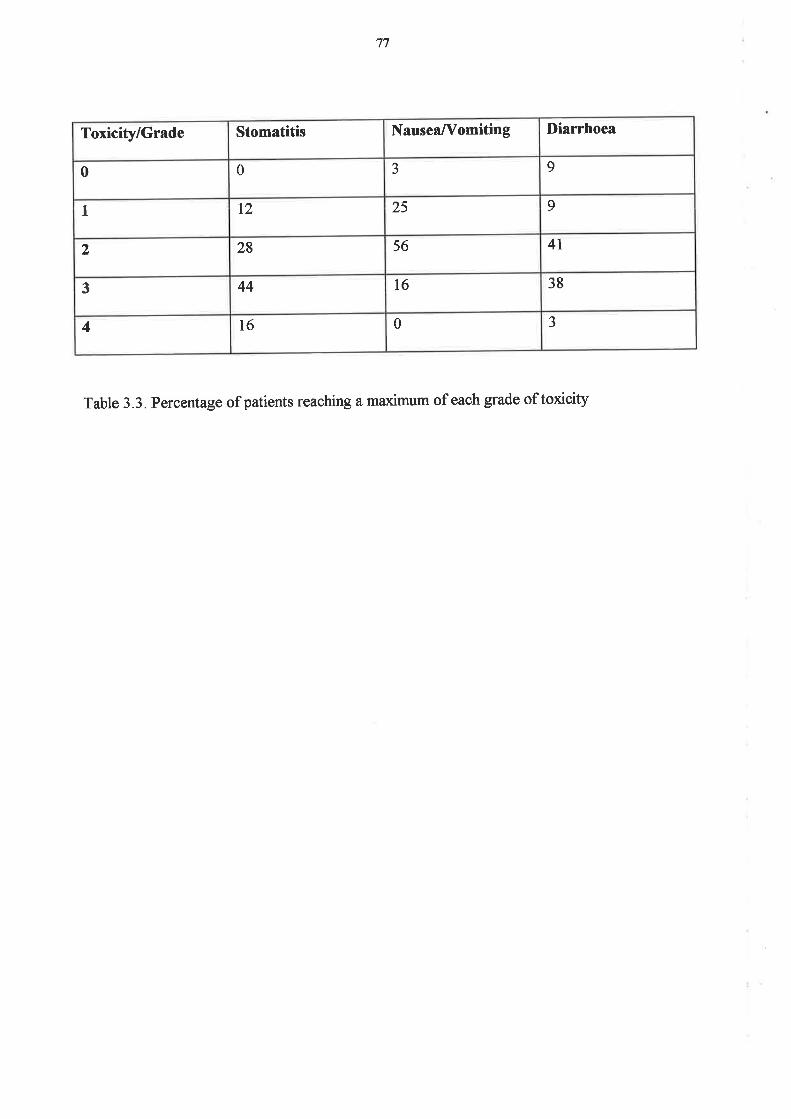
77
Table 3.3. Percentage of patients reaching a marimum of each grade of toxicity
Toxicity/Grade Stomatitis Nausea/Y'omiting Diarrhoea
0 0 J 9
t t2 25 9
2 28 56 4t
3 44 t6 38
4 16 0 J
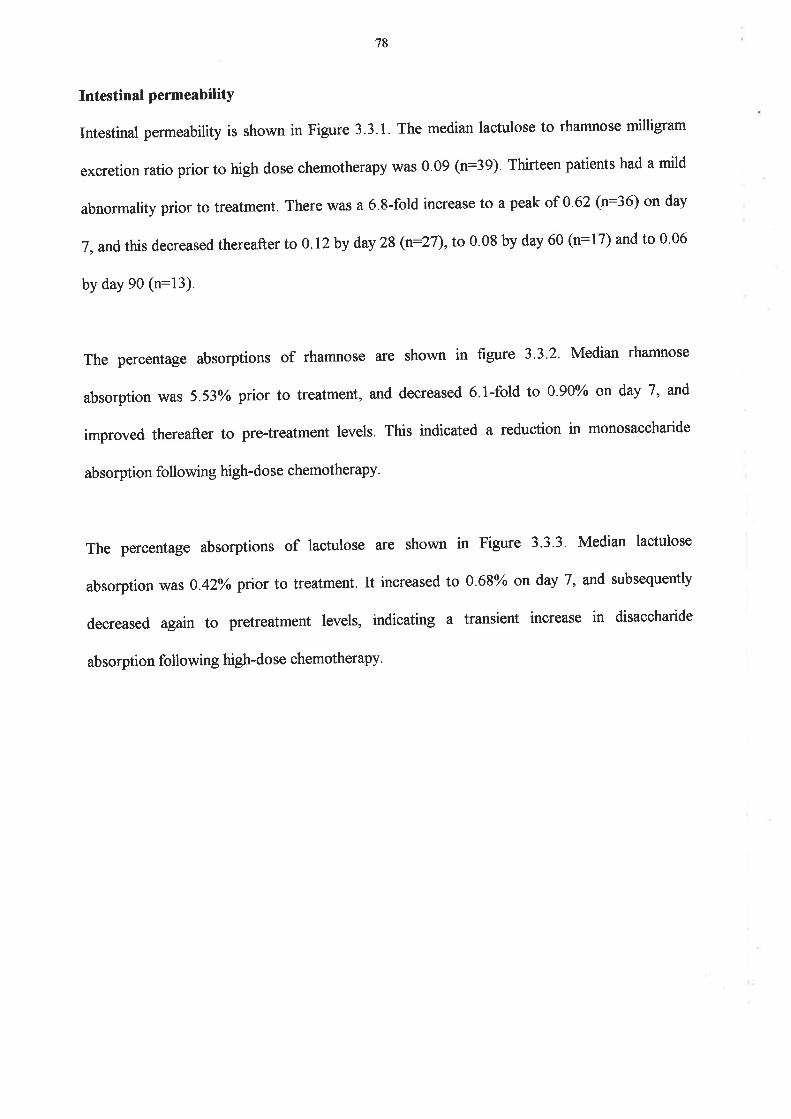
78
Intestinal permeabilitY
Intestinal permeability is shown in Figure 3.3.1. The median lactulose to rhamnose milligram
excretion ratio prior to high dose chemotherapy was 0.09 (n:39). Thirteen patients had a mild
abnormality prior to treatment. There was a 6.8-fold increase to a peak of 0.62 (n:36) on day
7, andthis decreased thereafter to 0. 12by day 28 (n:27),to 0.08 by day 60 (n:17) and to 0'06
by day 90 (n:13).
The percentage absorptions of rhamnose are shown in figure 3'3'2' Median rhamnose
absorption was 5.53% prior to treatment, and decreased 6.1-fold to 090yo on day 7, and
improved thereafter to pre-treatment levels. This indicated a reduction in monosaccharide
absorption following high-dose chemotherapy.
The percentage absorptions of lactulose are shown in Figure 3.3.3. Median lactulose
absorption was0.42Yo prior to treatment. It increased to 0.68% on day 7, and subsequently
decreased again to pretreatment levels, indicating a transient increase in disaccharide
absorption following high-do se chemotherapy.

79
P<0.0001
25p<0.000'l
P=0'0o1
ÈoaloEoCL
õcato
1
Ioooo
o
ooo
2
.5
go
&
7Pre
0.5
o
o
o
1go
o
+-o
o
0
o
28 60
Days from stem cell infusion
90
Urinary lactulose to rhamnose permeability ratio in patients receiving high-dosechemotherapy and autologous blood stem cell transplantation. Data are given as
individual values and the median value is indicated by a bar. P values are shownfor the differences between pre and post chemotherapy values.
Fig.3.3.1

80
I
sc.9(¡¡
(,xoq)atocEG'
.È,É
15
12
6
oo
o
8
IoI
e
I+
oo
oo
o
8ooo
o
o
Ioooog
eoooog
-+o
oB
g
to
oooooog
Io
-È¡-ðx
+
oo
Io
B
oo
o
3
0
Io
IPre 7 28 60
Days from stem cell infusion
90
Urinary rhamnose excretion in patients receiving high-dose chemotherapy andautologous blood stem cell transplantation. Data are given as individual valuesand the median value is indicated by a bar.
Fiç.3.3.2
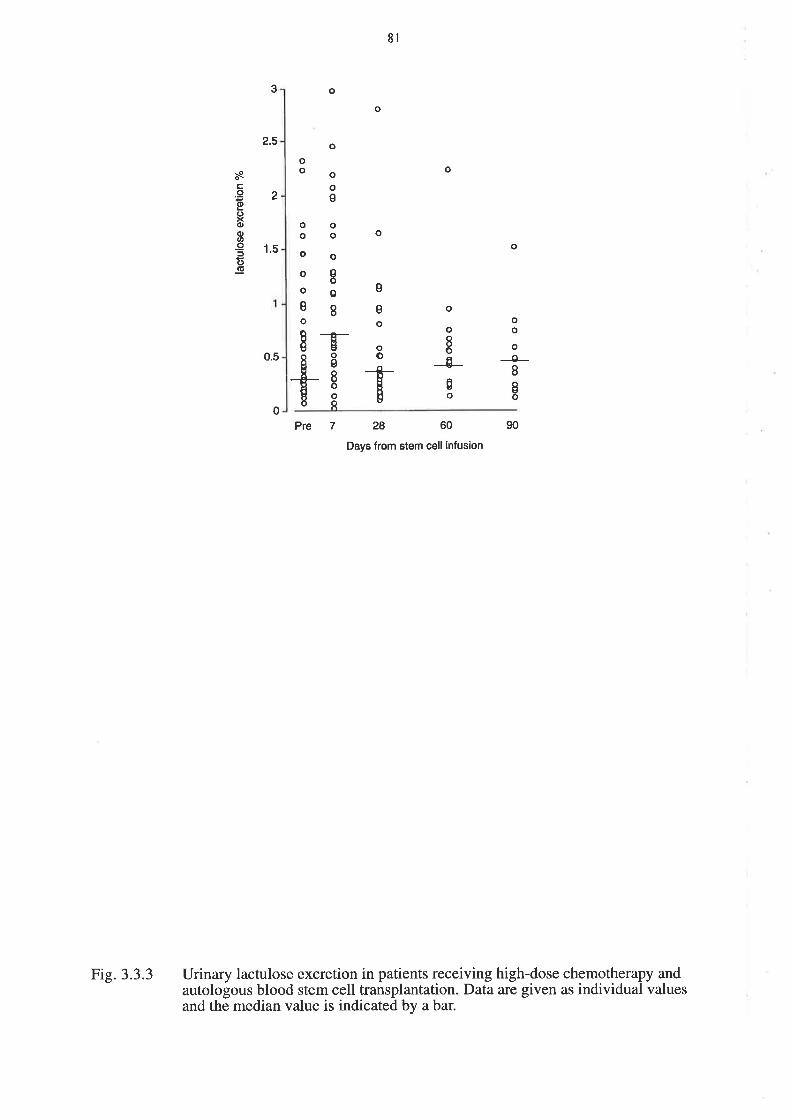
8l
3
2.5
o
o
oo
o
o
ooe
oo
o
sô0
8
osc.9(l)
C)xd)oat
-95(J(ú
2
1.5
0.5
oo
o
o
og
o
I
o
e
so
oo
o
o8og
0o
oo
oT-os8ooI+
-0-r IIô
0Pre 7 90
Urinary lactulose excretion in patients receiving high-dose chemotherapy andautologous blood stem cell transplantation. Data are given as individual valuesand the median value is indicated by a bar.
28 60
Days from stem cell infusion
Fig.3.3.3

82
3.4 DISCUSSION
The gastrointestinal tract is particularly vulnerable to the side-effects of chemotherapy
presumably because of high physiological cell proliferation and turn-over (180;181). Intestinal
mucosal damage is traditionally documented by biopsy either by upper gastrointestinal
endoscopy or by a Crosby capsule (74). Both of these procedures may be hazardous in patients
after chemotherapy and autologous blood stem cell transplantation because of low platelet and
white cell counts. However, Forbes (86) was able to safely perform upper endoscopy at 30
days after transplantation, and found a large number of unsuspected gastrointestinal lesions-
This and another study (182) investigated allogeneic bone maffow transplantation, but graft
versus host disease or inadiation may confound interpretation of any findings. We were
interested in this study in applying the non-invasive test of sugar permeability as a way of
assessing intestinal damagein patients receiving high-dose chemotherapy and autologous blood
stem cell transplantation.
We showed that the non-invasive intestinal sugar permeability test was well tolerated. The only
problem was a transient taste aversion in some patients. In part this could have been due to the
hyperosmolar test solution containing glucose. A mild abnormality of intestinal permeability
was present in some patients prior to high-dose chemotherapy. This could be due to the effects
of the malignancy, subclinical malnutrition, or due to prior chemotherapy. One patient had
high-dose chemotherapy as first ever chemotherapy, and, interestingly, she had normal
permeability before treatment. The other patients had all had at least one cycle of
chemotherapy before the present high dose treatment.

83
The maximum sugar permeability abnormality occurred at 7 days after stem cell infusion
(which is 14 days after the start of chemotherapy), and returned to normal by 28 days after
stem cells (35 days after chemotherapy). The ratio continued to decline until day 90. This
abnormality corresponded with the period that patients \ryere unwell from anorexia, nausea and
other gastrointestinal symptoms.
Analysis of the two components of the sugar permeability test elucidated the cause of the
heightened permeability. One reason was a 62Yo increase in median lactulose permeability
presumably through loss of integrity of the mucosal barrier constituted by tight junctions
between epithelial cells. However, the second reason for increased permeability was an 84Yo
decrease in median rhamnose permeation impþing a lowered intestinal surface area for nutrient
absorption. As permeability is a ratio of lactulose to rhamnose absorption, it will be increased
by either an increased lactulose absorption or a decreased rhamnose absorption'
The prolonged period of increased permeability suggested that the damage was not purely due
to a direct toxic effect of the chemotherapy on the mucosa, but rather there was also an
indirect, prolonged component. Direct enterocyte damage would be expected to be present for
the life-cycle of one cohort of enterocytes, and thus should have resolved by 48-72 hours'
Studies in the rat after methotrexate have shown that there is a direct toxic effect resulting in
mucosal hypoplasia, but also that this is followed by a rebound hyperplasia (67), indicating an
indirect component in this animal model. Studies of the effects of methotrexate on the human
small intestine by Trier (65), showed a transient reduction in crypt cell mitoses for 48 hours
after methotrexate administration, followed by a return to baseline or higher by 96 hours'

84
smith (74) also showed a transient reduction in crypt cell mitoses after chemotherapy using
various cytotoxic drugs. The abnormal permeability lasts for longer than these changes'
The severity of the permeability defect was similar to that seen in untreated coeliac disease'
where the increased lactulose/rhamnose mi[igram excretion ratio correlates with villous
atrophy on duodenal biopsy. This suggests there may be a similar abnormality of villous
atrophy at least transiently in the small intestine after chemotherapy' The flow rate of fluid
through the sman intestinar mucosa may also be important in determining the permeability as a
high fluid flow rate leads to reduced permeability ratio (183). Chemotherapy could have
transiently decreased fluid flow through the small intestinal mucosa'
The advantages of the sugar permeability test are that it is non-invasive, well tolerated' and can
be repeated sequentialþ. It is an objective measure of small intestinal permeability' and could
be used to test the efficacy of future interventions'

85
CHAPTER FOUR
AN INVESTIGATION INTO ABDOMINAL AND ORAL SYMPTOMS AND SMALL
INTESTINAL FUNCTION FOLLOWING CYTOTOXIC CHEMOTHERAPY
4.1 INTRODUCTION
There is an increasing bo<ly of literature concerning mucositis following cytotoxic
chemotherapy, although much of this pertains to the oral mucosa. The relative frequency and
duration of oral and gastrointestinal symptoms has not been properþ investigated, nor have
these symptoms been related to functional nor histological changes in the small intestine. The
first study of mucositis after high-dose chemotherapy showed a peak abnormality of symptoms
and permeability after 14 days, but only weekly and monthly intervals were investigated. The
question also arises of any effect of standard dose chemotherapy, and whether the tumour itself
causes abnormalities in the mucosa. In contrast to the previous study, an isosmolar sugar
solution was used to increase palatability.
The aims of this second study were to assess the frequency, duration and severity of oral and
gastrointestinal symptoms, and nutritional changes, following chemotherapy; to measure
functional changes in the small intestine using serum endotoxin levels and sugar permeability;
to assess bacterial overgrowth and small intestinal transit time using a combined tnc-D-*ylose
and lactulose breath hydrogen breath test; to compare all these parameters in a group of
patients before and after chemotherapy, thus using each subject as his own control; and to
analyse the subjects for any age, sex, disease or treatment effects.

86
4.2 METHODOLOGY
Patient selection
All patients referred to the Department of Haematology/Oncology at The Queen F,lizabeth
F{ospital in Woodville, South Australia, with newly diagnosed malignancy, \¡r'ere eligible as
were all patients undergoing high dose chemotherapy and autologous peripheral blood stem
cell transplantation. The study was approved by the Ethics of Human Research Committee at
The eueen Elizabeth Hospital and was carried out in accordance with the Declaration of
Helsinki. Informed consent was obtained from each patient prior to enrolment in the study. A
total of sixty patients was recruited, with ten of these undergoing breath testing.
There was no age exclusion and both males and females \ryere eligible. Patients with pre-
existing benign or malignant gastrointestinal disease were excluded. This included patients with
inflammatory bowel disease, coeliac disease, infectious enteropathies, gastric or small bowel
malignancy. Colon cancer, however, was not an exclusion criterion. Patients were excluded if
they were unwilling to participate. Patients were withdrawn from the study at their own
request, or if they were unable to comply with the trial protocol. Unlike the previous study
(Chapter 3), insulin dependent diabetes was not an exclusion criterion, as the sugar solution no
longer contained glucose.

87
Subjects were initially split into three groups according to the intensity of dose of
chemotherapy given. The groups were
l. standard dose chemotheraPY.
2. ltrghdose cyclophosphamide priming (for stem cell harvesting).
3. high-dose chemotherapy and autologous blood stem cell transplantation.
In the final analysis, however, the two higher dose groups were combined' as there were no
significant difrerences between them, and their combined number was half of the study
population. Diseases were grouped into solid tumouÍs verflts haematological malignancies.
Age was split into <45 verws )45, as the median age was 45 years.
The patient population here contrasts with the previous study (Chapter 3), where all patients
were having high-dose chemotherapy with stem cell transplant, and all patients but one had had
previous chemotherapy. The current group of patients includes those receiving standard dose
chemotherapy as first ever chemotherapy, which enables the ef[ects of chemotherapy to be
distinguished from those due to the disease itself.
Methods
patients were studied prior to receiving chemotherapy, and at 3,7,70, 14 and 28 days after
starting chemotherapy. All patients underwent a nutritional assessment, completed a symptom
questionnaire, performed an intestinal sugar permeability test (ISPT), and underwent blood
testing for serum endotoxin on six occasions. A subset of patients had breath tests performed
prior to chemotherapy, and 10 and 28 days after chemotherapy. See Table 4.2.1'

88
Tíme Pre 3 7 10 14 28
Questionnaire
ISPT
Nutrition
Endotoxin
Breath Test
TABLE 4.2.1 Summary of tests performed. All sixty patients underwent the first four tests,
with a subset of ten undergoing breath tests.
{
{
{
{
{
{
{
{
{
{
{
{
{
{
{
{
{
{
{
{
{
89
4.21 Assessment of nutrition and symptoms
Nutritional assessment
The patients underwent nutritional assessments on six occasion , corresponding with the other
tests, namely: before chemotherapy and 3,7,10, 14 &' 28 days after chemotherapy' The tests
performed were body mass index (BI\fl), mid-arm muscle circumference' lymphocyte count'
albumin, senrm transferrin, and serum and red blood cell folate' This selection of tests was
chosen because no single measure gives a good representation of nutritional status' BMI can
be affected by fluid gains or losses. Lymphocyte count falls due to loss of production in the
bone marrow following chemotherapy. Transferrin is an acute phase protein, and albumin can
be affected by protein losing states. Folate can be affected by dietary intake'
Symptoms
At each of the study times, the patients filled in a symptom questionnaire' which was designed
to assess oral and gastrointestinal mucositis. The first twenty-seven patients filled in the bowel-
only questionnaire, but the second thirty-three patients had the added oral-relevant questions.
The questionnaire is shown in Figure 4.zr.r. As there was no suitabre questionnaire available
in the published literature, a questionnaire was devised to provide the specific information that
was required. Patients were either free to answer the questionnaire by themselves' or with the
assistance of one of the triar investigators. The questions concerning normal consistency and
normal frequency of bowel motion were repeated at each visit, thus providing information
regarding the reliability and repeatability of answers. There was very high repeatability' The
questionnaires enabled determination of grade of mucositis according to the NCI common
toxicity criteria. see Table 4.2r.2. An overall score was allocated to each patient for
. gastrointestinal toxicity
" atrd each individual toxicity was recorded'

90
Please answer the following questions.
Name: Unit Record Number:
Date of chemotheraPY:
In the last24 hours have you had any of the following?
L. Abdominal Pain!Yes
If yes, was it lsharp !¿utt
f]continuout Eintermittent
lrelieved by opening bowels lnot relieved'
Pain lasted f]seconds lminutes Ehours
XNo
2. Abdominal Bloating !Yes
3. Btood in bowel motion
4. Mucus in bowel motion !ves
es
nNo
ENo
nNo
IIow many times have you had your bowels open in the last 24 hours?
lo nr-¡ Aq-o I;-g ltqHow many times per day is normal for you?
n.r nr-¡ Jq-a Zt-g
What was the consistencY?
lwatery lloose [semi-formed
What is normal for you?
f]watery - lloose Esemi-formed
Have you been up at night to have your bowels open?
Have you had any accidents/incontinence?
nformed [trard
lformed lhard
!ves
!yes
o
Euo

9l
(added after patient27)
IN THE LAST 24 HOURS:
Have you had any mouth Pain? [Yes nNo
If yes, was it nmif¿ lmoderate lsevere
Were you able to leat + drink n¿¡nt otrty lnot eat nor drink
Do you have any mouth ulcers? lYes nNo
Have you had any nauseaZ nYes ENo
If yes, were you able to eat lnormalþ na small amount
nNo
l0
Have you vomited in the last24 hours? f]Yes
If yes, how many times?
!r Az-s
Enot eat
ntto
Figure 4.Zl.L Chemotherapy and the small intestine: symptom questionnaire' All sixty patients
answered the first page, with the last 33 patients answering the second page'

Grade 1 2 3 4
Nausea able to eat
reasonable intake
intake
significantly
decreased,
but can eat
no significant
intake
Vomiting
episodes
per 24
hours
I 2-5 6-10 >10 or needs
parenteral support
Diarrhoea increase of 2-3
stools per day
over pretreatment
increase of4-6
or nocturnal
stools
or moderate
crampmg
increase of 7-9
or incontinence
or severe
crampmg
increase of >9
or gross blood
or need for
parenteral support
Stomatitis painless ulcers,
erythema/
mild soreness
painful erythema,
oedema or ulcers
but can eat
painful erythema,
oedema or ulcers
and cannot eat
requires
parenteral
or enteral support
92
Table 4.21.2 Assessment of mucositis using the NCI common toxicity criteria. These criteria
measure toxicity on a scale of 0 to 4,with I being mild and 4 being life-threatening.

93
Where common toxicity criteria do not apply, or in case of concomitant diseases use the
following score:
score 1 score 3 score 4
mild severe life-threatening
94
4.22 lntestinal sugar permeability test
A double sugar permeability test with lactulose and rhamnose l¡/as used in this study' A third
sugar, glucose, was used in the high-dose chemotherapy study (Chapter 3) in order to place an
osmotic stress on the tight junctions, which increases the sensitivity of the test, by increasing
the likelihood of an abnormal lactulose absorption being detected' It also, however, made the
solution very sweet, and some patients found this unpleasant after chemotherapy. In this study,
therefore, an isotonic solution, without the glucose' was used' This was better tolerated' but
had the disadvantage of reducing sensitivþ (see Result 4.32 below)'
After an overnight fast, with water being allowed throughout, the patient was given a solution
of sugars to drink. This comprised 59 lactulose and 19 rhamnose in 100 ml water (isotonic
sugar solution). All urine was collected for the next 5 hours, the total volume was recorded'
and alg rnl aliquot was stored for later analysis, by high performance liquid chromatography'
In the high-dose chemotherapy study, we used a method of HPTLC to assay the urine for
sugars, as described in Chapter 3, but in this study, we changed to the modified I{PLC method
as described by Miki (32).The change occurred due to an improvement in technique in the
laboratory. The methodology of Miki uses an amine-modified silica column and refractive
index detection. The normal range for a paediatric and adolescent population was 0'047 +/-
0.018. A group of healthy adult controls had a similar range. The patient preparation, sugar
ingestion and urine collection procedures were the same as for the IÌPTLC'

95
4.23 Endotoxin assay
Endotoxin, which is produced by gram negative bactena, is normally present in the colon, and
possibly in the small intestine in the presence of bacterial overgrowth. It is generally unable to
cross an intact mucosal barrier to enter the blood stream. Small amounts of endotoxin manage
to enter the blood, are cleared in the liver and are not normally detectable. However, in the
presence of mucosal barrier breakdown and malfunction, sufficient endotoxin may cross the
intestinal barrier to overwhelm the hepatic clearance mechanisms and circulate in the peripheral
blood. This could be a potential source for the increased systemic infection which occurs in the
presence of mucosal barrier failure.
Serum was collected on all patients prior to chemotherapy and then at 3,7, lO, 74 and 28 days
after chemotherapy. Blood was collected into sterile, pyrogen-free tubes. It was centrifuged at
2000 revolutions per minute for l0 minutes, and the supernatant was transferred in a sterile
manner into pyrogen-free glass tubes. Specimens were frozen at '20o Celsius until assayed.
They were batched for ease of assay.
Specimens were assayed using the Bio Whittaker QCL-1000 Chromogenic Limulus
Amebocyte Lysate (LAL) test kit (Bio Whittaker, Walkersville, MD, USA). The use of LAL
for the detection of endotoxin is a result of the discovery by Bang (ls4) that a gram-negative
infection of Limulus polyphemus, the horseshoe crab, resulted in faØl intravascular
coagulation. The LAL method utilises the initial part of the LAL endotoxin reaction to activate
an enzyme which in turn releases p-nitroaniline from a synthetic substrate, producing a yellow
colour

96
Gram-negative bacterial endotoxin catalyses the activation of a proer4fme in the LAL. The
initial rate of activation is determined by the concentration of endotoxin present. The activated
enr*eoatalyses the splitting of p-nitroaniline (pNA) from the colourless substrate Ac-ile-Glu-
Ala-Arg-pNA. The pNA released is measured photometrically at 405-410 nm after the reaction
is stopped. The correlation between the absorbance and the endotoxin concentration is linear in
the 0.1-1.0 EU/ml range. The concentration of endotoxin in a sample is calculated from the
absorbance values of solutions containing known amounts of endotoxin standard. So the
chromogenic LAL test is a quantitative test for gram-negative bacterial endotoxin. Prior to
assaying, serum specimens were diluted I in 10 and then heated to 70'C to remove the non-
specific inhibition that occurs in serum. Ten specimens from untreated volunteers were also
assayed as controls. After the calculation of endotoxin concentration from a standard curve,
results were multiplied by 10 to correct for the initial dilution.
4.246reath testing: combined lactulose breath hydrogen and laC-D-xylose breath test
A subset of ten patients underwent breath testing prior to chemotherapy, and 10 and 28 days
after chemotherapy. The breath tests comprised a combined lactulose breath hydrogen test and
a toc-D-*ylose breath test, looking for changes in oro-caecal time and for the presence of
bacterial overgrowth.

97
4.24.1Test principles
Lactulose breath hydrogen
The hydrogen (É{2) breath test is based on the bacterial fermentation of unabsorbed
carbohydrate within the body. Hydrogen is one of several gases produced by bacterial
carbohydrate fermentation, and a portion of this hydrogen is absorbed into the blood stream
and expired through the lungs. It is measured using a Quintron Microlyzer (Endomed Pty Ltd)
which measures hydrogen in parts per million in expired and dried air. Apositive result for the
lactulose breath test is a rise in hydrogen of >10 ppm between 66 and 132 minutes post
loading. Lactulose is not normally broken down in the small intestine, and an earþ rise in
expired hydrogen following ingestion of a lactulose load is either due to abnormal fermentation
of lactulose within the small intestine due to bacterial overgrowth, or to the arrival of the
lactulose at the caecum, as lactulose is broken down in the large bowel. In the absence of
bacterial overgrowth , an early rise in expired hydrogen implies a reduction in oro-caecal transit
time. Small bowel bacterial overgrowth is indicated by a high baseline þ, two Hz peaks due to
lactulose being fermented before it reaches the colon, or one peak in which the Hz produced
from overgrowth within the distal ileum may merge with Hz produced by colonic flora. If no
rise in Hz occurs within 3 hours, either the patient has not been properly prepared for the test,
or the patient is not colonised by Hz-producing bacteria, or the patient has a very slow oro-
caecal transit time. Oro-caecal transit time is important for drug absorption (185). Longer
transit times are associated with later peak methotrexate concentration and a more erratic
profile with two peaks. Both fast and slow transit reduce peak methotrexate concentration.
98
laC-D-xylose breath test
The rac-D-xylose breath test is based on the catabolism of xylose by intestinal bacteria, which
are normalþ found only in the large, but not the small, intestine. The catabolism products of
toc-D-xylose include toc-labeued bicarbonate, which is absorbed into the blood stream and
expired as taCarbon dioxide lraCOz) Increased levels of raCO, over a 4 hour period indicate
small bowel bacterial overgrowth or reduced oro-caecal time.
4.24.2 MethodologY
Patient preparation: The patients were asked to refrain from taking oral antibiotics and
bowel clean outs for one month prior to the test. For 24 hours before the test they refrained
from eating food high in carbohydrates, food containing bacterial culture or food with yeast'
They fasted from midnight the night before the test, taking no medication on the morning of
the test. Smoking was not allowed for 2 hours before the test, nor during it'
Test Procedure: At the start of the test, the patient was asked to exhale into a collection bag
through the mouthpiece assembly, which discarded the dead-space air' This collected air was
then used for hydrogen analysis. The patient was then asked to exhale deeply through a
polyethylene tube into a collection mixture, which turned from blue to clear when the required
amount (2 mmol) of carbon dioxide was collected. This was then used for the t4c-D-xylose
estimation.

99
The patients drank the test solution, and this time was recorded as time zero. The test solution
comprised 90 rnl distilled water, 10 rnl lactulose, 5 pCu toc-D-xylose, and 1 g D-xylose'
samples were then collected at 30, 60, g0,120, 180 and 240 minutes after ingestion of test
solution, and analysed together at the conclusion of the test. The patients remained at rest
throughout the procedure, andwere free to eat and drink when it was complete'
4.24.3 Result analysis
Lactulose breath hydrogen: After calibration of the Microþer, 50 ml samples of expired air
were withdrawn from the sample bags, via a closed system, and injected, via a drying column,
into the Microþer. Hydrogen concentration in ppm was then read from the display'
laC-D-xylose breath test: At the conclusion of the test, 4 mls of PCS (phase combining
system) was added to each vial, and the vials were left in the dark overnight, to reduce
chemiluminescence. Vials were placed in the scintillation counter, and the toc was counted.
The quench correction was applied to yield sample activþ in disintegrations per minute
(DpM) DpM were expressed as a percentage of administered dose per mmol COz bY 104. The
sum of the individual time points represents the cumulative excretion over the 4 hour period,
and the normal cumulative result is <70. For an example of typical bacterial overgrowth and
normal curves, see APPendix (I)

100
4.25 STATISTICAL ANALYSIS
The statistical analysis was carried out using a repeated measures analysis of variance, because
there was a sequence of, observations from the same person over time: pre-chemotherapy, day
3, day 7, day 10, day 14 and day 28. Because there was a pre-treatment measure, the data were
transformed by subtracting the initial value from each of the post-treatment values (new value
at time t : old value at time t minus value at t0) so that each subject acted as his own control,
and this differencing operation removed the person effect, leaving a measure of what the
treatment alone did. All variables have been analysed as a function of age, sex, diagnosis,
treatment group and time. Treatment group, diagnosis, and sex were used as grouping factors.
Time course is a within-factor subset of time, for which we used a linear representation. Age is
a covariate. The presence of a sequence of numbers gives a potential for correlation to occur,
so that the measurement at day 7 is likely to be related to that at day 3, and the measurement at
day l0 is likely to be related to that at day 3, but less so. This increased distance with time is
known as an autoregressive error structure, and this has been taken into account during the
anaþsis.
Only significant differences, and important negative results are presented. All other results are
not significant at the p:0.02 level. A p value of <0.02 has been used throughout this analysis
because of the large number of tests overall, the large number of analyses, and the need for
estimation around missing values. A p value of < 0.02 is strong evidence of significance.
101
The statistical program used was Program 5.V (unbalanced repeated measures) from
BMDP statistical software package (186). Statistical analysis was carried out by Mr. Phil
Leppard, Statistical Consultant, Department of Statistics, University of Adelaide.
Analysis of individual cases has not been performed so that we cannot predict whether the
presence of symptoms in a particular case implies the presence of functional changes. The same
applies for histological changes (See Chapter 5). Symptoms, function and histology do
however appear to be related because they each have the same pattern of change with time. In
this analysis group effects have been assessed.

toz
4.3 RESULTS
4.30 Patient demographics
Sixty patients were recruited for this study. Ten patients underwent Breath Testing. The
diseases were as shown in Table 4.30.1
There were 31 males and 29 females, with 19 haematological malignancies and 4l solid
tumours. The age raîge was 18 to 77 with a median of 45 years. There were 29 patients in the
standard chemotherapy dose group, 12 inthe high dose cyclophosphamide priming group, and
19 in the high dose chemotherapy and stem cell transplant. Thus the patients were evenly
divided between standard and high dose chemotherapy (which included high dose
cyclophosphamide priming). No patients in the standard dose treatment group had had prior
chemotherapy, so that any abnormalities found on pre-treatment evaluations were likely due to
the malignancy itself. The staging was as shown in Table 4.30'2

103
DIAGNOSIS NUMBER OF PATMNTS
Breast Cancer 22
Small Cell Lung Cancer 4
Non-Small Cell Lung Cancer 4
Non-Hodgkins LymPhoma 9
Testicular carcinoma 2
Hodgkins disease J
Oesophageal carcinoma )
Colorectal carcinoma 4
Chronic myeloid leukaemia 2
Bladder carcinoma I
Acute Myeloblastic leukaemia J
Chronic lymphocytic leukaemia I
Osteosarcoma 2
Multiple Myeloma I
TOTAL 60
Table 4.30.1Number of patients by diagnosis

104
Stage Number of Patients
I J
2 21
3 9
4 20
unknown 7
TOTAL 60
Table 4.3o.2Number of patients by stage of disease. All malignancies are staged from I to 4,
with stage I being localised disease, and stage 4 being metastatic disease' Leukaemias are all
stage 4 by definition.
105
4.31, Nutrition and symPtoms
Nutrition
Ninety-four percent of potential nutritional results were available prior to chemotherapy,
droppingtoS0%onday 3,T7Yoonday 7,72yøonday 10,67yoonday 14and65Yoonday28.
No patient was malnourished prior to starting chemotherapy in this study. Anthropomorphic
measurements revealed a difference with dose of chemotherapy: patients receiving standard
dose chemotherapy showed no changes, but patients on high dose chemotherapy showed a loss
of weight and consequently of body mass index (Blvtl) following treatment. See Figures
4.37.7. and 4.31.2. Weight fell from a mean of 73.7 kg pre-treatment by 0.6 kg on day 3
(p:0.004) and by 0.9 kg on day 14 (p:0.0004), and returned to normal by day 28. There was
no age, sex nor diagnosis effect. BMI fell from a mean of 25.8 pre treatment by 0.2 at day 3
and by 0.3 at day 14 before recovering by day 28. Triceps skin fold thickness had a negative
displacement of 0.2 from a baseline of 1.58 (p:0.002), and this did not recover. See Figure
4.31.3. However, there was no corresponding change in mid-arm muscle circumference. Once
again there was no age, sex, diagnosis nor treatment group ef[ect. The lines shown on the
graphs of the analysis of repeated measures, are the lines of best fit, representing the closest
linear approximation to the actual results. They convey an overall impression rather than give
each individual result for the sixty patients.

106
Change in weight following high dose chemotherapy
Time (days from start of chemotherapy)I
0 3 710 14I
28
E.9 o.oo
=Ê
Ë -0.4
(EoLE -o.Bo.EoL
i -1.2
E)c(ú-co -1.6
P = 0.0004Pre-chemotherapyMean = 73kg
SD = 16.2
P = 0.0004
Analysis of repeated measures. Change in weight following high dosechemotherapy. Weight fell significantly by day +3, continued falling until day+14, but recbvered fully to baseline value by day +28. Standard dosechemotherapy had no effect on weight.
Fig.4.31.1

107
Change in body mass index following high dose chemotherapy
Time (days from start of chemotherapy)= 0.0ocI -0.1È(¡toÞ -o.20,LCLcb -0.3
oP -o.oG.Co
-0.5
3 710 14 28
P = 0.008 Pre-chemotherapy
Mean = 25.8
SD = 4.6
P = 0.008
Analysis of repeated measures. Change in body mass index (BMÐ followinghigh dose chemotherapy. BMI fell significantly by day +3, continued fallinguntil day +14, but recovered fully to baseline value by day +28. Standard dose
chemotherapy had no effect on BMI.
Fig.4.31.2

108
Ghange in triceps skinfold thickness following chemotherapy
Time (days from start of chemotherapy)0.00
I
0 3 't4 28
-0.05Pre-chemotherapyMean = 1.6cm
SD = 0.86
-0.15
-0.20
P = 0.002
-o.25
coE(ftoLoLCL
Eo
octtç(úEo
710
-0.10
Analysis of repeated measures. Change in triceps skinfold thickness (TST)following chemotherapy. TST is significantly reduced by day +3 and fails torecover by +28. There is no dose effect.
Fig.4.31.3
109
All patients showed a drop in lymphocyte count (See Figure 4.31.4), which did not return to
normal during the study. This occurred at both dose levels, in both sexes, with all diagnoses
and at all ages. A fall in lymphocyte count following chemotherapy is very common, as
chemotherapy affects the bone marïow directly. This fall in lymphocyte count therefore is
unlikely to reflect malnutrition, but rather reflects a direct effect on lymphocyte production by
the bone marrow. However, it would normally have been expected to have recovered by day
28. The continuing low value is probably a reflection of the wide range of values of
lymphocyte count (range 110-38,390 prior to treatment).
Albumin values fell in all treatment groups following treatment (p:0.000), with no dose
difference, and returned to baseline at day 28. There was no subgroup effect. (See Figure
4.31.5) Serum transferrin decreased in both treatment dose groups, but the fall was more
intense and more prolonged in the high dose chemotherapy group, with the standard dose
chemotherapy group returning to baseline by day L4 and the high dose chemotherapy group
only normalising by day 2g. (See Figure 4.31.6.) Red blood cell folate fell in all groups on day
3,by 78 units, and failed to recover by day 28 (See Figure 4.31.7). There was a sex difference
in serum folate that was maintained throughout, with males showing a rise following
chemotherapy, and females showing no change. (See figure 4'31' 8)'
In summary there were only mild, transient changes in nutrition, with more prominence in the
high-dose treatment group. There were no prolonged significant effects, nor any significant
malnutrition due to the tumours.

ll0
Change in lymphocyte count following chemotherapy
Time (days from start of chemotherapy)0
-500
1000
¿HtroEGoLoLCL
EoL
oct)cG-co
3 710 14 28
Pre-chemotherapy
Mean = 2324x10'6lmlSD = 5096
P = 0.02
-1500
Analysis of repeated measures. Change in lymphocyte count following _ ._
chemotherapy. Lymphocyte count is signihcantly reduced by day +3 and failsto recover by day +28. There is no dose effect.
Fig.4.31.4

lll
Change in plasma albumin following chemotherapy
Time (days from start of chemotherapy)0
-3
oõcoEGooCL
EoL
oEttr(ú
o
3 710 14 28
P = 0.005
-2Pre-chemotherapy
Mean = 40.4
SD = 3.8
P=0
Analysis of repeated measures. Change in plasma albumin following chemotherapy.Albu-min falls significantly by day +3, begins to recover by day +14 and has fullynormalised by day +28. There is no dose effect.
Fig.4.31.5

tt2
Change in serum transferrin following chemotherapy
Time (days from start of chemotherapy)o= 0.0G
c9 -o.2Eoo
E -0.4CL
Eorts -0.6oct)c(úEo -0.8
3
P = 0.0002
P=0
710P = 0.33
Standard dose chemotherapy
P=0
28
Pre-chemotherapyMean = 2.7gLSD = 0.6
-.'High dose chemotheraPY
Analysis of repeated measures. Change in serum transferrin followingchemotherapy. Serum transferrin falls significantly by day +3. In the standarddose group it has normalised by day +14, but in the high dose group it remainssignificantly abnormal at day +14, normalising by day +28.
Fig.4.31.6

113
Change in red blood cell folate following chemotherapy
Time (days from start of chemotherapy)
3
goE
c0) -tãEGoLE -40CL
Eo
-60oct)cG
õ -Bo
710 14 28
Pre-chemotherapyMean = 749nmol/LSD = 311
P = 0.007
Analysis of repeated measures. Change in red blood cell (rbc) folate followingchemotherapy. Rbc folate is significantly reduced by day +3 and fails torecover by day +28. There is no dose effect.
Ft9.4.3I.7

lt4
Change in serum folate following chemotherapy
15
10 P = 0.0007
5
o=õ+tCoE+,(¡toL
oCL
Eol-oct)c(ú
o
Male
3 710 14 28
0
-5
-10
o -P = 0.82 Female
Pre-chemotherapyMean = 15.1nmol/LSD = 13.8
Time (days from start of chemotherapy)
Analysis of repeated measures. Change in serum folate following chemotherapy.There is a sex related increase in serum folate following chemotherapy. Themale patients show a significant increase in serum folate at day +3 that doesnot recover by day +28. There is no change in females.
Fig.4.31.8
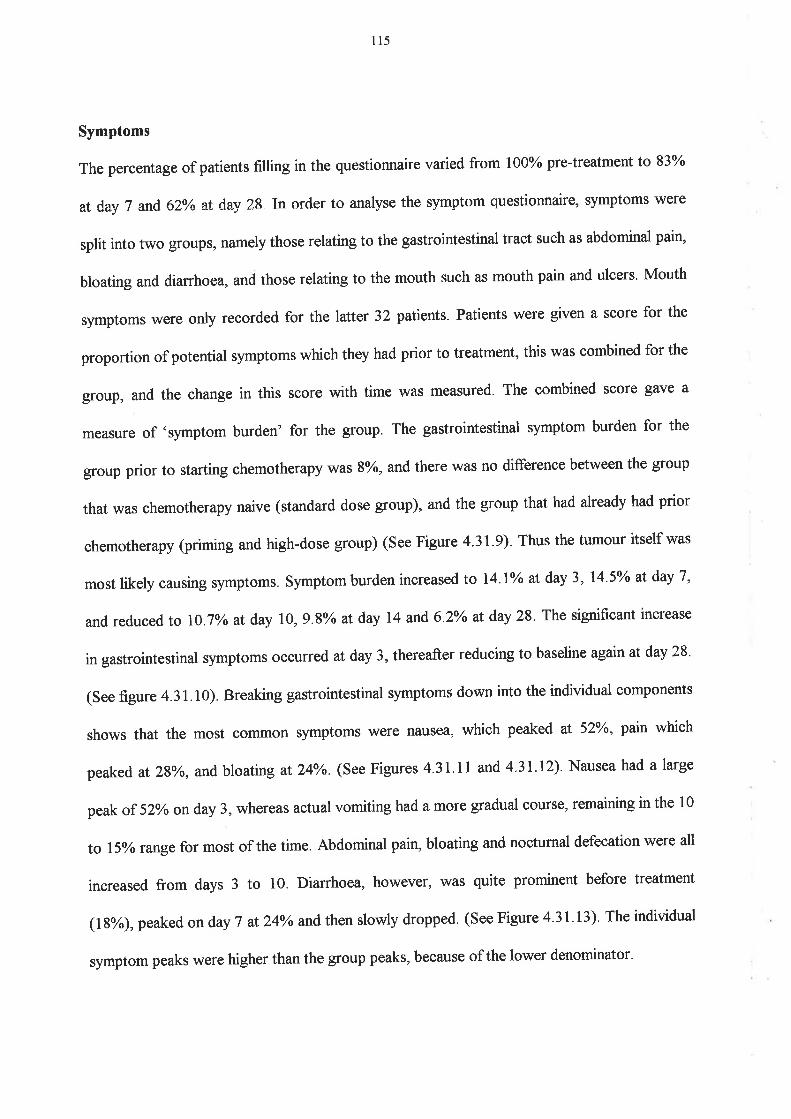
115
Symptoms
The percentage of patients filling in the questionnaire varied from 100% pre-treatment to 83%
at day 7 and 62Yo at day 28.In order to analyse the symptom questionnaire, symptoms were
split into two groups, namely those relating to the gastrointestinal tract such as abdominal pain,
bloating and diarrhoea, and those relating to the mouth such as mouth pain and ulcers. Mouth
symptoms were only recorded for the latter 32 patients. Patients were given a score for the
proportion of potential symptoms which they had prior to treatment, this was combined for the
group, and the change in this score with time was measured. The combined score gave a
measure of .symptom burden' for the group. The gastrointestinal symptom burden for the
group prior to starting chemotherapy was 8olo, and there was no difference between the group
that was chemotherapy naive (standard dose group), and the group that had already had prior
chemotherapy (priming and high-dose group) (See Figure 4.31.9). Thus the tumour itself was
most likely causing symptoms. Symptom burden increased to l4.7Yo at day 3, I45yo at day 7,
and reduce d to lo.|yo at day le, g.Byo at day 74 and 6.2Yo at day 28. The significant increase
in gastrointestinal symptoms occurred at day 3, thereafter reducing to baseline again at day 28'
(See figure 4.31.10). Breaking gastrointestinal symptoms down into the individual components
shows that the most common symptoms were nausea, which peaked af 52o/o, pain which
peaked at ZByo, and bloatin g rt 24yo. (See Figures 4.31. 1 I and 4.31.I2). Nausea had a large
peak of S1yoon day 3, whereas actual vomiting had a more gradual course, remaining in the 10
to l5yorange for most of the time. Abdominal pain, bloating and nocturnal defecation were all
increased from days 3 to 10. Diarrhoea, however, was quite prominent before treatment
eS%),peaked on day 7 at24Yo and then slowly dropped. (See Figure 4-31.I3). The individual
symptom peaks were higher than the group peaks, because of the lower denominator.

116
lncidence of gastrointestinal symptoms followingchemotherapy
15
10
3 7 10 14 28
Time (days from start of chemotherapy)
Analysis of repeated measures. Burden of gastrointestinal symptoms as afunction of time from starting chemotherapy.
20
ott)(E
coooo-
5
0
Fis.4.31.9

tt7
Change in incidence of gastrointestinal symptomsfol lowi ng chemotherapy
P = 0.002
Co
oCLoCLo.=oo(ú¡tEoL
oErc(ú-co
0.08
0.06
Pre-chemotherapyMean = 0.08SD = 0.1
P=0.9
004
0.02
000
-0.02
3 710 14 28
J
Time (days from start of chemotherapy)
Fig. 4.31.10 Analysis of repeated measures. Change in incidence of overall gastrointestinalsymptoms with time after chemotherapy. Each value is shown as a differencefrom the pretreatment baseline, with the line of best fit showing the trend,in this case showing a peak difference at day +3, returning to baseline byday +28.

118
lncidence of nausea and vomiting post-chemotherapy
-# Nausea----r---' Vomiting
..a- "' -' - " t' - " - "r- - - -
cttÊF- 60EoLoE40U'
=E30.C'=
20øco 't0
oCLits0os 03 710 14 28
Time (days from start of chemotherapy)
Fig. 4.3 1. 11 Incidence of nausea and vomiting following chemotherapy.

ll9
Gastrointestinal symptoms following chemotherapy
30EoCL
EoCo^o'v.lct)
.=
=9r^¿.9(úCL
oso
#***+
AbdominalpainBloatingNocturnal defaecationMucus in bowel motionBlood in bowelmotion
14 280 3 710
Days following start of chemotherapy
Fig. 4.31.I2 Incidence of individual gastrointestinal symptoms as a function of timefollowing chemotherapy.
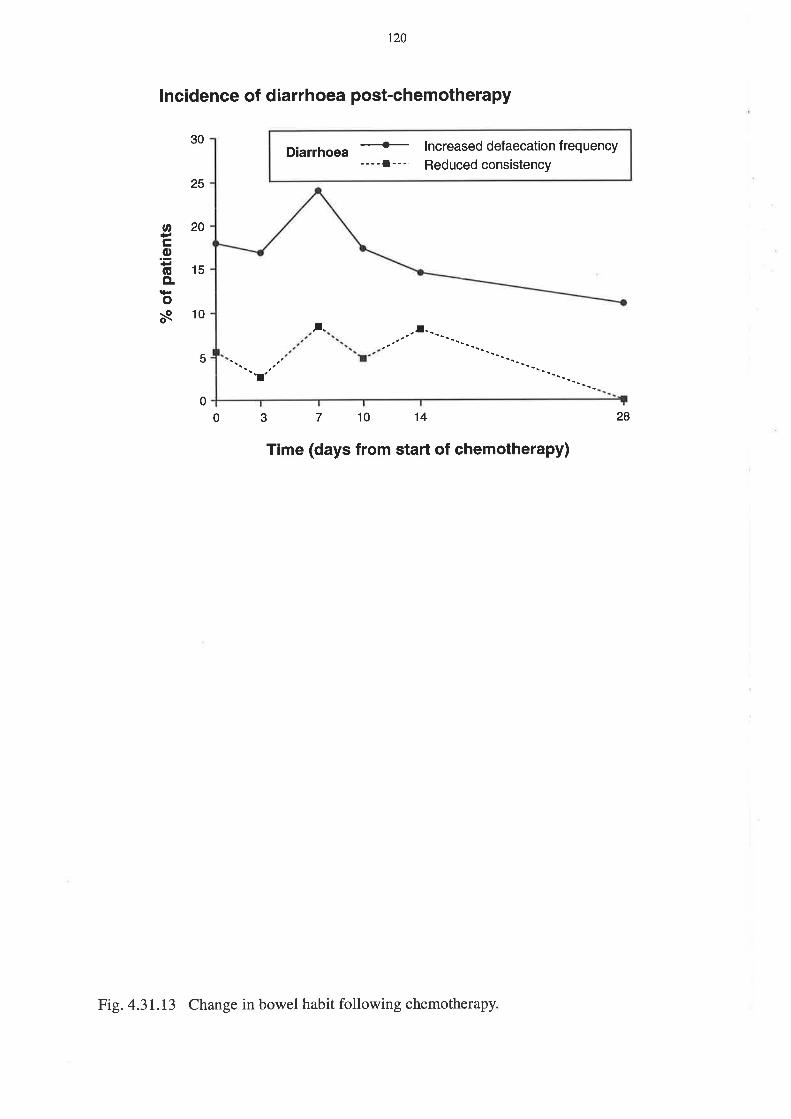
120
lncidence of diarrhoea post-chemotherapy
Diarrhoea*----l---
lncreased defaecation f requency
Reduced consistency
,.
30
25
20
15
10
5
"r
oCo(ECL
oñ
0
0 3 710 't4 28
Time (days from start of chemotherapy)
Fig. 4.31.13 Change in bowel habit following chemotherapy

t2l
Mouth symptoms were recorded in the latter thirty three patients, and showed a different
profile over time. Only 4o/oof patients complained of mouth symptoms before treatment, with a
more gradual increase to Ilo/a on day 3, 38Yo on day 7 a¡d 45Yo on day 10. Symptoms
decreased to 21Yo on day 74 and l3Yo on day 28. (see Figur e 4.3L.14)' The change in oral
symptoms frombaseline (See Figure 4.31.15) was the only parameter that did not follow the
trend to a peak abnormality at day 3, returning to normal by day 14 or 28, which was seen in
all the other areas of symptoms, function and morphology' The oral symptoms comprised
mouth pain and mouth ulcers, and as can be seen from Figure 4'31'16, mouth pain was more
prominent, rising to greater ihan60Yo on day 10 before falling to 20Yo on day 28, still high
when most other parameters had normalised. Actual ulceration was much less common,
peaking at 3lYo,but, interestingly, we did not see a chemotherapy dose effect in this study'
which we would have exPected.
In summary, gastrointestinal symptoms peaked from days 3 to 10, and recovered by day 28'
whereas oral symptoms did not increase significantly until day 7' then remained high until day
14, before returning to normal by day 28'
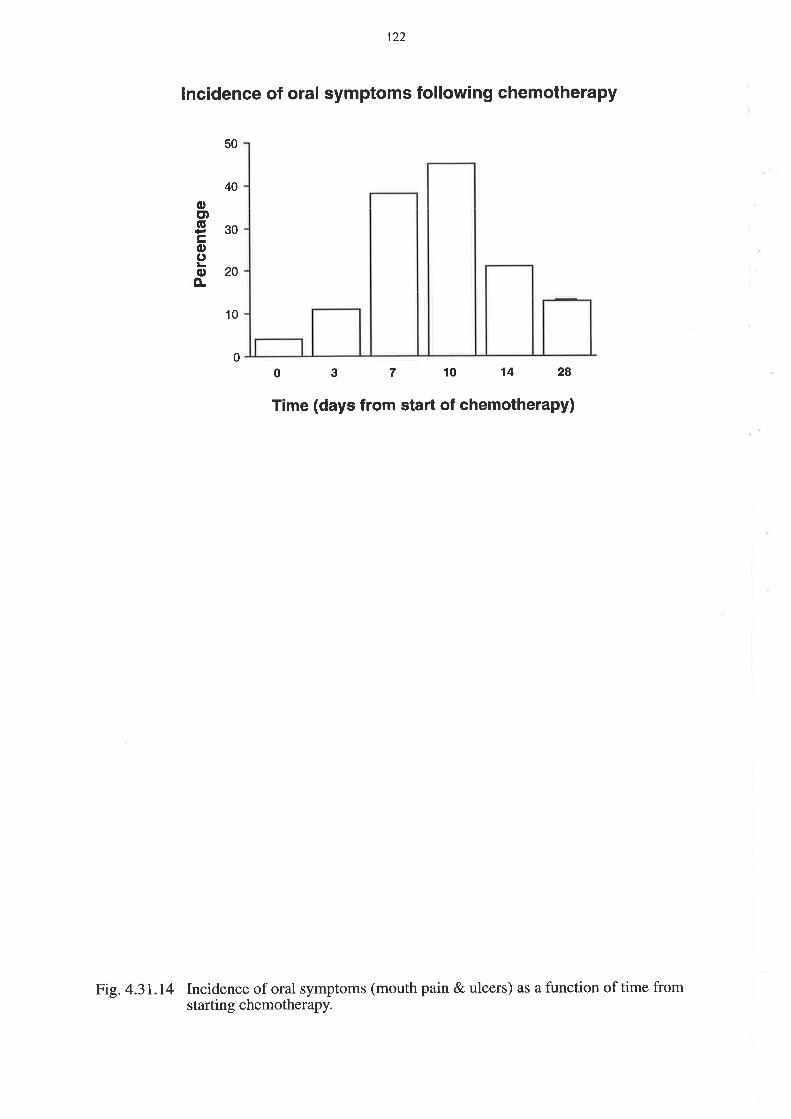
122
lncidence of oral symptoms following chemotherapy
10
3 7 10 14 28
50
40
octtg30cooo20È
00
Time (days from start of chemotherapy)
Fig. 4.31.14 Incidence of oral symptoms (mouth pain & ulcers) as a function of time fromstarting chemotheraPY.
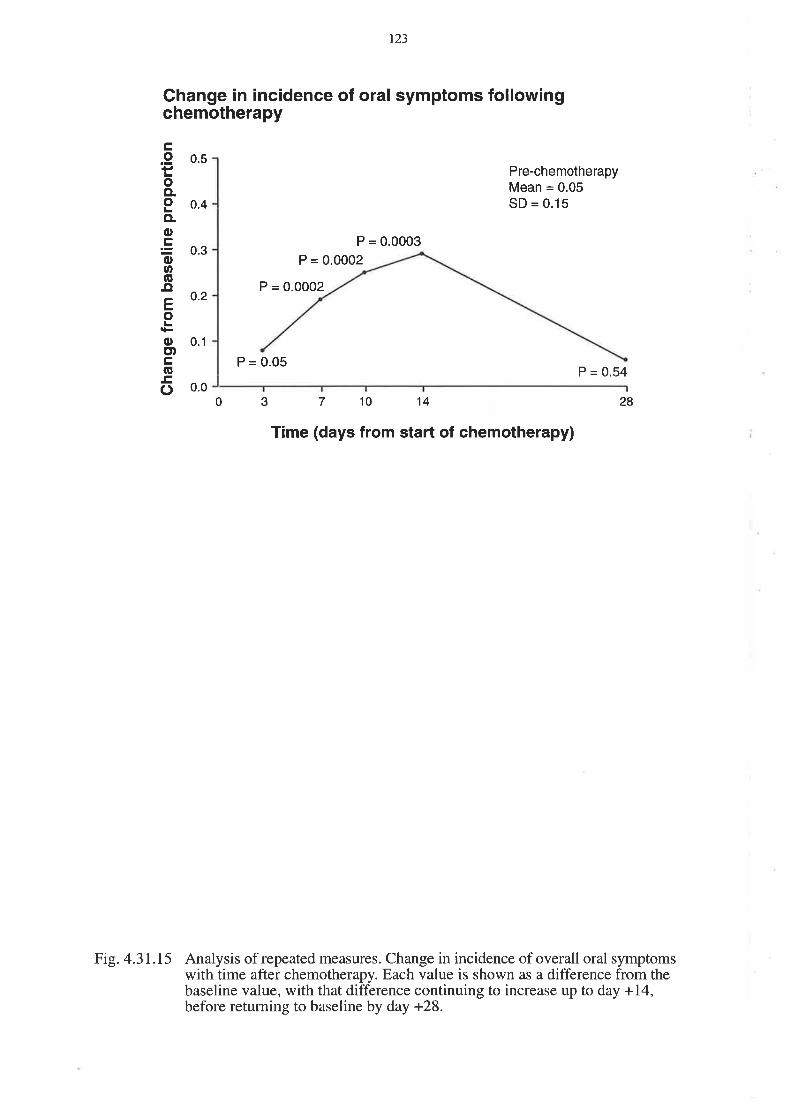
123
Change in incidence of oral symptoms followingchemotherapy
0.5ç,o
oCLoCL
ocoo(ú¡¡Eo
oE)c(ú
o
0.4
0.3
0.2
0.1
0.0
P = 0.0002
P = 0.0003
Pre-chemotherapyMean = 0.05SD = 0.15
P = 0.54
28
P = 0.0002
P = 0.05
0 3 7 't0 14
Time (days from start of chemotherapy)
Fig. 4.31.15 Analysis of repeated measures. Change in incidence of overall oral symptomswith time after chemotherapy. Each value is shown as a difference from thebaseline value, with that difference continuing to increase up to day +14,before returning to baseline by day +28.
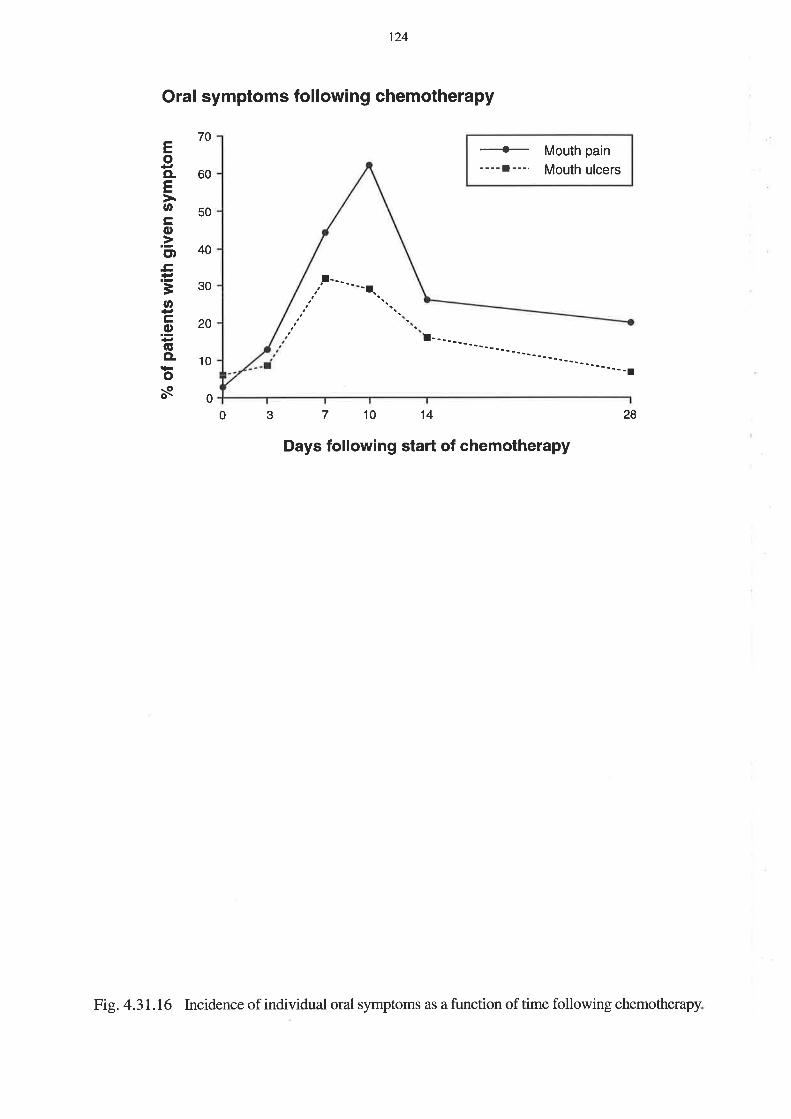
124
Oral symptoms following chemotherapy
!----- 'r.
70
60
50
40
30
20
10
0
EoCLEU,
co.=ctt.c.Ë
=otr.9(úCL
os
-{-----l---,
Mouth pain
Mouth ulcers
14 2830 710
Days following start of chemotherapy
Fig. 4.31.16 Incidence of individual oral symptoms as a function of time following chemotherapy.
125
Symptom SeveritY
Patients were given an overall mucositis score at each assessment' Diarrhoea alone was
assessed in the frrst 27 patients, and nausea, vomiting, stomatitis and diarrhoea in another 33
patients. Table 4.31.1shows the maximum mucositis scores reached during the study' The
individual maxima are given in appendix III'
Fifty percent of patients suffered from at least grade 1 diarrhoea, indicative of small intestinal
mucositis. 2lYohadgrade l, 15Yo had grade 2, llyo had grade 3 and or:/ly 2Yo had grade 4
diarrhoea. This was assessed in 54 patients, as 6 were unevaluable'
Nausea, vomiting and stomatitis were assessed in 33 patients, of whom 27 were evaluable'
Vomiting only occurredi¡33Yo of patients, with a maximum grade of 2' The peak day of
vomiting post chemotherapy, however, is usually day +1 when no assessments wefe
performed. Thirty percent and 26Yo of patients suffered grade 3 nausea and stomatitis
respectively, which were the most problematic toúcities.

t26
Toxicity/
Grade
Nausea Vomiting Stomatitis I)iarrhoea Overall
0 33 67 JJ 50 35
1.,|, 18 4 22 15
2 15 15 37 l5 24
3 30 26 11 24
4 2 2
Table 4.31.1Percentage of patients for whom mucositis grade reached a given level

t27
Summary
Sixty patients filled in the symptom questionnaire on a maximum of six occasions. There was a
small amount of drop-off as the study proceeded, with 42 completed questionnaires on day 14
and, 39 completed on day 28. This fall-off in numbers was taken into account during the
analysis. Oral symptoms, although measured in a smaller number of patients, were more
cofilmon than gastrointestinal symptoms. Nausea was mofe common and more severe than
vomiting, but the peak of vomiting had most likely been missed. Mouth pain was the single
most prominent symptom, occurri ng in 62Yo of patients on day 10, which was a delayed peak
compared to the other gastrointestinal symptoms, which peaked on day 3. Abdominal pain
(Zg%)was more prominent than other gastrointestinal symptoms, with diarrhoea occurring in
24Ys. There were no subgroup effects. Analysis of the group symptom burden as a whole
showed lower values for symptoms than the individual scores, because each value in the
analysis r¡ras a proportion of potential symptoms rather than a sum of individual symptoms'
r28
4.32 Intestinal sugar permeability
Lactulose excretion, rhamnose excretion and lactulose to rhamnose milligram excretion ratio
were all measured. There was no change in lactulose exeretion with time, nor with any of the
covariables. Rhamnose excretion however, fell in the high-dose chemotherapy group after
treatment and did not recover with time (p:0.000). (See Figure 4.32.1). There was no change
with standard dose chemotherapy (p:0.53). This fall in rhamnose excretion led to an increase
in lactulose to rhamnose milligram excretion ratio, seen in both groups on day 3 (p:0.0012)
with no recovery by day 28. (See Figure 4.32.2). This result is disappointing as it does not
confirm the results of the earlier high-dose chemotherapy study (see Chapter 3). The reduction
in sensitivity of the test due to the removal of glucose led to a loss of significance- The normal
ranges are for lactulose excretion <o.7yo, rhamnose excretion 8-20yo, and lactulose/rhamnose
milligram excretion rat\o 0.023-0.074, using the HPLC method. Pre-treatment lactulose
excretion was 0.62vo, rhamnose was 7.8Yo and the lactulose/rhamnose milligram excretion
ratio was O.O7g. Both lactulose and rhamnose excretions were normal, but the ratio was
elevated. The lactulose/rhamnose milligram excretion ratio rose 2.5-fold to 0.20 on day 3, and
then fell to 0.13 on day 7 .It remained elevated at 0.14 on day 28. (See Figure 4.32.3).

129
Change in rhamnose permeability following chemotherapy
Time (days from start of chemotherapy)0 3 710 14 2Ao
õcoE(úoL
oLCL
EoL
oct)tr(g.c()
0
1
-2
-3
-4
-5
-6
P = 0.53
P=0
Standard dose chemotherapy
Pre-chemotherapyMean = 7.87"SD = 5.2
High dose chemotherapy
Analysis of repeated measures. Change in rhamnose permeability followingchemotherapy, with patients being split into high dose and standard dosechemotherapy groups. There was no change in rhamnose permeability withstandard dose chemotherapy. The decrease in rhamnose permeability with highdose chemotherapy did not recover by day +28. For definitions of standard &high dose chemotherapy see text.
Fig.4.32.1

130
Change in lactulose/rhamnose sugar permeability ratiofol lowing chemotherapy
P = 0.0012
Pre-chemotherapyMean = 0.079SD = 0.098
0.
ofG
coE(úoLoLo.EoLoct)tr(úEo
0.15
01
0.05
0.0030 710 14 28
Time (days from start of chemotherapy)
Analysis of repeated measures. Change in sugar permeability ratio followingchemotherapy. There is no dose effect evident nor any recovery by day +28.
Fig.4.32.2

l3l
o
Prel0 Day 3 DayT Day 10 Day 14 Day 28
Time (days from start of chemotherapy)
Fig.4.32.3 Urinary lactulose to rhamnose permeability following chemotherapy. The barsrepresent the mean values.
Io
o
æø
oo
Bo
Ë.c¡(úoEoCL
Gc]noÊ
2.5
2.0
1.5
1.0
0.5
0.0
o
oo
I(D I
o
o
ô
-c¡-
132
4.33 Serum endotoxin
There was no change in detectable serum endotoxin level throughout the time course' the
estimated change with time being 0.041 with p:0'73' There wefe no covariable effects'
particularly no chemotherapy dose effect. A small amount of endotoxin was detectable
throughout.
4.34 Assessment of bacterial overgrowth
Breath testing was performed on ten patients, but was not analysed as part of the overall
analysis because the results were not satisfactory. see Table 4.34.
It was not possible to prevent patients from taking antibiotics, as they were quite commonly
needed after chemotherapy. Nor were patients keen to adhere to the dietary restrictions. In the
ten patients studied, we did not find any convincing evidence of bacterial overgrowth either
before or after chemotherapy. The major effect seen \ilas of an accelerated oro-caecal transit.
Thus two patients who were thought not to be hydrogen producers on the basis of no
hydrogen detection at 4 hours in the pre-chemotherapy sample, were found to produce
hydrogen 2 hours after lactulose ingestion, after chemotherapy' The only two patients who
appeared to have positive tests for bacterial overgrowth had that before chemotherapy, with no
change after l0 days, and a normalisation at day 28 in one. Greater than5oYo of the results
were equivocal due to poor diaary compliance, which made the test impossible to interpret.
The breath testing exercise was abandoned after the first 10 patients as there were too many
variables.

133
Patient PrechemotheraPY Day 10 Day 28 Comments
1 equivocal equivocal equivocal poor compliance
2 equivocal equivocal normal
3 equivocal normal equivocal poor compliance
4 equivocal
I positive positive
6 normal normal normal
7 equivocal positive equivocal poor compliance
I equivocal equivocal
9 positive positive normal
10 equivocal equivocal equivocal
Table 4.34. Summary of combined toc-D-xylose and lactulose breath hydrogen breath test
results. For graphic representation see Appendix (I)'

134
4.4 DISCUSSION
The hypothesis of this study was that chemotherapy causes a transient, dose-dependent
abnormality in the small intestinal mucosa which is clinically manifest by abdominal symptoms,
abnormal srnall intestinal functional studies, and changes in histomorphometry. The
histomorphometry results are discussed in Chapter 5. The symptoms were as expected, but the
functional studies did not show much abnormality, nor was the dose-dependent ef[ect as large
nor as consistent as we expected. We did not see any effect of age, sex, disease nor stage, and
it may be that the numbers of patients were not big enough to show them. In this sort of study,
which is exploratory, rather than seeking a particular level of difference, it is not feasible to do
power calculations to determine the number of patients required, rather it is important to
balance a realistic number for recruitment purposes, with a large enough number that will
detect a significant difference (187). It was thought that sixty patients was a reasonable
compromise. A longitudinal study, however, has other advantages, in that it is possible to use
each subject as his own control over the time-course of the intervention'
Demographics
The age spread, mixture of diagnoses and stages of disease, give a broadly typical picture of
patients treated at one institution. The results showed that small intestinal mucositis was not
affected by such factors as age, sex, diagnosis nor disease stage. Less expected, however, was
the small nature of the dose effect, which was not seen at all in the biopsy group. It is
postulated that this small effect is due to the nature of the chemotherapy, and the fact that even
with the high dose chemotherapy, it was always an autologous peripheral blood stem cell
transplant that was done, not a bone marrow transplant (autologous nor allogeneic). Bone
marro.w transplantation is associated with more severe mucositis, due to a combination of
higher doses of chemotherapy, more prolonged bone marrow suppression, the added
135
complication of graft versus host disease, and in some cases the use of total body irradiation
(TBÐ as part of the conditioning regimen. There was no TBI used in this study, indeed
radiotherapy was an exclusion criterion, and graft versus host disease is rare with autologous
transplantation. A larger study might show dose-dependent efÊects, but would be much harder
to perform, especially at a single institution. The mixture of drugs used was large, as it would
not have been possible to recruit the numbers of patients required if only one drug combination
were chosen. While it has been commonly thought that only certain drugs actually caused
mucositis, Ijini and Potten (9) showed that each one of 18 chemotherapeutic agents they
tested did affect the small intestinal crypt, albeit at different levels in the hierarchy. The full list
of drug combinations used is shown in appendix II, and the majority is known to cause
mucositis.
The study aims will be addressed in turn, to consider whether each has been fulfilled, and what
could be changed in future work.
l. To assess the prevalence, severity and duration of gastrointestinal symptoms and nutritional
changes in patients receiving cancer chemotherapy'
Nutritional assessment
We did not demonstrate any evidence of malnutrition prior to chemotherapy. This is probably
due to a bias in the selection of patients who received chemotherapy. Poor performance status
and weight loss at diagnosis are poor prognostic signs for response to treatment and for
survival. patients who are malnourished are therefore not as likely as well nourished patients to
respond to treatment, and are therefore less likely to be offered chemotherapy. We did find,
however, evidence of a transient reduction in some parameters of nutrition following a single

r36
cycle of cytotoxic chemotherapy. Weight and body mass index fell after chemotherapy and
remained significantly reduced on day 14, but normalised by day 28, which would usually be
the start of the next cycle of chemotherapy. Thus, it would be expected that patients would
tolerate chemotherapy by regaining any lost weight towards the end of each cycle. Albumin
and transferrin also fell transiently after chemotherapy. Transferrin is an acute phase protein
and could be expected to fall following chemotherapy. It is interesting that it had one of the
very few dose-related effects. The fall in albumin is less easy to explain as it has a longer half-
life, but it may be due to altered tissue distribution following the chemotherapy. Both are
recovered by day 28 andthe next cycle of treatment.
Symptoms
Symptoms peaked over several days, with gastrointestinal scores increased from days 3 to 10,
and oral scores increased from days 7 to 14. This delay in onset of oral symptoms is consistent
with previous experience which indicates that they manifest from days 10 to 14 following
chemotherapy. It is also worth noting that subjective (patient dependent) symptoms were more
common than those which could be assessed by objective signs. For example, nausea was more
common than vomiting, and mouth pain was more common than mouth ulcers- There was no
diflerence detected for age, sex, diagnosis, nor stage, which is not surprising, but surprisingly
no dose effect was seen. This is probably related partly to the number of patients, although it
may be that even in the high-dose group, the doses were not sufficientþ great to show an
effect
Criticisms of the symptom questionnaire include the fact that the oral symptoms were not
added until the second half of the study. This could have led to some bias, and oral symptoms
will be included in further work.
r37
2. To measure functional changes in the small intestine using intestinal sugar permeability and
associated changes in serum endotoún'
Intestinal sugar permeabilitY
Intestinal sugar permeability was minimally elevated prior to chemotherapy, and increased 2'5-
fold at 3 days after chemotherapy. This increased permeability was entirely due to decreased
rhamnose absorption rather than any increased lactulose absorption, despite the fact that we
have shown an increase in open tight junctions by electron microscopy (see Chapter 5)' It is
interesting that the permeability defect persisted until at least day 28, when intestinal
morphometry had recovered. The first study (Chapter 3) also showed increased intestinal
permeability after high-dose chemotherapy until 35 days after starting treatment. These two
studies therefore show a prolonged functional abnormality that persists in spite of histological
recovery. An immunologicaVinflammatory mechanism is possible to explain these data, but
endotoxin is not the foreign antigen leading to a prolonged reaction.
The major criticism of the permeability measurements in this study is that the use of an isotonic
sugar solution, rather than the hypertonic solution used in the first study, resulted in reduced
sensitivity. Since lactulose absorption was affected, this could be explained by reduced stress
on tight junctions. However, what was lost in sensitivity was partly made up for by improved
patient tolerability with fewer patients refusing to drink the isotonic sugar solution. Future
studies are being performed with the hypertonic solution in an attempt to increase sensitivity.

138
Endotoxin
Serum endotoxin estimation was used as one measure of integrity of the gastrointestinal
mucosal barrier, particularþ that of the colon, where endotoxin forming bacteria reside. Small
bowel bacterial overgrowth could also increase endotoxaenia, but this was not confirmed. The
senrm endotoxin assay detected a small amount of endotoxin present prior to chemotherapy,
which persisted without change after chemotherapy. This small detectable amount was not due
to contamination, as similar low levels of endotoxin were present in sera of healthy controls.
We conclude that there was no significant increase in endotoxin absorption following
chemotherapy.
3. To assess small bowel bacterial overgrowth using a combined lactulose breath hydrogen and
toc-D-xylose breath test
The assessment of small bowel bacterial overgrowth is problematic. The traditional method has
been by culture ofjejunal aspirates, but breath testing has frequently been used (39), and more
recently, culture of sterile biopsy specimens has been investigated (40) Unfortunately the
results are dependent on proper patient preparation, namely fasting overnight before the test,
and complying with a relatively strict diet for the 24 hours leading up to the test. Patients,are
also not allowed to smoke, and have to avoid oral antibiotics for up to one month prior to
testing. Obviously it is hard for patients undergoing cancer chemotherapy to adhere to all these
restrictions, as was seen in our results, which showed a predominance of inadequate
preparation. The only two patients in whom we found convincing evidence of bacterial
overgrowth, already had this prior to treatment, so that it cannot be used to explain symptoms
occurring after chemotherapy. The most interesting observation from the ten patients

139
undergoing breath tests, was that two patients who were thought not to be hydrogen
producers in the pre-chemotherapy test, did produce hydrogen after chemotherapy. This is
probably explained by shortened oro-caecal transit time. The negative endotoxin results, and
the inadequate breath testing results mean that we have not been able to fully explore the role,
if any, of small bowel bacterial overgrowth in the development and prolongation of small
intestinal mucositis following cancer chemotherapy. Further studies would obviously need to
be done to clarify the situation.

140
CHAPTER 5
SMALL INTESTINAL MORPHOLOGICAL CHANGES AFTER CHEMOTHERAPY
5.1 INTRODUCTION
The aim of this study was to further characterise the changes occurring in the human small
intestinal mucosa following chemotherapy by measuring morphological changes using
apoptotic cell count, histomorphometry and electron microscopy. As the study was carried out
in conjunction with the studies in Chapter 4, results of symptoms, nutrition and functional
studies were available for most of the patients, allowing comparison of symptoms, function and
morphology. Patients had upper gastrointestinal endoscopy and duodenal biopsies performed
prior to and !,3, 5, and 16 days after chemotherapy. Each patient had a maximum of two
endoscopies. Eighteen patients \ryere part of the main study, and had biopsies pre-
chemotherapy and either on day 3 or day 16 post chemotherapy. The remaining six patients
were recruited to have biopsies on day I (n:5) and day 5 (n:2)'
The safety of upper gastrointestinal endoscopy in patients having had chemotherapy is of
utmost importance, but most of the work in this area is concerned with patients who have had
bone marrow transplantation (188). Our patient group all received chemotherapy, either in
standard doses, as high-dose cyclophosphamide priming or as maffow-ablative chemotherapy
prior to autologous stem cell rescue. The marrow recovery times after stem cell transplantar\on
are much shorter than after bone marrow transplantation, and patients are not at as high a risk
of bleeding and infection for so long. Following Forbes' paper (86), we initially performed
upper gastrointestinal endoscopies at 16 days after chemotherapy, but changed this to 3 days
after the first eight patients. The platelet and white cell counts had not fallen to unsafe levels by
14t
3 days. In a study by Kaw (182), it was shown that the incidence of bacteraemia in bone
marrow transplantation patients undergoing endoscopy was low, and that routine antibiotic
prophyla<is was not required in all cases.

r42
5.2 METHODOLOGY
Test procedure
Patients \¡/ere prepared in the normal manner for endoscopy. They fasted for 4 hours prior to
the procedure, gargled an anaesthetic mouth-wash, and were given fentanyl and midazolam
intravenously. The upper gastrointestinaltractwas inspected, and multiple biopsies were taken
from the third part of the duodenum. Tissue was taken for disaccharidases analysis, and tissue
was fixed in Clarke's fixative for morphometry. Villus area, crypt length and mitotic count
were measured by a microdissection technique. This technique works well in human and animal
biopsy specimens (28). Further biopsies were taken for electron microscopy (to measure tight
gap junction width and brush border height), in Carnoy's fixative to assess enterocyte height,
and in formalin for TUNEL (tdt-mediated duTP-biotin nick end labelling) to assess apoptosis.
5.21 Disaccharidases
Tissue for disaccharidase assay was sent on ice to the Institute of Medical and Veterinary
Science, Adelaide, for analysis, and disaccharidases were expressed as micromoles disaccharide
hydrolysed per minute per gram wet weight of tissue at37'C. The normal ranges were lactase:
3-14, sucrase..6-26,and maltase: 13-44 (90% confidence intervals).
t43
5.22.Liglnt microscopy
Intestinal morphometrY
Duodenal biopsies were fixed in Clarke's fixative overnight and then transferred to TOV,
alcohol until microdissection was performed. They were stained with Feulgen reagent and
microdissected, using the method of Goodlad (28). Villus area was calculated using atrapezoid
approximation as described by Cummins (1s9) See Figure 5.2.1. Crypt length and mitotic
count per crypt were also recorded, with a minimum of l0 crypts per sample being averaged.
Apoptotic count by TUNEL method
Formalin fixed, paraffn embedded, 5pm sections were stained by the TUNEL method of
Gavrieli (60), apoptotic cells per crypt were counted in at least ten crypts, and expressed as
apoptotic bodies per crypt. These studies were undertaken by Mr. Gary Goland, Technical
Ofücer, in the Department of Gastroenterology.
Enterocyte height
Biopsies were fixed in Carnoy's fixative overnight, and then transferred into 100% alcohol
prior to parafgn embedding, sectioning and haematoxylin and eosin staining. 5 pm sections
were examined under light microscopy at a magnification power of x40, with a graduated
eyepiece. Enterocyte height \¡/as measured at approximately the mid-villus position for at least
ten cells and the average calculated.

t44
Measurement of villus length and area and crypt length of thesmall intestine
Apicalvilluswidth
(a)
78.9 ¡rm
l-78. e)Villus
length(t)
--
UUU (5")w I
cryptlength
Villuswidth
(w)
Fig. 5.22.1 Trapezoid approximation used for calculation of villus area at microdissection.

145
5.23 Electron Microscopy
Electron microscopic studies were performed by Mr. John Brealey at The Queen Elizabeth
Hospital.
FixatÍon: Duodenal tissue pieces (approximately 0.5 mm) were fixed for at least I hour in a
mixture of lYo glutaraldehyde and l0% formalin in 0.lM sodium cacodylate buffer.
Processing: Tissue was post-fixedin2o/o osmium tetroxide and stained en bloc inZYo uranyl
acetate. Tissue was dehydrated through a graded series of alcohols (70Yo, 90yo, l}Oyo) and
further processed through epoxypropane (100%), a 50150 mixture of epoxypropane and
Procure 812 resin (Electron Microscopy Sciences, Pennsylvania, USA), and two changes of
Procure 812 resin. The tissue pieces were embedded in polythene capsules and cured overnight
at 90"C.
Microtomy: Survey sections were cut at approximately 2 ¡rm and stained with toluidine blue.
Duodenal villi were considered suitable for ultramicrotomy if they were clearly attached to
lamina propria. Thin sections were cut at silver-gold colour (approximately 100 nm) and
mounted on copper grids.
Staining: Thin sections were stained with}Yo uranyl acetate and Reynold's lead citrate
Ultrastructural Examination: Thin sections were examined with a Hitachi H-600
transmission electron microscope (TEM) at a potential difference of 75 kV. Tight junctions
were examined at a final magnification of 80,000X. All specimens were randomised by a co-
worker such that the examiner was effectively blinded to the history of each specimen. Tight
junctions were examined at sites where the luminal microvilli were considered perpendicular or
near perpendicular to the axis of the electron beam. One hundred tight junctions per specimen

r46
were examined and scored as closed (normal), open (leaþ), or oblique (unable to comment on
the status of the tight junction due to obliquity of the junction in the plane of section) at the
luminal surface. A tight junction was considered morphologically normal if there was no
evidence of a gap between apposing cells at the luminal surface, and there was no visible gap
between apposing leaflets of the tight junction. Due to the subjective nature of the scoring
system it was felt that alarge number ofjunctions (100) needed to be examined to achieve an
adequate base for data comparison.
Brush border height
Brush border height was measured on electron micrographs photographed at a magnification
of x18,000. Only intact microvilli were measured, and at least 10 separate microvilli were
measured in order to calculate aî average height. Measurements were made on biopsies taken
prior to treatment and at 3 and 16 days after chemotherapy'
5.24 Statistics
Biopsies from the eighteen patients who were part of the main study were analysed together
with their symptoms and function. A description of the statistics is given in section 4.25.
Additional biopsies were performed at days 1 or 5 after chemotherapy. Differences between
morphometry and apoptotic counts were analysed using Pentz' F-test (179) which is a robust
test of comparison of group means, where the group sizes are not identical.
Eighteen patients underwent endoscopy and biopsy pre-treatment, five on day l, eight on day
3, two on day 5, and seven on day 16. One patient only had a pre-treatment biopsy, and then
withdrew from the study.

r47
5.3 RESULTS
5.31, Disaccharidases
The disaccharidases, lactase, sucrase and maltase, showed no significant change over time, and
remained within normal limits. All three disaccharidase results increased slightly with time,
being lowest, and in the case of lactase below the normal range, before treatment, being higher
at day 3, and even higher on day 16. The reason for this trend is unclear.
5.32 Light microscopy
Histomorphometry
Villus area (p:0.002\, crypt length (p:0.0001) and mitotic index (p:0.000) decreased on day
3. Both crypt length (p:0.01) and mitotic index (p:0.005) rebounded above baseline on day
16, whereas villus area returned to baseline (p:0.4). See figures5.32.l,2 and3.
However, when the day I and day 5 biopsies were added, the analysis had to be changed. A
simple comparison of means was performed using Pentz' F-test, and this is shown in Figures
5.32.4 and 5.32.5. Villus area was not found to show any significant change. Crypt lengh
however was reduced from a pre-treatment mean value of l9l pm to a value of 141 pm on day
3 (p :0.0009). There was also a significant difference between crypt lengths on day 3 and day
16 (210¡rm), p<0.0001, and between day 5 (1a7¡rm) and day 16,p:0.0123, but the difference
between day 3 and day 5 was insignificant (See figure 5.32.4). The low number of day 5
biopsies (r2) makes this particular figure less certain. Mitotic index fell from a mean of 2'5
counts per crypt pre-treatment to 0.7 on day 3 (p:0.0043), and increased again to 3.1 on day
16 (p:0.0008). See figure 5.32.5-
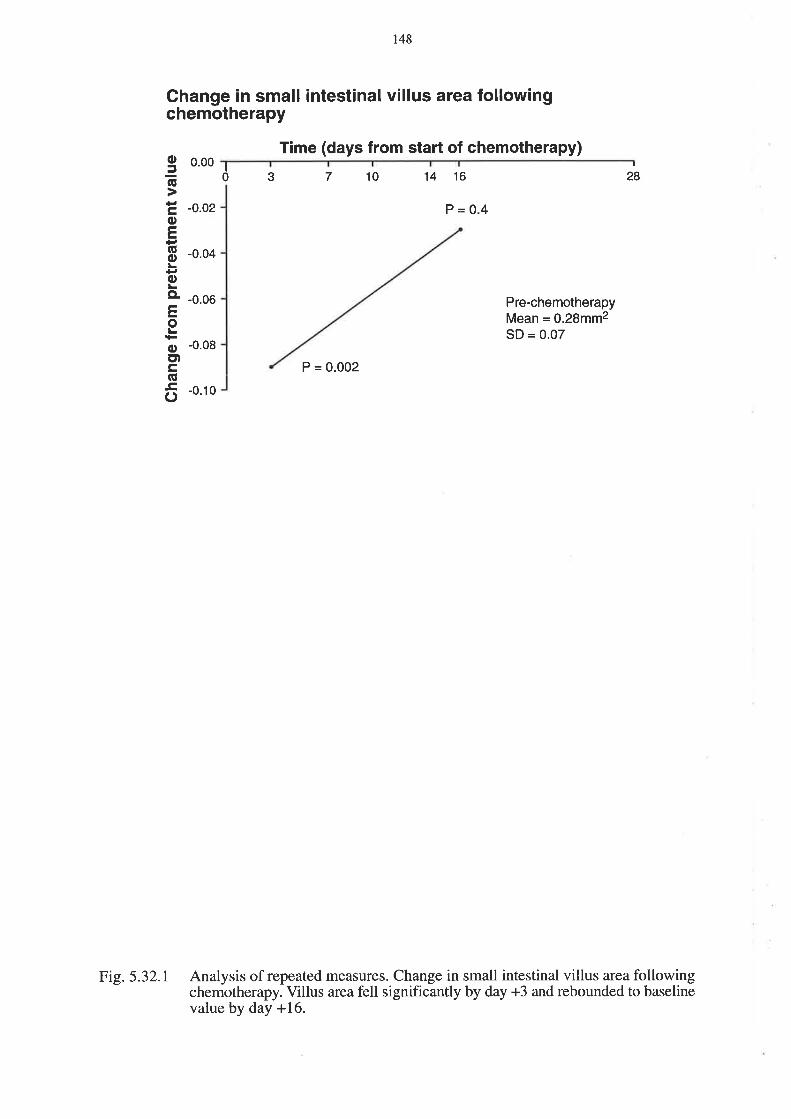
148
Change in small intestinal villus area followingchemotherapy
Time (days from start of chemotherapy)I
0 3 14 167 ',lo
oG
coEGoL
oCL
EoL
ocDc,GE
C)
I
280.00
-0.o2
-0.04
-0.06
P=0.4
Pre-chemotherapyMean = o.28mm2SD = 0.07
P = 0.002
Analysis of repeated measures. Change in small intestinal villus area followingchemotherapy. Villus area fell significantly by day +3 and rebounded to baselinevalue by day +16.
-0.08
-0.10
Fig.5.32.r

149
Change in small intestinal crypt length followingchemotherapy
P = 0.01
g40(ú
c20oE
EooL.CL
E '20
oL
o -40Etco6 -60
3 71 14 16 28
Pre-chemotherapyMean = 192.4¡tmSD = 29.6
P = 0.0001
Time (days from start of chemotherapy)
Analysis of repeated measures. Change in small intestinal crypt length followingchemotherapy. Crypt length fell significantly by day +3 and rebounded tosignificantly greater than baseline value by day +16.
Fi5.5.32.2

oõtroE(úooLCL
Eo
oct)cG.Co
ts0
Change in small intestinal mitotic index followingchemotherapy
2
P = 0.005
10
7 't4 16 28
Pre-chemotherapyMean = 2.58SD = 0.86
P=0
Time (days from start of chemotherapy)
Analysis of repeated measures. Change in small intestinal mitotic index followingchemotherapy. Mitotic index fell significantly by day +3 and rebounded tosignificantly greater than baseline value by day +16.
1
03
1
-2
-3
Fi9.5.32.3

l5l
Villus area and crypt length following chemotherapy
0.30
o.25
0.20
0.15
0.10
0.05
0.00
Pre Day 1 DaY 3 Day 5 Day 16ttP = 0.0123P = 0.0009
P = <0.0001
Time in relation to starting chemotherapy
ôtEE(EoLGo
=5
E
.c 100
Etc-9Ë. 2oo
Lo300
Villus area and crypt length following chemotherapy. Using Peitz'F-test,there was a significant reduction in crypt length at day +3, which normalisedwith an increase by day +16. Changes in villus area did not reach statisticalsignificance. Data are given as mean + standard error.
fì=8lì = 15 ft=4 fì=8 l\=2
Fi5.5.32.4

ts2
Mitotic index following chemotherapy
5
Pre Day 1 Day 3 Day 5 Day 16
P=0.0043 P=0.0008
Time in relation to starting chemotherapy
Fig. 5.32.5 Mitotic index following chemotherapy. Using PeÅtz'F-test, there was a significantreduction in mitotic index at day +3, increasing again by day +16. Data aregiven as mean + standard error.
CL
LoLoCL
troooo==
4
3
2
1
0n = 15 l1 =4 fì=8 11 =2 fì=8
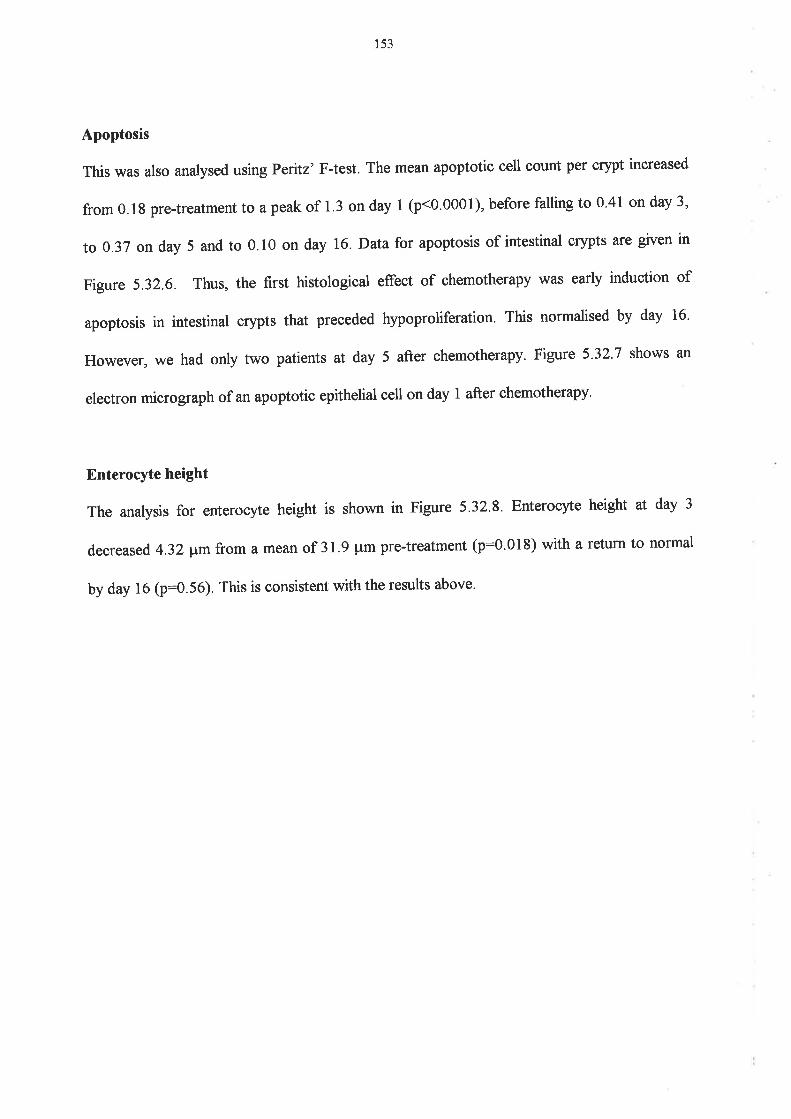
153
Apoptosis
This was also analysed using Pentz'F-test. The mean apoptotic cell count per crypt increased
from 0.1g pre-treatment to a peak of 1.3 on day 1 (p<0.0001), before falling to 0.41 on day 3,
to 0.37 on day 5 and to 0.10 on day T6.Datafor apoptosis of intestinal crypts are given in
Figure 5.32.6. Thus, the fïrst histological effect of chemotherapy was earþ induction of
apoptosis in intestinal crypts that preceded hypoproliferation. This normalised by day 16.
However, we had only two patients at day 5 after chemotherapy' Figure 5'32'7 shows an
electron micrograph of an apoptotic epithelial cell on day I after chemotherapy'
Enterocyte height
The analysis for enterocyte height is shown in Figure 5.32.8. Enterocyte height at day 3
decreased 4.32 ¡tm from a mean of 3 I .9 pm pre-treatment (p:0.01 8) with a return to normal
by day 16 (p:0.56). This is consistent with the results above.

3.0
2.5
2.0
1.5
1.0
0.5
0.0
CL
ooCLo.9ttoftooCLoCL
154
Apoptotic bodies per crypt following chemotherapy
n=1411 =7
Pre Day 1 Day 3 Day 5 Day 16
P = <0.0001 P = <0.0001
P=0.0018 P=0.0002
Time in,relation to starting chemotherapy
Number of apoptotic bodies per crypt following chemotherapy. There is asignificant rise in apoptosis on day +1 following chemotherapy, which graduallyfalls to baseline by day +16. This increase precedes other changes in thecrypt/villus. Data are given as mean + standard error.
ñ=6 fì=6 ll=2
Ftg.5.32.6
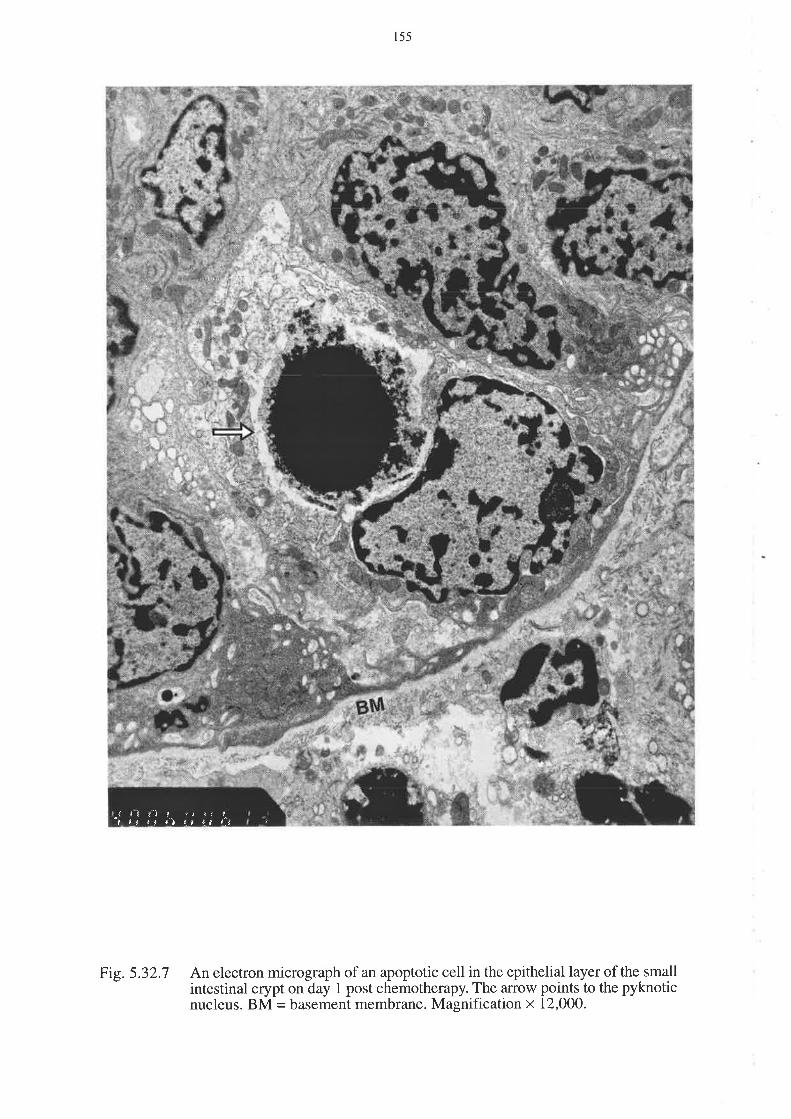
155
An electron micrograph of an apoptotic cell in the epithelial layer of the smallintestinal crypt on day 1 post chemotherapy. The arrow points to the pyknoticnucleus. BM = basement membrane. Magnification x 12,000.
¡.f f rI r -¡ ¿r ¡*i ,t t ¡ tl ¡.¡ l.* {.lt i
Fig.5.32.7

156
Change in small intestinal enterocyte height followingchemotherapy
P = 0.56oE
coE(úoL
oLçL
Eo
oct)cñEo
3
1
0
1
710 14 16 28
-2
-3
-4
-5
Pre-chemotherapyMean = 31.9pmSD = 4.3
P = 0.002
Analysis of repeated measures. Change in small intestinal enterocyte heightfollowing chemotherapy. Enterocyte height fell significantly by day +3 andrecovered to baseline value by day +16.
Time (days from start of chemotherapy)
Fig. 5.32.8

t57
5.33 Electron microscoPY
Figure 5.33.1. shows an electron micrograph of an open and of a closed tight junction. The
percentage of leaþ tight junctions increased from 38.9 pre-treatment to 54.6 on day I and
63.3 on day 3.It fell againto 46.6 on day 16. (See figure 5.33.2).In the overall analysis of
repeated measures, the percentage had increased significantly by day 3, (p : 0'0000), and
returned to baseline on day 16 (p:0'46). (See Figure 5.33.3). These changes are similar to,
but less severe than, those seen in cholera (190). We found no increase in lactulose
permeability associated with the increase in open tight junctions, impþing that the size of tight
junction opening is not the only important factor in lactulose absorption. Indeed, it is also
possible that open junctions may be a manifestation of immaturity of the enterocytes, which is
consistent with repopulation of the crypt/villus with immature cells. Brush border height, as
measured on electron microscopy, did not show any significant change with time. (See Figure
s.33.4).
As each patient had a maximum of only two biopsies, it is not possible to say that the day 16
results are definitely related to the day 3 results, in the same way that one can compare the
symptom and function results in Chapter 4. However, the biopsy changes do follow a similar
pattern to symptom and function changes.
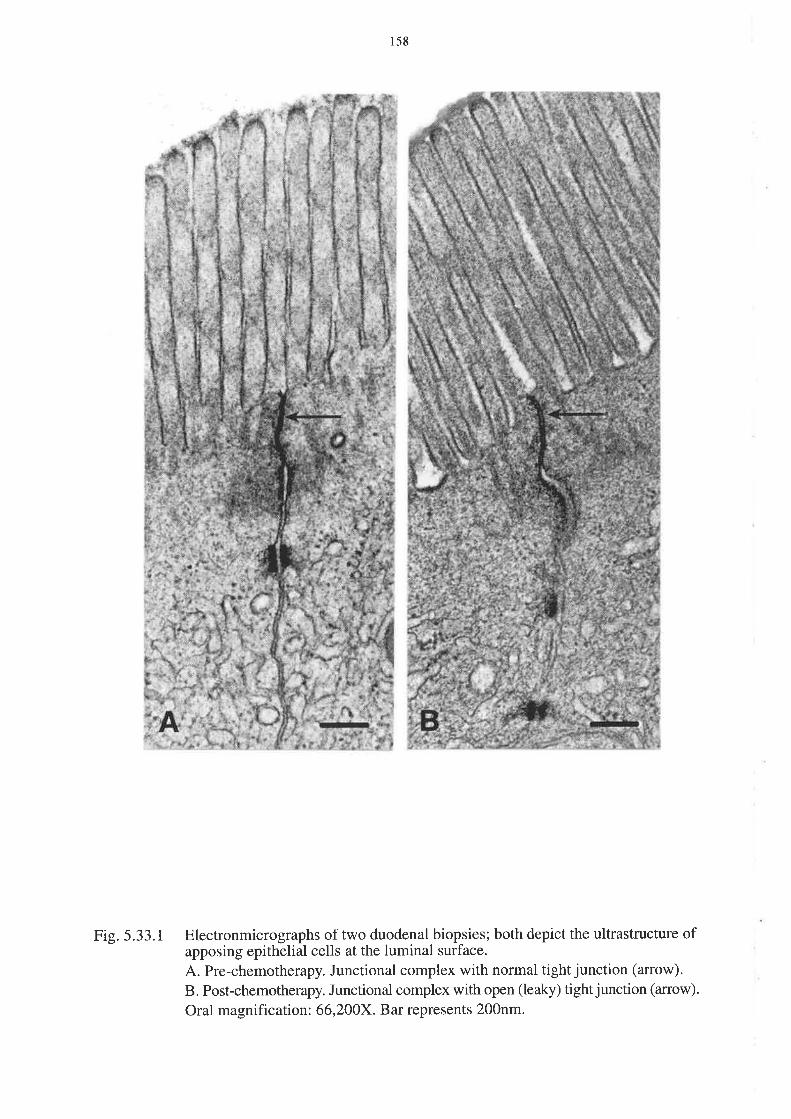
r58
Electronmicrographs of two duodenal biopsies; both depict the ultrastructure ofapposing epithelial cells at the luminal surface.
A. Pre-chemotherapy. Junctional complex with normal tight junction (arrow).
B. Post-chemotherapy. Junctional complex with open (leaky) tight junction (anow)'
Oral magnification: 66,200X. Bar represents 200nm.
Fig.5.33.1

159
Percentage of open tight junctions with time afterchemotherapy
Pre Day 1 Day 3 Day 5 Day 16
P = 0.034
P = 0.041
80otro
Ê60=.C.9 40
.Y(úo¿vis
o
Percentage of open epithelial tight junctions following chemotherapy. There isa significant increase in the number of open tight junctions at day +3 andday +5, with a reduction to baseline by day +16.Data are given as mean + standard error.
Fig.5.33.2

160
Change in number of "leaky" tight iunctions seen onelectron microscopy following chemotherapy
P=09so(ú
+tCoF(!oLoLo.
E10L
oct¡cG
õ0
Pre-chemotherapyMean = 38.9%SD = 17.97
P = 0.46
0 3 710 14 16 28
Time (days from start of chemotherapy)
Analysis of repeated measures. Change in number of open epithelial tight junctionsfollowing chemotherapy. There is a significant increase in open tight junctions atday +3 with a return to baseline by day +16.
Fig.5.33.3

l6l
Change in brush border height following chemotherapy
Time (days from start of chemotherapy)0.0
3 14 16710 28
-0.5
Pre-chemotherapyMean = 24.5SD = 4.5
-1.5 P=0.4
P=0.1
-2.0
Fig. 5.33.4. Analysis of repeated measures. Brush border height following chemotherapy.There is no significant difference with time.
-1.0
oõcoE(EooLCL
Eo
oEtc(úEo

t62
5.4 Discussion
The aim of this study was to measure histomorphometry, apoptosis, and tight junction integrity
in the small intestine of patients receiving chemotherapy. The earliest event visible after
chemotherapy in these patients was an increase in apoptotic cell count per crypt at 1 day after
treatment. This is followed after three days by a reduction in villus area, crypt length and
mitotic index. At this time apoptosis decreased but to still elevated levels. In a very small
number at day 5, we showed a return towards normal, and by day 16 there was no significant
change from pre-treatment levels. The new finding of this study was the early induction of
apoptosis of intestinal crypts. Interestingly, Trier did see discrete spherical bodies, suggestive
of apoptosis in crypts, although at that time true apoptosis was not recognised as a
pathophysiological process. Cunningham also found pyknotic material focally in crypts which
could have been apoptotic bodies. These studies confirm the hypoproliferative changes seen
previouslybyTrier, Smith, Cunningham, Potten, Taminiau and others (See Table 2.1). These
apoptotic changes preceded small intestinal symptoms, but the histomorphometrical changes
were present at the same time as symptoms. The gastrointestinal symptoms and morphological
changes were decreasing as mouth symptoms began.
The morphological changes occurred in a non dose-dependent manner, ie. there was no
delineation between standard and high-dose chemotherapy. We have therefore shown a dose-
dependent, prolonged change in permeability, but a dose-independent, shortJived change in
histomorphometry. This implies two separate mechanisms. It would have been preferable to
have the patients who had day I or day 5 biopsies as part of the whole study, so that their
symptoms and functional changes could have been investigated. However, that was not
possible, and despite that draw back, they do provide important information, especially with
respect to apoptosis.

163
The change in enterocyte height parallels the changes in villus atea, crypt lengh and mitotic
index, showing that areduction in individual cell size contributed to the abnormality. The lack
of change in brush border height is harder to explain. The trend in disaccharidases to increase
following chemotherapy is very unusual, and might be explained by the release of lysosomal
enzymes fbllowing chemotherapy. The other explanation would be that the cancer itself has a
mild effect on the small intestinal mucosal enzyme function which is corrected by
chemotherapy, which would obviously imply that the chemotherapy was having some effect on
the tumour and its ability to afÊect other organs. Further investigation will be required to
elucidate the cause.
The fifth aim of the study was to correlate symptoms, function and morphology. These data
did not indicate whether one particular symptom or functional change predicted any other, and
similarly for morphological changes. However, peak changes in gastrointestinal symptoms,
function and morphology did all occur at day 3 after chemotherapy, and these generally
returned to normal values between days 14 and 28. Dose-dependent changes occurred only
with decreased body weight, body mass index, transferrin and rhamnose absorption, otherwise
patients across all groups experienced symptoms and morphological changes regardless of the
dose of chemotherapy. It is probable therefore that small intestinal symptoms, function and
morphology are related following chemotherapy. Oral symptoms were not apparently related,
as these were more common than gastrointestinal symptoms, and were delayed in onset.

r64
5.5 Summary
This study has shown that the first change in the small intestine following chemotherapy is an
increase in apoptosis on day I, followed by crypt hypoplasia on day 3, which is accompanied
by the onset of abdominal pain, bloating and diarrhoea, along with functional changes such as
increased sugar permeability, and minor nutritional changes. The small intestinal symptoms
began to recover when mouth pain and ulcers occurred from day 7 to l0- However, the
functional changes persist, with nutritional changes only normalising by day 14 ot 28, but sugar
permeability remaining abnormal until at least day 28. Morphological changes recovered by
day 16. This is the first time that symptoms, function and morphology have been so extensively
studied in humans in a prospective manner following chemotherapy. Gastrointestinal side
effects were confirmed as a significant problem following chemotherapy, that needs to be
addressed either by prevention or active treatment.
Not surprisingly, there remain many unanswered questions. For example, why does the
functional defect persist after recovery of the physical mucosal barrier? How can we protect
the small intestine from the effects of chemotherapy without compromising anti-tumour efFect?
How can we successfuþ assess small bowel bacterial overgrowth in chemotherapy patients?
All these are areas for further study. Our results agree with the literature, expand our
knowledge of the sequence of events, and provide a platform for further research.

165
The next step is to move into work on an animal model for initial prevention studies, before
human prevention trials. Successful treatment of already developed mucositis would be very
difficult, as the stem cells of the small intestinal crypts are already stimulated, self-replicating
and providing increased daughter cells to repopulate the damaged crypts. It would be far better
to pfevent the chemotherapy from doing the damage in the first place, rather than to try to
catch up when it alreadY too late.

t66
CHAPTER SD(
DEVELOPMENToFTHEDARI(AGOUTIRATMAMMARY
ADENOCARCINOMA MODEL TO ASSESS SMALL INTESTINAL AND TUMOUR
EFFECTS OF CHEMOPREVENTION
6.1 GENERAL INTRODUCTION
There are now many agents available, such as TGF-P, IL-11' KGF, glutamine, and \ilGFE'
that might, either alone or in combination, help to protect the gastrointestinal tract from the
unwanted toxicities of chemotherapy (See Table 2.3). The major problem with any new agent
that will be used in humans is proving that it is safe. In trials of chemoprevention, there is the
added necessity of proving that the agent which protects the gastrointestinal tract from
chemotherapy doesn't also protect the tumour from the cytotoxicity of the chemotherapy'
There are theoretical reasons why a chemoprotectant might protect the tumour. Glutamine' for
example, is the favoured fuel of the small intestine. It is also, however, a favoured fuel for
tumours, so that it might theoretically help them to grow' TGF-ß acts by maintaining cells in
resting phase so that they are not damaged by the cell-cycle specific agents' If it also keeps
tumour cells in resting phase, it will stop the chemotherapy from acting. KGF is a growth
factor for the gut which might theoretically also promote tumour growth'
There is a need for an animal model which would allow simultaneous assessment of the effects
of chemotherapy and chemoprotectants on both the small intestine and the tumour.

r67
The Dark Agouti Rat Mammary Adenocarcinoma model (DAMA)
A model was therefore developed using subcutaneously implanted isogeneic rat breast cancer
in the female dark agouti (DA) rat. The mammary adenocarcinoma arose spontaneously in the
L970's, and has been propagated ever since by passage through female rats. Female rats are
used because the tumour passages more effectively through females than males. The tumour is
injected (as a cell suspension) subcutaneousþ into both flanks, and is harvested after two
weeks. Tissue can be stored frozen in liquid nitrogen, or used immediately' This model has
previously been used for studies of malnutrition following chemotherapy by Rofe (79L;L92);
and for studies of neuroprotection by glutamate by Boyle (193). It has not previously been
used to assess the small intestine nor gastrointestinal protection after chemotherapy. The model
allows an attempt at ameliorating small intestinal toxicity to proceed while guarding against
paradoxically increasing tumour growth. The following studies were performed at the Child
Health Research Institute, at The women's and children's Hospital in Adelaide, south
Australia. Ethics Committee approval was granted by the Research Ethics Committee of the
Hospital.
168
6.2 A STUDY TO FIND THE OPTIMUM DOSE OF METHOTREXATE TO CAUSE
NON-LETHAL SMALL INTESTINAL MUCOSITIS IN THE DARK AGOUTI RAT
6.2I INTRODUCTION
The aims of this study were:
1. To find the optimal dose of methotrexate (MTX) to administer intramuscularþ to the DA
rat in order to produce significant, non-lethal, small intestinal mucositis, and
2. Todetermine the optimal days for tissue collection in relation to small intestinal damage and
healing, so that we could proceed to further experiments'
In his studies using the DAMA model, Rofe used 0.5 mglkg MTX intramuscularly on 2
consecutive days. However, based on his food intake data, il was felt that this dose would be
insufficient to produce significant mucositis. This first experiment, however, was carried out in
DA rats that did not have the mammary adenocarcinoma, as it was purely a dose finding study'
Once the dose had been established, all further studies were to occur in tumour bearing rats.
t69
6.22METHODOLOGY
Twenty-eight female DA rats of 1509 t 2}gwere purchased from the Institute of Medical and
veterinary Science (IMVS), Adelaide. Animals were fed a casein diet from 5 days before
treatment with methotrexate (MTX), and settled in metabolism cages two days before the
MTX for the duration of the study. The rats were each randomised to one of four treatment
groups:
Group 1
Group 2
Group 3
MTX 0.s0 mg/kgld
MTX 0.75 mglkgld
MTX 1.00 mglkgld
saline control
2 consecutive daYs (daYs 0 to 1)
2 consecutive daYs (daYs 0 to l)
2 consecutive daYs (daYs 0 to l)
2 consecutive daYs (daYs 0 to 1)
8 rats
8 rats
8 rats
4 ratsGroup 4
MTX (or saline) was injected into the muscle on the dorsal surface of the thigh' The syringes
were drawn back prior to injecting to ensure the MTX was not injected intra-venously' Four
rats from each of groups 1-3 were killed on day 12, that is 24 hours after the second MTX
injection. The remaining rats in all four groups were killed on day *5, that is 96 hours after the
second MTX injection. Food intake and body weights of the rats were measured daiþ from the
day before the first MTX injection'
The rats were sacrificed using coz, and 2 cm samples of small intestine were collected at sites
corresponding to 25Yo and 75Yo ol the jejuno-ileum, into formalin and clarke's fixative'
sampres were transferred into 70vo ethanor after 24 hours. Formalin fixed tissues were paraffin
embedded for haematoxylin and eosin staining and for subsequent TLTNEL analysis of
apoptosis. clarke's fixed tissues were examined by stereo microscopy for villus area, crypt
length and mitotic index.

L70
ó.23 RESULTS
Body weight and food intake
The data for body weight and food intake for different MTX doses are shown in Figures 6.23.1
and 6.23.2.The rats were smaller than anticipated on arrival, with rats weighing an average of
7429. Body weights and food intakes fell with increasing doses of MTX, compared with
saline-injected controls. Thus rats given 1 0 mg/kg MTX weighed a mean of 8 grams less than
those given saline at day 2,bvtregained their weights by day 5' Food intake also decreased
more in rats treated with MTX, being 6.8 g in the 1.0 mdkg group on day 2 compared with
10.4 g in the saline controls. on day 5, this had reversed, with the 1'0 mglks MTX rats
increasing their intake to 10.2 g on day 5, compared with 8.5 g in controls'
Histomorphometry
The histomorphometry results are shown in Figures 6.23'3 and 6'23'4' These show a
progressive decrease in crypt length and proliferation at day 2, but these returned to normal
values by day 5. Overall these changes were modest as seen by only small changes in villus
area.

l7l
Body weight
oEGLEt
-cEto
=1loo
155
150
145
140
135
1301 0 1 3 4 52
Day of study
-....-o'-.-.-*----o---'---+--.
0.5 mg / kg0.75 mg / kg1.0 mg / kgSaline
Body weights of dark agouti rats treated with increasing doses of MTX versussaline on days 0 and +1. Rats were killed on day +5. Values shown are means andstandard errors.
Fig.6.23.r

172
Food intakes
15
10
(t,
EGLct)
o.YG
.=rtoolr
Et---------
5
Day of study
Fi1.6.23.2 Daily food intake of dark agouti rats treated with increasing doses of MTX versussaline on days 0 and +1. Rats were killed on day +5. Values shown are means andstandard errors.
00 1 5432
..-..-o'----*----o---'---+--.
0.5 mg / kg0.75 mg / kg
1.0 mg / kg
Saline

173
Villus area and crypt length following increasingdoses of methotrexate
o.25
o.20
0.15
0.10
0.05
100
150
Saline
0
50
(\¡
EE(EoGo
=5
EJ-
Ect)cgCL
à()
200 MTX0.5 mg/kg
MTX0.75 mg/kg
MTX1.0 mg/kg
Day
Day
2
5
Villus area and crypt length in the dark agouti rat small intestine followingincreasing doses of im methotrexate (MTX). Increasing doses of MTX lead toreduced crypt length on day +2,but there has been full recovery by day +5 evenat the highest dose.
Fiç.6.23.3

174
Mitotic index following increasing doses of methotrexate
8
MTX1.0 mg/kg
6
4
2
0
o.t-(tLoCL
coC)
.9o.=
=Saline MTX
0.5 mg/kg
Fig.6.23.4 Mitotic count per crypt in the dark agouti rat small intestine following increasingdoses of im MTX. Increasing doses of MTX lead to a progressive reduction inmitotic count at day +2, with full recovery at day +5.
175
6.24 DISCUSSION
The dose that produced the most significant morphometrical abnormalities was 1.0 mglkg. No
dose, however, produced a particularþ severe result, and all the animals had recovered by day
5. It was therefore decided to proceed with a higher dose of 1.5 mglkgld MTX for 2 days for
the further experiments, and to kill the rats on day 2, in order to see a significant effect.

176
6.3 THE EFFECT OF GLUTAMINE IN PREVENTING SMALL INTESTINAL
MUCOSITIS IN THE DARK AGOUTI RAT MAMMARY ADENOCARCINOMA
MODEL
6.31 INTRODUCTION
A dose of 1.5 mg/kgldMTx im for two doses was chosen from the previous experiment, as a
dose likely to cause significant nonlethal small intestinal mucositis. Day 2 was selected as the
best single day to kill the rats: that is twenty-four hours after the second dose of methotrexate'
at the estimated peak of small intestinal damage. The aim of this study was to determine the
effects of glutamine on mammary adenocarcinoma growth, and on small intestinal damage and
repair in the methotrexate-treated DA rat'
6.32 METHODOLOGY
Twenty-four female DA rats were used for this study. Tumour suspension was supplied by
Tanya Ellis at the IMVS, at a dose o10.2 ml of a 25Yo cell suspension, and 0.1 ml was injected
subcutaneously into each flank of anaesthetised rats, using a23 gavge needle (194)' The skin
over each flank was shaved prior to injection for ease of measurement of the tumour' See
Figure 6.32.7.

177
Fig.6.32.1 A tumour-bearing DA rat. The tumour was implanted subcutaneously into each flank,
and allowed to grow for 10 days.

178
Rats were transferred to a casein based diet 11 days before the first methotrexate injection,
which was taken as day zero. The study outline is given in Figure 6.32.2. Animals were placed
into metabolism cages on day -6, and stabilised there for 4 days before starting their trial
gavages on day -2, the latter being continued until sacrifice on day +2' Animals were
randomised to receive gavages of either glutamine or BSA (bovine serum albumin) solution' 2
ml twice daily. The aim was to provide 10% of protein intake as glutamine, and this was
calculated as 0.2 g grutamine per day, given as 2 nr of a 50 mgrrïí solution twice daily. The
rats receiving BSA received 2 ml twice daily of a solution containing 55 mglnìl BSA. Each rat
received 1.5 mglkg MTX on days 0 and tl, intramuscularþ into the quadriceps muscle'
Study monitoring
1. Food intake and body weight wefe recorded daiþ from day -3.
2. Tumour size (length and width) was measured with callipers alternate daiþ from day -5'
The size of the tumour as a percentage of body weight was calculated using the formula:
[(width x length)/2:g of tumour]/body weight of rat'
3. General condition of the rats and ulceration of the tumour were recorded daily'

179
Protocol for dark agouti rat glutamine study
Kiilrats
lnjectDAMA
Transfer tometabolism
cages
+Glutamine vs BSA gavages
-11-10-9-8-7-6-5-4-3-2-1012Day of study
Schematic diagram of protocol for dark agouti rat mammary adenocarcinomamodel, glutamine prevention study. Female rats were injected with tumour cellsuspension on day-11, transferred to metabolism cages on day -9, -d started onglutamine or BSA gavages on day -2. MTX 1.5mg lkgld im was injected on days
0 and +1, with rats being killed on day +2.
CASEIN DIET
MTX
MTX
Fi9.6.32.2

180
Tissue collection
On day +2, the rats were anaesthetised with halothane, and a terminal blood sample was
collected into heparin. Two 2 cm samples of small intestine were collected, at sites
corresponding to 25Yo and 75Yo ofthe jejuno-ileum, into clarke's fixative and formalin' The
tumour was weighed and two cross-sections across the centre of the tumour (approximately
59) were collected into formalin and methacarn. Samples in both formalin and Clarke's'were
transferred to 70yo alcohol at 24 hovrs. The clarke's fixed small intestinal specimens were
examined under stereo microscopy for villus area, cryp|length and mitotic index' The formalin
fixed tissue, from both small intestine and breast tumour, was parafün embedded; 5 pm
sections were cut, and stained with haematoxylin and eosin or prepared for TUNEL assay for
apoptosis. Tumour tissue was also assessed for mitotic count as a measure of proliferative
activþ in the tumour (195).
Statistics
Results were analysed with the assistance of Mr. Phil Leppard, Department of Statistics'
university of Adelaide. A two-way anarysis of variance was used with factors of diet at two
levels (casein versus glutamine), and methotrexate at two levels (none versus some)' The
program used was program 7D from BMDP Statistical software Inc.

181
6.33 RESULTS
Food intake
The food intakes for the DA rats with tumours are shown in Figure 6'33 '7 ' Food intake fell
slightly in the control group over time, from 12.59 on day -3 to 10g on day t2' but the fall was
more pronounced in MTX treated animals. The casein MTX group fell from 7 '5g ot day +1 to
69 on day +2,while the glutamine MTX group
less than 69 on daY +2.
maintained its intake on day +1 before a fall to
Body weight
The body weights are shown in Figure 6.33.2. All animals increased their body weights over
time, but in the MTX groups, there was a fall-offin gain on day +1, and then a fall on day +2'
This was slightly more pronounced in the casein fed animals. At day 2 the to MTX groups had
gainedweightto>lTfug,whereastheMTXanimalshadfallento1609.Theglutaminedidnot
have a protective effect.
Tumour size
The change in tumour size is shown in Figure 6.33.3, and Figure 6'33 '4 shows the calculated
tumour size as a percentage of body weight. The actual tumour size as a percentage of body
weight at animal sacrifice is also shown. Tumour weights at death are shown in Figure 6'33'5
and Table 6.33.5.There was no diet effect, but MTX reduced tumour weight compared with
control (P:0.004) in both groups'

182
Food intake
14
ID
EGLo)o.YG
.=Îtoo¡r
12
10
-3 -2
Day of study
Food intakes for tumour-bearing dark agouti rats fed a standard casein diet versusglutamine-supplemented diet añd treated with MTX lSmg/mzÆ versus placeboon day 0 and +1. Data points shown are means and standard errors.
I
6
4
220
--....o-.--,*----o---.---+--.
Glutamine + No MTXGlutamine + MTXCasein + No MTXCasein + MTX
Fig. 6.33.1

..-..-..o...-."
-+----o------+--.
Glutamine + No MTXGlutamine + MTXCasein + No MTXCasein + MTX
Body we¡ght
150-5
183
-3 -2
190
180
170
60
oEGLctt
.cctto
=ftoE
ü
-4 -1 0 2
Day of study
Body weights of tumour-bearing dark agouti rats fed a casein diet versus glutamine-supplemented diet and treated with MTX l.5mglm2ld versus placebo on days 0and +1. Data points shown are means and standard errors.
Fig.6.33.2

-.-.-.o.-.-.'-+----o------+--.
Glut No MTXGlut + MTXCasein No MTXCasein + MTX
184
MTX MTX
30 II
toÊõ20Eto.NoL
=o10EF
0-4 -2 0
Day of study
Calculated tumour size in grams in MTX treated rats fed glutamine versus caseindiet. Data are given as mean t standard error'
2
Fig.6.33.3

.-"...o....-.
+ts----o------+--.
Glut No MTXGlut + MTXCasein No MTXCasein + MTX
185
-c.9o=îto¡tosv,(ú
o.NoL
=oEt-
20
15
10
IMTX MTX
0
5
0-4 -2 2
Day of study
Fig. 6.33.4 Tumour size as a percentage of body weight _in DA rats treated with MTX ona casein versus glutamine supplemented diet. Data are given as mean * standarderror.

Mammary adenocarcinoma weights in dark agouti ratsfed glutamine versus casein with and without methotrexate
186
MTX = 1.5 mg/kg for 2 days40
oEE30ct)
.C
.9 20o
=LOrôEfF
0CaseinNo MTX
GlutamineNo MTX
Casein+ MTX
Glutamine+ MTX
Treatment / Diet reg¡men
Fig. 6.33.5 Final mammary tumour wgigl.rt¡ at t<]t_lo_1 d3V +2 in rats fed glutamine versuscaseln and treated with and without MTX. Data are given as mean + standarderror.
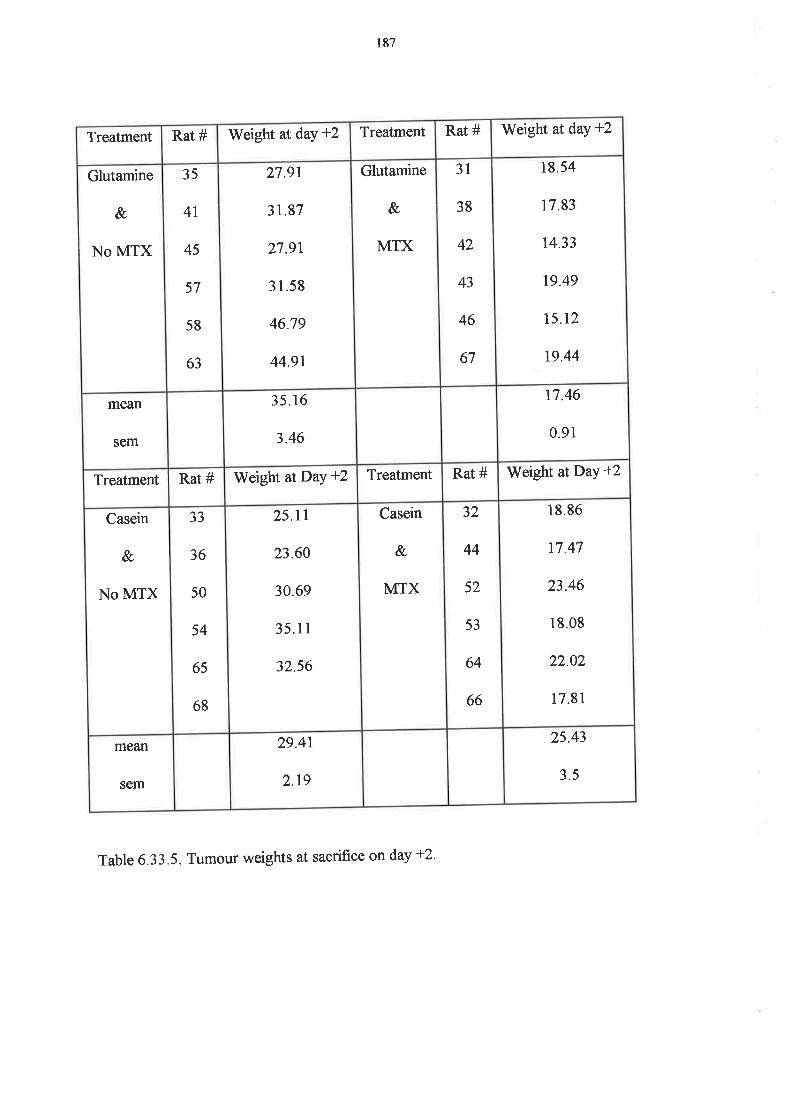
187
Table 6.3 3 . 5 . Tumour weights at sacrifice on day +2 '
Treatment Rat # Weight at daY +2 Treatment Rat # Weight at day +2
Glutamine
&
No MTX
35
4l
45
57
58
63
27.91
31.87
27.9t
31.58
46.79
44.91
Glutamine
&
MTX
31
38
42
43
46
67
18 54
17.83
74.33
19.49
15.12
t9.44
mean
sem
35.16
3.46
17.46
0.91
Treatment Rat # Weight atDaY +2 Treatment Rat # Weight atDay +2
Casein
&
NO MTX
JJ
36
50
54
65
ó8
25.11
23.60
30.69
35.11
32.56
Casein
&,
MTX
32
44
52
53
64
66
18.86
t7.47
23.46
18.08
22.02
17.81
mean
sem
29.41
2.19
25.43
3.5

188
HistomorphomettY
There is no diet effect throughout, but MTX has a significant effect on all parameters except
villus area. The results are shown in Table 6.33.6. Figure 6'33'6 shows villus area and crypt
length, and Figure 6.33.7 shows mitotic index. As can be seen, there is no change in villus area'
The reduction in crypt length with MTX is significant (p:0.000) as is the reduction in mitotic
index (p:0.000). The mitotic index in the glutamine and MTX treated rats is double that in the
casein and MTX rats, but the protection is not clinically significant given the large reduction in
scores due to the chemotherapy. The apoptotic counts per crypt are shown in Table 6'33'8, for
both jejunum and ileum. MTX increased apoptotic counts in the ileum (p:0.0001) as shown in
Figure 6.33.8, and in the jejunum (p:0.003), as shown in Figure 6'33'9' There was no
difference between the casein and glutamine fed rats'
Tumour indices
Tumour proliferation, as measured by mitotic counts per unit area, is shown in Figure 6'33'10'
Tumour proliferation was higher in glutamine fed rats, and showed no significant reduction
after MTX (p:0.51).The apoptotic count per unit area for the tumours is shown in Figure
6.33.11. MTX produced an increase in apoptosis on day +2 (p:0'008), but again there was no
significant diet effect.
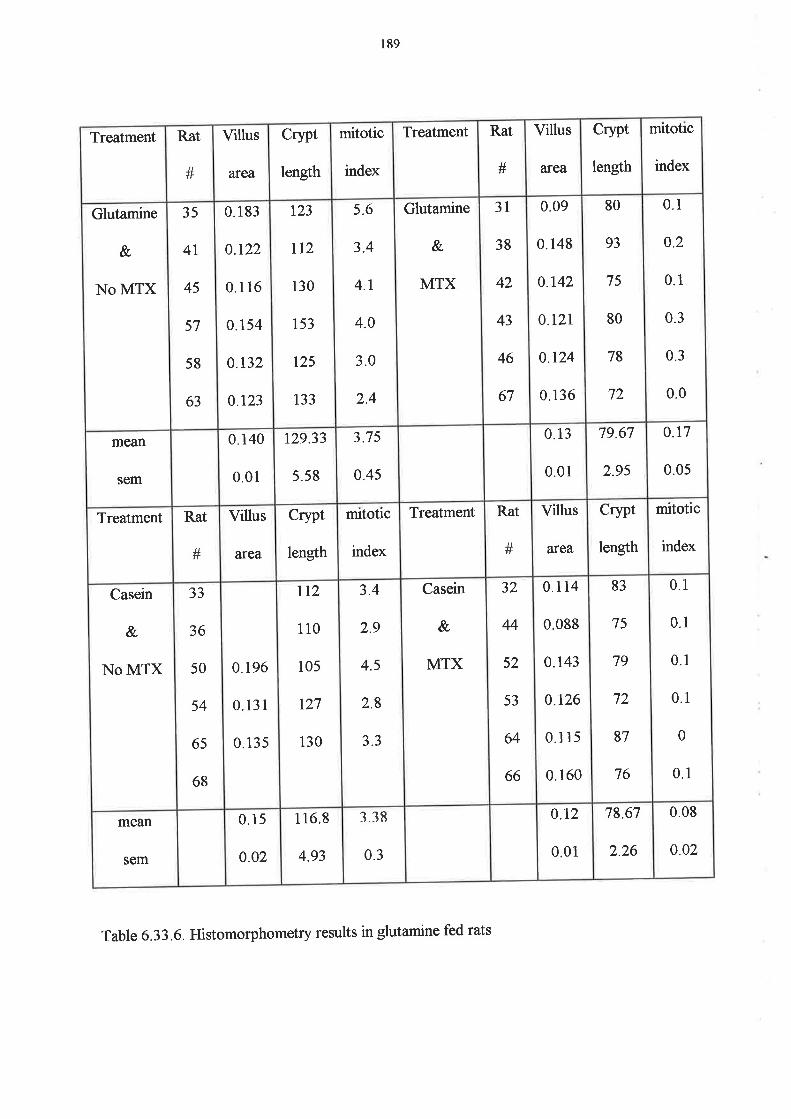
189
Treatment Rat
#
Villus
aÍea
crypt
length
mitotic
index
Treatment Rat
#
Villus
area
crypt
length
mitotic
index
Glutamine
&
NO MTX
35
4L
45
57
58
63
0. r83
0.t22
0.1 16
0.r54
0.132
0.123
r23
712
130
153
r25
133
5.6
3.4
4.1
4.0
3.0
2.4
Glutamine
&
MTX
31
38
42
43
46
67
0.09
0.148
0.142
0.r21
0.r24
0.136
80
93
75
80
78
72
0.1
o.2
0.1
0.3
0.3
0.0
mean
sem
0.140
0.01
r29.33
5.58
3.75
0.45
0.13
0.01
79.67
2.9s
o.t7
0.05
Treatment Rat
#
Villus
afea
crypt
length
mitotic
index
Treatment Rat
#
Villus
area
crypt
length
mitotic
index
Casein
&
NO MTX
JJ
36
50
54
65
68
0.196
0.131
0.135
tt2
110
105
t27
130
3.4
2.9
4.5
2.8
3.3
Casein
&
MTX
32
44
52
53
64
66
0.114
0 088
0.143
0.126
0.1 15
0.160
83
75
79
72
87
76
0.1
0.1
0.1
0.1
0
0.1
mo&n
sem
0.15
0.o2
116.8
4.93
338
0.3
0.12
0.01
78.67
2.26
0.08
o.o2
Table 6.33.6. Histomorphometry results in glutamine fed rats
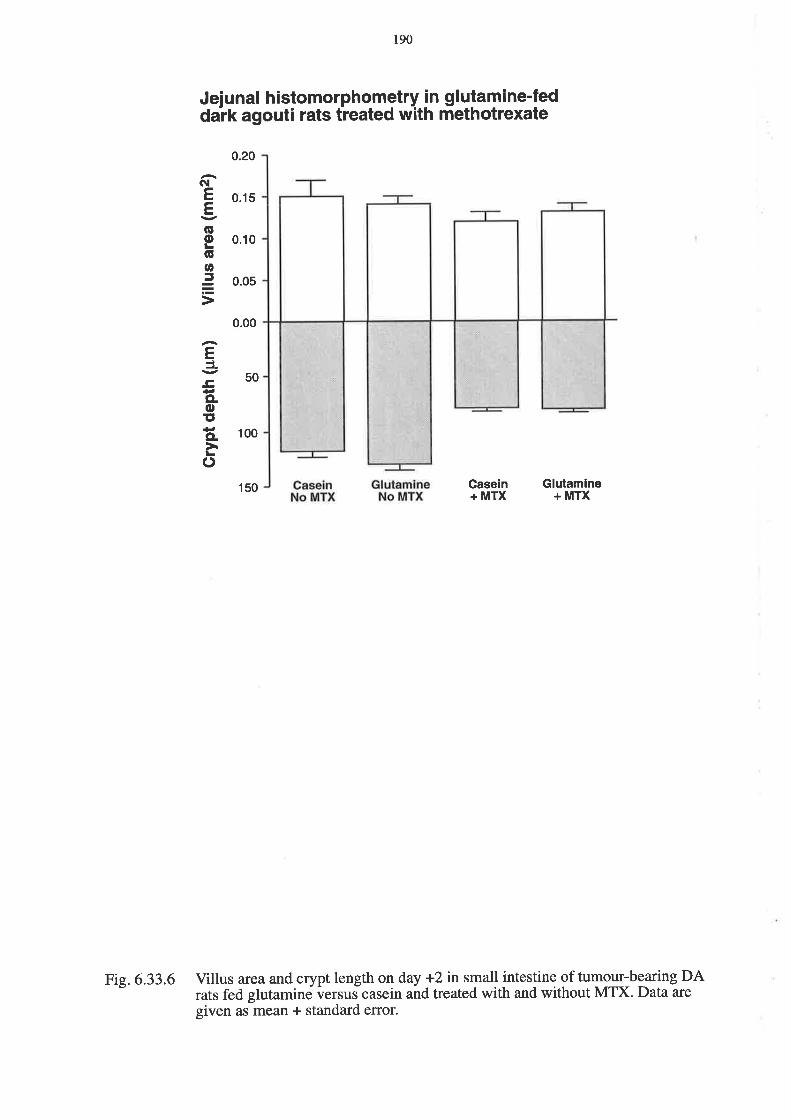
Jeiunal histomorphometry in glutamine-feddark agouti rats treated with methotrexate
190
Gasein+ MTX
Glutamine+ MTX
GI
EE(úoGtt,ã
EJ¿,ECLoIto.à()
0.20
0.15
0.00
50
150
0.10
0.05
100
Fig. 6.33.6 Villus area and crypt length on day +2 in small intestine of tumour-bearing DArats fed glutamine versus casein and treated with and without MTX. Data are
given as mean + standard error.

l9l
Jejunal mitoses in glutamine-fed dark agouti ratstreated with methotrexate
5
Casein+ MTX
4
3
2
CL
LooCL
tro(t.9o.=
=0
CaseinNo MTX
GlutamineNo MTX
Glutamine+ MTX
Fig. 6.33.7 Mitotic count per jejunal crypt on day +2in qrygg-b:aring DArats fed glutamineversus caseinãnd treated with and without MTX. Data are given as mean +standard error.

Apoptosis in rat ileum
0.5
0.4
0.3
o.2
0.1
0.0CaseinNo MTX
CL
Lo¡-oCLID
c=oo
192
GlutamineNo MTX
Casein+ MTX
Glutamine+ MTX
Fig. 6.33.8 Apoptotic counts per crypt in dark agouti rat ileum on day +2 following treatmentwith-either MTX or saline. Data are given as mean + standard error.

193
Apoptosis in rat jejunum
0.7
0.6
0.5
o.4
0.3
o.2
0.1
0.0CaseinNo MTX
CL
LoLoCLat,
gão()
GlutamineNo MTX
Casein+ MTX
Glutamine+ MTX
Fig.6.33.9 Apoptotic counts per crypt in ratjejunum on day +2 following treatment witheiaher MTX or saline. Data are given as mean + standard error.
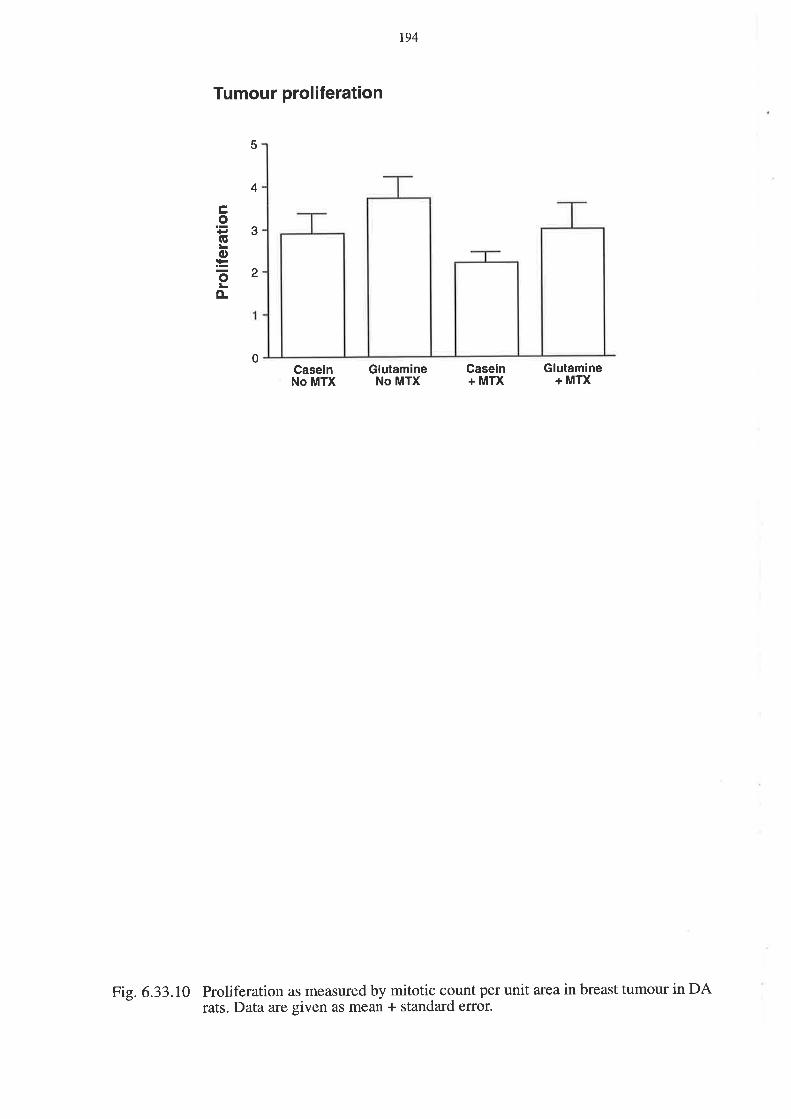
Tumour proliferation
CaseinNo MTX
194
GlutamineNo MTX
Casein+ MTX
Glutamine+ MTX
5
4
3
2
ÊoGLo:=õo-
0
Fig. 6.33.10 Proliferation as measured by mitotic count per unit area in breast tumour in DArats. Data are given as mean + standard error.

Tumour apoptosis
CaseinNo MTX
.t2tooCLoCL
6
5
4
3
2
195
GlutamineNo MTX
Casein+ MTX
Glutamine+ MTX
1
0
Tumour apoptosis in DA rat breast carcinoma. Apoptosis is measured per unitarea. Data are given as mean + standard error.
Fig.6.33.11

t96
6.34 DISCUSSION
Our studies showed a trend for glutamine to increase tumour growth, and also to increase the
ability of MTX to kill the tumour, however this did not reach statistical significance, in contrast
to Klimberg's report (l1l). Thus glutamine would be safe for use in human cancer trials'
However, it did not significantly ameliorate the efFects of MTX on the small intestinal mucosa.
From the results of recent publications (117), it would seem that glutamine alone is unlikely to
be of value in chemoprotection, but it may well have a role as part of a combination of factors
for the future (10).
The tumour burden in this study may have played a role in the lack of success of the glutamine.
We had intended to administer the chemotherapy when the rats had a tumour burden of
approximat ?,ly 5% of body weight, but the tumour grew faster than anticipated, so that tumour
burden at MTX injection was already approximately l}Yo. This is a very heavy tumour burden,
and can itself be associated with malnutrition, cachexia and non-specifïc small bowel
histological changes. Rofe in this model (191) found that MTX reduced the glucose
requirements of the tumour at the same time as inhibiting tumour progression'
Future work will be carried out at a lower tumour burden. The dose of methotrexate of l'5
mglkgfor two consecutive days proved to be successful in causing nonlethal small intestinal
mucositis, and also reducing tumour growth. The same dose will be used in future studies'

197
CHAPTER 7
SUMMARY OF INVESTIGATIONS INTO SMALL INTESTINAL EFFECTS OF
CYTOTOXIC CHEMOTHERAPY
7.1, Intestinal permeability after high-dose chemotherapy
High-dose chemotherapy caused a transient increase in intestinal sugar permeability, which
reached a peak 14 days after the start ofchemotherapy and recovered by 35 days after the start
of chemotherapy. It was characterised by both a decrease in monosaccharide absorption'
implying villous atrophy, and an increase in disaccharide absorption, implying opening of the
intraepithelial tight junctions. It was further accompanied by oral mucositis in all patients, and
small intestinal mucositis in 4lyo of patients. This indicated that small intestinal permeability is
likely to be useful in assessing intestinal mucositis'
7.2 Small intestinal symptoms, function and morphology following chemotherapy
Symptoms, function and histological changes all paralleled one another (see Table 7'1)' The
earliest change was an increase in apoptosis in small intestinal crypts at I day after
chemotherapy, followed by crypt hypoplasia at day 3 and normalisation by day 16'
Gastrointestinal symptoms peaked at days 3 to'r,while oral mucositis was slowerto peak at
days 10 to 14. All recovered by day 28. Nutritional changes were small, with transient weight
loss, albumin and transferrin reduction, which all normalised by day 28. Functional permeability
changes were less pronounced with the isotonic sugar solution, and remained abnormal for
longer, as these did not recover by day 28. There was also a dose-eflect in permeability, with
changes being confined to the high-dose chemotherapy group. Transferrin reduction, weight

198
and body mass index reduction also showed a dose effect, but all other changes occurred both
in patients on standard and high dose chemotherapy. Electron microscopy confirmed the
opening of the tight gap junctions, but this reversed by day 16'
7.3 The DA rat mammary adenocarcinoma and the role of glutamine in mucositis
prevention.
The DA rat mammary adenocarcinoma model is a useful model for the study of small intestinal
mucositis. A dose of 1.5 mglkgim for two consecutive days reliably caused severe, non-lethal
mucositis. The mammary tumours implanted subcutaneously were able to be studied
simultaneously with the small intestine and allow assessment of safety of cytoprotectants'
Glutamine had no significant effect in reducing small intestinal mucositis caused by MTX'
7.4 These results in the context of the published literature
These results agree with the published literature, which has shown small intestinal
hypoproliferation followed by hyperproliferation in the small intestine after chemotherapy. we
confirmed the work of Trier and others, and showed that these changes occurred over three to
seven days in humans, in contrast with published rodent work by Potten and others which
showed a shorter time course (See Table 2.1). These results expand our knowledge of the
sequence of events in human small intestinal mucositis, by showing that apoptosis is the first
event in the crypts. They also show that histological changes occur at the same time as
gastrointestinal symptoms. The timing of oral mucositis, however, coincides neither with
gastrointestinal symptoms nor small intestinal mucositis, confirming that oral mucositis is not a
good indicator of changes in the small intestine'

199
Table 7.1. An overview of changes found with time after chemotherapy. An x indicates the
presence ofchanges.
Day Pre I 3 3 7 10 t4 t6 28
GIT symptoms x x x x
Oral symptoms x x x
Nutrition x x x x x
Permeability x x x x x x x
Morphology x x x

200
We have demonstrated that the DA mammary adenocarcinoma model is a useful model for
further research that will be required before testing potential cytoprotectants in humans. A
dose of 1.5 mglkg reliably produces small intestinal mucositis, and the same histological
techniques can be applied to the small intestine as in humans, with the tumour also being
evaluable.
7.5 L platform for future research
Further work planned includes expansion of the DA rat model to assess other agents and
compare them with glutamine. Potential candidate agents include TGF-P, IL-11, WGFE and
KGF. In the future, a mixture of agents may be required, and this would be an excellent model
in which to test the efFect on small intestinal mucositis. Any agents that showed response in
this model without promoting tumour growth could then be considered for human clinical
trials, either singly or in combination.
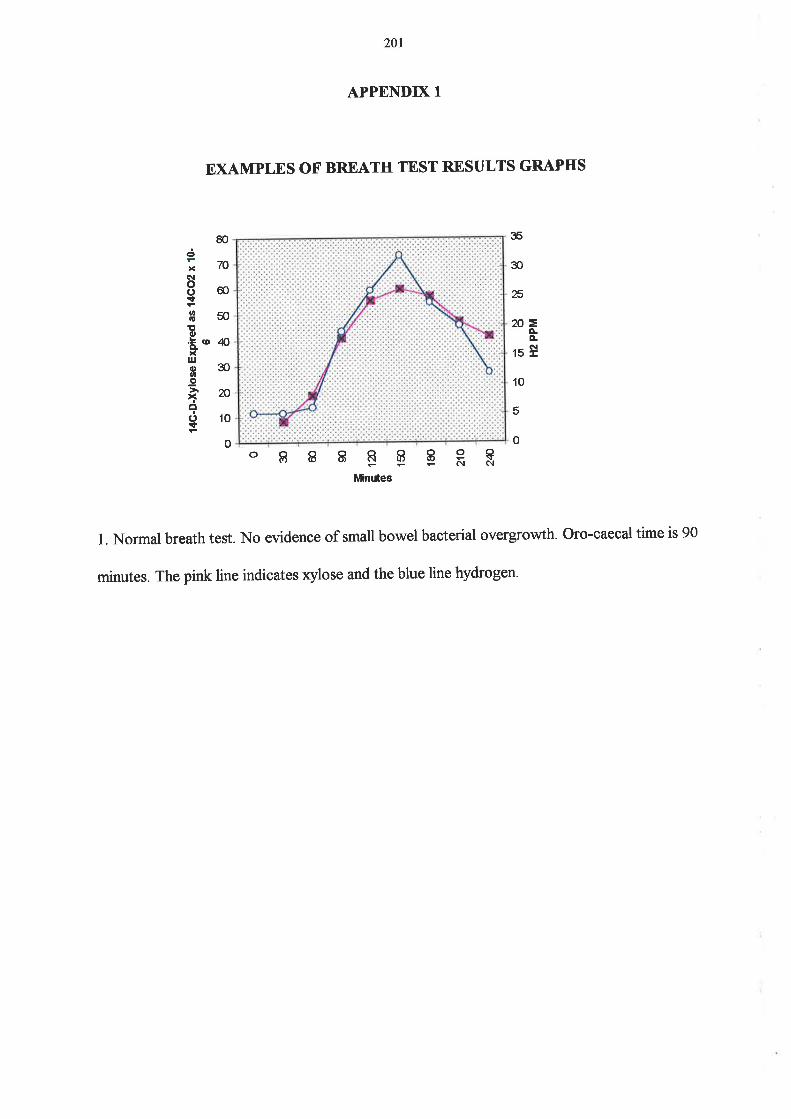
201
APPENDD( 1
EXAMPLES OF BREATH TEST RESULTS GRAPHS
1. Normal breath test. No evidence of small bowel bacterial overgrowth. Oro-caecal time is 90
minutes. The pink line indicates xylose and the blue line hydrogen.
80¿;70(\l
8Got8sotto'ä t 'K)xt¡Jo3OtD
.9
.ìq(Jlot
o
35
30
Æ
n=ÈÀrsÈ
10
5
0o888EEERRMinúeg

202
30
nto
o
2. A positive response indicating small bowel bacterial overgrowth. The pink line indicates
xylose and the blue line hYdrogen.
80
70
60
50=ÀÀNE
o888EEERRMinutes
Ëoo(,+ßso!t6'':9'40ulo)tt.9 30
xôonç
n1E
16
't4
12
10
I
6
4
2
o
=o.ÈN+
03060 90 1n 150
Mnutes
180 2'to 2Æ
3. An equivocal result, with no rise in breath hydrogen, nor a peak in t*C-D-xylose. The pink
line indicates xylose and the blue line hydrogen'

203
APPENDD( tr
CHEMOTHERAPY REGIMENS RECEIVED BY PATMNTS AS PART OF STUDY
1. Standard dose chemotherapy regimens
Regimen Drugs and doses Number of patients
AC doxorubicin 60
cyclophosphamide 600 mg/t*
2
Platinum/etoposide cisplatin 75 mglm d1
etoposide loo mgln?ld dl-3
7
MOPP mustine 6 mÚ
vincristine l.a mglnf
procarbazine I 00 mg/rr.?
prednisolone 40 mglrtf
2
5.FU 5-fluorourac\l425 ld dt-s J
PCAB prednisolone 60 dl-5
cyclophosphamide 600 mglm2 dl
doxorubicin 30 mglm2 dl
BCNU lo mg/nf dt
I
S-FU/Lobaplatin S-fluorouracil 1000 dr-s
lobaplatin SO mglr* dt
1

204
M-VAP methotrexate 30
vinblastine 3 mglnf
doxorubicin3O mglÑ
carboplatin AUC dose of 4-5 mg/ml min
I
MVC mitomycin I
vinblastine 6 mgkr]
cisplatin 50 m{rr?
I
I(ISH cisplatin too mg/m2 dl
5-fluorouracil 200 mg/rr? d d1-5
J
COP cyclophosphamide 750
vincristine l.a mglnf
prednisolone 100 mghÊ al-s
2
CMF cyclophosphamide 750 mglrr:2:
methotrexate 60 mg/m2
5-fluorouracil 750 mglÍ?
J
CHOP cyclophosphamide 750
vincristine 1.4 mglm2
doxorubicin5O mglm2
prednisolone 100 mglnf Als
1
AC doxorubicin 25 d1-3
cisplatin 100 mg/m2 dl
J
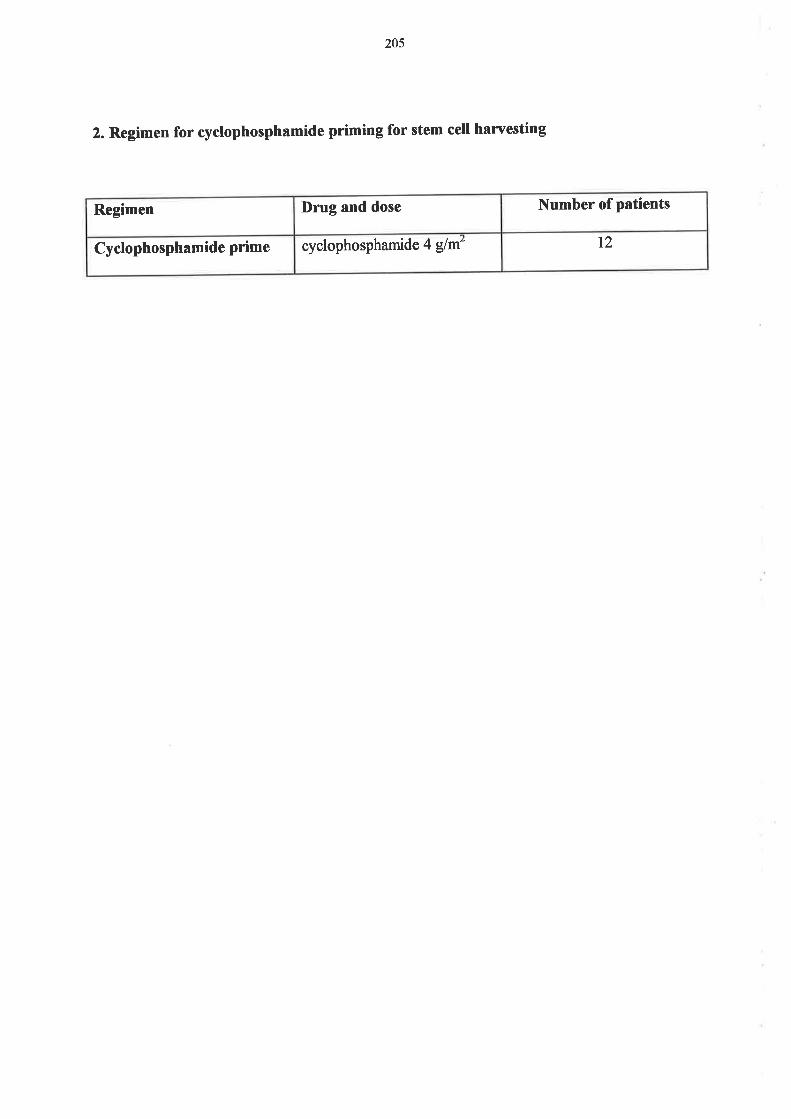
205
2. Regimen for cyclophosphamide priming for stem cell harvesting
Regimen Drug and dose Number of patients
Cyclophosphamide Prime cyclophosphamide 4 slnf t2

206
3. High-dose chemotherapy regimens
Drugs and doses Number of patients
ifosphamide ld dt-s
etoposide 600 mglÍf ld dl-3
I
carboplatin 250 mgh#ld d1-5
etoposide 600 mghÊld d1-3
ifosphamide 3elnf ld dl-s
I
melphalan 95 dl
carboplatin loo mglÑld d2-4
cyclophosphamide 35 mg/kgld d2-a
5
epirubicin 200 mglnf
cyclophosphamide lg/t ?
5
melphalan 140 ddl
carboplatin 4oO mdnfl d d2-3
etoposide 3oo mglÍfld d4-7
cytarabine zoo mg/rf ld d4-7
4
busulphan a mglkgld il-a
cyclophosphamide 60 mg/k{d d5-6
1

207
APPENDD( Itr
INDTVIDUAL PATMNT ORAL AND GASTROINTESTINAL TOXICITY GRADING
USING THE NCI COMMON TOXICITY CRITERIA
Patient number Nausea Vomiting I)iarrhoea Stomatitis Overall
1 0 0
2 1 I
3 0 0
4 1 1
5 0 0
6 0 0
7 0 0
I J J
9 0 0
10 0 0
LI J J
t2 0 0
13 2 2
14 J J
15 0 0
16 I 1
t7 J J
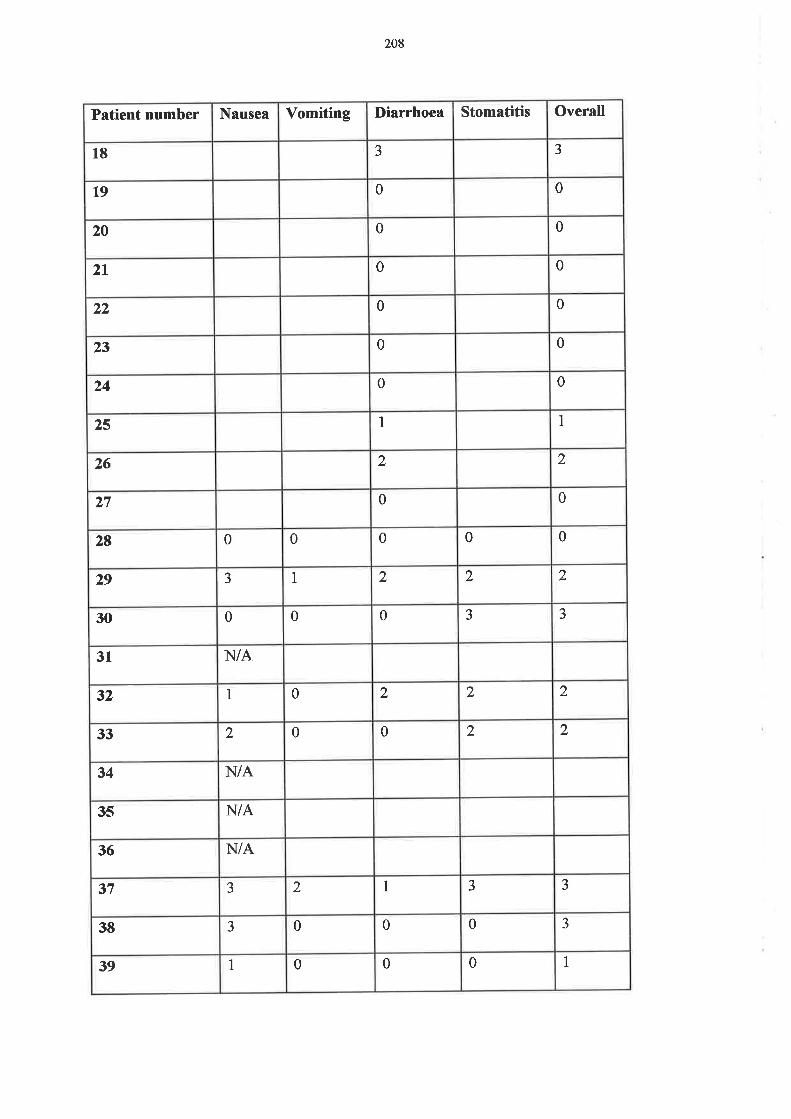
208
Patient number Nausea Vomiting I)iarrhoea Stomatitis Overall
18 J J
t9 0 0
20 0 0
2t 0 0
22 0 0
23 0 0
24 0 0
25 I I
26 2 2
)n 0 0
28 0 0 0 0 0
29 J 1 2 2 2
30 0 0 0 J )
31 N/A
32 I 0 2 2 2
33 2 0 0 2 2
34 N/A
35 N/A
36 N/A
37 J 2 I J J
38 J 0 0 0 3
39 I 0 0 0 I
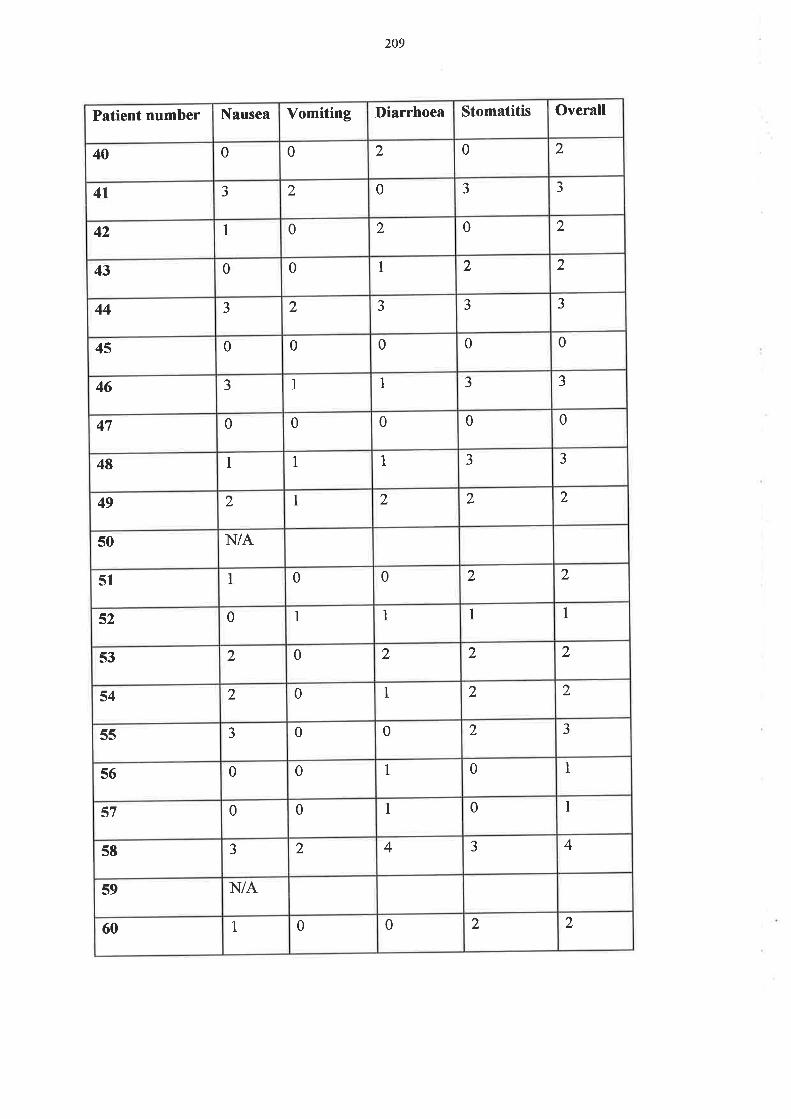
209
Patient number Nausea Vomiting I)iarrhoea Stomatitis Overall
40 0 0 2 0 2
4t J 2 0 J J
42 1 0 2 0 2
43 0 0 I 2 2
44 J 2 J J J
45 0 0 0 0 0
46 J 1 1 J J
47 0 0 0 0 0
48 1 1 1 J J
49 2 I 2 2 2
50 N/A
51 I 0 0 2 2
52 0 1 1 I 1
53 2 0 2 2 2
54 2 0 1 2 2
55 J 0 0 2 J
5ó 0 0 1 0 1
s7 0 0 I 0 I
58 J 2 4 J 4
59 N/A
60 1 0 0 2 2

2t0
BIBLIOGRAPHY
l. Sonis ST. Complications of cancer and their treatment: oral complications- In: Holland
JF, Frei E, Bast Rc, Kufe D'w, Morton DL, Weichselbaum R\ eds. cancer
Medicine. 3 ed. Philadelphia London: Lea&Febiger, 1993.2381-2388.
Z. Potten CS. The role of stem cells in the regeneration of intestinal crypts after cytotoxic
exposure. In: Chemically Induced Cell Proliferation: Implications for Risk
Assessment. \ililey-Liss, Inc., 1 99 I : I 5 5- 1 7 I .
3. De Vita V, Jr. Principles of cancer management: Chemotherapy. In: De Vita V, Jr.,
Hellman SS, Rosenberg Sd eds. Cancer: Principles and Practice of Oncology. 5 ed.
Philadelphia: Lippincott-Raven, 1997 :333 -3 47 .
4. Sonis ST, Haley JD. Biologicals and immunologicals: Pharmacological attenuation of
chemotherapy-induced oral mucositis. Exp.Opin.Invest.Drugs 1996,5'.1155-1162.
Hathaway G, Stern C, Kletzel M. Clinical problem: mucositis. J.Assoc.PediatrOncol.5
7
Nurses. 1986;3:23,34.
6. Mitchell EP, Schein PS. Gastrointestinal toxicity of chemotherapeutic agents
S emin. Onc ol 1982;9 : 52'64
Miller AB, Hoogstraten B, Staquet M, Winkler A. Reporting results of cancer treatment.
Cancer l98l ;47'.207 -214
8. Ajani JA, Welch SR" Martin RN, Raber MN, Fields WS, K¡akoff IH. Comprehensive
criteria for assessing therapy-induced toxicity. Cancer Investigation 1990;8:147-159.

2tr
9. Ijiri K, Potten CS. Further studies on the response of intestinal crypt cells of different
hierarchical status to eighteen different cytotoxic agents. Br.J.Cancer 1987;55:113-
123.
10. 'Wilmore DW. Metabolic support of the gastrointestinal tract. Cancer 1997;79:1794-
1803
11. pearson AD, Craft AW, Pledger fV, Eastham EJ, Laker MF, Pearson GL. Small bowel
function in acute lymphoblastic leukaemia. Arch.Dis.Child 1984;59'.460-465.
12. Craft AW, Rankin d Aherne rW. Methotrexate absorption in children with acute
lymphoblastic leukaemia. Cancer Treatment Reports 198l;65:77'81.
13. Daniele B, Secondulfo M, Pignata S, et al. Effect of chemotherapy with 5-fluorouracil on
intestinal permeability of patients with advanced colon cancer. Eur.J.Cancer
1997;33:5169(abst)
14. Lewis JH. Gastrointestinal injury due to medicinal agents. Am.J.Gastroenterol.
1986;81:819-834.
15. Jankowski JA, Goodlad R{ Wright NA. Maintenance of normal intestinal mucosa:
function, structure, and adaptation. Gut 1994;s1-s4
16. Cummins AG, Roberts-Thomson IC. Role of the epithelium in defence of the small and
large intestine. In: Immunopharmacology of Epithelial Barriers. Academic Press
Limited, 1994:213 -223 .
17. potten CS, Loeffler M. Stem cells: attributes, cycles, spirals, pitfalls and uncertainties.
Lessons for and from the crypt. Development 1990;l l0:1001-1020.

212
lg. Eastwood GL. Gastrointestinal epithelial renewal. Gastroenterology 1977;72:962'975.
19. Wright NA. Stem cell repertoire in the intestine. In: Potten C.S., ed. Stem Cells. London:
Academic Press, 1997'.3 15 -330.
ZO. Daniele B, D'Agostino L. Proliferation and differentiation in the small intestinal
epithelium: from petri dish to bedside. Ital J Gastroenterol 1996;26:459-470.
Zl. podolsþ DK. Regulation of intestinal epithelial proliferation: a few answers, many
questions. Am.J.Physiol. 1993;Gl79-G186
22. Moukadiri H, Gouzi L, Detolle-sarbach s, Guez D, Plouet J. Inhibition of basic
fibroblast growth factor and vasculotropin biological activities on cultured cells by
almitrine.BiochimicaetBiophysicaActaTgg5;168-|72.
23. Koyama S, podolsþ DK. Differential expression of transforming growth factors a and p
in rat intestinal epithelial cells. J. Clin.Invest. 1 989;83'.17 68'17 7 3 .
24. Steeb CB, Trahair JF, Tomas FM, Read LC. Prolonged administration of insulinlike
growth factor peptides (IGFÐ enhances growth of gastrointestinal tissues in normal
rats. Am.J.Physiol. 1994;226:Gl 090-G1098
25. Heirz-Flnan P, Kessler u, Funk B, Gais P, Kiess w. Identification and in situ
localization of the insulinJike growth factor-IVmannose-6-phosphate (IGF-IVM6P)
receptor in the rat gastrointestinal tract: comparison with the IGF-I receptor.
Endocrinology 1 991 ;1 29'.17 69-177 8'
26. Park HY, McCusker RH, Vanderhoof JA" Mohammadpour D, Harty RF, MacDonald
RG. Secretion of insulinJike growth factor II (IGF-IÐ and IGF-binding protein-Zby

213
intestinal epithelial (IEC-6) cells: implications for autocrine growth regulation.
Endocrinol ogy 1992;13 I : I 3 59- I 368'
27. Booth C, Evans GS, Potten CS. Growth factor regulation of proliferation in primary
cultures of small intestinal epithelium. In Vitro Cell.Dev.Biol. 1995;3l234-243.
2g. Goodlad RA. Microdissection-based techniques for the determination of cell proliferation
in gastrointestinal epithelium: application to animal and human studies. In: Cell
Biology: A Laboratory Handbook. Academic Press, lnc., 1994'.205-216.
Zg. Dahlqvist A. Method for assay of intestinal disaccharidases. Analytical Biochemistry
1964;7:18-25.
30. Dyduch ,\ St Ceplewski Z, Koehler M, Piszka B. Disaccharidases activity in the
intestinal mucosa after methotrexate therapy. Pediatr. Hematol. Oncol. 1990;7:221-
227.(abst)
31. Bjarnason I, Macpherson ,\ Hollander D. Intestinal permeabilþ: an overview.
Gastroenterology 1995;108: 1 566- I 58 1.
32. Miki, K., Butler, R., Moore, D., and Davidson, G. Rapid and simultaneous quantifïcation
of rhamnose, mannitol, and lactulose in urine by I{PLC in the estimation of intestinal
permeability in pediatric practice. Clin. Chem.l996;a2Q):7 l'7 5'
33. Keefe DMK, Cummins AG, Dale BM, Kotasek D, Robb TA" Sage RE. The effect of
high-dose chemotherapy on intestinal permeability in humans. Clin. Sci. 1997;92:385-
389.

2t4
34. Eaton KK, Howard M, Howard JMHM. Gut permeabilþ measured by polyethylene
glycol absorption in abnormal gut fermentation as compared with food intolerance.
Journal of the Royal Society of Medicine 1995;88:63-66.
35. Teahon K, Somasundaram S, Smith T, Menzies IS, Bjarnason I. Assessing the site of
increased intestinal permeability in coeliac and inflammatory bowel disease. Gut
1996;38:864-869.
36. Forbes GM, Erber WN, Herrmann RP, Davies JM, Collins BJ. Immunohistochemical
changes in sigmoid colon after allogeneic and autologous bone marrow
transplantation. J Clin Pathol I 995 ;48: 308-3 I 3.
37. Cummins AG, Penttila IA Labrooy JT, Robb T,\ Davidson GP. Recovery of the small
intestine in coeliac disease on a gluten-free diet: changes in intestinal permeability,
small bowel morphology and T-cell activity. J. Gastroenterol. Hepatol. 1991;6:53-
57
38. Bijlsma PB, Peeters Rd Groot JA Dekker PR, Taminiau JAJM, Van Der Meer R.
Differential in vivo and in vitro intestinal permeability to lactulose and mannitol in
animals and humans: a hypothesis. Gastroenterology I 995 ; I 08 : 687 -696.
39. Rumessen JJ, Gudmand-Høyer E, Bachmann E, Justesen T. Diagnosis of bacterial
overgrowth of the small intestine: comparison of the r4c-D-Xylose breath test and
j ejunal culture in 60 patients. Scand. J. Gastroente r ol. 199 5 ;20: 1267 -127 5 .
40. Riordan SM, Mclver CJ, Duncombe VM, Bolin TD. Bacteriologic analysis of mucosal
biopsy specimens for detecting small intestinal bacterial overgrowth.
Scand.J.Gastroenterol. I 995;30: 68 I -685.

42
43
2t5
41. Smith GM, Chesner IM, Asquith P, Leyland MJ. Small intestinal bacterial overgrowth in
patients with chronic lymphocytic leukaemia. J clin Pathol 1990;43:57-59'
Tisdale MJ. Biology of Cachexia: Review. J'Natl.Cancer Inst' 1997;89:1763'1773
Rich AJ. Nutritional status in cancer. Anticancer Research 1987;7:271-280
44. Rofe AM, Bourgeois cs, coyle P, Taylor A5 Abdi EA. Altered insulin response to
glucose in weightJosing cancer patients. Anticancer Res' 1994;14"647-650'
45. Keller u. Pathophysiology of cancer cachexia. support care cancer 1993;1"290-294'
46. Souba rWW. Nutritional Support. In: De Vita V, Jr'' Hellman SS, Rosenberg Sd eds'
Cancer: principles and Practice of Oncology. 5 ed. Philadelphia: Lippincott-Raven,
1997:2841-2856.
47. Miller A" Lider O, Roberts AB, Sporn MB, Weiner HL. Suppressor T cells generated by
oral tolerization to myelin basic protein suppress both ln vitro and in vivo immune
responses by the release of transforming growth factor p after antigen - specific
triggering. Proc.Natl. Acad. S ci' US A 1992;89 "
421 -425'
4g. Nelson KA" Walsh D, Sheehan FA. The cancer anorexia-cachexia syndrome. J' Clin'
Oncol. 1994;12'.213 -225.
49. Le Bricon T, Gugins s, cynober L, Baracos vE' Negative impact of cancer
chemotherapy on protein metabolism in healthy and tumor-bearing rats. Metabolism
1995;44:1340-1348.
50. Dewys wD, Begg c, Lavin PT, et al. Prognostic effect of weight loss prior to
chemotherapy in cancer patients. Am.J.Med 1980;69"49L-497 .
2t6
5l . Ferguson A. Immunological functions of the gut in relation to nutritional state and mode
of delivery of nutrients. Gut 1994;s10-s12
52. Alison I\[R, Sarraf CE. The role of growth factors in gastrointestinal cell proliferation'
Cell Biology International 1994;l 8: l-10'
53. Wyllie AH, Kerr JF\ Cunie AR. Cell death: the significance of apoptosis. International
Review of Cytology 1980;68:25 1-306'
54. Allan DJ, Harmon BV. The morphologic categorization of cell death induced by mild
hyperthermia and comparison with death induced by ionizing radiation and cytotoxic
drugs. Scan.Electron Microsc' 1986;1 l2l-1133 '
55. Potten c.S., wilson JW, Booth c. Regulation and significance of apoptosis in the stem
cells of the gastrointestinal epithelium. Stem.Cells 1997 ;15"82-93'
56. Kuhn R, Lohler J, Rennick D, Rajewsky K, Muller w. Interleukin-Io-deficient mice
develop chronic enterocolitis Cell 1993;7 5:263-27 4'
57. Hall Pd coates PJ, Ansari B, Hopwood D. Regulation of cell number in the mammalian
gastrointestinal tract: the importance of apoptosis. J. Cell Sci' 1994;107"3569-3577 '
5g. wyllie AH. Apoptosis and the regulation of cell numbers in normal and neoplastic
tissues: an overview. Cancer and Metastasis Reviews 1992;ll:95-103'
59. Ijiri K, potten CS. Response of intestinal cells of differing topographical and hierachical
st.tus to ten cytotoxic drugs and fïve sources of radiation. Br.J.Cancer 1983;47"175-185.

2r7
60. Gavrieli y, Sherman y, Ben-sasson SA. Identification of programmed cell death in situ
via specific labeling of nuclear DNA fragmentation. Journal of Cell Biol
1992;l19493-501.
61. Moss SF, Attia L, Scholes JV, Walters JRF, Holt PR. Increased small intestinal apoptosis
in coeliac disease. Gut 1996;39:811-817.
62. Deitch EA. Bacterial translocation: the influence of dietary variables. Gut 1994;523-527
63. Rofe AM, Bourgeois CS, Coyle P. Bene{ïcial effects of endotoxin treatment on
metabolism in tumour-bearing rats. Immunol.Cell Biol. 1992;70:l'7.
64. Berg RD. Bacterial translocation from the gastrointestinal tracts of mice receiving
immunosuppressive chemotherapeutic agents. Current Microbiology 1983;8:285-
292
65. Trier JS. Morphologic alterations induced by methotrexate in the mucosa of human
proximal intestine. Gastroenterology 1962.42:295 -3 05'
66. Trier JS. Morphologic alterations induced by methotrexate in the mucosa of the
proximal small intestine: IL Serial observations by electron microscopy.
Gastroenterology 1962;43'.407 -424.
67. Taminiau JAJM, Gall DG, Hamilton JR. Response of the rat small-intestine epithelium to
methotrexate. Gut 198O;21486'492.
6g. Ecknauer IL Lohrs U. The effect of a single dose of cyclophosphamide on the jejunum of
specified pathogen-free and germ-free rats. Digesti on 197 6;1 4:269'28Q.
218
69. perkkio M, Rajantie J, Savilahti E, siimes MA. Jejunal mucosa after leukemia treatment
in children. Acta Paediatr Scand 1984;73:680-684'
70. Prajda N, Kralovanszþ J, Kerpel Fronius S, Gal F, Szentirmay Z' Enzymological and
morphological changes in rat intestinal mucosa following treatment with alþlating
sugar alcohol derivatives. Anticancer Res. I 985;5 :45 I -456.
71. Moore JV. Clonogenic response of cells of murine intestinal crypts to 12 cytotoxic drugs'
Cancer Chemother.Pharmacol. 1985;1 5: I 1-l 5'
72. Shaw MT, Spector MH, Ladman AJ. Effects of cancer, radiotherapy and cytotoxic drugs
on intestinal structure and function. Cancer Treatment Review 1979;6:141-151.
73. Gwavava NJT, Pinkerton CR" Glasgow JFT, Sloan JM, Bridges JM' Small bowel
enterocyte abnormalities caused by methotrexate treatment in acute lymphoblastic
leukemia of childhood' J ClinPathol 1981;34"790-795'
74. Smith Fp, Kisner DL, Widerlite L, schein PS. chemotherapeutic alteration of small
intestinal morphology and function: a progress report. J Clin Gastroenterol
7979;1.203-207.
75. Ramadan AA" yousif WB, Ali AM. The effect of methotrexate (MTX) on the small
intestine of the mouse. III. Mitochondria and succinic deþdrogenase (SDH).
Functional and Developmental Morphology 1992;2:3 -9'
76. Bessler H, Straussberg R, Alexandrova S, Beilin B, Djaldetti M, Hart J. Effect of oral
chemotherapy on the mitochondrial size of mouse intestinal cells. Cancer
Chemother.Pharmacol. I 996;3 8: 3 5-3 8.

2t9
77 . Ijiri K, potten CS. Response of intestinal cells of differing topographical and hierarchical
status to ten cytotoxic drugs and five sources of radiation. Br.J.Cancer 1983;47:175-
185.
7g. Mills EE. The modifying effect of beta-carotene on radiation and chemotherapy induced
oral mucositis. Br.J.Cancer 1988;57:41 6-417 .
79. Ijiri K, Potten CS. Radiation-hypersensitive cells in small intestinal crypts; their
relationships to clonogenic cells. Br. J. Cancer Suppl. 1986;7 :20-22.
g0. Cunningham D, Morgan RI, Mills PR, et al. Functional and structural changes of the
human proximal small intestine after cytotoxic therapy. J.Clin.Pathol. 1985;38:265-
270
81. Sartori S, Nielsen I, Trevisani L, et al. Structural changes of duodenum brush border in
lung cancer patients treated with cisplatin plus etoposide. Lung Cancer 1993;10:55-
62
gZ. potten C.S., Booth D, Haley JD. Pretreatment with transforming growth factor beta-3
protects small intestinal stem cells against radiation damage in vivo. Bri. J. Cancer
1997;75'.14s4-1459.
g3. Al-Dewachi HS, Wright N{ Appleton DR, Watson AJ. The effect of a single injection
of hydroxyrrea on cell population kinetics in the small bowel mucosa of the rat. Cell
Tissue Kinet. 197 7 ;10:203 -213 .
g4. Meldrum JB, Gupta VS, Lowes NR" Paterson AR. Toxicologic and antitumor studies on
5-hydroxymethyldeoxyr:ridine. Toxicol.Appl.Pharmacol. 1985;79:423-435.

220
85. Smit IM, Mulder NH, Sleijfer DT, et al. Gastrointestinal toxicity of chemotherapy and
the influence of hyperalimentation. Cancer I 986;5 8 : 1990-1994.
Bó. Forbes GM, Rule SAJ, Herrmann RP, Davies JM, Collins BJ. A prospective study of
screening upper gastrointestinal (GI) endoscopy prior to and after bone marrow
transplantation @MT). Aust NZ J Med 1995;25:32-36.
87. Forbes GM, Erber'WN, Herrmann RP, Davies JM, Collins BJ. Immunohistochemical
changes in sigmoid colon after allogeneic and autologous bone marrow
transplantation. J Clin Pathol 1995;48:308-3 13.
88. Williams DB, Vickers CR" Atkinson K. Role of endoscopic diagnosis in bone marrow
transplantation. Australian Gastroenterology Week 1993 ;443
89. Johansson J-E, Ekman K. Gastro-intestinal toxicity related to bone maffo\ry
transplantation:disruption of the intestinal barrier precedes clinical findings. Bone
Marrow Transplant. 1997 ;19:921-925 .
90. Ferry DM, Butt TJ, Broom MF. Bacterial chemotactic oligopeptides and the intestinal
muco sal barrier. Bone Marrow Transplantation 1997 ;19 :921 -925 .
91. Ikuno N, Soda H, Watanabe M, Oka M. Irinotecan (CPT-I1) and characteristic mucosal
changes in the mouse ileum and cecum. Journal of the National Cancer Institute
1995;87'.1876-1883.
92. Mizuno M, Tamura M, Hashida M, Sezaki H. Effects of mitomycin C, 5-fluorouracil and
cyclophosphamide on drug absorption, enzyme activities and mucosal lipid
composition of intestine. J.Pharmacobiodyn. 1987 ;10:321 -329 .

221
93. Kralovanszþ J, PrajdaN, Kerpel Fronius S, Gal F, Kiss F. Comparison of intestinal toxic
effects of platinum complexes: cisplatin (CDDP), carboplatin (CBDCA), and
iproplatin (cHP) cancer chemother.Pharmacol. 1988;21:40-44.
94. Allan SG Smyth JF. Small intestinal mucosal toxicity of cis-platinum - comparison of
toxicþ with platinum analogues and dexamethasone. Br.J.Cancer 1986;53:355-360.
95. Lifschitz CH, Mahoney DH. Low-dose methotrexate-induced changes in intestinal
permeability determined by polyethylene glycol polymers. J.Pediatr.Gastroenterol.
Nutr. 1989;9:301-306.
96. phelan MJI, Taylor W, van Heyningen C, Williams E, Thompson RN. Intestinal
absorption in patients with rheumatoid arthritis treated with methotrexate'
Clin.Rheum at. 1993 ;12:223 -225 .
97. Koninlx JFJG, Stemerdink AFE, Mirck MH, Egberts HJd van Dijk E, Mouwen JMVM.
Histochemical changes in the composition of mucins in goblet cells during
methotrexate-induced mucosal atrophy in rats. Exp.Pathol. 1988;34:125-133.
98. Siber GR, Mayer RI, Levin MJ. Increased gastrointestinal absorption of large molecules
in patients after 5-fluorouracil therapy for metastatic colon carcinoma. Cancer
Research 1980;40 :3 43 0'3 43 6.
gg. pegues DA, Daly KM, Larson RA. Use of decline in D-xylose absorption to predict
infection following intensive chemotherapy. Cancer Treatment Reports
1984;68:1489-1491.
100. Henriksson R" Franzen L, Edbom C, Littbrand B. Sucralfate: prophylaxis of mucosal
damage during cancer therapy. Scand.J.Gastroenterol.Suppl. 1995;210:45'47 '

222
101. Shenep JL, Kalwinsþ DK, Hutson PR, et al. Efücacy of oral sucralfate suspension in
prevention and treatment of chemotherapy-induced mucositis [published erratum
appears in J Pediatr 1989 May;1 la(5):9001. J.Pediatr. 1988;1 13.7 58-7 63'
102. Fidler P, Loprirt,i CL, O'Fallon JR, et al. Prospective evaluation of a chamomile
mouthwash for prevention of 5-fluorouracil-induced oral mucositis' Cancer
1996;77 .522-52s.
103. Cartee L, Petros 'WP, Rosner GL, et al' Evaluation of GM-CSF mouthwash for
prevention of chemotherapy-induced mucositis: a randomized, double-blind, dose-
ranging study. Cytokine- 1995;7:477-477 '
104. Lewis c. A review of the use of chemoprotectants in cancer chemotherapy. Drug safety
1994;11:153-162.
105. Osaki T, ueta E, yoneda K, Hirota J, Yamamoto T. Prophylaxis of oral mucositis
associated with chemoradiotherapy for oral carcinoma by Azelastine hydrochloride
(Azetastine) with other antioxidants. Head Neck 1994;16'.331-339'
106. sonis sT, clairmont F, Lockhart PB, Connolly sF. Benzydamine HCL in the
management of chemotherapy-induced mucositis. I. Pilot study. J.Oral Med'
1985;40:67-71.
107. Wardley, A. M., Potten C.S., and Scarffe, J. H. Clinical investigations in mucositis: an
emerging role for granulocyte-macrophage colony-stimulating factor (GM-CSF)'
ECCOg(Meet the Professor session), 1997. Conference Proceeding
108. Kannan v, Bapsy PP, Anantha N, Doval DC, Vaithianathan H, Banumathy G' Efücacy
and safety of granulocyte macrophage-colony stimulating factor (GM-CSF) on the
223
frequency and severity of radiation mucositis in patients with head and neck
carcinoma. Int. J.Radiation oncology Biol.Phy s. 1997 ;37 :l 005- I 0 I 0.
109. Ibrahim E, Al Mulhim F. Use of granulocyte-macrophage colony stimulating factor in
chemotherapy induced oral mucositis in non-neutropaenic cancer patients.
Proceedings of ASCO 1998;17 :335(abst)
110. Malhotra D, DeMeo M, Kruger ,\ et al. Oral elemental nutrition improves
gastrointestinal mucosal integrþ in patients undergoing bone marrow
transplantation. Proceedings ofASCO 1996;15:450
1l 1 Klimberg VS, Pappas AA" Nwokedi E, et al. Effect of supplemental dietary glutamine on
methotrexate concentrations in tumors. Arch Surg 1992;127 :1317 -1320.
ll2. Zie$er TR, Young LS, Benfell K, et al. Clinical and metabolic efücacy of glutamine-
supplemented parenteral nutrition after bone marrow transplantation. Ann. Int. Med.
1992;176:821-828.
l 13. Skubitz KM, Anderson PM. Oral glutamine to prevent chemotherapy induced stomatitis.
A pilot study. J Lab clin Med 1996;127:223-228.
ll4. Elia M, Lunn PG. The use of glutamine in the treatment of gastrointestinal disorders in
man. Nutrition 1997 ;13 :7 43 -7 47 .
115. Bozzetti F, Biganzoli L, Gavazzi C, et al. Glutamine supplementation in cancer patients
receiving chemotherapy: a double-blind randomized study. Nutrition 1997;13:748-
751
224
116. Fox AD, Kripke SA De Paula J, Berman JM, Settle RG, Rombeau JL. Effect of a
glutamine-supplemented enteral diet on methotrexate-induced enterocolitis. JPEN
| 98812.3 25 -3 3 I . (ab st)
l l7. Okuno SH, Woodhous e CL,Loprirzi CL, et al. Phase III placebo-controlled clinical trial
evaluation of glutamine for decreasing mucositis in patients receiving 5FU
(fluorouracil)-based chemotherapy. Proceedings of ASCO 1 998; I 7: 256(abst)
ll8. van der Hulst RRWJ, van Kreel BK, von Meyenfeldt MF, et al. Glutamine and the
preservation of gut integrity. Lancet 1993 ;3 41 "
73 63 -13 65'
l 19. Salloum RM, Copeland EM, Bland KI, Souba WW. Selective stimulation of brush border
glutamine transport in the tumor-bearing rat. Journal of Surgical Research
1991;50:391-397 .
120. Orazi4 Du X, Yang Z,KashaiM, Williams DA. Interleukin-ll prevents apoptosis and
accelerates recovery of small intestinal mucosa in mice treated with combined
chemotherapy and radiation. Lab.Invest . 1996;7 5:33-42'
l2l. Du )OÇ Doerschuk CM, OraziA" rWilliams DA. A bone marrow stromal-derived growth
factor, interleukin-Il, stimulates recovery of small intestinal mucosal cells after
cytoablative therapy. Blood 1994;83:33-37 '
122. pererson RL, Bozza MM, Dorner AJ. Interleukin-ll induces intestinal epithelial cell
growth arrest through eflects on retinoblastoma protein phosphorylation' Am J
Pathol 1996;149 :89 5 -902.

225
123. potten CS. Interleukin-ll protects the clonogenic stem cells in murine small-intestinal
crypts from impairment of their reproductive capacity by radiation. Int.J.Cancer
1995;62:356-361.
124. Sonis ST, Van Vugf AG, McDonald J, et al. Mitigating effects of interleukin 11 on
consecutive courses of 5-Fluorouracil-induced ulcerative mucositis in hamsters.
Cytokine 1997 ;9:605 -612.
125. Takahashi M, Ota S, Nishimura S, et al. Gastric ulcer healing: experimental aspects.
Keratinocyte growth factor is an endogenous stimulant of rabbit gastric epithelial cell
proliferation and migration in primary culture. J. Gastroeneterol. Hepatol. 1996;
I l:1089-1096.
126. Housley RM, Morris CF, Boyle W, et al. Keratinocyte growth factor induces
proliferation of hepatocytes and epithelial cells throughout the rat. J. Clin. Invest.
1994;94'.1764-1777 .
127. GökeM, podolsþ DK. Regulation of the mucosal epithelial barier. In: Baillière's clinical
gastroenterology. 10 No.3 ed. Baillière Tindall, 1996:393-405.
128. Faffell C.L, Bready J.V, Rex K.L., et al. Keratinocyte growth factor protects mice from
chemotherapy and radiation-induced gastrointestinal injury and mortality. Blood
1996;88: I 179(abst)
lZ9. FarrellC.L,Bready J.V, Rex K.L., et al. Keratinocyte Growth Factor Protects Mice from
Chemotherapy and Radiation-induced Gastrointestinal Injury and Mortality. Cancer
Research 1998;58:1-6.

226
130. Planchon SM, Martins CAP, Guerrant RL, Roche JK. Regulation of intestinal epithelial
barrier function by TGF-BI. J. Immunol. 1994;153'.5730-5739.
l3l. Sonis ST, Van Vugt AG, Brien JP, et al. Transforming growth factor-beta 3 mediated
modulation of cell cycling and attenuation of 5-fluorouracil induced oral mucositis.
Oral Oncol ogy 1997 ;33:47 -54.
132. Wymenga ANM, van der Graaf V/T,\ Hofstra LS, et al. Phase I study of CGP-46614
(TGF-P3) mouthwash as prevention for chemotherapy induced mucositis.
Proceedings of ASCO 1998;77'.278(abst)
133. Howarth GS, Francis GL, Cool JC, Xu X, Byard RW, Read LC. Milk growth factors
enriched from cheese whey ameliorate intestinal damage by methotrexate when
administered orally to rats. J.Nutr. 1996;126:2519-2530.
134. Wasserman TH. Radiotherapeutic studies with Amifostine (ethyol). Seminars in
Oncology 1994;21:27 -25 .
135. Capizzi RL. Protection of normal tissues from the cytotoxic effects of chemotherapy by
Amifostine (ethyol): clinical experiences. Seminars in Oncology 7994.21:8-15.
136. van der Vijgh WJF, Peters GJ. Protection of normal tissues from the cytotoxic effects of
chemotherapy and radiation by Amifostine (ethyol): preclinical aspects. Seminars in
Oncology 1994;27:2-7.
137. Mavligit GM, Faintuch J, Levin B, et al. Gastroduodenal mucosal injury during hepatic
arterialinfusion of chemotherapeutic agents. Lack of cytoprotection by prostaglandin
El analogue. Gastroenterology 7987 ;92:566-569.
227
13g. Chu KU, Higashide S, Evers BM, et al. Bombesin improves survival from methotrexate-
induced enterocolitis. Ann. Surgery 1994;220"570-577 '
139. Wright NAo Al-Dewachi HS, Appleton D\ Watson AJ. The effect of single and multiple
doses of prednisolone tertiary butyl acetate on cell population kinetics in the small
bowel mucosa of the rat. Virchows Arch.B.Cell Path 1978;28:339-350.
140. Mustacchi G, pavesi L, Milani S, et al. High-dose folinic acid (FA) and fluorouracil (FU)
plus or minus tþmostimulin (TS) for treatment of metastatic colorectal cancer:
results of a randomized multicenter clinical trial. Anticancer Research 1994;14617-
620.
l4l. Kosakai y, Horie T, Awazu S. Protective eflect of vitamin A against the methotrexate-
induced damage to small intestine: a study on the crypt cells. Pharmacology and
ToxicologY 199 I ;69 :29 1 -29 5 .
142. Tsurui K, Kosakai Y, Horie T, Awazu S. Vitamin A protects the small intestine from
methotrexate-induced damage in rats. The Journal of Pharmacology and
Experimental Therapeutics 1990;253 : 127 8-1284'
143. Windmueller HG. Glutamine utilization by the small intestine. Advances in enzymology
and related areas of molecular biology 1982;53.2Ol'237 '
144. Klimberg VS, Souba WW, Dolson DJ, et al. Prophylactic glutamine protects the
intestinal mucosa from radiation injury. Cancer 1990;66:62-68.
145. Klimberg VS, Salloum RM, Kasper M, et al. Oral glutamine accelerates healing of the
small intestine and improves outcome after whole abdominal radiation. Arch'Surg.
1990;125:1040-1045.

228
146. Furst p. The role of glutamine in clinical nutrition. AuSPEN Annual Scientific Meeting
1993;(abst)
147. Schloerb pR" Amare M. Total parenteral nutrition with glutamine in bone marrow
transplantation and other clinical applications (A randomized, double-blind study).
JPEN 1993;77:407-413.
14g. Inoue y, Copeland EM, Souba WW. Growth hormone enhances amino acid uptake by
the human small intestine. Ann Surg 1994;219"715-724'
l4g. wakefield LM, Thompson NL, Flanders Kc, o'connor-McCourt MD, sporn MB.
Transforming growth factor-p: multifunctional regulator of cell growth and
phenotype. Ann. New York Acad. Sci' 1996;290-298'
150. Stoeck M, Ruegg C, Miescher S, et al. Comparison of the immunosuppressive properties
of milk growth factor and transforming growth factors Bl and p2' J' Immunol'
1989;143:3258-3265.
151. Barnard JA Warwick GJ, Gold LI. Localization of transforming growth factor B
isoforms in the normal murine small intestine and colon. Gastroenterology
1993;105'.67-73 -
152. Sonis ST, Lindquist L, Van Vugt A, et al. Prevention of chemotherapy-induced
ulcerative mucositis by transforming growth factor p3' cancer Research
1994.541135-1138.
153. puolakkainen p, Ranchalis J, Gombotz W, Sainio V, Mumper R, Twardzik DR. Novel
delivery system for inducing quiescence in intestinal stem cells in rats by transforming
229
growth factor-81: a mechanism of mucosal protection. Gastroenterology 1996;
106:4834
154. Rowe PM. Clinical potential for TGF-B. Lancet 1994;344:72-73
155. Gordon MS, McCaskill-stevens WJ, Battiato LA et al. A phase I trial of recombinant
human interleukin-l I (Neumega rhIL-I1 growth factor) in women with breast cancer
receiving chemotherapy. Blood 1996 ;87'.3 61 5'3 624'
156. Rubin JS, Bottaro Dp, chedid M, et al. Keratinocyte growth factor. cell Biology
Internation aI 199 5 ;79 .399 - 4 I 1
157. playford RI, Marchbank T, Mandir N, et al. Effects of Keratinocyte gro\¡rth factor (KGF)
on gut growth and repair. J.Pathol 1998'184:316'322'
15g. Karthaus M, Rosenthal C, Paul H, et al. Effect of topical oral G-CSF application on oral
mucositis in high-grade lymphoma patients treated with HD-methotrexate (HD-
MTX)-Results of a randomised controlled trial. Proceedings of ASCO
1998;17:235(abst)
159. Zucker S. Anaemia in cancer. Cancer Investigation19S5;3:249-260
160. Patterson WK, Keefe DMK, Bolton AE, Veljkovic D, Sage RE, Dale BM' A
retrospective analysis of total parenteral nutrition versus non-specific fluid support
versus electrolyte and vitamin solution in 60 consecutive patients undergoing
autologous blood stem cell transplantation. Cancer Forum 1995;19'.208(abst)
16l. Cummins A, Chu G, Faust L, et al. Malabsorption and villous atrophy in patients
receiving enteral feeding. JPEN J Parenter Enteral Nutr. 1995;19:193-198.

230
162. Kehoe JE, Harvey LP, Daly JM. Alteration of chemotherapy toxicity using a chemically
defined liquid diet in rats. Cancer Research 1986;46:4047-4052.
163. O'loughlin E, Winter M, Shun Ao Hardin JA" Gall DG. Structural and functional
adaptation following jejunal resection in rabbits:effect of epidermal growth factor.
GastroenterologY 1994;107 :87 -93 .
164. Ko TC, Beauchamp RD, Townsend CM, Thompson JC. Glutamine is essential for
epidermal growth factor-stimulated intestinal cell proliferation. Surgery
1993;114:147-154.
165. Sonis ST, Costa JW Jr., Evitts SM, Lindquist LE, Nicolson M. Effect of epidermal
growth factor on ulcerative mucositis in hamsters that receive cancer chemotherapy.
Oral Surg. Oral Med. Oral Pathol. 1992;7 4'.7 49 -7 55'
166. McKenna KJ, Ligato S, Kauffrnan GL, Abt AB, Stryker JA" Conter RL. Epidermal
growth factor enhances intestinal mitotic activity and DNA content after acute
abdominal irradiation. Surgery I99 4;l I 5'. 626-632'
167. young Gp, Taranto TM, Jonas HA" Cox AJ, Hogg d Werther GA. InsulinJike growth
factors and the developing and mature rat small intestine: receptors and biological
actions. Digestion 199O;46 -240-252.
168. Schug er L,PeretzT, Goldin E, Durst AL, Okon E. Duodenal epithelial atypia. A specific
complication of hepatic arterial infusion chemotherapy. Cancer 1988;61:6ó3-666.
169. Laskowitz DT, Elion GB, Dewhirst MW, et al. Enhancement of melphalan-induced
gastrointestinal toxicity in mice treated with regional hyperthermia and BSO-
mediated glutathione depletion. Int. J.Hyperthermia. 1992;8: I I I -120.

23r
170. Mansi J, Ellis E, Viner C, et al. Gut protection by cyclophosphamide 'priming' in patients
receiving high-dose melphalan - effect of drug scheduling. Cancer Chemother
Pharmacol 1992;30: I 49'15 I'
l7l. Case DC, Coleman M, Gottlieb A" McCanoll K. Phase I-II trial of high-dose melphalan
in previously untreated stage III multiple myeloma: cancer and leukemia group B
study 85 12. Cancer Investigation 1992;l0 ll-17 .
172. pearson ADJ, Craft AW, Eastham EJ, Laker MF, Pearson GL, Pledger JV. Small bowel
function in acute lymphoblastic leukaemia. Arch. Dis. Child. 1984;59:460-465.
173. Kulkarni SS, Leventon GS, Huynh L, Chow H, Dicke KA, Zander AR' Effect of
pretreatment with cyclophosphamide on high-dose toxicþ of melphalan in mice.
Cancer Research 1985 ;4 5 : 5 43 I -5 43 5 .
174. Neta R, Stiefel SM, Finkelman FD, Herrmann S, Ali N. IL-12 protects bone marrow
from and sensitizes intestinal tract to ionizing radiation. The J. Immunol' 1994;
153:4230-4237.
175. Byrne TA" Persinger RL, Young LS, Ziegler T& Wilmore DW. A new treatment for
patients with short-bowel syndrome: Growth hormone, glutamine and a modifled
diet. Ann Surg 1995;222'.243-255.
176. ¡y,e¡o,ies IS, Turner MW. Intestinal permeation of molecules in health and disease. In:
Immunology of Gastrointestinal Disease' 1996:17 3 -l9l'
177. Bjarnason I. Intestinal permeabilþ. Gut 1994;sl8-s22
232
l7g. Franklin IIR" Simonetti Gpc, Dubbelman AC. Toxicþ grading systems. A comparison
between the WHO scoring system and the common toxicity criteria when used for
nausea and vomiting' Ann'of Oncol' 1994;5:113-177 '
179. Harper JF. Peritz' -F- test: basic prografllme of a robust multiple comparison test for
statistical analysis of all differences among group means' Comput Biol'Med'
1984;14437 -445.
180. Panilli G, Iaffaioli RV, Martorano M, et al. Effects of anthracycline therapy on intestinal
absorption in patients with advanced breast cancer. Cancer Res. 1989;49:3689-
3691.(abst)
lgl. Pledger JV, Pearson ADJ, craft AW, Laker MF, Eastham EJ. Intestinal permeability
during chemotherapy for childhood tumours. Eur J Pediatr 1988;147:123-127 '
182. Kaw M, Przepiorka D, sekas G. Infectious complications of endoscopic procedures in
bone marrow transplant recipients. Dig. Dis. Sci. 1993;38:71-74'
183. Fine KD, Santa Ana CA" Porter JL, Fordtran JS. Effect of changing intestinal flow rate
on a measurement of intestinal permeability. Gastroenterology 1995;108:983-989'
184. Bang FB. A bacterial disease of Limulus polyphemus. Bull'Johns Hopkins Hosp'
1956;98.325
lg5. pearson ADJ, Craft AW, Eastham EJ, et al. Small intestinal transit time affects
methotrexate absorption in children with acute lymphoblastic leukemia' Cancer
Chemother Pharmacol 1985;74"217 -215'

233
186. Program 5.V (unbalanced repeated measures). In: Dixon W, ed' BMDP statistical
software Package. 1993:
lg7. Larsen S, Osnes M, Eidsaunet W, Sandvik L. Factors influencing the sample size,
exemplifïed by studies on gastroduodenal toterability of drugs.
Scand. J. Gastroenterol . 1985 ;2Q:39 5 -400'
lgg. Cox CJ, Matsui SM, Lo RS, et al. Etiology and outcome of diaffhoea after marrow
transplantation: Aprospective study. Gastroenterology 1994;lO71398-1407.
lg9. Cummins AG. A quantitative histological study of enteropathy associated with HIV
infection. Gut 1990;3 l'.317 -321.
190. Mathan MM, Chandy G, Mathan VI. IJltrastructural changes in the upper small intestinal
mucosa in patients with cholera. Gastroenterology 199 5 ;lO9 : 422-430.
l9l. Rofe AM, Bourgeois CS, Washington JM, Philcox JC, Coyle P. Metabolic consequences
of methotrexate therapy in tumour-bearing rats. Immunol.Cell Biol. 1994;72:43-48'
192. Tomas FM, Chandler CS, Coyle P, Bourgeois CS, Burgoyne JL, Rofe AM' Effects of
insulin and insulinJike growth factors on protein and energy metabolism in tumour-
bearing rats. Biochem.J. 1994;301:769-77 5'
lg3. Boyle FM, Wheeler I{R, shenfield GM. Glutamate ameliorates experimental vincristine
neuropathy. J.Pharmacol. Exp. Therapeut. 1996;27 9'. 41 0-4 I 5.
194. Nilsson TM, 'Woods AE, Rofe ANI. In vlvo studies of macrophages and intercellular
adhesion molecule-l following lipopolysaccharide treatment in tumour-bearing rats.
Immunol. Cell Biol. 1996;7 4:408-412.

234
195. Vernon-Roberts E. Reporting of tumours: Breast cancer. IMVS Newsletter 1996;3'5

235
I
PUBLICATIONS ARISING FROM THIS THESIS
Keefe, D.M., Cummins, 4.G., Dale, B.M., Kotasek, D', Robb, T'A' & Sage' R'E'
Effect of high-dose chemotherapy on intestinal permeability in humans. Clinical
Science 1997 ; 92:385-389.
Keefe, D.M.K., Cummins, 4.G., Kotasek, D., Dale, B'M', & Sage, R'E' Small
intestinal side effects of chemotherapy: a study comparing symptoms, function and
morphology. J. Gastroenterol. Hepatol. 1996;l I : Ll2l'
2
Keefe, D. M. K., Cummins, A. G., Dale, B. M., Kotasek, D., Robb, T. A., &
Sage, R. E. (1997). Effect of high-dose chemotherapy on intestinal
permeability in humans. Clinical Science, 92(4), 385-389.
NOTE:
This publication is included in the print copy
of the thesis held in the University of Adelaide Library.
It is also available online to authorised users at:
https://doi.org/10.1042/cs0920385


