
THE EFFECT OF INTEREST RATES ON FINANCIAL PERFORMANCE OF
COMMERCIAL BANKS IN KENYA
ISAAC MBURU NGURE
A RESEARCH PROJECT REPORT SUBMITTED IN PARTIAL FULFILMENT
OF THE REQUIREMENTS FOR THE AWARD OF THE DEGREE OF MASTER
OF BUSINESS ADMINISTRATION OF THE UNIVERSITY OF NAIROBI
OCTOBER, 2014

ii
DECLARATION This research project report is my original work and has not been presented to any other
institution for the award of a degree.
Signature:………………………………………… Date…………………………………...
Isaac Mburu Ngure
D61/75837/2012
This research project report has been submitted for examination with my approval as the
University Supervisor.
Signature:……………………………………… Date:………………………….………
Dr. Sifunjo Kisaka

iii
DEDICATION This work is dedicated to my father for encouraging me with my studies. Without good
formal education yet he never wavered in encouraging us to work hard. May God rest his
soul in eternal peace.

iv
ACKNOWLEDGEMENT I thank Almighty God for guiding me throughout my life for without Him I would not
have come this far.
My special thanks go to my supervisor, Dr. Sifunjo Kisaka, for providing unlimited,
invaluable and active guidance throughout the study. His immense command and
knowledge of the subject matter enabled me to shape this research project to the product
that it is now.
I also thank my family for letting me use their valuable time to work on this project.
Finally, I owe my gratitude to a number of people who in one way or another contributed
towards completion of this project especially my fellow colleagues at work and students.

v
ABSTRACT Interest rates in Kenya have been fluctuating over the last few years with the effect of fluctuations remaining unknown on financial performance of commercial banks. Interest rates and macroeconomic volatility generally were the motivation behind this study as there was little information about effect of the same on commercial banks’ financial performance in Kenya. In addition, commercial banks’ profitability for most of the Sub-Sahara African countries has been about 2 percent over the last 10 years and compares significantly with other developing economies, but higher than the developed world. A major research question was why commercial banks in Sub-Sahara Africa remained more profitable irrespective of the high interest rates and volatile macroeconomic environment. This study sought to determine the effect of interest rates on financial performance of commercial banks in Kenya. The study used descriptive research design using secondary data obtained from Central Bank of Kenya for the period of five years from 2009 to 2013. Data obtained was analyzed using SPSS version 21 and results obtained tested for significance using ANOVA. The study found that interest rates have significant positive effect on financial performance of commercial banks in Kenya at 95% confidence level. The relationship between interest rates and financial performance was also found to be linear with increase in interest rates leading to higher profitability. The study also concluded that bank size and interest rate volatility had effect on profitability of commercial banks. The study also found that the model containing interest rates and size of commercial bank can explain 64% of the changes in commercial banks profitability. The study recommended that policies to be put in place to shield bank lending rates and ensure monitoring the same. Further, so as to cushion consumers from exploitation by commercial banks, the Central Bank need exercise their monitoring roles strictly and discipline any commercial banks that may be increasing the interest rates arbitrary to boost their profitability. The study also recommends that in times of poor performance of commercial banks and the need to boost their profitability may be necessary for their role in economy, Central Bank of Kenya should come up with monetary policy that will lead to rise in interest rates and hence improving banks profitability.

vi
LIST OF ABBREVIATION
ANOVA Analysis of the Variance
CBK Central Bank of Kenya
GDP gross domestic product
IMF International Monetary Fund
KNBS Kenya National Bureau of Statistics
KSh Kenya Shillings
ROA Return on Assets
USD United States Dollars

vii
TABLE OF CONTENTS DECLARATION .......................................................................................................... ii
DEDICATION ............................................................................................................. iii
ACKNOWLEDGEMENT ........................................................................................... iv
ABSTRACT ...................................................................................................................v
LIST OF ABBREVIATION ........................................................................................ vi
TABLE OF CONTENTS ........................................................................................... vii
LIST OF FIGURES AND GRAPHS.............................................................................x
LIST OF TABLES ....................................................................................................... xi
CHAPTER ONE ............................................................................................................1
INTRODUCTION .........................................................................................................1
1.1 Background of the Study .......................................................................................1
1.1.1 Interest Rates Background..............................................................................2
1.1.2 Financial Performance ....................................................................................5
1.1.3 Contextual Background ..................................................................................7
1.2 Research Problem .................................................................................................9
1.3 Objective of the Study ......................................................................................... 11
1.4 Value of the Study .............................................................................................. 11
CHAPTER TWO ......................................................................................................... 13
LITERATURE REVIEW............................................................................................ 13
2.1 Introduction ........................................................................................................ 13
2.2 Theoretical Review ............................................................................................. 13
2.2.1 Schumpeter Economic Cycle Theory ........................................................... 13
2.2.2 Keynes’s Liquidity Preference Theory ......................................................... 15
2.2.3 Macroeconomic Theory ............................................................................... 17

viii
2.3 Determinants of Commercial Banks Profitability ................................................ 18
2.3.1 Interest Rates ............................................................................................... 18
2.3.2 Deposits ....................................................................................................... 19
2.3.3 Bank Size ..................................................................................................... 19
2.4 Empirical Literature ............................................................................................ 20
2.4.1 International Empirical Literature ................................................................ 20
2.4.2 Local Empirical Literature ........................................................................... 22
2.5 Summary ............................................................................................................ 24
CHAPTER THREE ..................................................................................................... 25
RESEARCH METHODOLOGY ................................................................................ 25
3.1 Introduction ....................................................................................................... 25
3.2 Research Design ................................................................................................. 25
3.3 Population of the Study ....................................................................................... 26
3.4 Sample and Sampling Techniques ....................................................................... 26
3.5 Data Collection ................................................................................................... 27
3.6 Data Analysis ..................................................................................................... 28
3.6.1 Conceptual Model ........................................................................................ 28
3.6.2 Analytical Model ......................................................................................... 29
3.7 Data Validity and Reliability .............................................................................. 29
CHAPTER FOUR ....................................................................................................... 30
DATA ANALYSIS, RESULTS AND INTERPRETATIONS .................................... 30
4.1 Introduction ........................................................................................................ 30
4.2 Summary of Statistics ......................................................................................... 30
4.2.1 Profitability of Commercial Banks in Kenya ................................................ 30
4.2.2 Trend Analysis on Commercial Banks Lending Interest Rate ....................... 35

ix
4.2.3 Interest Rate Volatility ................................................................................. 36
4.2.4 Average Annual Interest Rates ..................................................................... 37
4.2.5 Commercial Banks Industry Returns ............................................................ 37
4.3 Effect of Interest Rates on Financial Performance ............................................... 38
4.3.1 Results of Correlation Analysis .................................................................... 38
4.3.2 Results of Model of Goodness of Fit Test..................................................... 39
4.3.3 Results of ANOVA ...................................................................................... 40
4.3.4 Estimated Model .......................................................................................... 40
4.4 Discussion .......................................................................................................... 41
4.5 Summary ............................................................................................................ 42
CHAPTER FIVE ......................................................................................................... 44
SUMMARY, CONCLUSION AND RECOMMENDATIONS .................................. 44
5.1 Introduction ........................................................................................................ 44
5.2 Summary of the Study ......................................................................................... 44
5.3 Conclusion .......................................................................................................... 45
5.4 Limitations of the Study ...................................................................................... 46
5.5 Policy Recommendation ..................................................................................... 47
5.6 Suggestions for Further Research ........................................................................ 48
REFERENCES ............................................................................................................ 49
APPENDIX I: LIST OF LICENSED COMMERCIAL BANKS IN KENYA .......... 53
APPENDIX II: COMMERCIAL BANKS RETURN ON ASSETS .......................... 55

x
LIST OF FIGURES AND GRAPHS
Graph 4.1: Trend Analysis of Commercial Bank Performance ....................................... 30
Figure 4.1: Year 2013 Commercial Banks Profitability .................................................. 31
Figure 4.2: Year 2012 Commercial Banks Profitability .................................................. 32
Figure 4.3: Year 2011 Commercial Banks Profitability .................................................. 32
Figure 4.4: Year 2010 Commercial Banks Profitability .................................................. 33
Figure 4.4: Year 2009 Commercial Banks Profitability .................................................. 34
Graph 4.2: Comparative Bank Profitability for Year 2009 to 2013 ................................. 34
Graph 4.3: Interest Rates Movements ............................................................................ 35
Graph 4.4: Interest Rates Volatility ................................................................................ 36
Graph 4.5: Scatter Diagram between Interest Rates and Profitability.............................. 38

xi
LIST OF TABLES
Table 4.1: Annual Interest Rates .................................................................................... 37
Table 4.2: Commercial Banks Industry Returns ............................................................. 37
Table 4.3: Correlation Results on Financial Performance ............................................... 38
Table 4.4: Model of Goodness of Fit .............................................................................. 39
Table 4.5: Estimated Model ........................................................................................... 40
Table 4.6: Estimated Model ........................................................................................... 40

1
CHAPTER ONE
INTRODUCTION
1.1 Background of the Study
Commercial banks play a major role in the economy through their economic role of
financial intermediation that performs both a brokerage and a risk transformation
function (Hara, 1983). Commercial banks are financial intermediaries that mobilize
savings from surplus economic units to deficit economic units. They are also special
financial intermediaries that mobilize funds between depositors and borrowers
participating in an economy. How well they perform this intermediary function has direct
linkage with banks profitability and economic health of a nation. Profitability of banks
has relationships with growth and development of an economy (Wainaina, 2013).
The banking industry has been facing numerous lending challenges. The explanation for
this from a global context elicits varied reasons. Mulei (2003) points out that, this
challenge arises because of paucity of skills required to determine the soundness of
security valuation and the validity of legal charges associated with loan collateral while
(Berger,1995) alleges that, the evolution of the banking industry has presented both
challenges and opportunities for commercial banking institutions. Association of
profitable organization is a dream of every individual, enterprise and government.
Determinants of banks profitability in one continent are different from another continent
(Yuqi, 2008).

2
The performance of commercial banks can be affected by internal and external factors
which can be classified into bank specific (internal) and external factors. The internal
factors are individual bank characteristics which affect the bank's performance, these
factors are basically influenced by the internal decisions of management and board. The
external factors are sector wide or country wide factors which are beyond the control of
the company and affect the profitability of banks (Ongore, 2013). This study will focus
on the effect of interest rates on the profitability of commercial banks in Kenya which are
beyond the control of the banks. In order to survive in the long run, it is important for a
bank to find out what are the determinants of profitability so that it can take initiatives to
increase its profitability by managing the dominant determinants. Bank performance is
also vitally important for all stake holders, such as the owners, the investors, the debtors,
the creditors, depositors, bank managers, regulators and the government. The
performance of banks gives directions to the stake holders in their decision making
(Panayiotis, Athanasoglou, Delis and Staikouras, 2006).
1.1.1 Interest Rates Background
Although it is difficult to prove the direction of the relationship between interest rates and
profitability, interest rates instability generally has an effect with financial performance
of commercial Banks. High interest rates will lead to increased commercial banks interest
income but also lead to low demand for the loans and hence crowding out the increased
interest income. Without interest rates stability, domestic and foreign investors will stay
away and resources will be diverted elsewhere. In fact, econometric evidence of
investment behavior indicates that in addition to conventional factors (past growth of
economic activity, real interest rates, and private sector credit), private investment is

3
significantly and negatively influenced by uncertainty and macroeconomic instability
(Sayedi, 2013). In addition to low (and sometimes even negative) growth rates, other
aspects of macroeconomic instability can place a heavy burden on the commercial banks
leading to reduced profitability (Gilchris, 2013).
Chen, Roll and Ross (1986) maintains that these macroeconomic factors are significant in
explaining firm performance (profitability) and subsequent returns to investors. Simon
(1997) found that exchange rate and current account have direct and positive relationship
with inflation and both exchange rate and current account are the key factors that badly
affect the small economies. Herrero (2003) points out that deteriorating local economic
condition for instance low GDP, inflation, interest and exchange rate cause bank failure.
In conclusion, interest rate volatility is expected to affect financial performance of
commercial banks whose role in an economy is the economic resource allocation where
they channel funds from depositors to investors. Banks can only perform this vital role, if
they generate necessary income to cover their operational cost they incur in the due
course. Although it is difficult to prove the direction of the relationship between interest
rates and profitability, studies confirm that interest rates instability has generally been
associated with poor commercial banks financial performance in elastic loan markets
since high interest rates reduces the demand for loans (Gilchris, 2013).
Interest rate is the price a borrower pays for the use of money they borrow from a
lender/financial institutions or fee paid on borrowed assets. Interest can be thought of as
"rent of money". Interest rates are fundamental to a capitalistic society and are normally

4
expressed as a percentage rate over the period of one year (Sayedi, 2013). Interest rate as
a price of money reflects market information regarding expected change in the
purchasing power of money or future inflation Interest rates are derived from
macroeconomic factors which is the study of the behaviour of the economy as a whole
such as total output, income, employment levels and the interrelationship among diverse
economic sectors (Karl, Ray, and Shannon, 2009). These macro-economic factors include
economic growth captured by gross domestic product (GDP), interest rates, exchange
rates and inflation rates. Interest rates are worsened by regulations imposed on banks.
The effect of macroeconomic factors in other sectors of the economy will always affect
the banking sector and what goes on in the banking sector will affect the other sectors of
the economy (Wainaina, 2013).
Inflation and inflationary expectations can press interest rate upward which affects
lending terms resulting to reduced credit demand and lending ability of commercial banks
(Keynes, 2006). Exchange rates affect interest rates and have an indirect impact on
profitability through cost of loan able funds. High exchange rates leads to increased value
commercial banks get from selling foreign currency that result to increased profitability.
Studies have found positive relationship between exchange rate and bank loan loss. It
may reflect how fluctuation and volatile exchange contribute to the debt profile of banks
and reduce the profit level of borrowers (Owoeye, and Ogunmakin, 2013; Macharia,
2013). GDP is the measure of economic activity of a country. Increased economic
activities increase the demand for loan able funds which in turn drives up the exchange
rates. Decline in GDP result to reduced interest rates and fall in profitability of
commercial banks and asset prices, leading to non-performing loans, lowers borrower’s

5
financial capacity and depresses the value of collaterals as secondary means of servicing
debts (Wainaina, 2013).
Commercial banks main role in an economy is the economic resource allocation. They
channel funds from depositors to investors continuously. They can only perform this vital
role, if they generate necessary income to cover their operational cost they incur in the
due course. In other words for sustainable intermediation function, banks need to be
profitable. Beyond the intermediation function, the financial performance of banks has
critical implications for economic growth of countries. Good financial performance
rewards the shareholders for their investment. This, in turn, encourages additional
investment and brings about economic growth. On the other hand, poor banking
performance can lead to banking failure and crisis which have negative repercussions on
the economic growth (Panayiotis et al., 2006).
1.1.2 Financial Performance
Financial performance on the other hand is a measure of the change in financial state of
an organization or the financial outcomes that results from management decisions and the
execution of those decisions by members of the organization. Its outcomes are not
universal in nature but largely depend on the organizational context hence selection of the
measures that represent performance of a particular organization is done based upon the
circumstances of the organization being rated. Financial performance is commonly
measured by ratios such as return on equity, return on assets, return on capital, return on
sales and operating margin (Gilchris, 2013).

6
Financial performance analysis of commercial banks has been of great interest to
academic research since the Great Depression of 1940’s. In the last two decades studies
have shown that commercial banks in Sub-Saharan Africa are more profitable than the
rest of the world with an average Return on Assets (ROA) of 2 percent. One of the major
reasons behind high return in the region was investment in risky ventures. The other
possible reason for the high profitability in commercial banking business in sub-Saharan
Africa is the existence of huge gap between the demand for bank service and the supply
thereof. That means, in Sub-Sahara Africa the number of banks are few compared to the
demand for the services; as a result there is less competition and banks charge high
interest rates. This is especially true in East Africa where the few government owned
banks take the lion's share of the market (Flamini et al., 2009).
The performance of commercial banks can be affected by internal and external factors
(Al-Tamimi, 2010; Aburime, 2005). These factors can be classified into bank specific
(internal) and macroeconomic variables. The internal factors are individual bank
characteristics which affect the bank's performance. These factors are basically
influenced by the internal decisions of management and board. The external factors are
sector wide or country wide factors which are beyond the control of the company and
affect the profitability of banks. Studies show that performance of firms can also be
influenced by ownership identity (Ongore, 2011).
The banking sector is the single sector highly affected by key macroeconomic variables
which include interest rates, inflation and Economic growth measured by GDP and
therefore, their financial performance will mostly depend on macroeconomic stability.
Macroeconomic stability is the cornerstone of any successful effort to increase private

7
sector development and economic growth. Cross-country regressions using a large
sample of countries suggest that growth, investment, and productivity are positively
correlated with macroeconomic stability (Easterly, Islam, and Stiglitz, 1999).
1.1.3 Contextual Background
Kenya has been characterised by interest rate volatility in the last five years whose effect
on commercial banks remains unknown. The instability on macroeconomic variables was
witnessed in year 2011 where interest rates rose to over 30%, inflation rate to 13.97
percent compared to 3.9 percent in 2010 and Kenya shilling greatly weakened against
major world currencies. Against the US dollar, the shilling averaged 101.270 in October
2011 from 81.029 in January 2011. In order to increase their profitability, commercial
banks in Kenya started to diversify their revenue streams (Macharia, 2013).
Kenya has been characterized with volatile interest rates in the recent past whose effect
on commercial banks performance remains unknown. However, commercial banks
profitability in sub Saharan Africa has remained high compared to the rest of the world.
Kenya has of late initiated a framework and infrastructure to encourage lending through
public and private credit reference bureaus, institutional strategies to spur economic
development such as the vision 2030 in Kenya and financial systems approaches which
include alternatives to collaterals in order to access credit.
Commercial banks are custodians of depositor’s funds and operate by receiving cash
deposits from the general public and loaning them out to the needy at statutorily allowed
interest rates. Commercial banks in Kenya dominate the financial sector. In a country
where the financial sector is dominated by commercial banks, any failure in the sector

8
has an immense implication on the economic growth of the country. This is due to the
fact that any bankruptcy that could happen in the sector has a contagion effect that can
lead to bank runs, crises and bring overall financial crisis and economic tribulations
(IMF, 2001).
Commercial banks in Kenya have been performing very well in terms of profitability.
Despite the good overall financial performance of banks in Kenya, there are a couple of
banks declaring losses. The current banking failures in the developed countries and the
bailouts thereof call for Kenya authorities to take precautionary and mitigating measures,
there is dire need to understand the performance of banks and how the macroeconomic
variables have been affecting banks profitability. According to Central Bank of Kenya
(2011) Supervision Report as of December 2011 out of the 43 commercial banks 30 of
them are domestically owned and 13 are foreign owned. In terms of asset holding, foreign
banks account for about 35% of the banking assets (CBK, 2011).
The banking sector is one of the key industries in Kenyan economy just like in any other
country and is highly affected by macroeconomic variables than any other industry. To
ensure that the industry remains profitable and hence to be able to achieve its role in
economic development, the sector has experienced major transformation in its operating
environment. In a number of countries, financial sector reforms have been implemented.
In these reforms, the role of commercial banks has remained central in financing
economic activities in the various segments of the markets especially in Sub-Saharan
Africa.

9
In recent years, a growing number of developing countries including Kenya have
embarked on reforming and deregulating their financial systems, transforming their
institutions into effective intermediaries and extending viable financial services on a
sustainable basis to all segments of the population (Seibel, 2001). In the process, a new
world of finance has emerged which is demand-led and savings driven and conforms to
sound criteria of effective financial intermediation (Miller, 2003). Panayiotis et al. (2006)
showed that both external as well as domestic factors have contributed to growth in
performance of commercial banks in the last two decades. The studies conducted suggest
that, given the importance of commercial banks in Africa, better understanding of the
determinants of their performance is important.
1.2 Research Problem
Interest rate volatility has negative impact on the financial performance of commercial
banks posing challenge to commercial banks managers in their core function of credit
management and profitability (Baum, Mustafa, and Neslihan, 2009). The volatility on
interest rates is blamed on poor mmacroeconomic policies which include excessive
government spending, high inflation, and overvalued exchange rates. Distortional
macroeconomic policies are at times intentional since politicians believe that high
interest, inflation and overvalued exchange rates are good for economic performance. In
fact, when formulating macro economic variables, the effect of the policies on
commercial banks performance is usually not a consideration (Williamson, 1990).
Interest rates in Kenya have been fluctuating over the last few years with the effect of
fluctuations remaining unknown (Otuori, 2013). The latest interest rates volatility was the
10
motivation behind this study as there was little information about effect of same on
commercial banks’ financial performance in Kenya. In addition, there is insufficient
empirical evidence that commercial banks financial performance is hindered by interest
rates volatility and poor macroeconomic variables at large. In addition, commercial
banks’ profitability for most of the Sub-Sahara African countries has been about 2
percent over the last 10 years which is higher than that of commercial banks in developed
countries (Al-Tamimi and Hassan, 2010). A major research question is why commercial
banks profitability has remained high irrespective of the unfavourable interest rates
environment.
The need for this study is further supported by the fact that most studies conducted in
relation to bank performances in Kenya has focused on sector-specific factors that affect
the overall banking sector performances or determinant of bank performance with no
study focusing on interest rates and commercial banks financial performance. Macharia
(2013) studied the effects of global financial crisis on the financial performance of
commercial banks offering mortgage finance in Kenya where interest rates and inflation
were found to have negative effect on performance while positive effect with exchange
rates. Wainaina (2013) studied the effect of macroeconomic factors on commercial banks
lending to agricultural sector in Kenya and found that increase in interest rate affected the
amount of credit provided by the commercial banks. Mboka (2013) studied the effects of
macroeconomic variables on nonperforming loans of commercial banks in Kenya and
found a strong correlation between interest rates and bank profitability.

11
None of these studies had examined the effect of interest rates on commercial banks
financial performance yet interest rates have been very volatile. Thus, this study sought to
determine the effect of interest rates on banks’ financial performance and hence bridge
the knowledge gap that existed in literature. It answered the question, what is the effect
of interest rates on financial performance of commercial banks?
1.3 Objective of the Study
To determine the effect of interest rates on financial performance of commercial banks in
Kenya
1.4 Value of the Study
Empirical evidence clearly shows that studies focusing on Kenya’s financial sector are
still scanty and limited. Even those which have been carried out point to a need for
further investigation of the factors which have continued to cause poor financial
performance in the country, notwithstanding the reforms. Most of the evidence in regard
to commercial banks’ performance largely focus on the developed economies
environments and the conclusions may not be useful for Kenya’s financial sector
planning. Therefore the study will be important to various stakeholders with interest in
Kenya’s economy including the government, citizens, the banks, foreign investors and
academicians.
To the government and macroeconomic policy makers, the study is significant to them
since they will understand the relationship between the effects of interest rates on bank
performances. They will have more knowledge and hence come up with better policies to

12
ensure banks financial performance is restored so as to boost economic growth. The
Kenyan citizens will benefit from the implementation of the study findings and due to
improved access to financial services and favorable interest rates environment. This will
lead to improved lifestyles, high employment and increased households’ incomes. To the
banks and foreign investors, they will be able to plan and determine the most appropriate
time to make investments in financial sector based on interest rates prevailing. To
academicians, the study has added to the existing body of knowledge on bank
performance and form a basis for further research.

13
CHAPTER TWO
LITERATURE REVIEW
2.1 Introduction
This chapter focuses on theoretical, empirical literature, review of the local literature and
ends by a chapter summary. The chapter starts by section 2.2 that has discussed
theoretical literature, followed by section 2.3 that contains the empirical literature on
macroeconomic variables and commercial banks performance.
2.2 Theoretical Review
Various theories have been discussed presenting arguments that guided this study. These
theories include Schumpeter economic cycle theory, Keynesian liquidity preference
theory and macroeconomic theory.
2.2.1 Schumpeter Economic Cycle Theory
The theory was propounded by Schumpeter (1939) who indicated the process of
economic change or evolution that consists of two distinct phases, “prosperity” and
“recession”. One under which the impulse of entrepreneurial activity, draws away from
an equilibrium position, and the second of which it draws toward another equilibrium
position. Schumpeter calls those fluctuations/cyclical processes in economic life business
cycle. Schumpeter shows the intermediary role of financial sector between those who
save and invest, through a process referred to as credit creation by bank financing that

14
leads to economic growth and development. The effect of this process leads to profit and
loss generation by the lender and the borrower.
Certain macroeconomic variables typically display unique pattern of boom and recession
in a business cycle. A crisis is said to occur at the peak of expansion when growth in real
GDP and domestic demand decline leading to acceleration in inflation. During periods of
economic expansion, firms and their respective sectors profits increases, asset prices rises
aggregate sectoral demand for credit facilities expands leading to growth in bank lending
resulting to increased interest income. Banks may underestimate their risk exposures,
relaxing credit standards and reduce provisions for future losses while the economy
indebtedness rises. As the downturn sets in individual’s, firms and sector profitability
deteriorates (Bikker and Hu, 2002).
The theory assumes that recessions and periods of economic growth are efficient
response to exogenous changes in the real economic environment and that decline in
profitability result in fall of asset prices, non-performing loans, lowers borrowers’
financial capacity, fall in employment levels, and depresses the value of collaterals as
secondary means of servicing debts. Banks’ risk exposure increases, and consequently
raises the need for larger loan provisions and higher levels of capital, exactly when it is
more expensive or simply not available. This may lead to banks reacting by reducing the
amount of lending, especially if they have low capital buffers above the minimum capital
requirement, thus increasing the effects of the economic downturn as well as increasing
the lending rates.

15
Critics of the theory states that it is a common misconception that macroeconomic purely
based on shocks to supply, as opposed to shocks on demand, and this leads to the
common criticism of Schumpeter economic cycle theory by ignoring the demand side of
the economy. However, in real business cycles situation, consumers will change their
intertemporal consumption and savings decisions based on the real interest rate available
to them, which is a shift in demand.
In relation to the study, the theory views interest rates changes as normal economic
occurrences which will affect commercial banks performance. It disregards the argument
that interest rates are determined by the liquidity in the economy but are determined by
the prevailing macroeconomic environment as determined by the business cycles. Hence,
according to the theory, interest rates will keep on changing according to the prevailing
macro-economic conditions.
2.2.2 Keynes’s Liquidity Preference Theory
The theory was advanced by Keynes (2006). According to the liquidity preference theory,
the interest rates are determined by the demand for and supply of money balances. The
theory assumes that people’s demand for money is not for transactions purpose but as a
precaution and for speculative purposes. The transaction demand and precautionary
demand for money increase with income, while the speculative demand is inversely
related to interest rates because of the forgone interest. The supply of money is
determined by the monetary authority (the central bank), by the lending of commercial
banks and by the public preference for holding cash (Were, Kamau, Sichei, Kiptui, 2013).

16
Therefore, interest rates are expected to increase as the maturity profile of securities
increases. This is so because the longer the maturity, the greater is the uncertainty; and
therefore the premium demanded by investors to part with cash increases as the maturity
profile increases. The expectation, therefore, is that forward exchange rates should offer a
premium over expected future spot exchange rates since those who are risk-averse
demand a premium for securities with longer-term maturities. A premium is offered by
way of greater forward rates in order to attract investors to longer-term securities.
Consequently, current interest rates reflect expected inflation rates, income (GDP) and
expected money supply changes (Were et al., 2013).
Critics of this theory argue that the liquidity preference theory of interest suffers from a
fallacy of mutual determination. Keynes alleges that the rate of interest is determined by
liquidity preference. In practice, however, Keynes treats the rate of interest as
determining liquidity preference. The critics state that "The Keynesians therefore treat the
rate of interest, not as they believe they do- as determined by liquidity preference- but
rather as some sort of mysterious and unexplained force imposing itself on the other
elements of the economic system (Were et al., 2013).
In relevance to the study, the theory views interest rates as being mainly driven by the
liquidity level in the economy. The theory does not recognize the role of macroeconomic
policies formulated by the central bank but interest rates are purely driven by the demand
of money in the economy. Therefore, interest rates will go up and down according to the
level of liquidity in the economy and preference for the liquidity by the users of funds.

17
2.2.3 Macroeconomic Theory
The theory was proposed by Friedman, (1963). The theory views interest rates as always
and everywhere a monetary phenomenon (Friedman, 1963). Further, macroeconomic
theory assumes that growing the money supply in excess of real growth causes interest
rates to rise. This is also the result from the Harberger (1963) model, which assumes that
prices adjust to excess money supply in the money market. It is on the basis of this
assumption that it is possible to invert the real money demand and control interest rates.
Interest rates volatility in open economies results from different disequilibria in many
markets specifically, the domestic money market, external/foreign markets and the labour
market. Thus increase in interest rates emanates from three main sources that include
excess money supply, foreign prices and cost push factors (Were et al., 2013). The theory
is related to keysian liquidity preference theory but recognizes additional sources of
interest rates not only demand for money but also foreign prices and cost push factors.
Critics of this theory base their argument on the grounds that governments would in
practice be unlikely to implement theoretically optimal policies. According to them, the
implicit assumption underlying the macroeconomic revolution was that economic policy
would be made by wise men, acting without regard to political pressures or opportunities,
and guided by disinterested economic technocrats. They argued that this was an
unrealistic assumption about political, bureaucratic and electoral behaviour.
In relevance to the study, macroeconomic theory views growing money supply in excess
of real growth as the cause of interest rates to rise. Interest rate volatility is seen by the
theory as emanating from three main sources that include excess money supply, foreign
prices and cost push factors. Interest rates volatility will also results from different dis-

18
equilibria in many markets specifically, the domestic money market, external/foreign
markets and the labour market. Hence controlling interest rates volatility will involve
dealing with disequilibrium in the markets.
2.3 Determinants of Commercial Banks Profitability
Determinants of bank profitability can be internal or external. Internal determinants of
banks financial performance normally consist of factors that are within the control of
commercial banks. They are the factors which affect the revenue and the cost of the
banks. Some studies classified them into two categories namely the financial statement
variables and non-financial variables. External factors are said to be the factors that are
beyond the control of the management of commercial banks. The external determinants
of commercial banks profitability are indirect factors, which are uncontrollable, but have
an enormous impact on bank’s profitability.
2.3.1 Interest Rates
Interest rates instability generally has been associated with poor financial performance of
commercial Banks. Without interest rates stability, domestic and foreign investors will
stay away and resources will be diverted elsewhere. In fact, econometric evidence of
investment behavior indicates that in addition to conventional factors (past growth of
economic activity, real interest rates, and private sector credit), private investment is
significantly and negatively influenced by uncertainty and macroeconomic instability
(Sayedi, 2013). Although it is difficult to prove the direction of the relationship between
interest rates and profitability, studies confirm that interest rates instability affects

19
commercial banks financial performance with studies giving contradicting findings
(Gilchris, 2013).
2.3.2 Deposits
Banks are said to be heavily dependent on the funds mainly provided by the public as
deposits to finance the loans being offered to the customers. There is a general notion that
deposits are the cheapest sources of funds for banks and so to this extent deposits have
positive impact on banks profitability if the demand for bank loans is very high. That is,
the more deposits commercial bank is able to accumulate the greater is its capacity to
offer more loans and make profits. However, one should be aware that if demands for
banks loans are low, having more deposits could decrease earnings and may result in low
profit for the banks. This is because deposits like Fixed, Time or Term deposits attract
high interest from the banks to the depositors (Buyinza, 2010).
2.3.3 Bank Size
Bank size affects the firm’s market share which affects profitability. The bigger the firms
market share, the more the sales; so in the case commercial banks are able for example to
offer more loans then they stand a greater chance of increasing interest income as well as
profits. Market share or size of banks is normally used to capture potential economies or
diseconomies of scale in the banking sector. Secondly, the size of banks as a variable
control for cost differences and product and risk diversification (Rachdi, 2013).
20
2.4 Empirical Literature
Studies on the effect of interest rates on commercial banks profitability are numerous
with most of them studying macroeconomic variables relationship with profitability. This
section has reviewed some of the studies, their methodology and findings.
2.4.1 International Empirical Literature
Yuqi (2008) examined the determinants of 123 United Kingdom (UK) banks profitability
and its implication on risk management from 1999 to 2006. The study utilized multiple
regression models and panel data estimation. The econometric results indicate that capital
adequacy has significant positive impacts on profitability but inflation has insignificant
positive impact on profitability. Liquidity and credit risk had significant negative impacts
on profitability though; GDP and interest rate have insignificant negative impacts on the
profitability of banks in UK. Buyinza (2010) investigated samples of 23 commercial
banks profitability from 1999 to 2006 in Sub Sahara Africa countries. The study utilized
panel data and the regression results revealed that capital, efficient expenses
management, bank size, credit risk, diversified earning ability of the banks, per capital
GDP, growth rate and inflation have significant and positive impact on banks’
profitability.
Ali, Akhtar, and Ahmed (2011) examined the bank specific and macroeconomic
indicators of 22 public and private sector commercial banks profitability from 2006 to
2009 in Pakistan. The research made use of multiple regression models and panel data
estimation. The study found that bank size, operating efficiency, asset management and
GDP had positive effect on banks’ profitability. However, capital and credit risk had
negative effect on banks profitability in Pakistan.

21
Gul, Irshad, and Zaman (2011) studied the factors affecting samples of 15 commercial
banks profitability from 2005 to 2009 in Pakistan. The investigation utilized a regression
model, panel data estimation and Pooled Ordinary Least Square (POLS) method of
computation with the aid of an econometric package. The econometric result indicated
both internal and external factors such as bank size, loan, deposit, GDP, inflation and
market capitalization have significant positive influence on banks profitability measured
by Return on Assets (ROA). Still in Pakistan, Gilchris (2013) examined the influence of
bank specific and macroeconomic factors on samples of 25 commercial banks
profitability from 2007 to 2011 in Pakistan. The regression results indicated that bank
size, net interest margin, and industry production growth rate had positive and significant
impact on the profitability (ROA and ROE). Non- performing loan to total advances and
inflation have negative and significant impact on ROA while GDP has positive impact on
ROA. Capital ratio has positive significant impact on ROE.
Saidu and Tumin (2011) investigated the performance and financial ratios on samples of
four Malaysian and nine Chinese commercial banks from 2001 to 2007. The research
made use of panel data and the regression results show that credit, capital and operating
ratios have influence on the performance of banks in China which is not true for
Malaysia. The study found that liquidity and size of the banks do not influence the
performance of the banks in both countries.
Khrawish, and Siam, (2011) investigated the determinants on samples of three Jordan
Islamic banks profitability from 2005 and 2009. The multiple linear regression results
show capital, bank size, financial risk, GDP growth rate, inflation, and exchange rate

22
have significant negative relationship with profitability but credit risk has insignificant
positive relationship with the profitability of Islamic banks in Jordan.
Rachdi (2013) examined what determines the profitability of banks during and before the
international financial crisis. The study samples 10 Tunisian banks from 2000 to 2010.
The regression results indicate that, before the US subprime crisis, capital adequacy,
liquidity, bank size and yearly real GDP growth affect positively the performance (ROA,
ROE and NIM) of Banks. However, cost-income ratio, yearly growth of deposits and
inflation rate are negatively correlated across all measures of bank profitability. In crisis
period, bank profitability is mainly explained by operational efficiency, yearly growth of
deposits, GDP growth and inflation.
2.4.2 Local Empirical Literature
Lucas and Anne (2010) examined the effect of macroeconomic developments on
performance, credit quality and lending behaviour of banks in Kenya, by estimating a
dynamic panel data model using Generalized Method of Moments. The study suggested
that banks needed to continue pursuing risk sensitive loan pricing policies to ease the
extent of countercyclical behaviour during economic upswings/downswings respectively,
which in turn reduces the chances of supply driven credit crunch effects.
Macharia, (2013) studied the effects of global financial crisis on the financial
performance of commercial banks offering mortgage finance in Kenya. The study found
a negative relationship between inflation, interest rates as a result of global financial
crisis and financial performance of commercial banks offering mortgage finance in
Kenya. A unit increase in inflation and interest rates led to a 0.543 and 0.425 decrease

23
respectively in the scores of financial performance of commercial banks offering
mortgage finance in Kenya. The study further found that exchange rates as a result of
global financial crisis had positive effect on financial performance of commercial banks
offering mortgage finance in Kenya. A unit increase in foreign exchange rates led to a
0.652 increase in the scores of financial performance of commercial banks offering
mortgage finance in Kenya.
Otuori (2013) investigated the determinant factors of exchange rates and their effects on
the performance of commercial banks in Kenya. The study found that exports and
imports Interest rates, inflation and exchange rates were all highly correlated. By
manipulating interest rates, central banks could exert influence over both inflation and
exchange rates, and changing interest rates impact inflation and currency values. Higher
interest rates offered lenders in an economy a higher return relative to other countries
which attract foreign capital and cause the exchange rate to rise.
Mboka (2013) studied the relationship between macro-economic variables on
nonperforming loans of commercial banks in Kenya. Data was analyzed by applying both
descriptive and inferential statistics for a 10 year period (2003 to 2012). The study found
a strong correlation between inflation and gross domestic product and current account
deficit. GDP also correlated strongly with inflation and Money supply. A significant and
positive correlation was also found between nonperforming loans and GDP growth rate,
exchange rate volatility, and banking sector development index. Kiruri and Olkalou
(2013) studied ownership structure on samples of 43 banks profitability from 2007 to
2011 in Kenya. The simple linear regression shows that ownership concentration and
state ownership had negative and significant effects on bank profitability while foreign

24
ownership and domestic ownership had positive and significant effects on bank
profitability in Kenya.
2.5 Summary
Most studies conducted in relation to bank performances have focused on sector-specific
factors that affect the overall banking sector performances or determinant of bank
performance with no study focusing on interest rates and commercial banks financial
performance. None of these studies have examined the effect of interest rates on
commercial banks financial performance, yet interest rates have been very volatile of late
and there is the need to determine how they affect commercial banks performance.
The empirical review above indicates that macroeconomics indicators are critical factors
that determined the performance of commercial banks in their financial intermediary role
of lending. Most studies on this subject were done in different regions, on different
macroeconomic indicators and sectors with scanty studies done in developing countries
and particularly in Kenya specifically on interest rates. There is therefore a gap in
literature regarding the effect of interest rates on commercial banks performance in
Kenya. This study seeks to bridge this gap.

25
CHAPTER THREE
RESEARCH METHODOLOGY
3.1 Introduction
The chapter outlines the research design and methodology that was applied in conducting
this study. It describes the research design, population of the study, sample size, sample
frame, data collection methods and data analysis and presentation of the research
findings. The chapter has section 3.2 which covers the research design, section 3.3 on the
target population and sample frame, section 3.4 on data collection methodology and
instruments and section 3.5 covering the data analysis techniques applied, the conceptual
and analytical model.
3.2 Research Design
The research employed descriptive research design. Descriptive research design method
helps in gathering information about the existing status of the phenomena in order to
describe what exists in respect to variables. This method is used because it addresses the
objective of the study in investigating the relationship between the variables of the study
(Kothari, 2008). The design takes into consideration aspects like the size of sample in
relation to the target population, the variables under the study, the approaches to the
research, and the methods employed in data collection.
Correlation method was used to determine the relationship between interest rates and
profitability of commercial banks. The study used time series empirical data on the

26
variables to examine the relationship between interest rate by establishing correlation
coefficients between the variables and profitability of commercial banks measured by
ROA.
3.3 Population of the Study
A population is defined as an entire group of individual or objects having common
observable characteristic. It refers to the entire group of people, items or things of interest
that the researcher wishes to investigate and from which the sample will be drawn and
studied. It is generally a large collection of individuals or objects that is the main focus of
a scientific query. It is for the benefit of the population that researches are done.
However, due to the large sizes of populations, researchers often cannot test every
individual in the population because it is too expensive and time-consuming (Mugenda &
Mugenda, 2008).
The target population for this study was all commercial banks in Kenya. There were 44
commercial banks in Kenya as at August 26th 2014. The 44 commercial banks will
constitute the study population (Central Bank of Kenya, 2014). According to Central
Bank of Kenya 31 are locally owned while 13 are foreign owned (See appendix I). All
the 44 commercial banks will be targeted in this study.
3.4 Sample and Sampling Techniques
The sampling frame describes the list of all population units from which the sample is
selected (Cooper & Schindler, 2008). It is a physical representation of the target

27
population and comprises all the units that are potential members of a sample (Kothari,
2008). All the 44 banks constituted the study sample.
A census design was applied where all the 44 commercial banks were studied. A census
is a collection of information from all units in the population or a complete enumeration
of the population. A census design is used where the population is small and manageable
(Mugenda & Mugenda, 2003).
3.5 Data Collection
Data collection refers to the means by which information is obtained from the selected
subjects of an investigation or a study. It refers to the techniques applied in extracting the
required study data for analysis (Mugenda & Mugenda, 2008). The data required for the
study was obtained from secondary sources that were used to investigate the relationship
between dependent and independent variables. In the study, five years data (2009 to
2013) was collected.
The secondary data sources included various like Central Bank of Kenya, Kenya National
Bureau of Statistics, World Bank websites and commercial banks financial statements.
The collected data related to dependent variable which is the commercial banks
profitability as measured by return on assets and the independent variables which
included Interest rate and size of commercial banks.

28
3.6 Data Analysis
Data analysis is the process of inspecting, cleaning, transforming, and modelling data
with the goal of discovering useful information, suggesting conclusions, and supporting
decision making. Data analysis has multiple facets and approaches, encompassing diverse
techniques under a variety of names, in different business, science, and social science
domains (Kothari, 2008). The study used quantitative method to determine the
relationship from the data obtained. This model of analysis examined the simultaneous
effects of the independent variables on a dependent variable.
A descriptive analysis technique was employed to analyse data. This included the use of
table, charts, graphs, percentages and frequencies (Mugenda & Mugenda, 2008). Multiple
regressions were used to determine the relationship between profitability and various
interest rates using the Statistical Package for Social Sciences (SPSS) version 21.
3.6.1 Conceptual Model
The following function shows the mathematical relationship between the dependant and
independent variable.
ROA=f (INT, Size) (1)
Where:
ROA = Return on Assets which is a measure of commercial bank financial
performance
INT = Interest rates measured as the average commercial banks lending interest
rate provided by CBK
Size = Size of commercial banks as measured by asset base

29
3.6.2 Analytical Model
This study employed an empirical model to determine the relative significance of each of
the variables identified above. The model took the following format;
ROA= β0+ β1INT+ β2Size + ε (2)
Where:
ε = Represents the error in the model which was assured to be zero
β1, β2 are the coefficient of the explanatory variables
The analysis of variance (ANOVA) was used to test the significance of the overall model
at 95% level of significance. Coefficient of correlation (R) was used to determine the
strength of the relationship between the dependent and independent variables. Coefficient
of determination (R2) was also be used to show the percentage for which each
independent variable and all independent variables combined were explaining the change
in the dependent variable.
3.7 Data Validity and Reliability
Reliability is the consistency of a set of measurement items while validity indicates that
the instrument is testing what it should. Reliability is the consistency of the measurement,
or the degree to which an instrument measures the same way each time it is used under
the same condition with the same subjects. It is the probability of your measurement. A
measure is considered reliable if a person’s score on the same test given twice is similar.
Reliability is not measured but it is estimated and does not, however, imply validity
because while a scale may be measuring something consistently, it may not necessarily
be what it is supposed to be measuring. To ensure that data validity and reliability, data
analyzed was obtained from Central Bank of Kenya publications.

30
CHAPTER FOUR
DATA ANALYSIS, RESULTS AND INTERPRETATIONS
4.1 Introduction
This chapter presents the data analysis, interpretation and discussion of the research
findings. The collected data was analyzed and interpreted in line with the objective of the
study which was to determine the effect of interest rates on financial performance of
commercial banks in Kenya. The chapter is divided into section 4.2 on summary of
statistics, section 4.3 on estimated model, section 4.4 on discussion and section 4.5 on
summary.
4.2 Summary of Statistics
Both descriptive and inferential statistics were employed specifically using regression
and ANOVA to establish the significance /fitness of the model and also to establish the
link between financial performances with interest rate.
4.2.1 Profitability of Commercial Banks in Kenya
Graph 4.1: Trend Analysis of Commercial Bank Performance
Source: Research Findings

31
As shown in graph 4.1 above, most commercial banks have positive return on assets
implying that Kenyan commercial banks are profitable. The highest performance was
recorded in year 2012 where the best performing commercial bank had a return on assets
of 10.4%. The lowest performance was found to be in year 2009 whereby the highest loss
made by worst performing commercial bank was -17.47%.
Figure 4.1: Year 2013 Commercial Banks Profitability
Source: Research Findings
As shown in figure 4.1 above, in year 2013, 42.86% of commercial banks had ROA of
between 0% and 3%, 30.95% had ROA of between 3% and 5%, 19.05% had ROA of 6-
10%, while 7.14% had a negative ROA.
32
Figure 4.2: Year 2012 Commercial Banks Profitability
Source: Research Findings
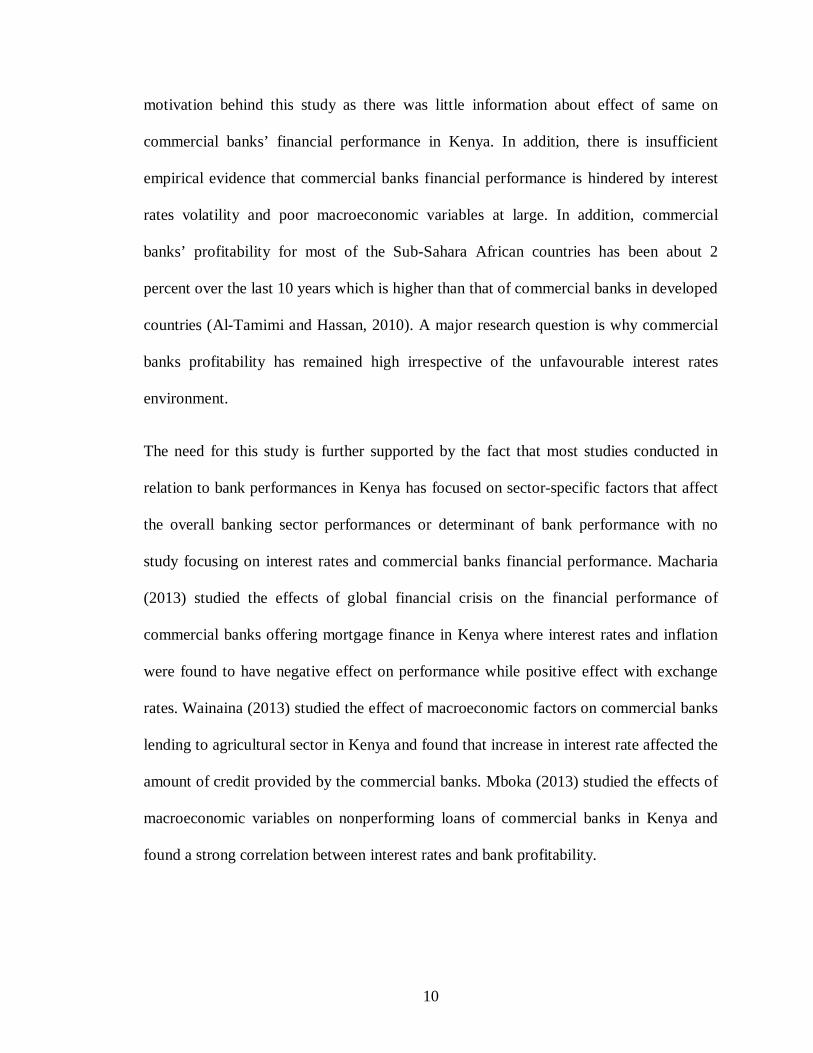
As shown in figure 4.2 above, in 2012, 47.62% of the banks had ROA of 0-3%, 23.81%
with a ROA of 3 to 5%, 19.05%, between 6 to 10% and 9.52% negative ROA.
Figure 4.3: Year 2011 Commercial Banks Profitability
Source: Research Findings

33
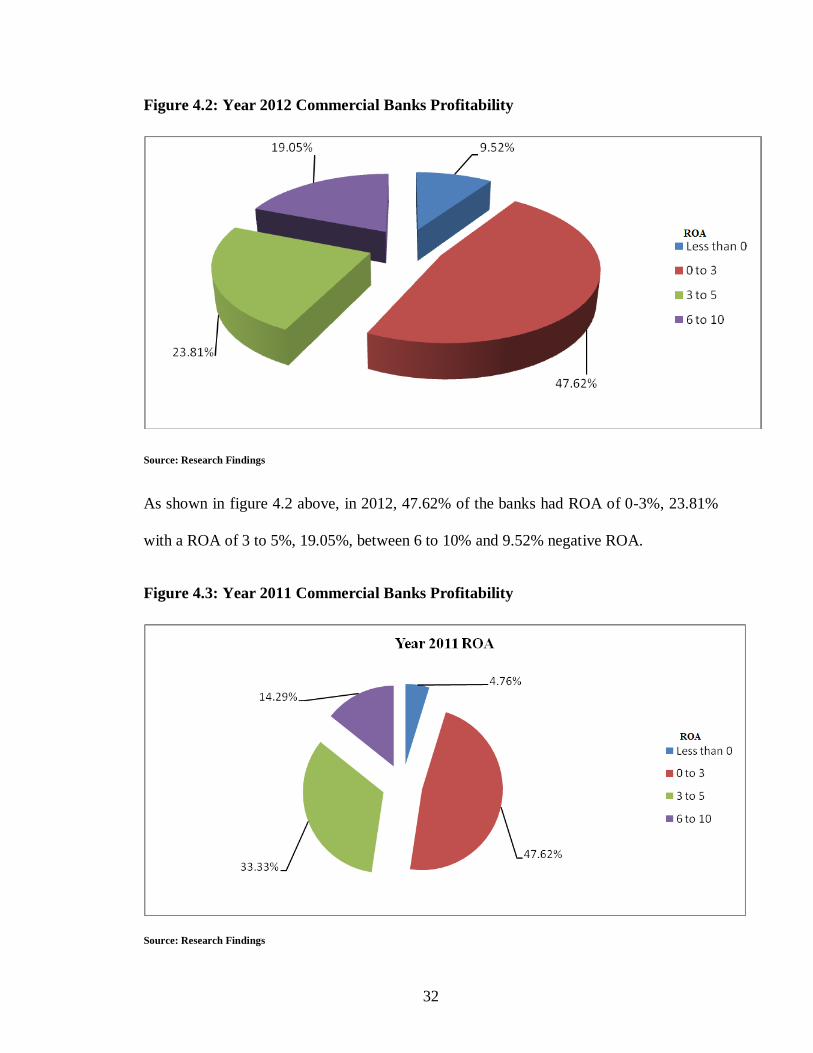
Commercial banks profitability in 2011 is shown in figure 4.3 above. As shown in figure
4.3 below, in year 2011, 47.62% of commercial banks had ROA of between 0% and 3%,
33.33% had ROA of between 3% and 5%, 14.29% had ROA of 6-10%, while 4.176%
had a negative ROA.
Figure 4.4: Year 2010 Commercial Banks Profitability
Source: Research Findings
As shown in figure 4.4 above, in 2010, 33.33% of the banks had ROA of 0-3%, 30.95%
with a ROA of 3 to 5%, 26.19%, between 6 to 10% and 9.52% negative ROA.

34
Figure 4.4: Year 2009 Commercial Banks Profitability
Source: Research Findings
As shown in figure 4.4 above, in year 2009, 42.86% of commercial banks had ROA of
between 0% and 3%, 28.57% had ROA of between 3% and 5%, 11.90% had ROA of 6-
10%, while 1.9% had a negative ROA.
Graph 4.2: Comparative Bank Profitability for Year 2009 to 2013
Source: Research Findings

35
As shown in graph 4.2 above, commercial banks profitability improved between year
2009 to 2011 with the number of commercial banks having negative ROA reduce from
11.9% to 9.5% to 4.76% in years 2009, 2010 and 2011 respectively. The performance
deteriorated between year 2011 and 2012 with the number of commercial banks with
negative ROA increasing from 4.76% in 2011 to 9.52% in 2012. However, the
performance of commercial banks improved in year 2013 with the number of commercial
banks with negative ROA reducing 7.14% from 9.52%. Almost 50% of commercial
banks have ROA of 0% to 3% with around 30% of the banks having ROA of 3% to 5%.
This implies that over 80% of Kenyan commercial banks have ROA of 0% to 5%.
The number of commercial banks with ROA of above 5% was found to move from
11.9% in 2009, to 26.19% in 2010, to 14.29% in 2011, to 19.05% in 2012 and 19.05% n
2013.This indicates the volatile market condition between year 2009 and 2010, 2010 and
2012.
4.2.2 Trend Analysis on Commercial Banks Lending Interest Rate
Graph 4.3: Interest Rates Movements
Source: Research Findings

36
As shown in graph 4.3 above, commercial banks interest rates in Kenya remained stable
from January 2009 to October 2012 after which they significantly rose from 14.72% to
20.12% in December 2011, a level that was maintained up to July 2012 after which
interest rates declined to 17.97%. Thereafter, the interest rates have remained stable at
16% and 17%.
4.2.3 Interest Rate Volatility
Graph 4.4: Interest Rates Volatility
Source: Research Findings
Interest rate volatility was measured by standard deviation. As shown in graph 4.4 above,
interest rates volatility remained below 0.5% but rose to 2.51% in October 2011. From
2012, interest rates remained volatile reaching to 0.6%.

37
4.2.4 Average Annual Interest Rates
Table 4.1: Annual Interest Rates
Year Mean Annual Interest Rates Standard Deviation
2009 14.37% 0.18%
2010 14.18% 0.32%
2011 14.97% 2.11%
2012 19.75% 0.85%
2013 17.23% 0.49%
Source: Research Findings
The average annual interest rates for year 2009 to 2013 are shown in table 4.1 above. As
shown in the table, commercial banks’ lending rates remained relatively stable in years
2009, 2010 and 2011 but rose from 14.97% in 2011 to 19.75% in 2012, but declined to
17.23% in 2013
4.2.5 Commercial Banks Industry Returns
Table 4.2: Commercial Banks Industry Returns
Year Mean Annual Interest Rates Standard Deviation
2009 1.64% 0.0398
2010 3.02% 0.0285
2011 2.96% 0.0233
2012 2.54% 0.0377
2013 3.01% 0.0272
Source: Research Findings

38
As shown in table 4.2 above, commercial banks industry in Kenya has positive returns
exceeding the 2% globally taken to be appropriate for commercial banks except for year
2009. The industry profitability improved in 2010 from 1.64% in 2009 to 3.02 in 2010,
reduced to 2.96% in 2011, 2.54% in 2012, and 3.01% in 2013. As shown by the standard
deviation values below, commercial banks industry profitability has been stable
irrespective of the volatility in interest rates.
4.3 Effect of Interest Rates on Financial Performance
To develop the variables for analytical model discussed in topic three, SPSS was used by
applying multiple linear regression technique.
4.3.1 Results of Correlation Analysis
Graph 4.5: Scatter Diagram between Interest Rates and Profitability
Source: Research Findings
The relationship between interest rates and ROA was observed to be liner and positive as
shown in graph 4.5 above.

39
Table 4.3: Correlation Results on Financial Performance
Model Summary Pearson
Correlation
R Square Adjusted R
Square
Sig. (2-
tailed)
Interest Rate Volatility 0.30102 0.09061 0.21252 0.00623
Interest Rates 0.5746 0.3302 0.3126 0.0084
Asset Base 0.46969 0.22061 0.20113 0.0017
Source: Research Findings
As shown in table 4.3 above, the relationship between interest rate volatility is positive
with coefficient of correlation of 0.3 and coefficient of determination of 0.09. The
relationship is also significant p value of 0.006 is less than 5%. The relationship between
interest rates and financial performance is positive with a coefficient of correlation of
0.57. The relationship is significant as shown by p value of 0.0084 which is less than
0.05. Size of commercial bank as measured by total assets has positive relationship with
financial performance as shown by coefficient of correlation of 0.4697. The relationship
is also significant since the p value of 0.0017 is less than 5%.
4.3.2 Results of Model of Goodness of Fit Test
Table 4.4: Model of Goodness of Fit
R R Square Adjusted R Square Std. Error of the
Estimate
0.804 0.6464 0.2929 0.0049
Source: Research Findings
As shown in table 4.4 above, financial performance is strong positively related to interest
rates and bank size. This is shown by positive coefficient of correlation of 0.8. The

40
coefficient of determination of 0.65 implies that the model developed can explain up to
65% of changes in commercial bank financial performance.
4.3.3 Results of ANOVA
Table 4.5: Estimated Model
Sum of
Squares
Df Mean
Square
F Sig.
Regression 0.00009 2 0.00004 1.8285 0.3536
Residual 0.00005 2 0.00002
Total 0.00014 4
Source: Research Findings
From the ANOVA table 4.5 above, the p value of 0.35 implies that the relationship is
significant at 95% since the p value is less than 0.05. The model developed is also
significant for prediction.
4.3.4 Estimated Model
Table 4.6: Estimated Model
Unstandardized
Coefficients
Std.
Error
Standardized
Coefficients
t Sig.
Constant 0.0857 0.038 2.2537 0.153
Asset Base 0.0001 0.0001 1.2188 1.8892 0.1995
Interest
Rates 0.1983 0.16 0.7998 1.2397 0.3408
Source: Research Findings

41
The model developed from the coefficients in table 4.6 above is
Y=0.0857+0.1983X1+0.0001X2 where Y is financial performance as measured by return
on assets, X1 is the interest rates and X2 is the size of the bank as measured by value of
assets. From the coefficients, the interest rates have the highest effect on financial
performance of commercial banks
4.4 Discussion
The study sought to determine the impact of interest rate on bank financial performance
in Kenya. The study found that the relationship between interest rates and financial
performance is positive with a coefficient of correlation of 0.57.The coefficient of
determination of 0.32 implies that interest rates affects 32% of profitability. The ANOVA
results show a p value of 0.0084 which is less than 0.05. This implies that the relationship
is significant at 95%. The results agrees with those of Gilchris (2013) who found that net
interest margin had positive and significant impact on the profitability as measured by
ROA and ROE. Locally, the findings concur with those of Otuori (2013) who found that
higher interest rates offered lenders in an economy a higher return relative to other
countries thus attracting foreign capital leading to increase profitability.
Profitability of commercial banks is positively related to interest rates and bank size with
coefficient of correlation of 0.8. The coefficient of determination of 0.65 implies that the
model developed can explain up to 65% of changes in commercial bank profitability. The
relationship is significant at 95% confidence level with a p value of 0.35. The model
developed from by the study is Y=0.0857+0.1983X1+0.0001X2 where Y is profitability,
X1 is the interest rates and X2 is the size of the bank as measured by value of assets. This
implies that for every percentage change in interest rates, profitability will change by

42
0.1983 and for every change in shilling of assets, profitability will change by 0.0001%.
The size of the bank was used as control variables. The findings on positive effect of size
on profitability is in line with findings by Rachdi (2013) who found that size of banks had
effect on profitability through control of cost differences and product and risk
diversification. However, the findings contradict those of Saidu and Tumin (2011) who
found that size of the banks do not influence the performance of the banks in both
countries.
The industry profitability was found to have improved in 2010 from 1.64% in 2009 to
3.02 in 2010, reduced to 2.96% in 2011, 2.54% in 2012, and 3.01% in 2013. This finding
agrees with those of Flamini et al., (2009) who found that commercial banks in Sub-
Saharan Africa are more profitable than the rest of the world with an average Return on
Assets (ROA) of 2 percent. This also implies that commercial banks industry in Kenya
has positive returns exceeding the 2% globally taken to be appropriate for commercial
banks except for year 2009 as indicated by Yuqi (2008). Commercial banks industry
profitability has been stable irrespective of the volatility in interest rates measured by
standard deviation.
4.5 Summary
Most commercial banks were found to have positive return on assets implying that
Kenyan commercial banks have high financial performance. The highest performance
was recorded in year 2012 where the best performing commercial bank had a return on
assets of 10.4%. The lowest performance was found to be in year 2009 whereby the
highest loss made by worst performing commercial bank was -17.47%.

43
Financial performance of commercial banks improved between year 2009 to 2011 with
the number of commercial banks having negative ROA reduce from 11.9% to 9.5% to
4.76% in years 2009, 2010 and 2011 respectively. The performance deteriorated between
year 2011 and 2012 with the number of commercial banks with negative ROA increasing
from 4.76% in 2011 to 9.52% in 2012. The number of commercial banks with ROA of
above 5% was found to move from 11.9% in 2009, to 26.19% in 2010, to 14.29% in
2011, to 19.05% in 2012 and 19.05% in 2013.This indicates the volatile market condition
between year 2009 and 2010, 2010 and 2012. However, the performance of commercial
banks improved in year 2013 with the number of commercial banks with negative ROA
reducing to 7.14% from 9.52%. Almost 50% of commercial banks have ROA of 0% to
3% with around 30% of the banks having ROA of 3% to 5%. This implies that over 80%
of Kenyan commercial banks have ROA of 0% to 5%.
Commercial bank lending interest rates in Kenya remained stable from January 2009 to
October 2011 after which they significantly rose from 14.72% to 20.12% in December
2011, a level that was maintained up to July 2012 after which interest rates declined to
17.97%. Thereafter, the interest rates have remained stable at 16% and 17%. Interest rate
volatility was measured by standard deviation. Interest rates volatility remained below
0.5% but rose to 2.51% in October 2012. From 2012, interest rates remained volatile
reaching to 0.6%. Commercial banks’ lending rates remained relatively stable in years
2009, 2010 and 2011 but rose from 14.97% in 2011 to 19.75% in 2012, but declined to
17.23%. The study found that the relationship between interest rates and financial
performance is positive with a coefficient of correlation of 0.57.The coefficient of
determination of 0.32 implies that interest rates affects 32% of profitability.

44
CHAPTER FIVE
SUMMARY, CONCLUSION AND RECOMMENDATIONS
5.1 Introduction
This chapter presents the summary of findings, conclusions and recommendations
derived from the findings of the study. The chapter also presents the limitations that were
encountered in the study with suggestions for further research. It is divided into section
5.2 on summary of the study, section 5.3 on conclusion, section 5.4 on policy
recommendation, section 5.5 on limitations of the study and section 5.6 on
recommendation for further research.
5.2 Summary of the Study
The study sought to establish the effect of interest rates and financial performance of
commercial banks in Kenya. The study used a descriptive research design to achieve the
research objectives. Multiple regression analysis was used to determine the relationship
between interest rates and financial performance measured by return on assets. The study
used the return on assets as the dependent variable while lending interest rates was the
independent variable.
The study found a significant positive relationship between interest rates and financial
performance with a coefficient of correlation of 0.57. Commercial bank financial
performance was also found to be positively related to interest rates and bank size with a
coefficient of correlation of 0.8. Over 90% of commercial banks were found to have
positive return on assets. The highest performance for the period of study was recorded in

45
year 2012 where the best performing commercial bank had a return on assets of 10.4%.
The lowest performance was found to be in year 2009 whereby the highest loss made by
worst performing commercial bank was -17.47%.
Financial performance of commercial banks improved between year 2009 to 2011 with
the number of commercial banks having negative ROA reduce from 11.9% to 9.5% to
4.76% in years 2009, 2010 and 2011 respectively. The performance deteriorated between
year 2011 and 2012 with the number of commercial banks with negative ROA increasing
from 4.76% in 2011 to 9.52% in 2012. Commercial bank lending interest rates in Kenya
remained stable for the from January 2009 to October 2012 after which they significantly
rose from 14.72% to 20.12% in December 2011, a level that was maintained up to July
2012 after which interest rates declined to 17.97%. Interest rate volatility was measured
by standard deviation and had positive effect on commercial bank profitability.
Commercial banks lending rates remained relatively stable in years 2009, 2010 and 2011
but rose from 14.97% in 2011 to 19.75% in 2012, but declined to 17.23%. The industry
profitability was found to improve in 2010 from 1.64% in 2009 to 3.02 in 2010, reduced
to 2.96% in 2011, 2.54% in 2012, and 3.01% in 2013. Commercial banks industry
profitability was found to be higher than those of developed countries and remained
stable irrespective of the volatility in interest rates.
5.3 Conclusion
The main objective of this study was to determine the effect of interest rates on financial
performance of commercial banks in Kenya. From the finding above, the study concludes
that interest rates have significant positive effect on financial performance of commercial

46
banks in Kenya at 95% confidence level. The relationship between interest rates and
profitable was also found to be linear with increase in interest rates leading to higher
profitability. The study also concludes that interest rate volatility has positive effect on
profitability of commercial banks.
The study further concludes that commercial banks in Kenya are profitable with over
90% of commercial banks having positive financial returns. This is shown by the positive
ROA as well as the rising ROA over the period of analysis. The study also concludes that
the size of commercial banks has effect on profitability of commercial banks where the
big commercial banks have higher profitability. Finally, the study concludes that the
model containing interest rates and size of commercial bank can explain 64% of the
changes in commercial banks profitability.
5.4 Limitations of the Study
The study was faced by a number of limitations. First, this study made use of return on
assets as measure of financial performance. There are other measures of financial
performance including return on equity (ROE), net interest margin (NIM), return on
capital employed (ROCE) among others. Secondly, the study relied on secondary data
which had already been compiled by the Central Bank of Kenya. Data was used just as
obtained without any adjustments and the researcher had no means of verifying for the
validity of the data which was assumed to be accurate for the purpose of this study. The
study results are therefore subject to the validity of the data.
Thirdly, the study was specific to Kenya and therefore suffers from the limitations of
country specific studies thus cannot be generalized to banks in other countries other than

47
Kenya. Fourthly, the study was based on five-year data on performance and also on
interest rate. Thus the period covered may be recent but is not long enough to take care of
the fluctuations in the variables as well as major events in the banking industry in Kenya.
5.5 Policy Recommendation
Based on the study findings, the study makes a number of recommendations to be
considered for policy formulations. First, commercial banks lending rates have positive
effect on commercial banks profitability. This is because higher lending rate implies
more revenues to the commercial banks which may not be crowded out by reduced
demand for loans. This implies that the demand for loans in Kenya is inelastic and hence
insensitive to changes in price for money (interest rates). To cushion consumers from
exploitation by commercial banks, the Central Bank need exercise their monitoring roles
strictly and discipline any commercial banks that may be increasing the interest rates
arbitrary. Further, policies need to be put in place to shield bank lending rates and ensure
monitoring the same. In addition, in times of poor performance of commercial banks and
the need to boost their profitability may be necessary for their role in economy, Central
Bank of Kenya should come up with monetary policy that will lead to rise in interest rates
and hence improving banks profitability.
The management of commercial banks also need to develop polices and investment
sources that diversify income since interest rates only explain 33% of the changes in
profitability. Diversifying the commercial banks source of profitability from the over
reliance on the interest rates related sources and explore on other avenues of achieving
high profitability will be vital. In addition, the management of small and medium sized

48
banks need to develop ways of ensuring that their banks grow to large banks since
increase in bank size positively affects profitability
5.6 Suggestions for Further Research
Based on the limitations of the study, findings and experience of the researcher over the
research period, the study has numerous areas where further research can be done. First,
while interest rate is the main determinant of commercial banks profitability since they
trade in money. Further research can therefore be done incorporating other determinants
of commercial banks profitability and not only interest.
Further research should be done in different country to enable generalization of the
findings. In addition, some study can be carried out using data from commercial banks as
opposed to data availability from Central Bank of Kenya. This will improve the reliability
of the financial information. Further study can be done on other firms like microfinance
institutions, pension funds and other financial institutions. Lastly, the study recommends
that there is need to do another study in the banking industry that makes use of other
control variables in order to show the impact of interest rate on bank performance not
only the size.

49
REFERENCES Ali, K., Akhtar, F., & Ahmed, Z., (2011). Bank specific and Macroeconomic Indicators
of Profitability-Empirical Evidence from the Commercial Banks of Pakistan.
International Journal of Business and social sciences.
Al-Tamimi, H., Hassan, A., (2010) Factors Influencing Performance of the UAE Islamic
and Conventional National Banks. . Department of Accounting, Finance and
Economics, College of Business Administration, University of Sharjah.
Baum, F., Mustafa, C., & Neslihan, O., (2009). The Second Moments Matter: The Impact
of Macroeconomic Uncertainty on the Allocation of Loanable Funds. Economics
Letters.
Berger, A., (1995). Problem Loans and Cost Efficiency in Commercial Banks,Economics and Policy Analysis Working Paper, 95
Bikker, A., & Hu, H., (2002).Cyclical Patterns in Profits, Provisioning and Lending of Banks and Procyclicality of the New Basel Capital Requirements.BNL Quarterly Review, 221, 143-175.
Buyinza, F., (2010). Determinants of Profitability of Commercial Banks in Sub-Sahara
Africa Countries. Department of Economics, Johanassen Keppler University, Linz
– Austria.
Central Bank of Kenya (2011). Bank Supervision Annual Report, Kenya.
Central Bank of Kenya (2013). Licensed Commercial Banks and Mortgage Companies. Retrived on September 2nd 2014 from https://www.centralbank.go.ke/index.php/bank-supervision/commercial-banks-mortgage-finance-institutions
Chen, N., Roll, R., & Ross, S., (1986). Economic forces and the stock market. Journal of
Business 59,386-403.
Cooper, R., and Schinder, S., (2008). Business research methods. 10th Ed. New York:
Mc Graw Hill.

50
Easterly, W., Islam, R., & Stiglitz, J., (1999). Shaken and stirred, explaining growth volatility. Annual Bank Conference on Development Economics, The World Bank, April.
Flamini, C., Valentina C., McDonald, G., Liliana, S. (2009). The Determinants of
Commercial Bank Profitability in Sub-Saharan Africa. IMF Working Paper
Friedman, M., (1963). Inflation, Causes and Consequences. Bombay: Asia Publishing
House
Gilchris, M., (2013). Influence of Bank Specific and Macroeconomic Factors on the Profitability of 25 Commercial Banks in Pakistan during the Time Period 2007 -2011. American Journal of Business and Finance.
Gul, S., Irshad, K., & Zaman, K., (2011). Factors Affecting Bank Profitability in
Pakistan. The Romanian Economics Journal
Hara, M., (1983). A dynamic theory of the banking firm. The Journal of Finance 38,127-
140.
Harberger, C., (1963). The Dynamics of Inflation in Chile. In Measurement of
Economics: Studies in Economics and Econometrics in Memory of Yehunda
Grunfield, edited by C. F. Christ. Stanford, Calif.: Stanford University Press.
Herrero, G., (2003). Determinants of the Venezuelan Banking Crisis of the Mid 1990s:
An Event History Analysis, Banco de Espana
International Monetary Fund, (2001). Regional Economic Outlook: Sub-Saharan
Africa.World Economic and Financial Surveys. IMF Working Papers, 0258-
7440.60
Karl, E., Ray, C., & Shannon, M. (2009). Principles of economics.Pearson International
Edition.Prentice Hall.
Keynes, M., (2006). The General Theory of Employment, Interest and Money. New
York: Atlantic Publishers & Distributors; orig. pub. 1936.
Khrawish, A., & Siam, Z., (2011). Determinants of Islamic Banks Profitability: Evidence
from Jordan. Middle Eastern Finance and Economics Journal, Issue 13: 42 – 57.

51
Kiruri, M., & Olkalou, K., (2013). The Effects of Ownership Structure on Bank
Profitability in Kenya. European Journal of Management Science and Economic
Kothari, R., (2008). Research Methodology. New Delhi: New Age International
Publishers.
Macharia, E., (2013). The effects of global financial crisis on the financial performance
of commercial banks offering mortgage finance in Kenya. International Journal
of Social Sciences and Entrepreneurship, 688-701.
Mboka, T., (2013). Effects of macro-economic variables on nonperforming loans of
commercial banks in Kenya. MBA Project, University of Nairobi
Miller, M. (2003). Can Credit Registries Reduce Credit Constraints?, Empirical Evidence
on the Role of Credit Registries in Firm Investment decisions.
Mugenda,A., & Mugenda, O., (.2003). Research methods; quantitative and qualitative
approaches. Africa Center for Technology (ACTS), Nairobi Kenya
Mulei, A (2003). Commercial and Financial Institutions. Central Bank of Kenya
Ongore,V., (2013). Determinants of Financial Performance of Commercial Banks in
Kenya. International Journal of Economics and Financial Issues, ISSN: 2146-
4138
Otuori, H., (2013). Influence of exchange rate determinants on the performance of
commercial banks in Kenya. European Journal of Management Sciences and
Economics, 1(2), 86-98.
Owoeye, T.,and Ogunmakin, A., (2013).Exchange Rate Volatility and Bank Performance
in Nigeria. Asian Economic and Financial Review, 3(2):178-185
Panayiotis P., Athanasoglou, P., Delis, M, & Staikouras, C., (2006). “Determinants of
Bank Profitability in the South Eastern European Region”. Bank of Greece
Economic Research Department –Workig Paper No.47. ISSN 1109-6691

52
Rachdi, H., (2013). What Determines the Profitability of Banks During and Before the
International Financial Crisis? Evidence from Tunisia. International Journal of
Economics, Finance and Management.
Saidu, M., & Tumin, H., (2011). Performance and Financial Ratios of Commercial Banks
in Malaysia and China. International Review of Business Research Paper.
Sayedi, S., (2013). Bank specific, industrial specific and macroeconomic determinants of
banks profitability in Nigeria. Journal of Finance
Seibel, D., (2001). Financial Systems Development and microfinance, Deutsche
Gesellschaft fur Technische Zusammenarbeit (GTZ) Publication
Simon, F., (1997).Current Account and Exchange Rate Behaviour under Inflation
Targeting in Small Open Economy
Wainaina, G., (2013). Effect of macroeconomic factors on commercial banks lending to
agricultural sector in Kenya. MBA Project, University of Nairobi
Were, M., Kamau, A., Sichei, M., Kiptui, M., (2013). A theoretical framework for
Kenya’s central bank macro econometric model. Africa growth initiative working
paper
Williamson, O., (1995). The Institutions of Governance of Economic Development and
Reform Proceedings of the World Bank Annual Conference on Development
Economics.
Yuqi, L. (2008). Determinants of Banks’ Profitability and its Implication on Risk
Management Practices: Panel Evidence from the UK in the period 1999 – 2006.
University of Nottingham, UK.
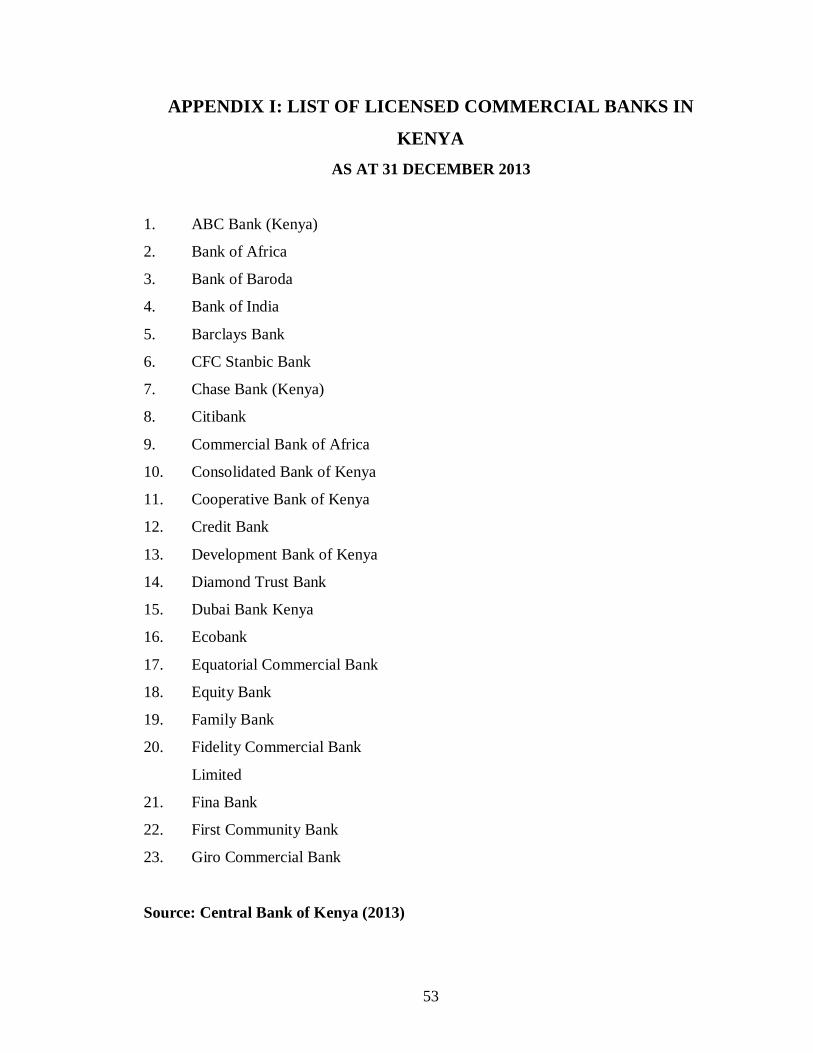
53
APPENDIX I: LIST OF LICENSED COMMERCIAL BANKS IN
KENYA AS AT 31 DECEMBER 2013
1. ABC Bank (Kenya)
2. Bank of Africa
3. Bank of Baroda
4. Bank of India
5. Barclays Bank
6. CFC Stanbic Bank
7. Chase Bank (Kenya)
8. Citibank
9. Commercial Bank of Africa
10. Consolidated Bank of Kenya
11. Cooperative Bank of Kenya
12. Credit Bank
13. Development Bank of Kenya
14. Diamond Trust Bank
15. Dubai Bank Kenya
16. Ecobank
17. Equatorial Commercial Bank
18. Equity Bank
19. Family Bank
20. Fidelity Commercial Bank
Limited
21. Fina Bank
22. First Community Bank
23. Giro Commercial Bank
Source: Central Bank of Kenya (2013)

54
24. Guardian Bank
25. Gulf African Bank
26. Habib Bank
27. Habib Bank AG Zurich
28. I&M Bank
29. Imperial Bank Kenya
30. Jamii Bora Bank
31. Kenya Commercial Bank
32. K-Rep Bank
33. Middle East Bank Kenya
34. National Bank of Kenya
35. NIC Bank
36. Oriental Commercial Bank
37. Paramount Universal Bank
38. Prime Bank (Kenya)
39. Standard Chartered Kenya
40. Trans National Bank Kenya
41. United Bank for Africa [2]
42. Victoria Commercial Bank
43. FirstRand Bank
44. Bank of China

55
APPENDIX II: COMMERCIAL BANKS RETURN ON ASSETS Bank 2013 2012 2011 2010 2009
1Equity Bank Ltd 7.70% 7.40% 6.84% 6.95% 5.66%
2Kenya Commercial Bank Ltd 5.50% 5.20% 4.98% 5.17% 3.57%
3Standard Chartered Bank (K) Ltd 6.00% 5.90% 5.03% 5.37% 5.39%
4Barclays Bank of Kenya Ltd 5.80% 7.00% 7.18% 6.24% 5.30%
5Co-operative Bank of Kenya Ltd 4.70% 4.80% 3.68% 3.61% 3.26%
6CFC Stanbic Bank (K) Ltd 4.10% 3.50% 2.23% 1.96% 1.35%
7I&M Bank Ltd 5.50% 5.20% 5.80% 4.80% 3.94%
8Diamond Trust Bank (K) Ltd 4.90% 4.90% 4.19% 4.90% 3.44%
9NIC Bank Ltd 4.60% 4.20% 4.57% 4.41% 3.30%
10Citibank N.A. Kenya 7.00% 10.40% 6.43% 4.64% 5.92%
11Commercial Bank of Africa Ltd 3.60% 4.00% 3.58% 4.24% 3.00%
12Bank of Baroda (K) Ltd 4.80% 3.60% 4.57% 5.65% 3.24%
13Imperial Bank Ltd 5.80% 5.50% 6.37% 6.43% 5.09%
14Chase Bank Ltd 2.90% 2.70% 2.33% 2.45% 2.42%
15Prime Bank Ltd 3.80% 2.70% 3.07% 2.37% 2.33%
16National Bank of Kenya Ltd 1.90% 1.70% 3.56% 4.49% 4.13%
17Family Bank Ltd 4.00% 2.70% 2.01% 2.48% 2.50%
18Bank of India 4.10% 2.40% 4.18% 5.04% 3.91%
19Bank of Africa (K) Ltd 2.00% 1.30% 1.43% 1.81% 1.53%
20Victoria Commercial Bank Ltd 4.30% 4.80% 4.31% 5.00% 4.22%
21African Banking Corporation Ltd 2.90% 2.90% 4.12% 4.67% 2.82%
22K - Rep Bank Ltd 4.20% 3.20% 2.78% 1.44% -3.76%
23Habib Bank Ltd 6.20% 6.50% 4.62% 4.34% 4.16%
24Habib Bank A.G. Zurich 4.30% 4.20% 2.91% 3.05% 3.85%
25Gulf African Bank Ltd 2.70% 2.80% 1.20% 0.49% -2.10%
26Guaranty Trust Bank Ltd 1.60% 2% 2.12% 1.07% 0.18%
27Guardian Bank Ltd 3.00% 1.90% 1.92% 1.39% 0.83%
28Giro Commercial Bank Ltd 2.80% 1.70% 2.79% 6.20% 2.63%
29Fidelity Commercial Bank Ltd 2.50% 0.90% 2.79% 4.59% 0.94%

56
30Development Bank of Kenya Ltd 1.80% 0.80% 1.37% 2.22% 2.27%
31Trans - National Bank Ltd 2.30% 3.70% 4.05% 3.33% 2.36%
32First Community Bank Ltd 1.80% 2.90% 1.28% -2.50% -3.42%
33Oriental Commercial Bank Ltd 2.50% 1.80% 3.83% 4.01% 0.97%
34Equatorial Commercial Bank Ltd 1.00% -4.60% 0.55% -0.32% 1.69%
35Paramount Universal Bank Ltd 1.20% 1.20% 2.39% 6.35% 1.23%
36Jamii Bora Bank Ltd 1.30% 1.50% -1.79% -4.85% 0.00%
37Middle East Bank (K) Ltd 1.40% 0.80% 1.99% 5.11% 1.37%
38Credit Bank Ltd 1.00% 1.30% 0.95% 0.74% 2.15%
39Dubai Bank Ltd 0.50% -1.20% 0.90% 0.18% 0.41%
41Consolidated Bank of Kenya Ltd -0.80% 1.00% 1.68% 2.46% 1.54%
42UBA Kenya Ltd -7.50% -13.60% -5.72% -5.85% -17.47%
43Ecobank Kenya Ltd -3.30% -4.80% 1.20% 0.70% -7.13%
Source: Central Bank of Kenya (2013)


