1
The Effect of Music as a Prepulse Stimulus on the Activation of the Sympathetic Nervous
System
Hanna Lynch, Parth Patel, Stanislav Konrath, and Devin Blodgett
Keywords: Prepulse, Music, Sympathetic response
Word Count: 3,127
Address: 1300 University Ave. Madison, WI 53715
[email protected], [email protected], [email protected], [email protected]
Statistics Analysis: Wanzhen Lu ([email protected])
Table of Contents: Abstract.....................................................................................p.2
Introduction...............................................................................p.2
Methods and Materials..............................................................p.3
Results.......................................................................................p.4
Discussion.................................................................................p.9
Resources..................................................................................p.11
Appendix A…………………………………………………...p.12
Key points summary
A startle response in humans can be inhibited by a pre-pulse which serves as a warning
The extent of the startle response can be observed by the amount of activation of the
sympathetic nervous system
The experiment was performed to test if suspenseful music is an effective pre-pulse
The data showed that suspenseful music works as a mild pre-pulse and therefore limits
the effectiveness of a startle that follows it
Horror films often use suspenseful music which was shown in this experiment to actually
decrease the effectiveness of a startle
This must mean that suspenseful music serves a different function in horror movies, one
of which is to create a certain atmosphere, with the tradeoff being that startle scares are
less effective

2
Abstract: The purpose of this study is to determine whether classical or suspense-filled melodies
can act as a prepulse that precedes and suppresses the strength of the startle response. Since
fearful melodies had the greatest effect on Galvanic Skin Response (GSR) and heart rate, we
expect those listening to suspense-filled music to experience a weakened startle response as
compared to those listening to classical music. Further, we expect melodies that affect these
autonomic responses to suppress the eye blink response of the startle reflex as well. In
conclusion, the melodies that elicit a decrease in the magnitude of the startle reflex will be
identified as positive prepulses. In our results, the GSR showed that music can work as a mild
prepulse, but our other methods of data collection were inconclusive due to lack of statistical
significance.
Abbreviations: ANS, Autonomic nervous system; EOG, Electrooculogram; GSR, Galvanic Skin
Response.
Introduction: One of the most primitive defensive responses in the human body, the startle reflex
results in the body’s quick, involuntary reaction to a sudden sound, sight, touch, or movement.
For most, the startle reflex is characterized by the involuntary contraction of skeletal and facial
muscles, as seen in the involuntary elicitation of a brief blink response, readily distinguished
from non-reflexive blinks (Braff 2001). In addition, the body’s startle response is characterized
by increased heart rate, respiration rate, and blood pressure, as well as increased skin perspiration
(Seeley 2004). These responses result from the activation of the sympathetic division of the
autonomic nervous system (ANS). The other division of the ANS, the parasympathetic, controls
the body at rest and is responsible for resolving sympathetic responses after danger has passed
(Seeley 2004).
Previous studies have shown that the strength of the startle response, such as that of the
eye blink response, can be suppressed if it is introduced to a weaker stimulus prior to the actual
startle stimulus (Braff 2001, Blumenthal 2003). A startle response can be elicited by acoustic
stimuli at any frequency with a sharp and sudden onset lasting between 20-50 milliseconds
(Yeomans 2002). The reduction in amplitude of the startle response reflects the ability of the
nervous system to temporarily adapt when given a warning. This has been recognized as pre-
pulse inhibition (PPI). Much like the startle reflex, a variety of visual, auditory, or tactile
‘prepulses’ can be applied to elicit a response in 20 millisecond intervals (Braff 2001). Moreover,
Filion et. al stated that if a prepulse it emotionally striking, it would elicit a greater reduction in
the startle response (Filion 1998).
The intensity of the startle reflex is a reflection of emotion, particularly negative
emotions such as fear and anger (Roy et. al 2009). To invoke emotion, auditory stimuli in the
form of music have been used (Nater et. al 2006, Sammler et. al 2006). According to a recent
study, suspenseful music is defined by the abrupt transitions in frequency and harsh amplitude
fluctuations (Blumenthal et. al 2010). Moreover, since emotion arises unconsciously, like the
startle reflex, autonomic responses offer reliable signs of emotional reaction. Previous studies by
Khalfa et. al have determined that Galvanic skin response (GSR) were greater for melodies
representing fear or happiness, than those representing sadness and peacefulness (Khalfa et. al
2002). In fact, fear is the emotion that provided the greatest GSR (Khalfa et. al 2002).
Additional studies revealed unpleasant versus pleasant melodies do affect heart rate, but whether
3
it increases or decreases the rate is inconclusive (Nater et. al 2006, Sammler et. al 2007). It is,
however, known that unpleasant melodies were responsible for these changes in heart rate.
A previous study proved that a verbal warning can be used as a pre-pulse inhibition (Lay
et. al, 2011). The purpose of this study is to determine whether classical or suspense-filled
melodies can act as a prepulse that precedes and suppresses the strength of the startle response.
Since fearful melodies had the greatest effect on GSR and heart rate, we expect those listening to
suspense-filled music to experience a weakened startle response as compared to those listening
to classical music. Further, we expect melodies that affect these autonomic responses to suppress
the eye blink response of the startle reflex as well. In conclusion, the melodies that elicit a
decrease in the magnitude of the startle reflex will be identified as positive prepulses.
Methods and Materials: The materials used for this experiment include the Biopac Student Lab software that
measures and records the electrooculography (EOG) and the galvanic skin response (GSR) data
as well as the pulse oximeter. The GSR has been found to be an autonomic response in the
sympathetic division of the startle reflex. Further, GSR have found to alternate between
unpleasant and pleasant music, allowing us to believe certain music may be acting as a pre-pulse
(Mailhot et. al 2009). Heart rate was measured by the pulse oximeter. Increased heart rate is an
autonomic response elicited from the startle response. Previous studies with emotion have found
the heart rate is affected, whether positively or negatively, when paired with unpleasant or
pleasant music (Sammler et. al 2007). The EOG will serve to measure the characterized
automatic eyeblink of a startle response. It will serve to indicate that the startle stimuli have
initiated a response (McMullen, BioPac). To get a positive control for the EOG, the subject was
asked to blink hard, and to get a positive control for the GSR and heart rate, the subject exercised
on a stationary bike for ninety seconds at approximately 50 rpm.
In order to run both the EOG and the GSR simultaneously, the Biopac Student Lab
software was run on two different computers. Each of these tests were chosen to measure the
physiological changes to the body during an activation of the sympathetic nervous system. The
experimental variable tested was that if the type of music played during a video had an effect on
the resulting startle response to a stimulus shown at the end of the video. To test this, subjects
were shown either the video with classical music or the video with scary music. There were 12
subjects in each control group, scary and classical. The scary group had nine females and three
males, and the classical group had 11 females and one male. The videos were shown alternating
for every subject, after each signed the consent form shown in Appendix A.
A video was selected that could be shown with two different types of music with a
stressor added at the end. The video was a compilation of various random clips of people,
places, and objects that would not be viewed as scary when shown with classical music, but
could make the viewer suspicious or anxious when played with suspenseful music. The visual
stimulus was the same in both videos, but one video had classical music in the background and
the other had suspenseful music. The end of both videos had the same scary picture paired with
screaming to induce a startle response (Mind, 2010). A timeline of the previously stated events is
shown in Figure 1.
4
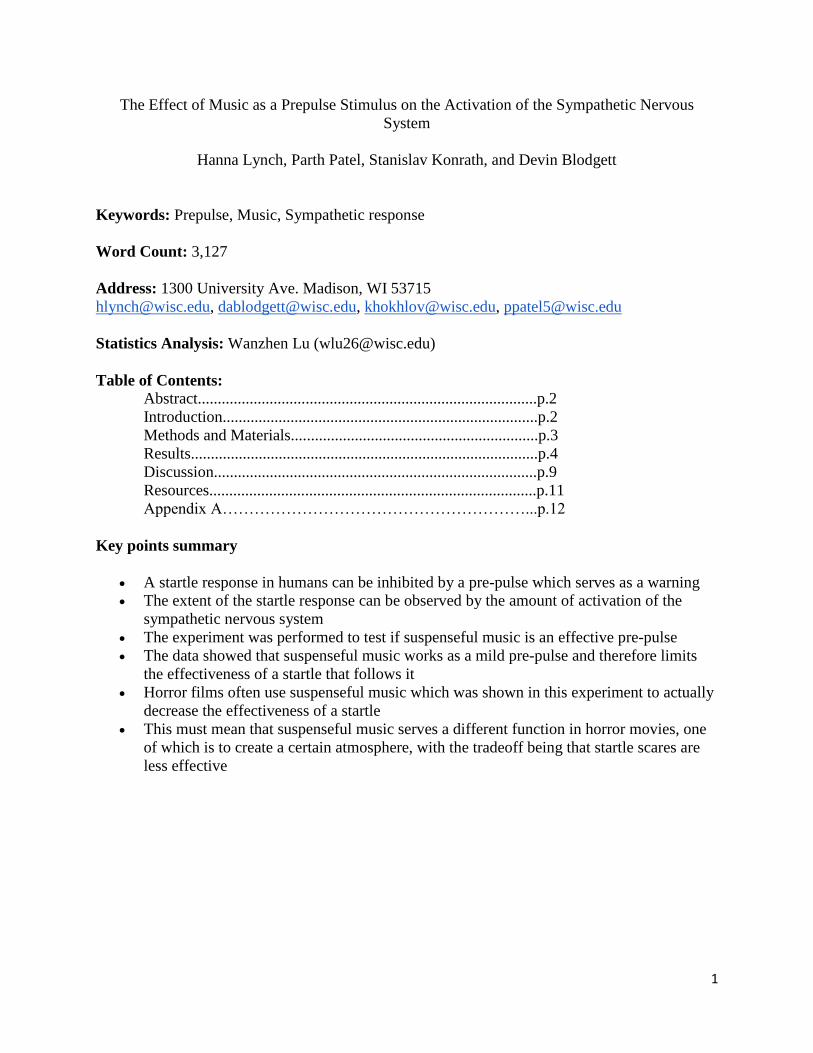
Figure 1: Timeline of what the subject experienced during the study. The first 5 seconds was used for creating the positive control for the EOG (eyeblinking). The bold red line at 2:50 is the startle stimulus. 12 Subjects watched the movie with classical music and 12 subjects listened with scary music.
Each subject is brought to a quiet room to limit the number of distractions that could
affect testing. They were seated on a chair with their feet on the ground facing the computer
monitor and then hooked up to the GSR, EOG, and a pulse oximeter. The electrodes for the
EOG were placed, with three in a horizontal line across the forehead, one below the right eye,
and the last two on each temple on either side of the head. The GSR Velcro strips were placed
on the index and middle finger of the left hand and the pulse oximeter was positioned on the
index finger of the right hand.
Before showing the video, the EOG was calibrated with the subject following a moving
dot on the screen with their eyes and then the positive control was taken by having the subject
blink hard to show a change in the measurements of the EOG. The beginning of the video had a
30 second clip of a black screen with a white dot in the middle in which all the equipment was
run in order to obtain baseline levels recording heart rate every 15 seconds. One of the two
videos was shown and the same black screen followed for 15 seconds after the stressor. Shortly
after the video, the EOG was unhooked and the subject got on a stationary bicycle for
approximately ninety seconds in order to have a positive control for the GSR and heart rate
measurements. While subjects biked, they placed their right hand on their leg or in the air to
prevent misreading of the pulse oximeter. The physical exercise will activate their sympathetic
nervous system, which will in turn mimic the results expected to see from the startle reflex.
After all the data was collected, it was analyzed using Excel and the Biopac Student Lab
system.
Results: Heart Rate Results
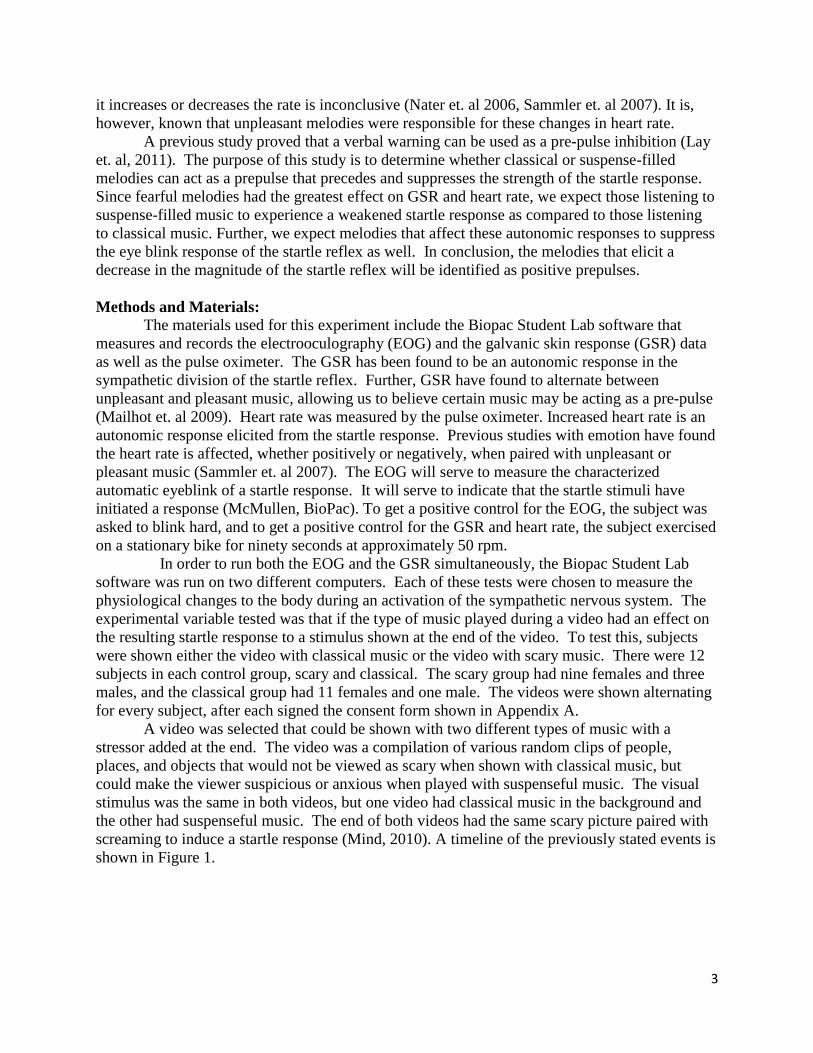
In order to correct for the differences in the resting heart rate of each of the subjects, heart
rate was analyzed using standardization. First, we calculated the baseline mean and standard
deviation heart rates from the first thirty seconds of baseline measurements. Using these
calculations, we found Z-scores of each of the heart rate measurements taken throughout the rest
of the video. Figure 2 shows the recorded heart rate values as well as the calculated Z-scores for
one subject. To show the overall trend of the graphs, Figure 3 and 4 show the average Z-scores
for both groups shown the video with classical and scary music. Negative Z-scores represent
heart rates below the baseline measurement while positive Z-scores show heart rates above the
baseline measurement (Lay 2011).
5
Figure 2: Table 1 shows the heart rate of one subject with the baseline highlighted in yellow. Table 2 shows the mean and standard deviation of the baseline heart rate as well as the corresponding Z-scores shown as standardized heart rates.
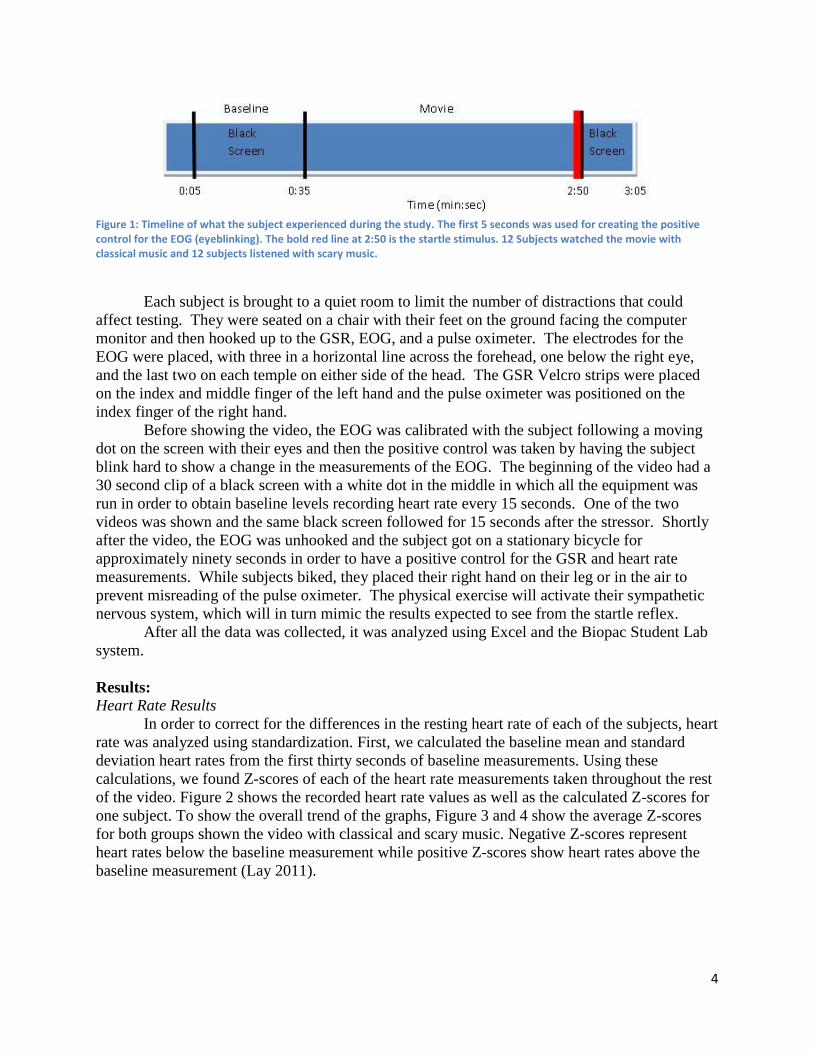
Figure 3. Normalized heart rate over time while viewing the video with classical music. Bold red line is the startle stimulus. Subjects include eleven females and one male age 19-23.
-2.5
-1.5
-0.5
0.5
1.5
2.5
0:00 0:28 0:57 1:26 1:55 2:24 2:52 3:21
Ave
rage
Z-S
core
s
Time (seconds)
Standardized Heart Rate: Classical Music
6
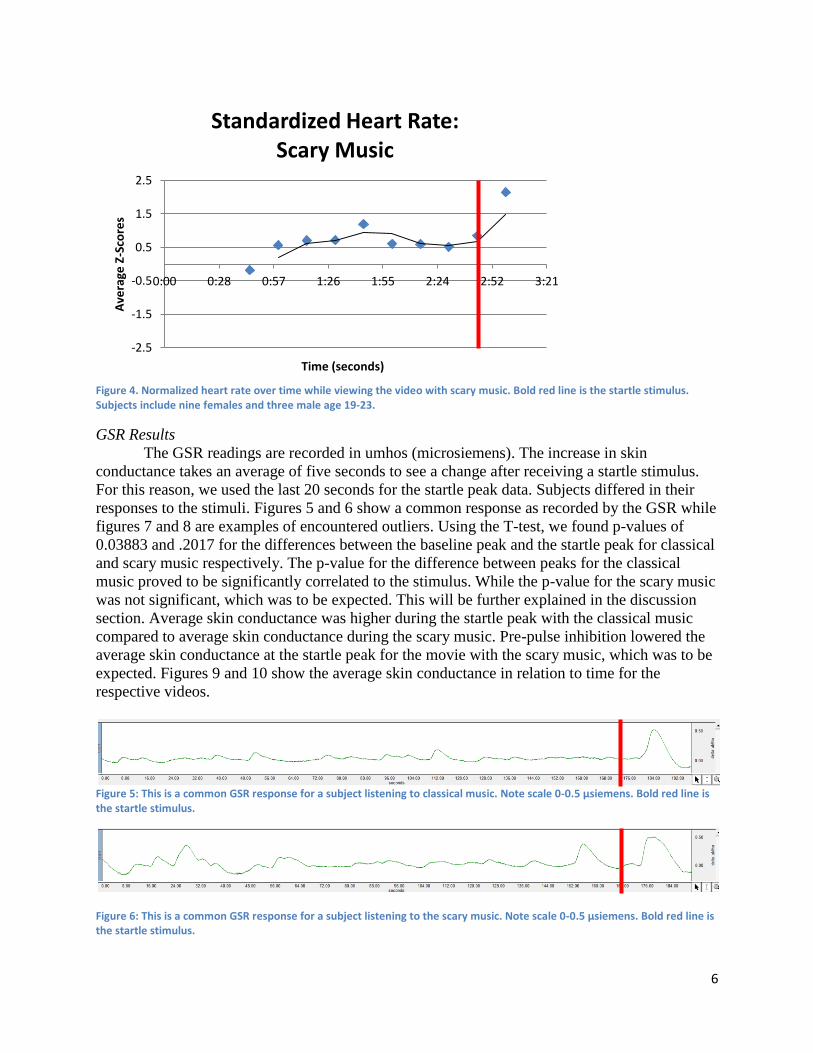
Figure 4. Normalized heart rate over time while viewing the video with scary music. Bold red line is the startle stimulus. Subjects include nine females and three male age 19-23.
GSR Results
The GSR readings are recorded in umhos (microsiemens). The increase in skin
conductance takes an average of five seconds to see a change after receiving a startle stimulus.
For this reason, we used the last 20 seconds for the startle peak data. Subjects differed in their
responses to the stimuli. Figures 5 and 6 show a common response as recorded by the GSR while
figures 7 and 8 are examples of encountered outliers. Using the T-test, we found p-values of
0.03883 and .2017 for the differences between the baseline peak and the startle peak for classical
and scary music respectively. The p-value for the difference between peaks for the classical
music proved to be significantly correlated to the stimulus. While the p-value for the scary music
was not significant, which was to be expected. This will be further explained in the discussion
section. Average skin conductance was higher during the startle peak with the classical music
compared to average skin conductance during the scary music. Pre-pulse inhibition lowered the
average skin conductance at the startle peak for the movie with the scary music, which was to be
expected. Figures 9 and 10 show the average skin conductance in relation to time for the
respective videos.
Figure 5: This is a common GSR response for a subject listening to classical music. Note scale 0-0.5 µsiemens. Bold red line is the startle stimulus.
Figure 6: This is a common GSR response for a subject listening to the scary music. Note scale 0-0.5 µsiemens. Bold red line is the startle stimulus.
-2.5
-1.5
-0.5
0.5
1.5
2.5
0:00 0:28 0:57 1:26 1:55 2:24 2:52 3:21
Ave
rage
Z-S
core
s
Time (seconds)
Standardized Heart Rate: Scary Music

7
Figure 7: This subject had a drastic increase in skin conductance which was an uncommon exaggerated GSR response to the classical music. Note scale 0-5 µsiemens. Bold red line is the startle stimulus.
Figure 8: This is an uncommon GSR response to a subject watching the video with scary music in which the subject seemed to have an increase in skin conductance throughout the video and no increase in response to the stimulus. Note scale 0-0.5 µsiemens. Bold red line is the startle stimulus.
Figure 9. Average peak GSR readings for corresponding sections of the video. The error bars show standard deviation. Subjects include eleven females and one male ages 19-23.
0
0.5
1
1.5
2
2.5
Base line peak PPI peak Startle Peak
Ave
rage
Ski
n C
on
du
ctan
ce
(um
Ho
s)
Classical GSR Readings

8
Figure 10. Average peak GSR readings of corresponding sections of the video. The error bars show standard deviation. Subjects include nine females and three male ages 19-23.
EOG Results
The EOG values are recorded in millivolts. From the baseline levels, if there was a startle
response it either moved in a positive (Figure 11) or negative direction (Figure 12). If the peak
was positive we took the difference between the maximum baseline level and the maximum
startle peak. If the startle showed a negative response then we took the minimum baseline peak
and subtracted it from the minimum startle response. If the baseline level was larger than the
startle response we recorded this as a negative change in our results. We then took an average of
the change in millivolts from baseline to startle. We got a slight difference in the values, but our
ANOVA test gave us a p value of 0.656147 meaning that the data is not statistically significant
and there was more similar variance within the group as there was between the groups. The
figures show the results of both the vertical and horizontal eye movement, but the only data used
was the vertical (bottom graphs).
Figure 11: This is a positive peak example of EOG results. Values are measured in mV on the right hand side. Time is on the x-axis in seconds. Bold red line is the startle stimulus.
0
0.2
0.4
0.6
0.8
1
1.2
Baseline peak PPI peak Startle Peak
Ave
rage
Ski
n C
on
du
ctan
ce
(um
Ho
s)
Scary GSR Readings

9
Figure 12 : This is a negative peak example of EOG results. Values are measured in mV on the right hand side. Time is on the x-axis in seconds. Bold red line is the startle stimulus.
Figure 13: This is an example of the EOG data when the subject was distracted, or moved their head away from the screen. Bold red line is the startle stimulus.
Figure 14: This is an example of EOG data with no startle response observed. Bold red line is the startle stimulus.
Discussion: Analysis of the data gathered from this experiment showed that scary or suspenseful
music can act as a pre-pulse in order to inhibit a startle that follows it. GSR measurements
showed that there is a statistically significant difference between the baseline and the startle peak
for subjects that watched the video with classical music. The classical music gives no warning to
the subject about the startle so there is no pre-pulse. However, the GSR data for subjects that

10
watched the video with scary music showed no statistical difference between the baseline and
startle peak. Those results gave the indication that the music effectively worked as a positive
pre-pulse and warned the subjects about the impending startle. The measurement differences
were small, but significant in showing that scary music can act a pre-pulse, albeit a mild one,
which confirms the hypothesis. Based on the findings of our experiment we can conclude that
horror films do not use scary or suspenseful music as a primer for a startle since that would
decrease the startles effectiveness rather than increase. The music in these films must serve a
different purpose such as to build an atmosphere or to make their audience uncomfortable and
more on edge by increasing the sympathetic response throughout the entire film.
EOG and heart rate data were a lot more inconsistent, neither supporting nor rejecting the
hypothesis. The EOG data was too variable to be reliable and the heart rate did not show a large
enough spike to verify the activation of the sympathetic nervous system. The heart rate could
also be affected by any anxiety the subject felt from being hooked up to all of the unusual
equipment. It could also be influenced by a number of factors unrelated to the experiment such
as caffeine consumption or exercise prior to watching the video.
With the EOG some subjects showed a significant response to the startle, but others
showed no response or a negative response to the startle. This made the average fairly
unrepresentative of the data. In order to be confident with the data, a new way could be devised
to make sure that the subjects could not get distracted; the EOG tracks all eye movement and
would register a response if the subject looked at something other than the computer screen
(Figure 13). This could maybe be accomplished by turning the lights off, or setting the
experimentation room up differently so that the test subject could not see any of the
experimenters, or figure out a way so that there are not experimenters in the room at all. These
changes could help get better data, but they could also be used to see a change in the effect of the
startle response. There are also certain people that do not show as much of a response to startle
stimuli as other people (Figure 14). This could be due to the fact that they watch a lot of scary
movies and are more desensitized to a startle response. Different people will all have a different
response to the same startle. These large variables between our subjects within the groups made
it hard to get significant data change between the groups. A larger sample population can help
account for that. There was also no way of making sure that the volume of the video was exactly
the same from day to day while the experiment was being run, though it was set as closely as
possible by adjusting the dial on the speakers to the same position each day of the experiment.
This could affect the results because a louder stimulus should elicit a larger response.
Several issues with the experiment were identified, but these problems were fixed in the
pre-trial runs before the actual experiment began. In experimentation with the EOG equipment,
exaggerated movements caused the data to go off the screen, making the peak data numbers
difficult to read. This was fixed during pre-trial runs and was no longer a problem under normal
circumstances which gave usable peaks for comparison. The subjects had a tendency to look
somewhere other than the video causing the EOG results to be inaccurate. To make this less of
an issue, a white dot was added to the black screen for the subject to focus on. It was also
apparent that during physical activity the subject would cause inaccuracies in pulse oximeter
readings if their right hand was placed on the handlebars of the bicycle. To correct this, the
subject was asked to remove their right hand from the handlebar and this gave more consistent
data.
We have already mentioned hypothetical adjustments to our experiment that could
improve results and develop more definite conclusions. A larger sample size, less distractions,

11
consistent sound volume, and a darker room are all adjustments that could be made by future
groups to expand on the understanding of sympathetic nervous system’s response to startle.
References:
Braff DL, Geyer MA, & Swerdlow NR (2001). Human studies of prepulse inhibition of startle: normal subjects,
patient groups, and pharmacological studies. Psychoparmacology 156, 234-258.
Blumenthal DT, Davitian R, & Kaye PD (2010). Do film soundtracks contain nonlinear analogues to influence
emotion?. Biology Letters, 1-4.2.
Blumenthal TD, Elden A, & Flaten MA (2003). A comparison of several methods used to quantify prepulse
inhibition of eyeblink responding. Psychophysiology 41, 326-332.
Filion DL, Dawson ME, & Schell AM (1998). The psychological significance of human startle eyeblink
modification: a review. Biological Psychology 47, 1–43.
Khalfa S, Peretz I, Jean-Pierre B, & Manon R (2002). Event-related skin conductance responses to musical
emotions in humans. Neuroscience Letters 328, 145–14.
Lay T, Sanam S, Scholl J, & Kapke J (2011). The Effects of Knowledge of an Imminent Threat on the Human
Sympathetic Nervous System Response. Journal of Advanced Student Science (JASS). Spring 01.
McMullen, William, and J.C. Uyehara. "Galvanic Skin Response & The Polygraph, Electrooculogram (EOG) I."
Biopac Student Lab. By Richard Pflanzer. Vol. 3.0.4. Santa Barbara: BIOPAC Systems. Print.
Mind. Dir. Christopher Gilson. YouTube. Zombie Dolphin Films, 10 Feb. 2010. Web. 5 Feb. 2012.
<http://www.youtube.com/watch?v=eP2qRdae6eg>.
Nater UM, Abbruzzese E, Krebs M, & Ehlert U (2006). Sex differences in emotional and psychophysiological
responses to musical stimuli. Int. J. Psychophysiology 62, 300–308.
Roy M, Mailhot JP, Gosselin N, Paquette S, & Peretz I (2009). Modulation of the startle reflex by pleasant and
unpleasant music. Int. J. Psychophysiology 71, 37–42.
Sammler D, Grigutsch M, Fritz T, & Koelsch S (2007). Music and emotion: electro-physiological correlates of the
processing of pleasant and unpleasant music. Psychophysiology 44, 293–304.
Seeley, Stephens, & Tate. Anatomy and Physiology: Sixth Edition, The McGraw-Hill Companies, 2004; 16:3
Autonomic Nervous System – Integration and Control Systems.
Yeomans JS, LI L, Scott BW , & Frankland PW (2002). Tactile, Acoustic and Vestibular Systems Sum to Elicit the
Startle Reflex. Neuroscience and Behavioral Reviews. 26, 3.

12
Appendix A- Consent Form
Physiology 435: Group 3 – Consent of Participation
I, _______________________________, have voluntarily agreed to participate in this research
experiment performed by Hanna Lynch, Parth Patel, Stanislav Konrath, and Devin Blodgett for
Physiology 435. I recognize that the program may involve physical activity and other various mental activities, such as watching a video. I hereby affirm that I am in
good physical condition and do not suffer from any known disability or condition which would prevent or limit my participation in this research experiment program. I acknowledge that my enrollment and subsequent participation is purely voluntary
and in no way mandated by those listed above or the Department of Physiology.
Any data analyzed or reported will be done so anonymously. I also acknowledge any subsequent
participation in this experiment has been waived through my signature below.
In consideration of my participation in this program, I, ___________________, hereby release the Department of Physiology and Physiology 435: Group 3 and its agents from any claims, demands, and causes of action as a result of my voluntary participation. I
excuse any liability now or in the future for conditions that I may obtain.
I fully understand that I may injure myself as a result of my enrollment and I HEREBY AFFIRM THAT I HAVE READ AND FULLY UNDERSTAND THE ABOVE STATEMENTS.
_____________________________________(Participant Signature & Date)


