1
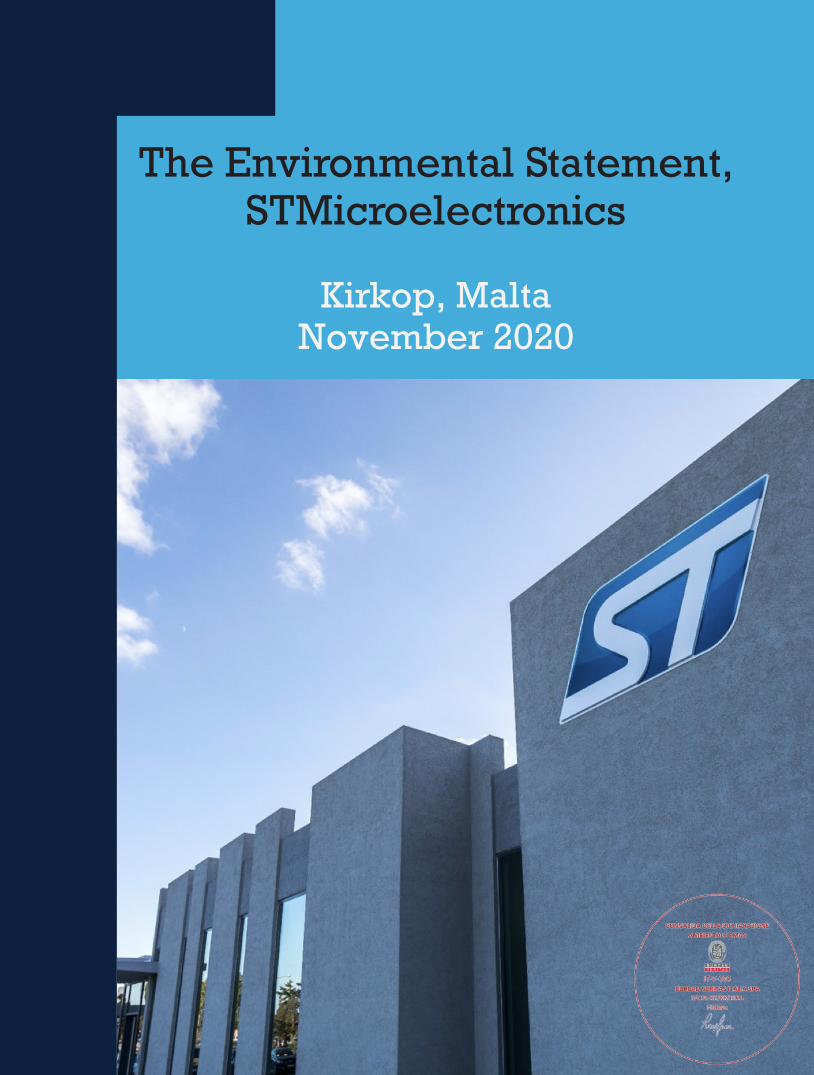
The Environmental Statement, STMicroelectronics
Kirkop, MaltaNovember 2020
32
Content14
14
17
19
20
21
22
25
26
28
30
32
34
35
42
43
49
1. Use of Natural Resources ...................................
a) Energy ..............................................................
b) Water ................................................................
2. Chemical Use ....................................................
a) Acids .................................................................
b) Organic Solvents ..............................................
c) Consumption of Process Material ......................
d) Use of Refrigerants ...........................................
3. Land Use & Biodiversity .....................................
4. Wastewater Effluent ..........................................
5. Air Emissions ....................................................
a) Greenhouse Gas Emissions ...............................
6. Noise Emissions ................................................
7. Waste Production ..............................................
8. Storage and Handling of Potentially Harmful
Liquids and other Emergency Situations ...............
9. Indirect Effects ..................................................
10. Eco Footprint ...................................................
Objectives, Targets & Results ................................
ABOUT THE EMAS ENVIRONMENTAL STATEMENT
STMicroelectronics Malta forms part of the corporate STMicroelectronics Group. STMicroelectronics Malta has been certified against the Eco-Management and Audit Scheme (EMAS) since 1995. The information presented in this statement fulfils the requirements of EMAS as per regulation EC/1505/2017. This statement is a summary of the STMicroelectronics Malta’s environmental policy, objectives, activities, impacts, performance and environmental management system. This edition of the environmental statement covers the reporting period of July 2019 to June 2020.
In accordance with the site’s EMAS registration, this is the renewal statement. The next validated statement will be available by December 2020. This statement was prepared by Ivana Cattafi. The statement was approved by Laurent Filippozzi General Manager. The cover photo, taken by Jonathan Ferrito shows the company entrance.
Scope statement: The environment management system of STMicroelectronics Malta, as per requirements of the ISO 14001:2015 standard, applies to the assembly, testing and finishing activities of semiconductor devices, and to the supporting manufacturing and non-manufacturing activities and services within the boundaries of KK0, KK1, KK2, KK3, parking areas and electricity distribution centre of STMicroelectronics (Malta), Kirkop site.
We value your feedback and encourage contributions and debate from all stakeholders.
You can email us at [email protected], or write to us at STMicroelectronics (Malta) Ltd., Industry Road, Kirkop
KKP 9042 or phone us on: (+356) 2368 5731.
The statement is validated by:
BUREAU VERITAS ITALIA SPA Viale Monza, 347Milano 20126ItalyVerifier no: IT-V-0006
The EMAS registration number for STMicroelectronics Malta is MT-00001.
54
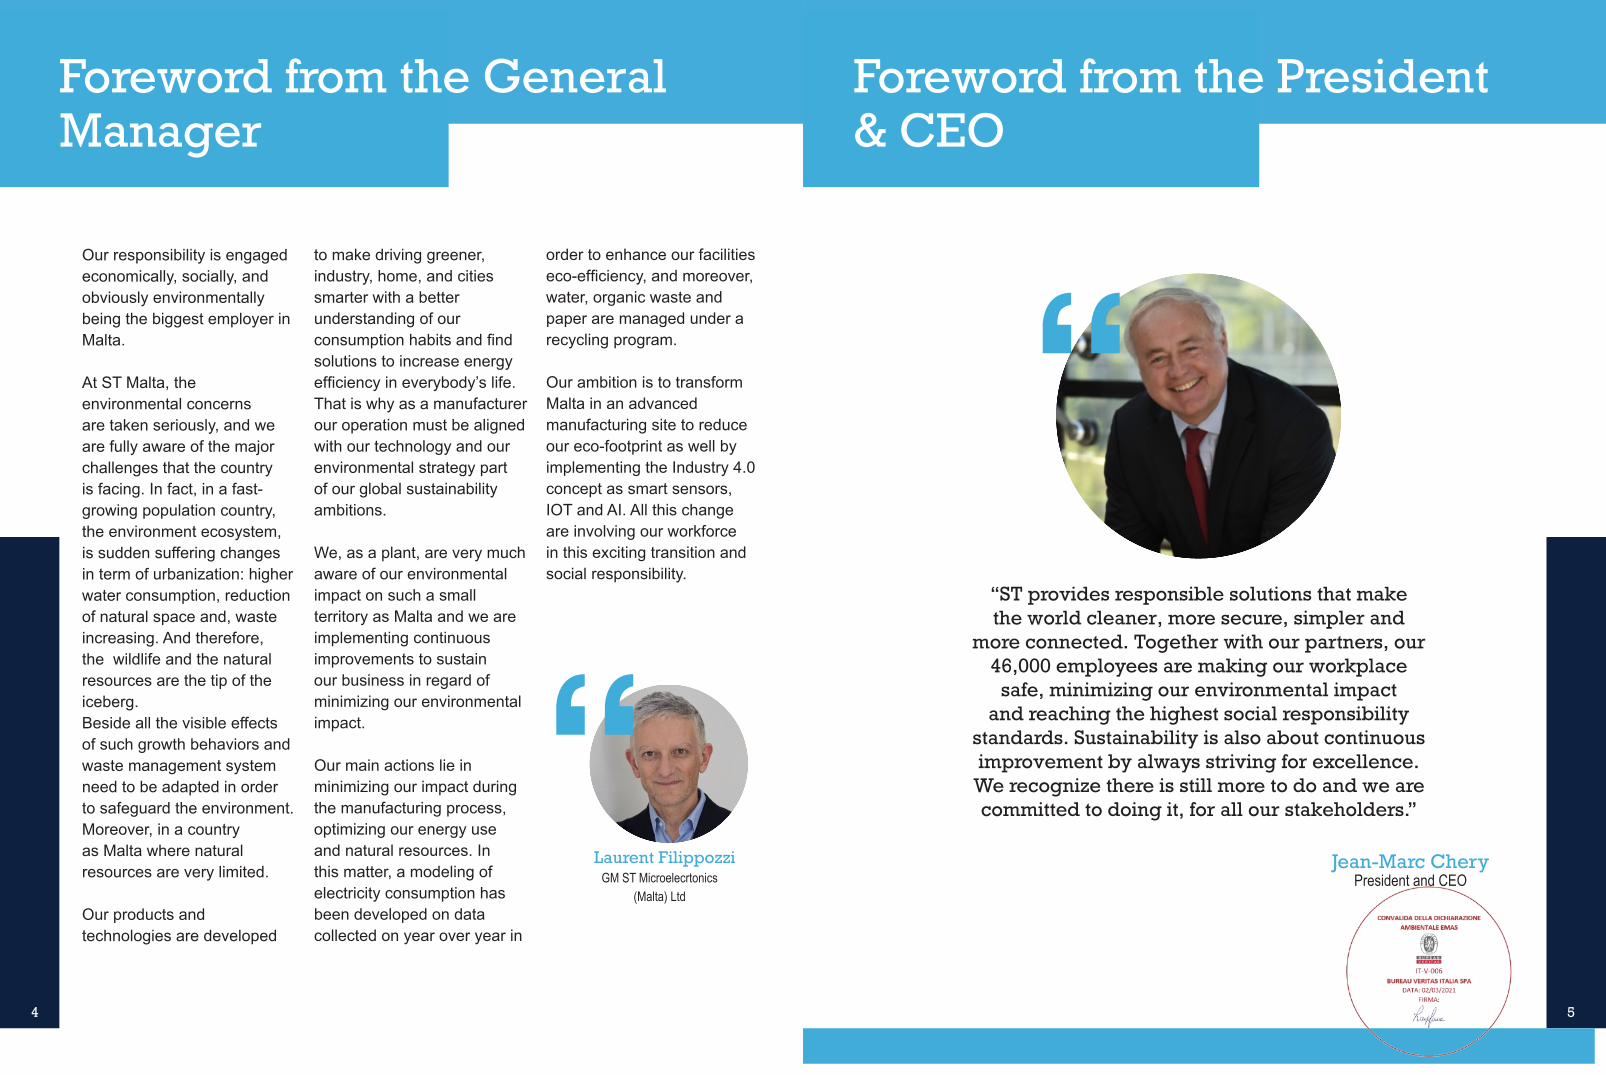
Foreword from the General Manager
Laurent FilippozziGM ST Microelecrtonics
(Malta) Ltd
Our responsibility is engaged economically, socially, and obviously environmentally being the biggest employer in Malta. At ST Malta, the environmental concerns are taken seriously, and we are fully aware of the major challenges that the country is facing. In fact, in a fast-growing population country, the environment ecosystem, is sudden suffering changes in term of urbanization: higher water consumption, reduction of natural space and, waste increasing. And therefore, the wildlife and the natural resources are the tip of the iceberg.Beside all the visible effects of such growth behaviors and waste management system need to be adapted in order to safeguard the environment. Moreover, in a country as Malta where natural resources are very limited. Our products and technologies are developed
to make driving greener, industry, home, and cities smarter with a better understanding of our consumption habits and find solutions to increase energy efficiency in everybody’s life. That is why as a manufacturer our operation must be aligned with our technology and our environmental strategy part of our global sustainability ambitions.
We, as a plant, are very much aware of our environmental impact on such a small territory as Malta and we are implementing continuous improvements to sustain our business in regard of minimizing our environmental impact. Our main actions lie in minimizing our impact during the manufacturing process, optimizing our energy use and natural resources. In this matter, a modeling of electricity consumption has been developed on data collected on year over year in
order to enhance our facilities eco-efficiency, and moreover, water, organic waste and paper are managed under a recycling program.
Our ambition is to transform Malta in an advanced manufacturing site to reduce our eco-footprint as well by implementing the Industry 4.0 concept as smart sensors, IOT and AI. All this change are involving our workforce in this exciting transition and social responsibility.
“
Foreword from the President & CEO
Jean-Marc CheryPresident and CEO
“ST provides responsible solutions that make the world cleaner, more secure, simpler and
more connected. Together with our partners, our 46,000 employees are making our workplace
safe, minimizing our environmental impact and reaching the highest social responsibility
standards. Sustainability is also about continuous improvement by always striving for excellence.
We recognize there is still more to do and we are committed to doing it, for all our stakeholders.”
“
76
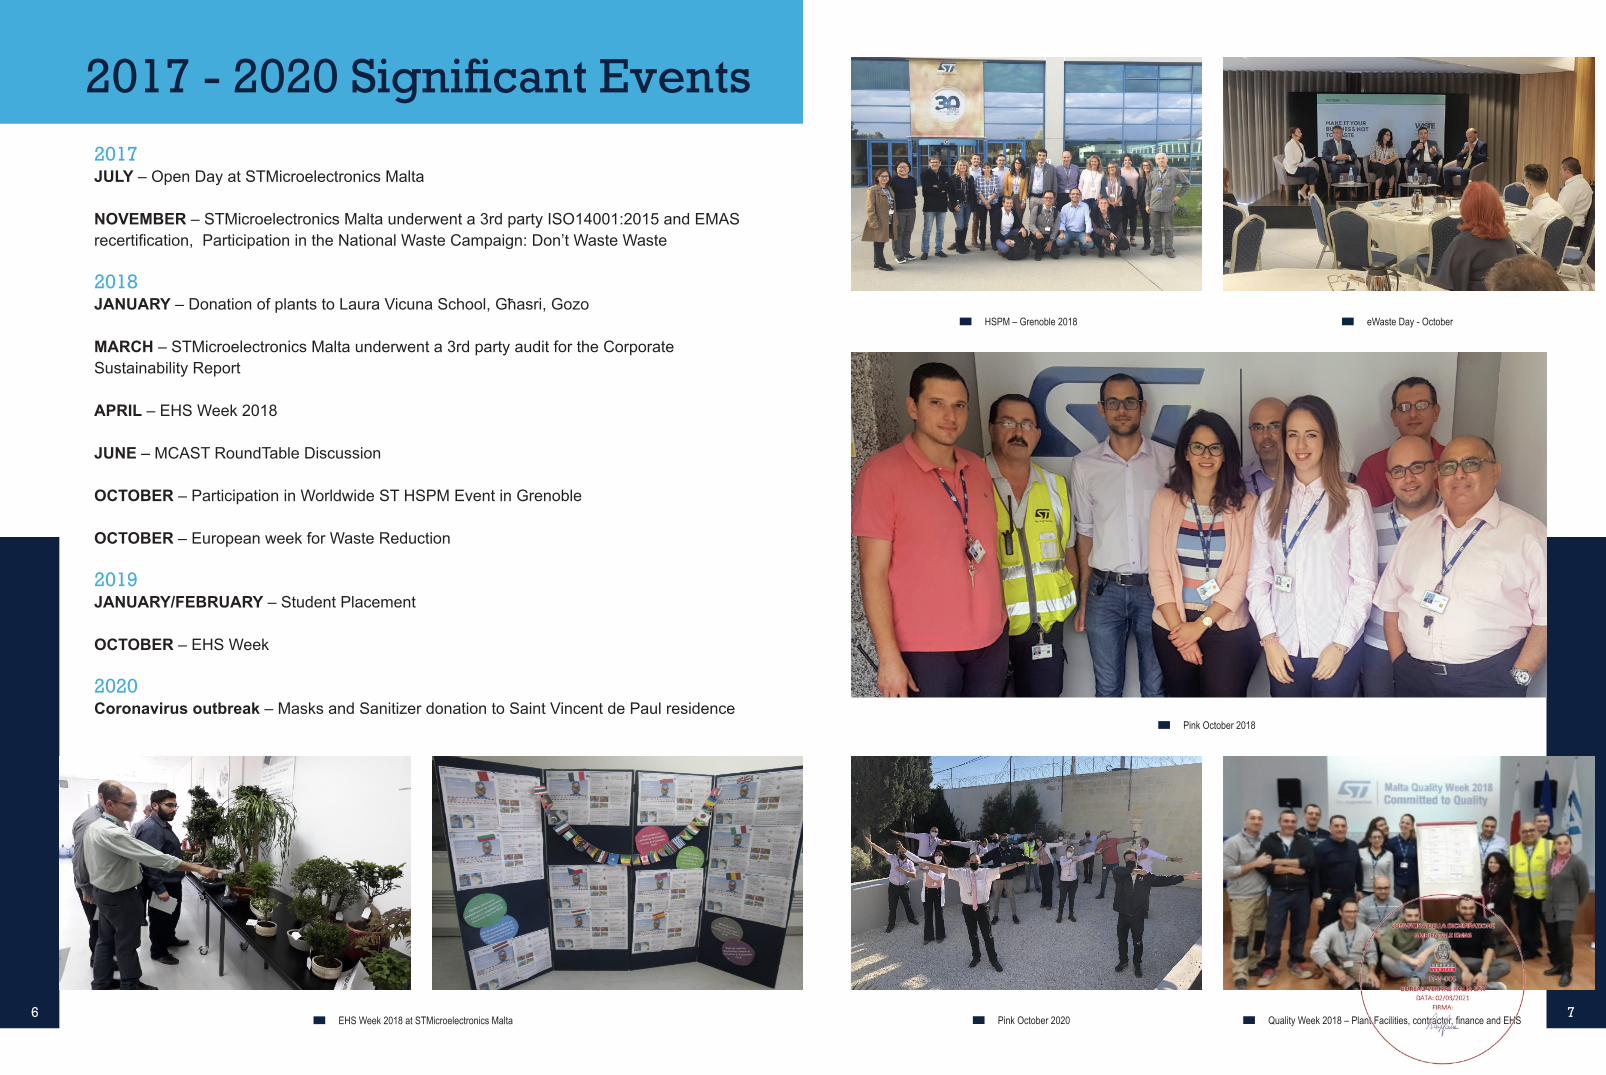
2017 - 2020 Significant Events2017JULY – Open Day at STMicroelectronics Malta
NOVEMBER – STMicroelectronics Malta underwent a 3rd party ISO14001:2015 and EMAS recertification, Participation in the National Waste Campaign: Don’t Waste Waste
2018JANUARY – Donation of plants to Laura Vicuna School, Għasri, Gozo
MARCH – STMicroelectronics Malta underwent a 3rd party audit for the Corporate Sustainability Report
APRIL – EHS Week 2018
JUNE – MCAST RoundTable Discussion
OCTOBER – Participation in Worldwide ST HSPM Event in Grenoble
OCTOBER – European week for Waste Reduction
2019JANUARY/FEBRUARY – Student Placement
OCTOBER – EHS Week
2020Coronavirus outbreak – Masks and Sanitizer donation to Saint Vincent de Paul residence
HSPM – Grenoble 2018 eWaste Day - October
Pink October 2018
EHS Week 2018 at STMicroelectronics Malta Pink October 2020 Quality Week 2018 – Plant Facilities, contractor, finance and EHS
98
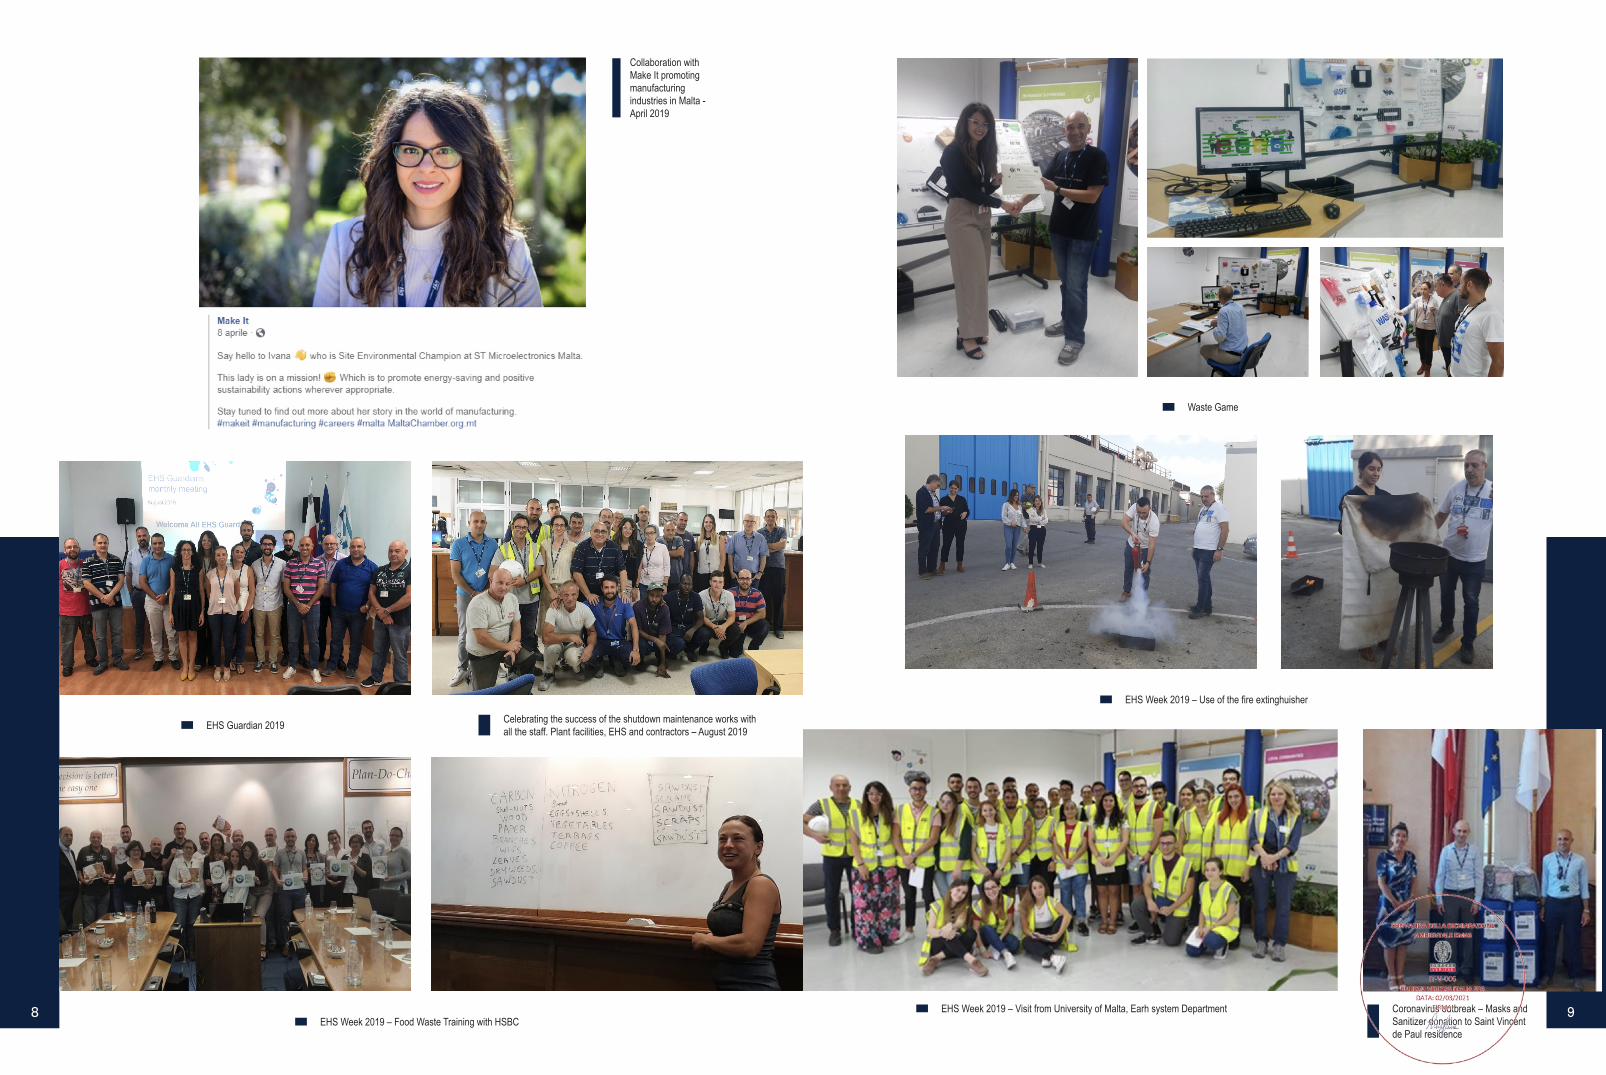
Collaboration with Make It promoting manufacturing industries in Malta - April 2019
EHS Guardian 2019
EHS Week 2019 – Food Waste Training with HSBCEHS Week 2019 – Visit from University of Malta, Earh system Department Coronavirus outbreak – Masks and
Sanitizer donation to Saint Vincent de Paul residence
Celebrating the success of the shutdown maintenance works with all the staff. Plant facilities, EHS and contractors – August 2019
Waste Game
EHS Week 2019 – Use of the fire extinghuisher
1110
Activities, Products & Services
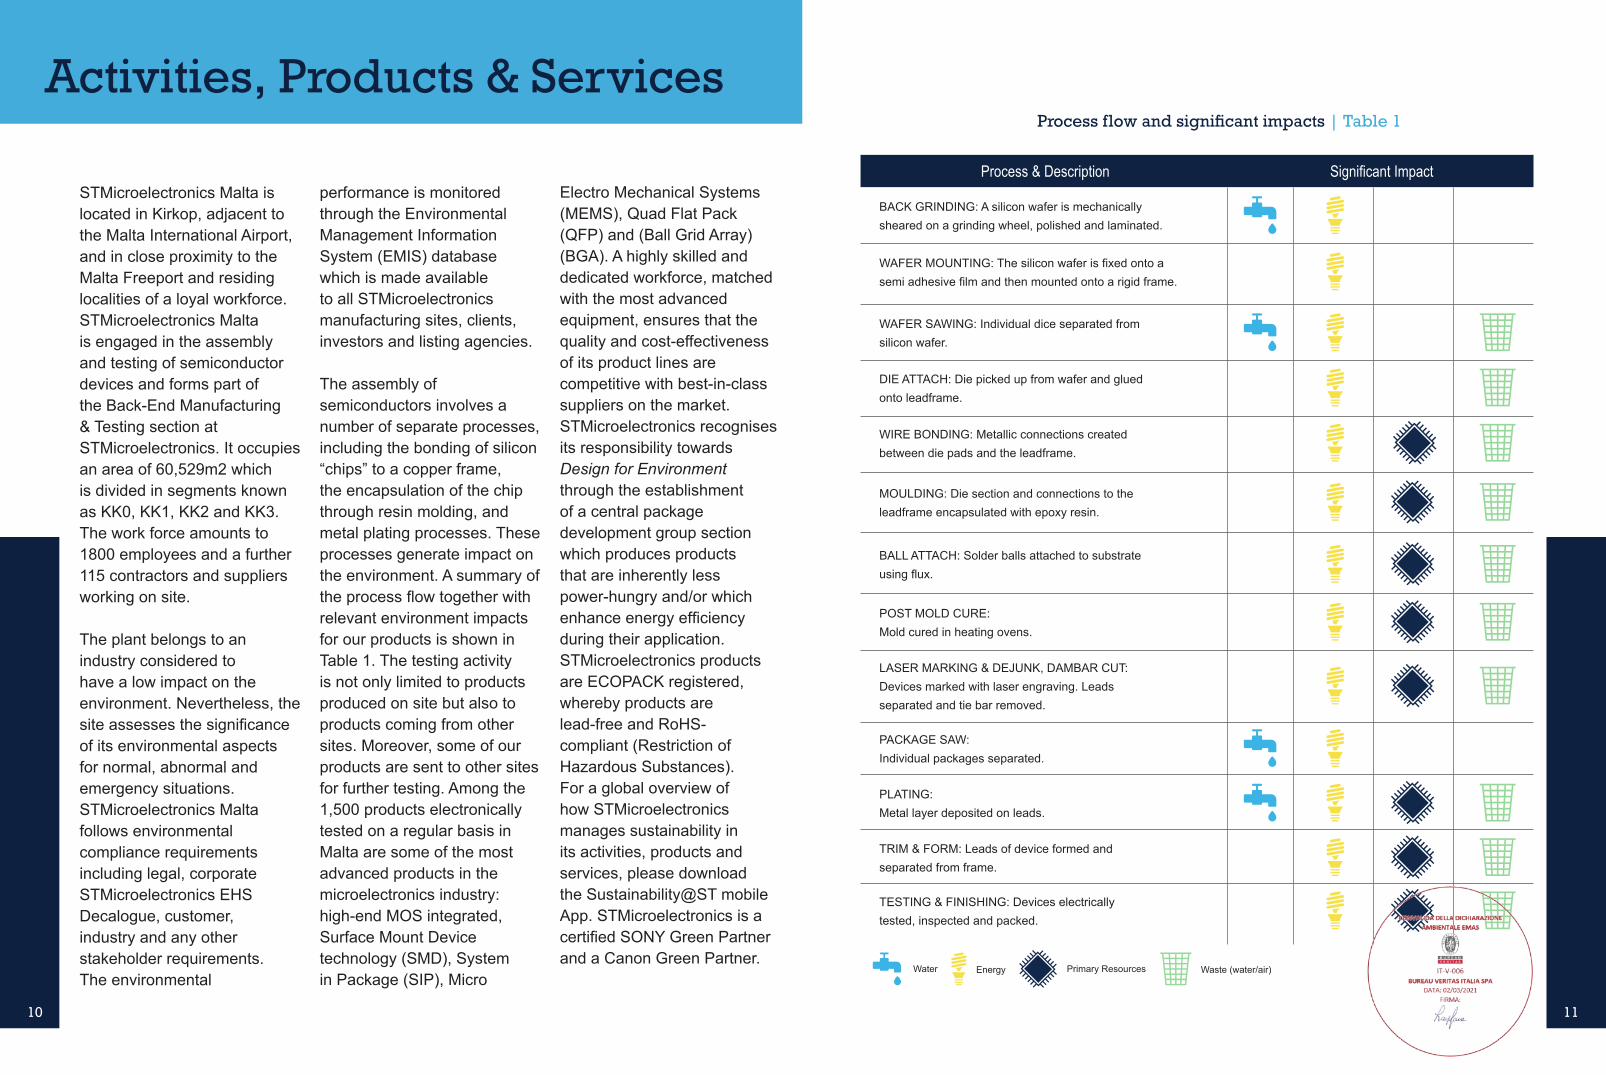
STMicroelectronics Malta is located in Kirkop, adjacent to the Malta International Airport, and in close proximity to the Malta Freeport and residing localities of a loyal workforce. STMicroelectronics Malta is engaged in the assembly and testing of semiconductor devices and forms part of the Back-End Manufacturing & Testing section at STMicroelectronics. It occupies an area of 60,529m2 which is divided in segments known as KK0, KK1, KK2 and KK3. The work force amounts to 1800 employees and a further 115 contractors and suppliers working on site.
The plant belongs to an industry considered to have a low impact on the environment. Nevertheless, the site assesses the significance of its environmental aspects for normal, abnormal and emergency situations. STMicroelectronics Malta follows environmental compliance requirements including legal, corporate STMicroelectronics EHS Decalogue, customer, industry and any other stakeholder requirements. The environmental
performance is monitored through the Environmental Management Information System (EMIS) database which is made available to all STMicroelectronics manufacturing sites, clients, investors and listing agencies.
The assembly of semiconductors involves a number of separate processes, including the bonding of silicon “chips” to a copper frame, the encapsulation of the chip through resin molding, and metal plating processes. These processes generate impact on the environment. A summary of the process flow together with relevant environment impacts for our products is shown in Table 1. The testing activity is not only limited to products produced on site but also to products coming from other sites. Moreover, some of our products are sent to other sites for further testing. Among the 1,500 products electronically tested on a regular basis in Malta are some of the most advanced products in the microelectronics industry: high-end MOS integrated, Surface Mount Device technology (SMD), System in Package (SIP), Micro
Electro Mechanical Systems (MEMS), Quad Flat Pack (QFP) and (Ball Grid Array) (BGA). A highly skilled and dedicated workforce, matched with the most advanced equipment, ensures that the quality and cost-effectiveness of its product lines are competitive with best-in-class suppliers on the market. STMicroelectronics recognises its responsibility towards Design for Environment through the establishment of a central package development group section which produces products that are inherently less power-hungry and/or which enhance energy efficiency during their application. STMicroelectronics products are ECOPACK registered, whereby products are lead-free and RoHS-compliant (Restriction of Hazardous Substances). For a global overview of how STMicroelectronics manages sustainability in its activities, products and services, please download the Sustainability@ST mobile App. STMicroelectronics is a certified SONY Green Partner and a Canon Green Partner.
Process & Description Significant Impact
BACK GRINDING: A silicon wafer is mechanically sheared on a grinding wheel, polished and laminated.
WAFER MOUNTING: The silicon wafer is fixed onto a semi adhesive film and then mounted onto a rigid frame.
WAFER SAWING: Individual dice separated from silicon wafer.
DIE ATTACH: Die picked up from wafer and glued onto leadframe.
WIRE BONDING: Metallic connections created between die pads and the leadframe.
MOULDING: Die section and connections to the leadframe encapsulated with epoxy resin.
BALL ATTACH: Solder balls attached to substrate using flux.
POST MOLD CURE:Mold cured in heating ovens.
Process flow and significant impacts | Table 1
LASER MARKING & DEJUNK, DAMBAR CUT: Devices marked with laser engraving. Leads separated and tie bar removed.
PACKAGE SAW:Individual packages separated.
PLATING:Metal layer deposited on leads.
TRIM & FORM: Leads of device formed and separated from frame.
TESTING & FINISHING: Devices electrically tested, inspected and packed.
Water Energy Primary Resources Waste (water/air)

1312
Environmental CoordinatorIvana CATTAFI
Chair PersonLaurent FILIPOZZI
Healthy & Safety CoordinatorJonathan FERRITO
H&S TechniciansEHS Guardians
Plant FacilitiesLouis MONTEBELLO (PF Manager)
Giancarlo NIGRO (Water)
QualityJeremy MICALLEF
MaintenanceRaymond SPITERI
Assy ManufacturingJean Paul ATTARD
EHSJonathan FERRITO
Ivana CATTAFI
WarehousingRichies MICALLEF
LogisticsDaniela CAMILLERI
New Product IntroductionIvan ELLUL
Test & FinishingAntonio CORRENTE
PurchasingPAUL MIFSUD
Human ResourcesJonathan FERRITO
Admin & FinancePhilip ZAMMIT
Information TechnologyGeoffrey FALZON
Supply ChainRoberto GENNACCARI
SecurityLawrence CARUANA
EHS Steering Committee
In order to review the status of the environment management system, the site has an integrated Environment, Health and Safety Steering Committee, made up of members from facilities, production, human resources, production support and contracted professionals. This committee meets throughout the year in order to review and update various items including the site environment performance and status of compliance to environmental requirements.
ENVIRONMENT, HEALTH & SAFETY STEERING COMMITTEE
STMicroelectronics Malta commissioned its first environmental impact assessment in 1994 to identify, control and reduce its impact on the environment. Within a few years we were certified to EMAS in 1995 and to ISO14001 in 1997 and to date we have more than 20 years’ experience in managing environment systems. The site has identified its significant environmental impacts using its own methodology, which can be made available to the public on request. The most important environmental issues are its use of energy, water, raw materials and chemicals, and its air, water and waste emissions.In order to improve the environmental impact analysis, ST Malta has introduced a new aspect and impact assessment tool to the environmental management system in 2020.With respect to water consumption, STMicroelectronics Malta has installed a water microfiltration plant for the recycling and purification of industrial wastewaters. A second microfiltration
plant was installed for further recycling of water from wafer and package cutting processes; together with a second radiator that reduces the use of cooling tower water that is usually lost by evaporation during the cooling process; and a third radiator to mitigate the heat generated by the compressors without the use of cooling towers which consume water to operate. The major contributors to water recycling were the recycling of wastewater from dicing saw machines, the installation of a plating water recycling plant and the utilisation of the site’s rainwater reservoir. In 2015, a third microfiltration plant was installed. These initiatives are highly beneficial for the Maltese Islands where the production of water is based mainly on reverse osmosis processes of seawater utilizing energy at a very high cost. The site has installed a number of pollution abatement systems – a wastewater treatment plant against heavy metal discharge, air scrubbers against discharge of
solvents, acids and organic substances; a spray booth against discharge of volatile organic solvents; a grease trap against discharge of fats and grease in sewage; oil/solids interceptors against discharge of oils to surface run off; and noise mufflers where possible against noise emissions.
The environmental
concern is in everyone’s
mind and at ST Malta
we are committed to
improve our activity in
regards to our impact.
Keep our Environmental
Management System
in line with ISO
14001:2015 and EMAS
standards helps us
out in our continuous
improvement process.”
Environmental Impacts
Ivana CattafiSite Environmental, BCMS
and HSPM Champion
“
1514
Data
Simon GrechTest & Automation Senior Engineer
““Data collection is a
process whereby data
is acquired, stored,
analysed and valuable
information is extracted.
Today - a must have
in the Manufacturing
Industry. Building
the structure is time
consuming, so it was
important to strive to
automate procedures
as much as possible.
Automation via coding
is the smart way forward
to make data collection
more efficient, useful,
minimizing human error
at the same time. Such
software development is
a passion for me, hence
am delighted to offer my
support and contribution
in this regard.”
The production of semiconductors involves the use of materials and equipment which consume energy, water, industrial gases and chemical products. In the coming sections, data are presented which illustrates the local consumption of materials, emission releases and wastes generated. The consumption data is typically acquired from software tools e.g. SAP and the STMicroelectronics Waste Management System. Subsequently, the data collected is manipulated in a tool developed internally, stored in a local database and then uploaded to Enablon - the corporate tool for collecting data in each plant. The performance of the site relating to these aspects is demonstrated in absolute figures and where possible, the performance has been related to the product output (assembly and testing). Data is standardised against million pins (Mpins, i.e. number of wire
or ball connections) for energy and gases, and against million units (Munits, i.e number of devices) for carbon dioxide emissions, water, waste and chemicals. Each parameter is compared with the site’s objectives and targets, corporate standards and national limits (when available). Details on objectives and actions are found in the section ‘Environmental Program ’.Table 2 shows the product output in terms of Munits and Mpins. The yearly differences are attributed to change in product mix which is made up of slightly fewer but more complex products having fewer pins. The production of this product mix involves a higher number of process steps. Essentially the level of activity has remained constant throughout the years, and although the dip in production registered in 2016 it picked up again and remained constant in 2020.
Unit ofMeasurement
2014H1
Product output | Table 2
2014H2
2015H1
2015H2
2016H1
2016H2
2017H1
2017H2
2018H1
2018H2
2019H1
2019H2
2020H1
Munits Average 464 501 572 433 371 421 482 465 457 455 409 380 394
Mpins equivalent Average
23108 23971 19934 21141 18602 18285 16785 15831 15916 16033 15230 14327 15964
A system of chilled water for Heating, Ventilation and Air Conditioning (HVAC systems). Photo taken by Matthew Bonnici.
STMalta is working
towards increasing its
efficiency in Energy
Consumption by
the use of modern
methodologies in
both transmission and
metering. 2020 was
the year of launch of
major projects in this
aspect, including the
change of oil-cooled
transformers into resin
dry transformers and
upgrading of electrical
metering on sub
stations. This year we
are also investing in
projects such as after
coolers that will reduce
energy consumption
(latent heat reduction).
We are also preparing
ourselves for another
strong year of projects
where we will upgrade
our facilities with smart
monitoring (FMCS)
and intelligent energy
controls to support the
reduction of energy
usage and consequently
our carbon footprint.
Energy Natural Resources1aAlmost all energy consumed by the site is in the form of electricity. The energy source for the electricity which is supplied by Enemalta Plc from Delimara Power Station complex is a mix of several grid-connected renewable
Louis MontebelloPlant Facilities Director
“energy sources as well as the 200MW Malta-Italy Interconnector. The rest is due to the consumption of diesel by generators. All the heating required by facilities is now being obtained solely by heat recovery from the compressor’s cooling system. The electricity demand is mostly allocated to supply of services and manufacturing, as shown in Chart 1. Chart 2 illustrates the electrical energy consumption in absolute and normalised values (in Wh/pin). Even though the Wh/pin value is still high, the consumption of electricity in MWh is as a result of investments on reduction of electricity consumption.

1716
Lighting & Small Power 3%
Manufacturing 40%
Water Production 1%
Services 56%
Electricity demand allocation | Chart 1
Total electricity consumption | Chart 2
100000
80000
60000
40000
20000
0
5.00
4.00
3.00
2.00
1.00
0
Wh/p
in
MWh
2015H1
2015H2
2016H1
2016H2
2017H1
2017H2
2018H1
2018H2
2019H1
2019H2
2020H1
45195 51206 46842 46066 40938 45247 40790 45252 41545 43231 36731
2.29 2.42 2.54 2.54 2.44 2.86 2.58 2.83 2.73 3.02 2.30
1.99 1.99 1.99 1.99 2.30 2.30 2.50 2.50 2.60 2.60 2.71
MWh
Wh/pin
STMalta Target Wh/pin
Giancarlo NigroDIW and WW Treatment Plant Manager, MALTA
Raw Water is supplied to the ST Malta plant by Water Service Corporation which upgraded it from the sea. Raw Water is mostly used in our FE production lines for die preparation/sawing and in BE lines for plating and package preparation/sawing. Part of the water is used in facilities as make-up for cooling towers and air handling units, part for sanitary water (WC flushing comes from RO reject streams), and part for canteen and irrigation. Chart 3 illustrates the absolute and normalized water consumption values whilst Chart 4 illustrates the water recycling values. Due to the addition of a different surfactant since 2013 the recycling rate has dropped. Currently we are investigating and testing two processes to recycle wafer sawing and plating water with the purpose to rise the recycling ratio over 60%. Most of the BE and part of FE water is already recycled. Malta Plant future target is to fully reuse the water coming from process and domestic drains, thus some solutions are already under evaluation and their projects will start by 2021.
“At ST Malta HSE is our priority, thus we want to
move to safe fully automized plants, characterized
by high efficiencies and low chemical use,
capable to increase our water recycling at the top
of the available technologies. We are currently
working on different projects aimed at reusing all
the wastewater streams we generate. In the near
future our job will lead to a smaller environmental
footprint at a higher production.
Reverse Osmosis water plant in KK2 and automatic TOC sampling point. Photos taken by Ivana Cattafi.
Waterb

1918
Total fresh water consumption | Chart 3
120000
100000
80000
60000
40000
20000
0
300
250
200
150
100
50
0
m3/M
Units
m3
Water recycling and fresh water consumption | Chart 4
120000
100000
80000
60000
40000
20000
0 2015H1
90.0
75.0
60.0
45.0
30.0
15.0
0.0
%m3
2015H2
2016H1
2016H2
2017H1
2017H2
2018H1
2018H2
2019H1
2019H2
2020H1
72329 62276 88277 88878 94495 83247 87763 96190 96937 88920 87660
56.3 60.1 40.1 41.6 40.9 41.5 43.4 36.5 39.2 45.2 44.5
80 80 80 80 45 45 43 43 45 45 44.5
m3
% recycled
% target recycled
2015H1
2015H2
2016H1
2016H2
2017H1
2017H2
2018H1
2018H2
2019H1
2019H2
2020H1
72329 62276 88277 88878 94495 83247 87763 96190 96937 88920 87660
126.75 144.11 253.66 216.43 196.67 178.99 192.59 211.97 235.94 234.0 222.5
150 150 150 150 220 220 180 180 180 180 185
m3
m3/Munits
STMalta Target m3/Munits
Chemical Use2The site uses a number of chemicals in the assembly, testing and facility processes, housekeeping, laboratories and workshops. In the assembly process, the plating line consumes a substantial amount of acids and solder. Other commonly used chemicals on site include mineral acids and bases, fluxes, solvents and gases. Chart 5 shows the total chemical consumption per year per Munit produced. The chemical consumption has remained stable over the years, however it is increasing
in 2018 due to an increase in the use of acids and solvents for analysis and cleaning procedures. With regards to consumption of other raw materials, in recent years STMicroelectronics Malta has shifted in favour of copper wire bonding over gold wire bonding. The consumption of the previous years (2015-2019) has been split in two (H1-H2) to improve the visual comparison with the data of the current year. In 2020 was reported an increase in chemical consumption, the cause is on ongoing study.
Chemical consumption | Chart 5
60000
40000
20000
0
150
100
50
0
Kga/M
Units
Kgs
2015H1
2015H2
2016H1
2016H2
2017H1
2017H2
2018H1
2018H2
2019H1
2019H2
2020H1
35332 35332 32586 32586 33079 33079 34951 40351 36029 41428 53730
60 83 84 73 66 73 76 89 88 109 136
Kgs
Kgs/Munits
2120
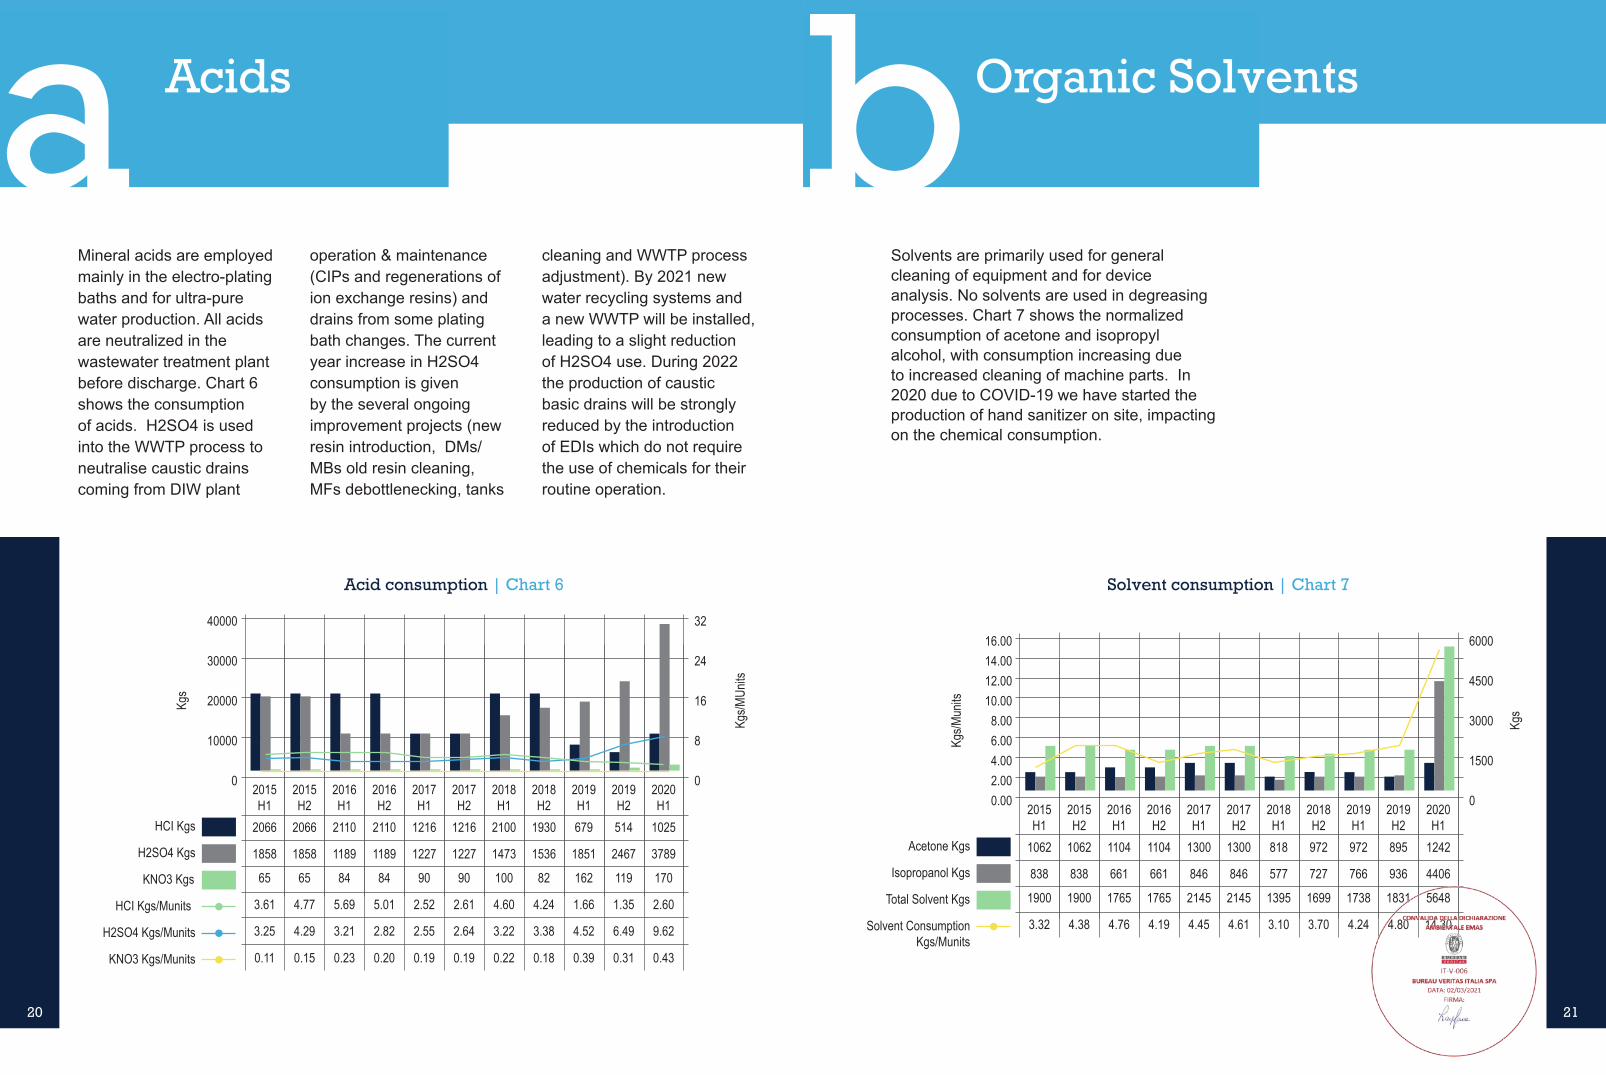
Acid consumption | Chart 6
40000
30000
20000
10000
0 2015H1
32
24
16
8
0
Kgs/M
Units
Kgs
2015H2
2016H1
2016H2
2017H1
2017H2
2018H1
2018H2
2019H1
2019H2
2020H1
2066 2066 2110 2110 1216 1216 2100 1930 679 514 1025
1858 1858 1189 1189 1227 1227 1473 1536 1851 2467 3789
65 65 84 84 90 90 100 82 162 119 170
H2SO4 Kgs
KNO3 Kgs
HCI Kgs/Munits
HCI Kgs
3.61 4.77 5.69 5.01 2.52 2.61 4.60 4.24 1.66 1.35 2.60
H2SO4 Kgs/Munits
KNO3 Kgs/Munits 0.11 0.15 0.23 0.20 0.19 0.19 0.22 0.18 0.39 0.31 0.43
3.25 4.29 3.21 2.82 2.55 2.64 3.22 3.38 4.52 6.49 9.62
AcidsaMineral acids are employed mainly in the electro-plating baths and for ultra-pure water production. All acids are neutralized in the wastewater treatment plant before discharge. Chart 6 shows the consumption of acids. H2SO4 is used into the WWTP process to neutralise caustic drains coming from DIW plant
operation & maintenance (CIPs and regenerations of ion exchange resins) and drains from some plating bath changes. The current year increase in H2SO4 consumption is given by the several ongoing improvement projects (new resin introduction, DMs/MBs old resin cleaning, MFs debottlenecking, tanks
cleaning and WWTP process adjustment). By 2021 new water recycling systems and a new WWTP will be installed, leading to a slight reduction of H2SO4 use. During 2022 the production of caustic basic drains will be strongly reduced by the introduction of EDIs which do not require the use of chemicals for their routine operation.
Organic SolventsbSolvents are primarily used for general cleaning of equipment and for device analysis. No solvents are used in degreasing processes. Chart 7 shows the normalized consumption of acetone and isopropyl alcohol, with consumption increasing due to increased cleaning of machine parts. In 2020 due to COVID-19 we have started the production of hand sanitizer on site, impacting on the chemical consumption.
Solvent consumption | Chart 7
16.0014.0012.0010.008.006.004.002.000.00 2015
H1
6000
4500
3000
1500
0
Kgs
Kgs/M
units
2015H2
2016H1
2016H2
2017H1
2017H2
2018H1
2018H2
2019H1
2019H2
2020H1
1062 1062 1104 1104 1300 1300 818 972 972 895 1242
838 838 661 661 846 846 577 727 766 936 4406
1900 1900 1765 1765 2145 2145 1395 1699 1738 1831 5648
Isopropanol Kgs
Total Solvent Kgs
Solvent ConsumptionKgs/Munits
Acetone Kgs
3.32 4.38 4.76 4.19 4.45 4.61 3.10 3.70 4.24 4.80 14.30

2322
Consumption of Process Materialc
The materials used in greatest quantities in the assembly and testing of the devices include nitrogen and hydrogen.
NITROGEN
Nitrogen is abundantly present in the earth’s atmosphere and is non-toxic. The environmental issue associated with its use is primarily due to the energy used in its production. The site procures high purity nitrogen in both liquid and gaseous
form. Liquid nitrogen is used primarily for the cold testing of automotive QFP devices. Consumption of liquid nitrogen has increased due to an increase in QFP production in 2017 and 2018, as per Chart 8.Gaseous nitrogen is supplied directly from the adjacent Multigas Ltd. to distribution points in the assembly area. The processes which use gaseous nitrogen to maintain inert atmospheres include curing ovens, sawing, ball
attach, die attach, and production of forming gas on site. Two flow meters were installed to monitor the consumption of gaseous nitrogen, as per Chart 9. The consumption of gaseous nitrogen has increased due to its use in copper wire bonding which has increased consistently during the year, however more control is held over its consumption to stop wastages.
Liquid nitrogen refilling.Photo taken by Ivana Cattafi.
Liquid nitrogen consumption | Chart 8
4000
3000
2000
1000
0
0.24
0.18
0.12
0.06
0.00
km3/M
pins
x100
0 m3
2015H1
2015H2
2016H1
2016H2
2017H1
2017H2
2018H1
2018H2
2019H1
2019H2
2020H1
Gaseous nitrogen consumption | Chart 9
7000
5250
3500
1750
0
0.40
0.30
0.20
0.10
0.00
Tons
2015H1
2015H2
2016H1
2016H2
2017H1
2017H2
2018H1
2018H2
2019H1
2019H2
2020H1
Tons
/Mpin
s
2524
Hydrogen consumption | Chart 10
3000
2250
1500
750
0
0.14
0.10
0.07
0.03
0.00
Kgs
2015H1
2015H2
2016H1
2016H2
2017H1
2017H2
2018H1
2018H2
2019H1
2019H2
2020H1
Kgs/M
pins
HYDROGEN
Hydrogen gas is used in the forming gas production for copper wire bonding. Like nitrogen, the main environmental issue associated with hydrogen is the energy consumed in its production and potential release of energy. Chart 10 shows hydrogen consumption per pin, which is decreasing due to control over use of forming gas.
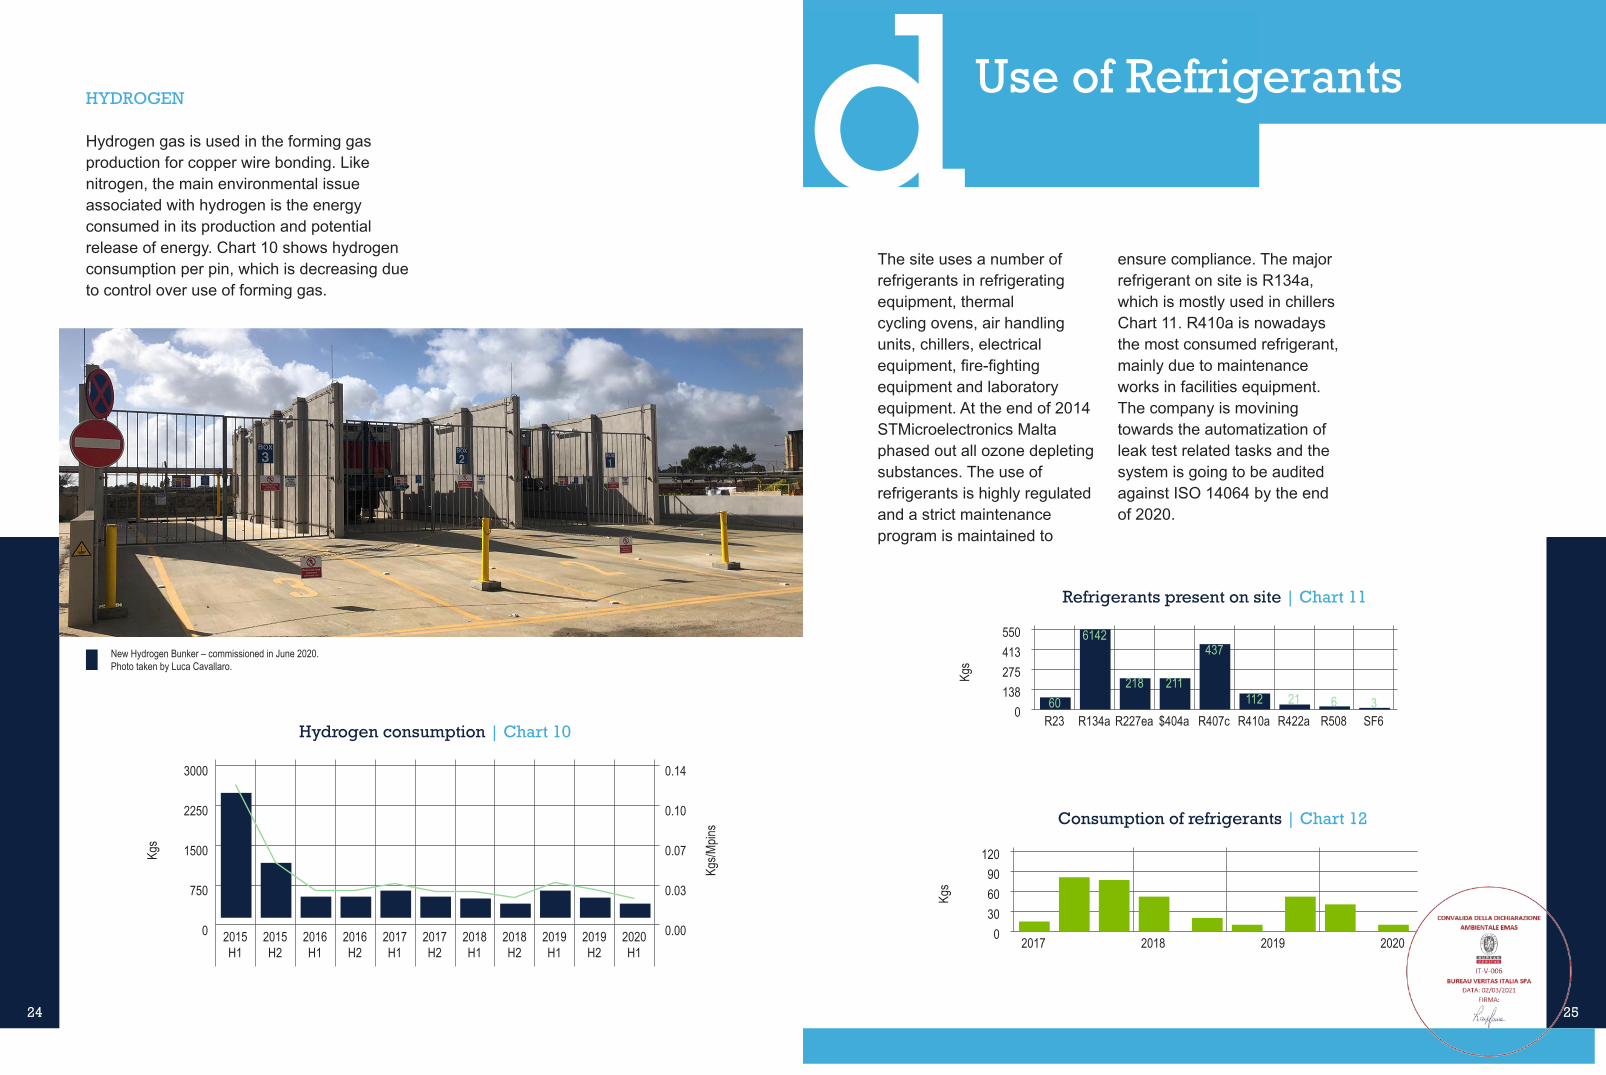
New Hydrogen Bunker – commissioned in June 2020.Photo taken by Luca Cavallaro.
Use of Refrigerantsd
Refrigerants present on site | Chart 11
Consumption of refrigerants | Chart 12
550 413 275 138
0
Kgs
R23 R134a R227ea $404a R407c R410a R422a R508 SF6
1209060300
Kgs
2017 2018 2019 2020
The site uses a number of refrigerants in refrigerating equipment, thermal cycling ovens, air handling units, chillers, electrical equipment, fire-fighting equipment and laboratory equipment. At the end of 2014 STMicroelectronics Malta phased out all ozone depleting substances. The use of refrigerants is highly regulated and a strict maintenance program is maintained to
ensure compliance. The major refrigerant on site is R134a, which is mostly used in chillers Chart 11. R410a is nowadays the most consumed refrigerant, mainly due to maintenance works in facilities equipment. The company is movining towards the automatization of leak test related tasks and the system is going to be audited against ISO 14064 by the end of 2020.
60
6142
218 211
437
112 21 6 3

2726
Land Use & Biodiversity
ST Microelectronics Malta occupies a land area of 48100 m2, of which 1740 sqm are green areas. The impermeable surface covered by the company is equivalent to the 96%.
A number endemic and indigenous trees to the Maltese Islands are present on site in small areas dedicated to maquis and maritime habitats, in part to offset land use by increasing biodiversity in the area. Flora on site includes Tetraclinis articulata, Cremnophyton lanfrancoi, Darniella melitensis, Helichrysum melitense and Paleocyanus crassifolius. As part of our wider efforts to sequester CO2 emissions, more than 12,260 plants and trees have been planted all over the Maltese Islands. These included 950 plants given to visitors attending the Open Day 2017 at STMicroelectronics Malta.
Snail in the garden of STMicroelectronics Malta.Photo taken by Matthew Bonnici.
GREEN AREA (m2)1740
PARKING ZONE (m2)6900
BUILDING COVERAGE (m2)6900
ROAD PERIMETER (m2)33400
3 Location and number of trees planted by STMicroelectronic Malta, all over the Maltese Islands.
Electricity Distribution
Centre
Air Scrubbers
Manufacturing Area
Waste Water Treatment
Plant
KK3KK2
KK1KK0
Car Park
Offices
Land use at STMicroelectronics Malta (Google Maps image)
Waste Management Area
Emergency Response Room
2928
Wastewater Effluent
All industrial wastewater streams are channeled through a 750KUS$ Wastewater Treatment Plant, installed in 1994. This plant renders the process water effluents derived from the plating and other equipment safe for discharge to the public sewers which in turn are connected to the national Wastewater Treatment Plant. By means of settling tanks and the addition of suitable treatment materials, unwanted contaminants contained in the wastewater are precipitated out and the final solution neutralized before being led out to the main sewage system. The system is fully computerized and the acidity which is measured as pH is continuously monitored to ensure that it operates to the required standard and that national pH limits are not exceeded.
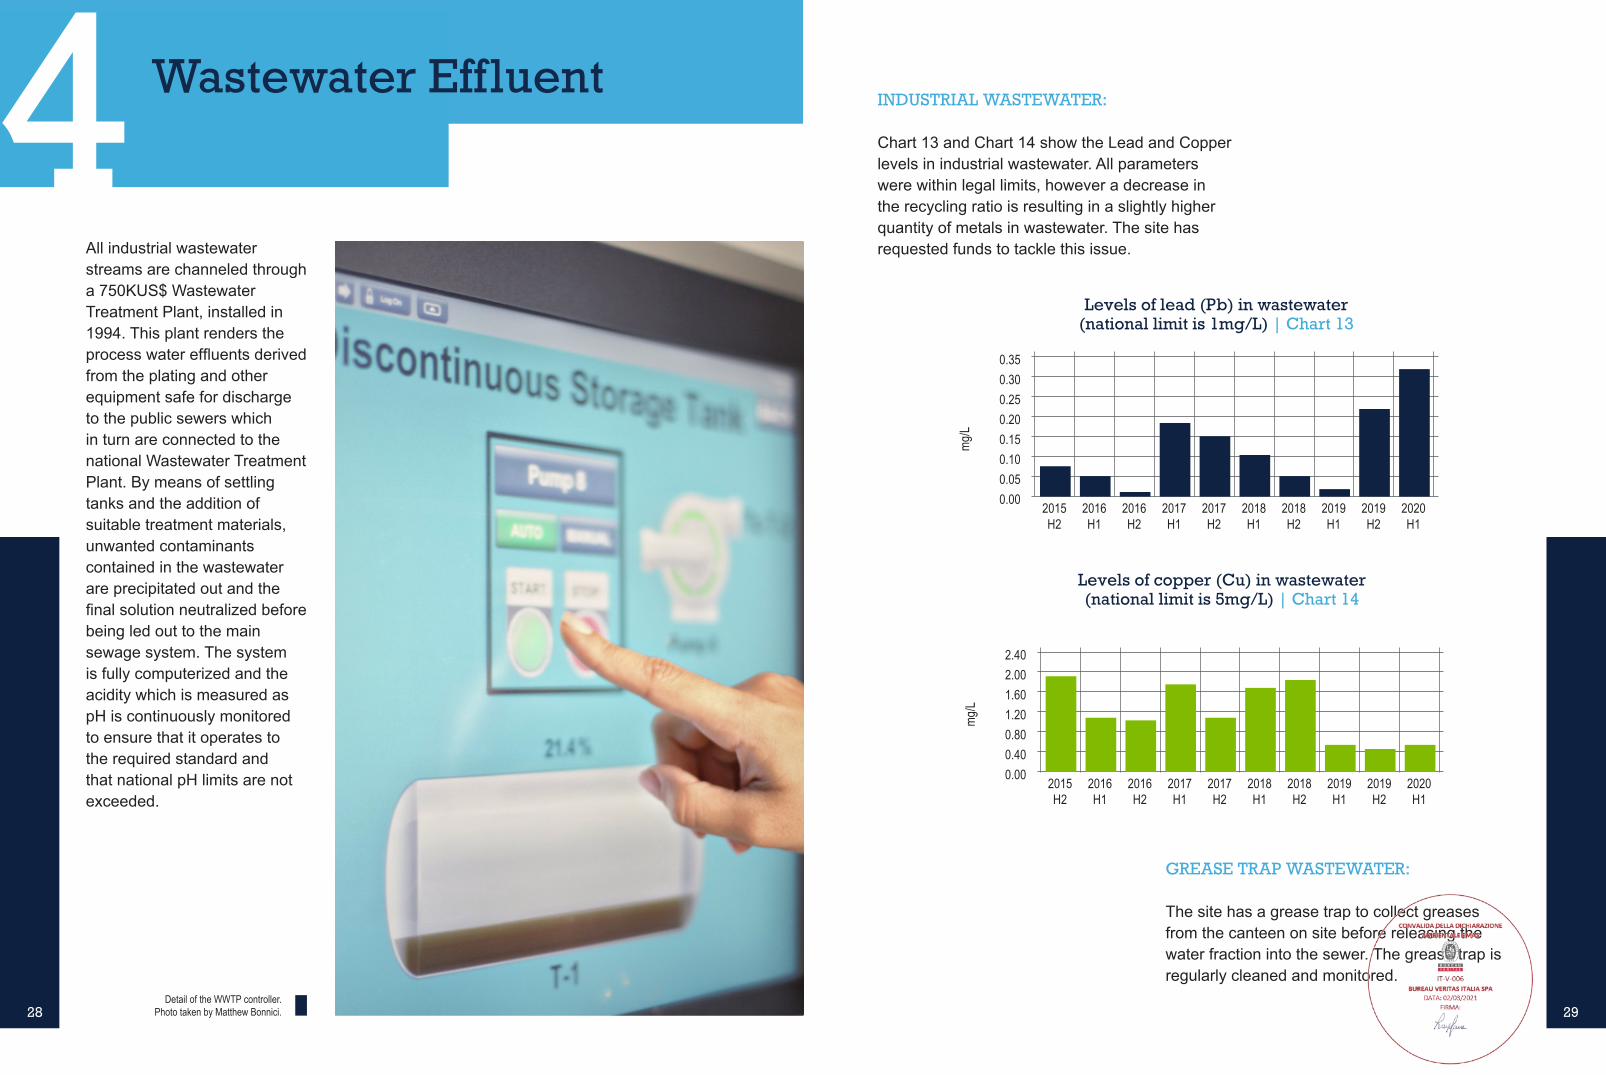
Detail of the WWTP controller.Photo taken by Matthew Bonnici.
4Levels of lead (Pb) in wastewater
(national limit is 1mg/L) | Chart 13
Levels of copper (Cu) in wastewater(national limit is 5mg/L) | Chart 14
0.350.300.250.200.150.100.050.00
mg/L
2015H2
2016H1
2016H2
2017H1
2017H2
2018H1
2018H2
2019H1
2019H2
2020H1
2.402.001.601.200.800.400.00
mg/L
2015H2
2016H1
2016H2
2017H1
2017H2
2018H1
2018H2
2019H1
2019H2
2020H1
INDUSTRIAL WASTEWATER:
Chart 13 and Chart 14 show the Lead and Copper levels in industrial wastewater. All parameters were within legal limits, however a decrease in the recycling ratio is resulting in a slightly higher quantity of metals in wastewater. The site has requested funds to tackle this issue.
GREASE TRAP WASTEWATER:
The site has a grease trap to collect greases from the canteen on site before releasing the water fraction into the sewer. The grease trap is regularly cleaned and monitored.
3130
Ing. Noel BalzanPlant Section Manager
Mechanical
All the air from production, including acid fumes from the plating process, is passed through scrubbers for cleaning before being emitted into the air. One wet scrubber was installed in KK2 in 1994 and two wet scrubbers were installed in KK1 during 1996. Scrubber units are equipment that wash the fumes with water and remove the acid droplets – the acidified water then goes to the Wastewater Treatment Plant where it is neutralized. In KK2 there is also one adsorption filter for fumes coming from the flammable and acid store. In 2015, a new spray booth was installed to contain emission generated from the painting process.Chart 15 shows the air emission measurements from the point sources mentioned in our site Environmental Permit. All air emissions analyses were found to be well within both corporate and legal limits. The change in values between 2018 and 2019 is due to improvements of sampling points probe and in the laboratory that perform the test.
“Clean air and environmental concerns are
at the forefront of ST Malta’s agenda which
is also in-line with EU legislation. Like
other ST plants, our processes & laboratory
operations emit harmful exhaust, be it
acidic fumes, VOCs or particulate matter
which are serviced by scrubber systems.
Planned maintenance of such systems
at our facility enables us to protect
the environment while continuing our
operations without interruptions.
Air Emissions5
543210 2015
H2
mg/m
3
2016H2
2017H2
2018H1
2019H2
<1 <1 4 1.9 12.2VOC mg/m3
PS 12 - Spray Booth
1086420 2015
H2
mg/m
3
2016H2
2017H1
2018H1
2019H2
<6.67 5 10 <0.1 3.2
<5 <5 <10 <0.1 <1
1 <1 <1.9 <0.2 5.3
NOx mg/m3
VOC mg/m3
SOx mg/m3
PS 1 - Wet Scrubber
1086420 2015
H2
mg/m
3
2016H2
2017H1
2018H1
2019H2
5 <5 <10 <0.1 5.4
5 <5 <10 <0.1 <1
1 <1 <0.6 <1.5 3.3
NOx mg/m3
VOC mg/m3
SOx mg/m3
PS 2 - Wet Scrubber
1086420 2015
H2
mg/m
3
2016H2
2017H1
2018H1
2019H2
<5 <5 <10 <0.1 <1
<5 <5 <10 <0.1 <1
1 <1 <3.2 <0.1 0.27
NOx mg/m3
VOC mg/m3
SOx mg/m3
PS 4 - Adsorption Filter
1086420 2015
H2
mg/m
3
2016H2
2017H1
2018H1
2019H2
<5 <5 <10 <0.1 <1
<5 <5 <10 <0.1 <1
1 <1 <4 <0.9 9.3
NOx mg/m3
VOC mg/m3
SOx mg/m3
PS 5 - Wet Scrubber
Air Emissions (national limit for SOx (Sulfur oxides), NOx (Nitrous oxides) and VOC (Volatile Organic Carbons) are 20 mg/m3 | Chart 15
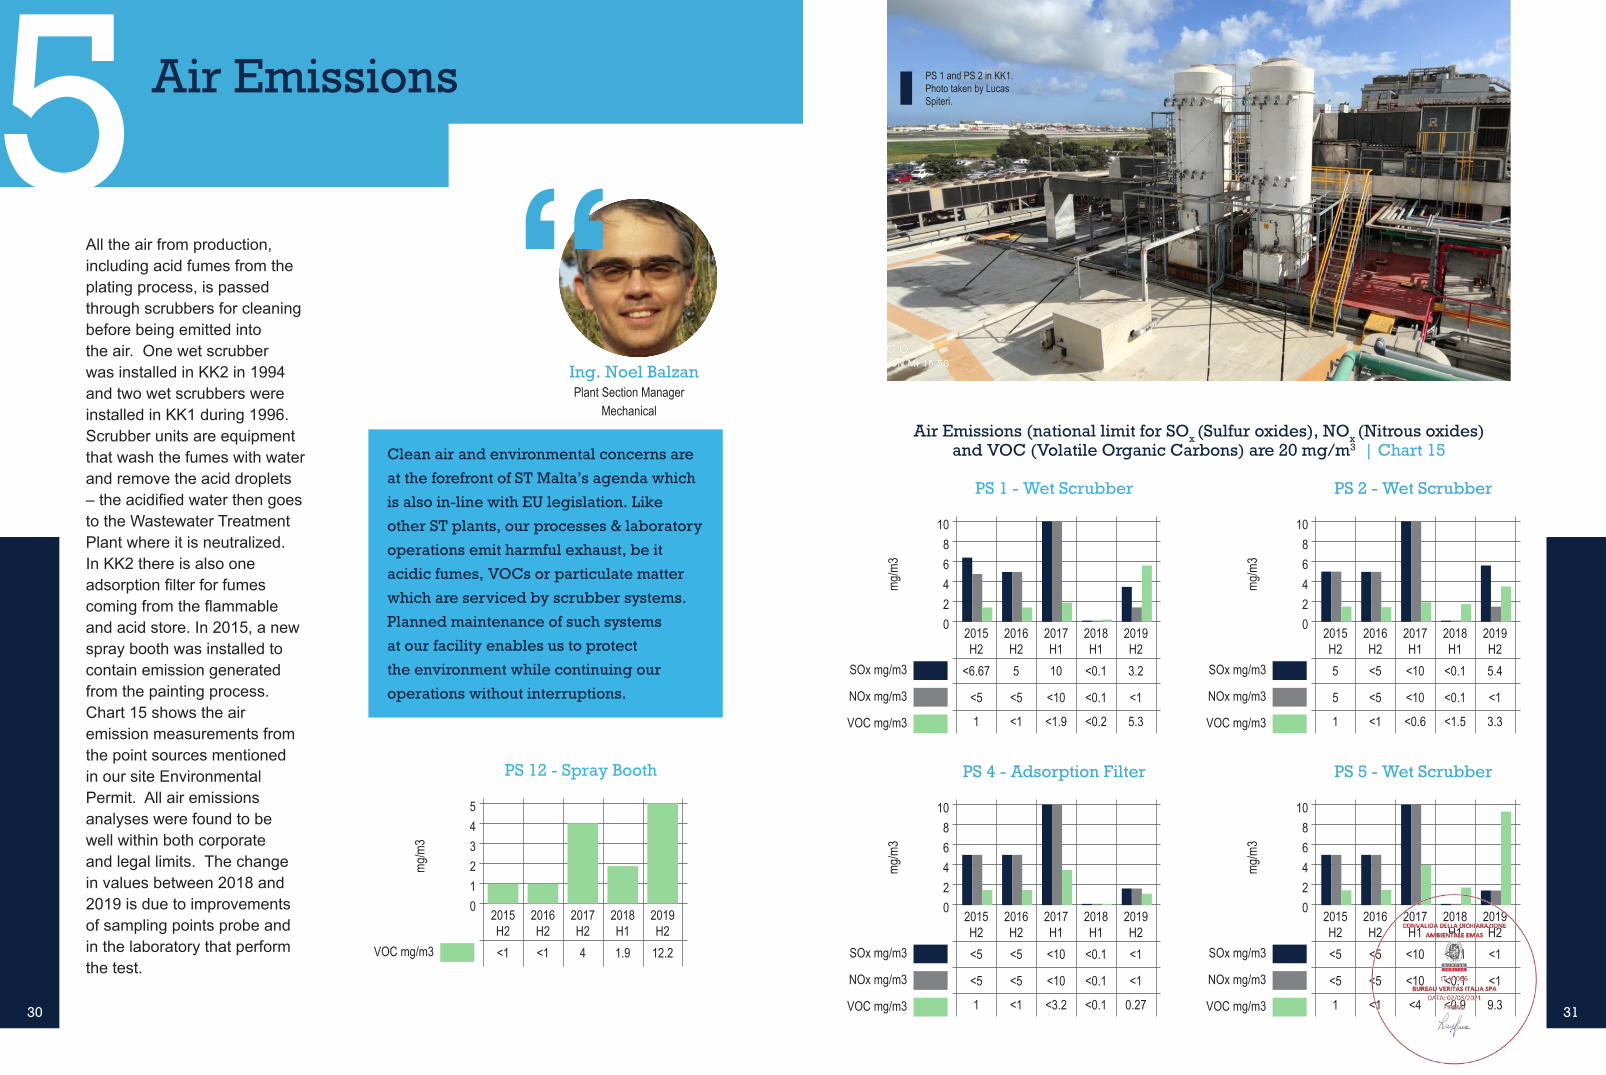
PS 1 and PS 2 in KK1.Photo taken by Lucas Spiteri.
3332
Greenhouse Gas Emissions
In 2013, STMicroelectronics Malta published its Scope 1 and Scope 2 emissions, with the main contributor being indirect electricity emissions generated by Enemalta, as verified through ISO14064. The baseline year for Greenhouse gas emissions (GHG) is 2012, with 82435.823tCO2e Scope 1 and 2 emissions. Since then the GHG inventory has been revised to include electricity emissions for raw water consumed by STMicroelectronics that was produced by Reverse Osmosis
and extracted groundwater, and for wastewater produced by ST and treated at the municipal plant Table 3. Scope 1 emissions are insignificant for STMicroelectronics Malta (less than 1%). Scope 2 emissions are decreasing due to reduced electricity emission factors. GHG emissions from electricity consumption and normalized values using number of units assembled are shown in Chart 16. In 2020 has been added Scope 3 and 4 to the GHG inventory.
GHG Inventory Results
SCOPE 1 Emission
ton Co2 equivalent
SCOPE 2 Emission
SCOPE 3 Emission
SCOPE 4 Emission
Grand TOTAL
16.55
71739.86
NA
NA
71756.41
2015
35.78
41259.45
NA
NA
41295.23
2016
29.81
39238.68
NA
NA
39268.49
2017
26.91
39193.16
NA
NA
39220.07
2018
158.51
38108.00
1069
1100.98
40436.49
2019
GHG Inventory | Table 3
a80.070.060.050.040.030.020.010.00.0 2015
80.070.060.050.040.030.020.010.00.0
Tonn
es/M
Units
Tons
2016 2017 2018 2019
1062 1062 1104 1104 1300
838 838 661 661 846
KTons of CO2
Tons/Munits
GHG Emissions from Electricity Consumption | Chart 16
Electricity Emission Factor (kg CO2/kWh)
0.7394
2015
0.4516
2016
0.4516
2017
0.383
2018
0.378
2019
Electricity emission factors for electricity supplied to STMicroelectronics Malta | Table 4
3534
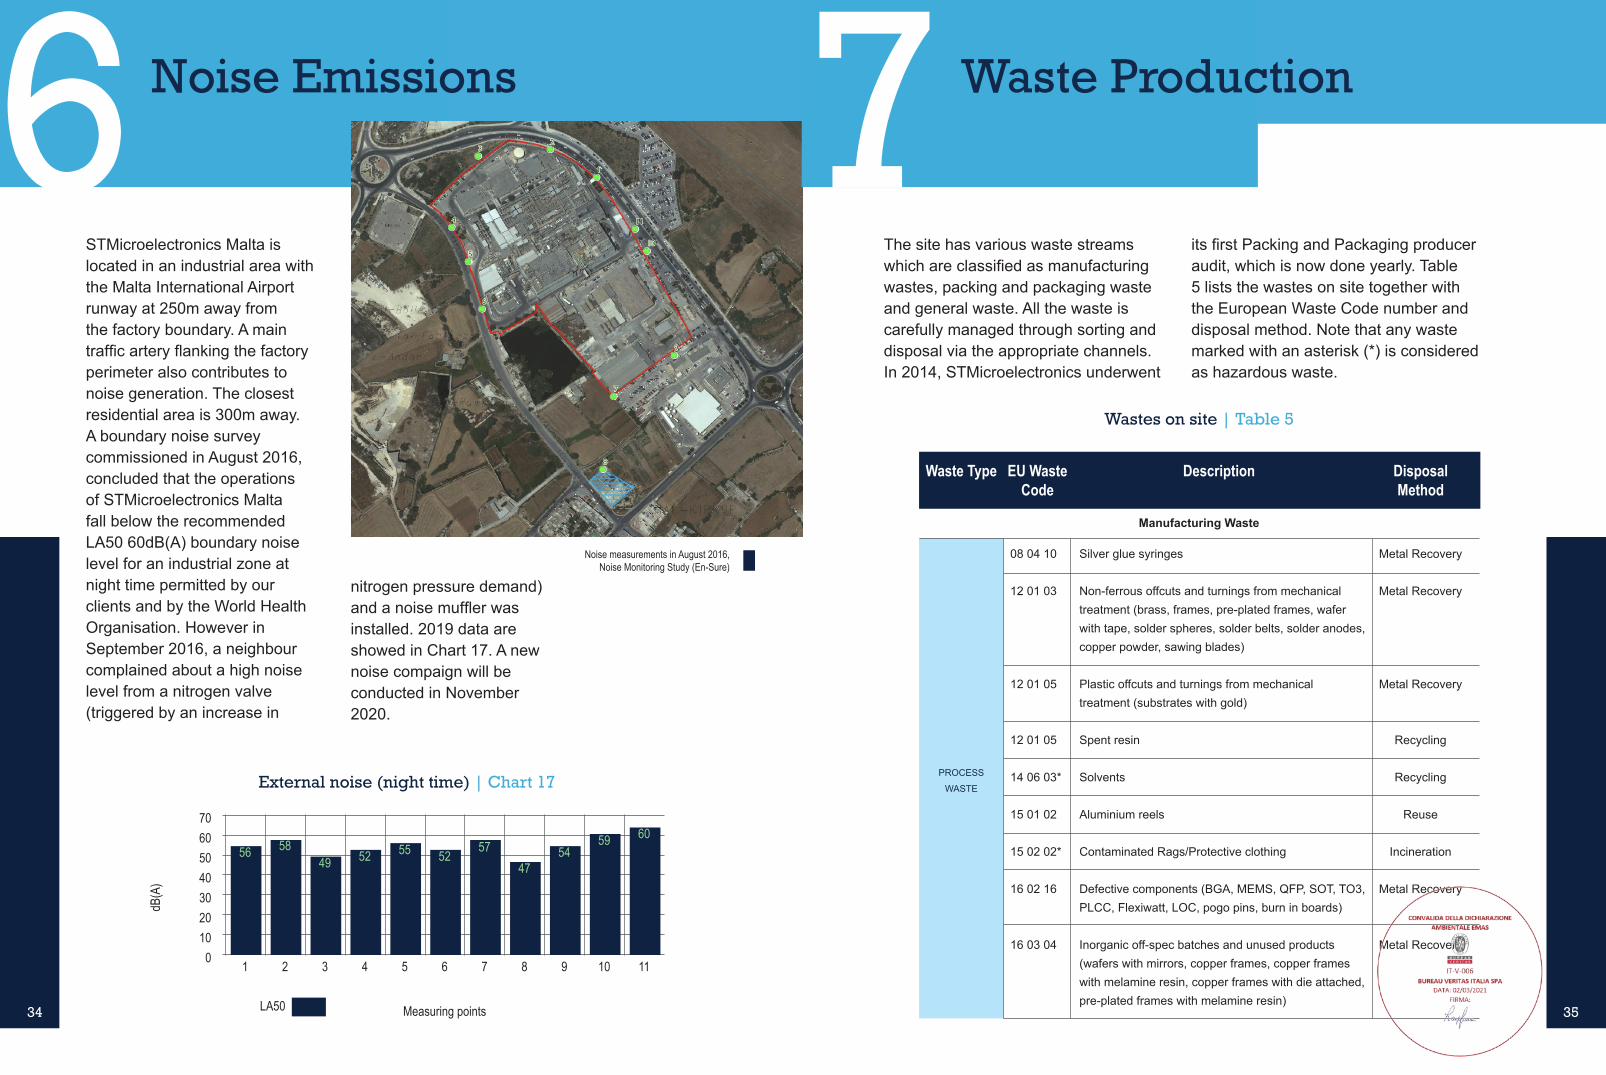
Noise Emissions6STMicroelectronics Malta is located in an industrial area with the Malta International Airport runway at 250m away from the factory boundary. A main traffic artery flanking the factory perimeter also contributes to noise generation. The closest residential area is 300m away. A boundary noise survey commissioned in August 2016, concluded that the operations of STMicroelectronics Malta fall below the recommended LA50 60dB(A) boundary noise level for an industrial zone at night time permitted by our clients and by the World Health Organisation. However in September 2016, a neighbour complained about a high noise level from a nitrogen valve (triggered by an increase in
External noise (night time) | Chart 17
706050403020100
dB(A
)
Measuring points
1 2 3 4 5 6 7 8 9 10 11
56 5849 52 55 52
5747
5459 60
LA50
nitrogen pressure demand) and a noise muffler was installed. 2019 data are showed in Chart 17. A new noise compaign will be conducted in November 2020.
Noise measurements in August 2016, Noise Monitoring Study (En-Sure)
PROCESS
WASTE
Waste Type
Manufacturing Waste
08 04 10
12 01 03
12 01 05
12 01 05
14 06 03*
15 01 02
15 02 02*
16 02 16
16 03 04
Silver glue syringes
Non-ferrous offcuts and turnings from mechanical treatment (brass, frames, pre-plated frames, wafer with tape, solder spheres, solder belts, solder anodes, copper powder, sawing blades)
Plastic offcuts and turnings from mechanical treatment (substrates with gold)
Spent resin
Solvents
Aluminium reels
Contaminated Rags/Protective clothing
Defective components (BGA, MEMS, QFP, SOT, TO3, PLCC, Flexiwatt, LOC, pogo pins, burn in boards)
Inorganic off-spec batches and unused products (wafers with mirrors, copper frames, copper frames with melamine resin, copper frames with die attached, pre-plated frames with melamine resin)
Metal Recovery
Metal Recovery
Metal Recovery
Recycling
Recycling
Reuse
Incineration
Metal Recovery
Metal Recovery
Wastes on site | Table 5
EU Waste Code
Description DisposalMethod
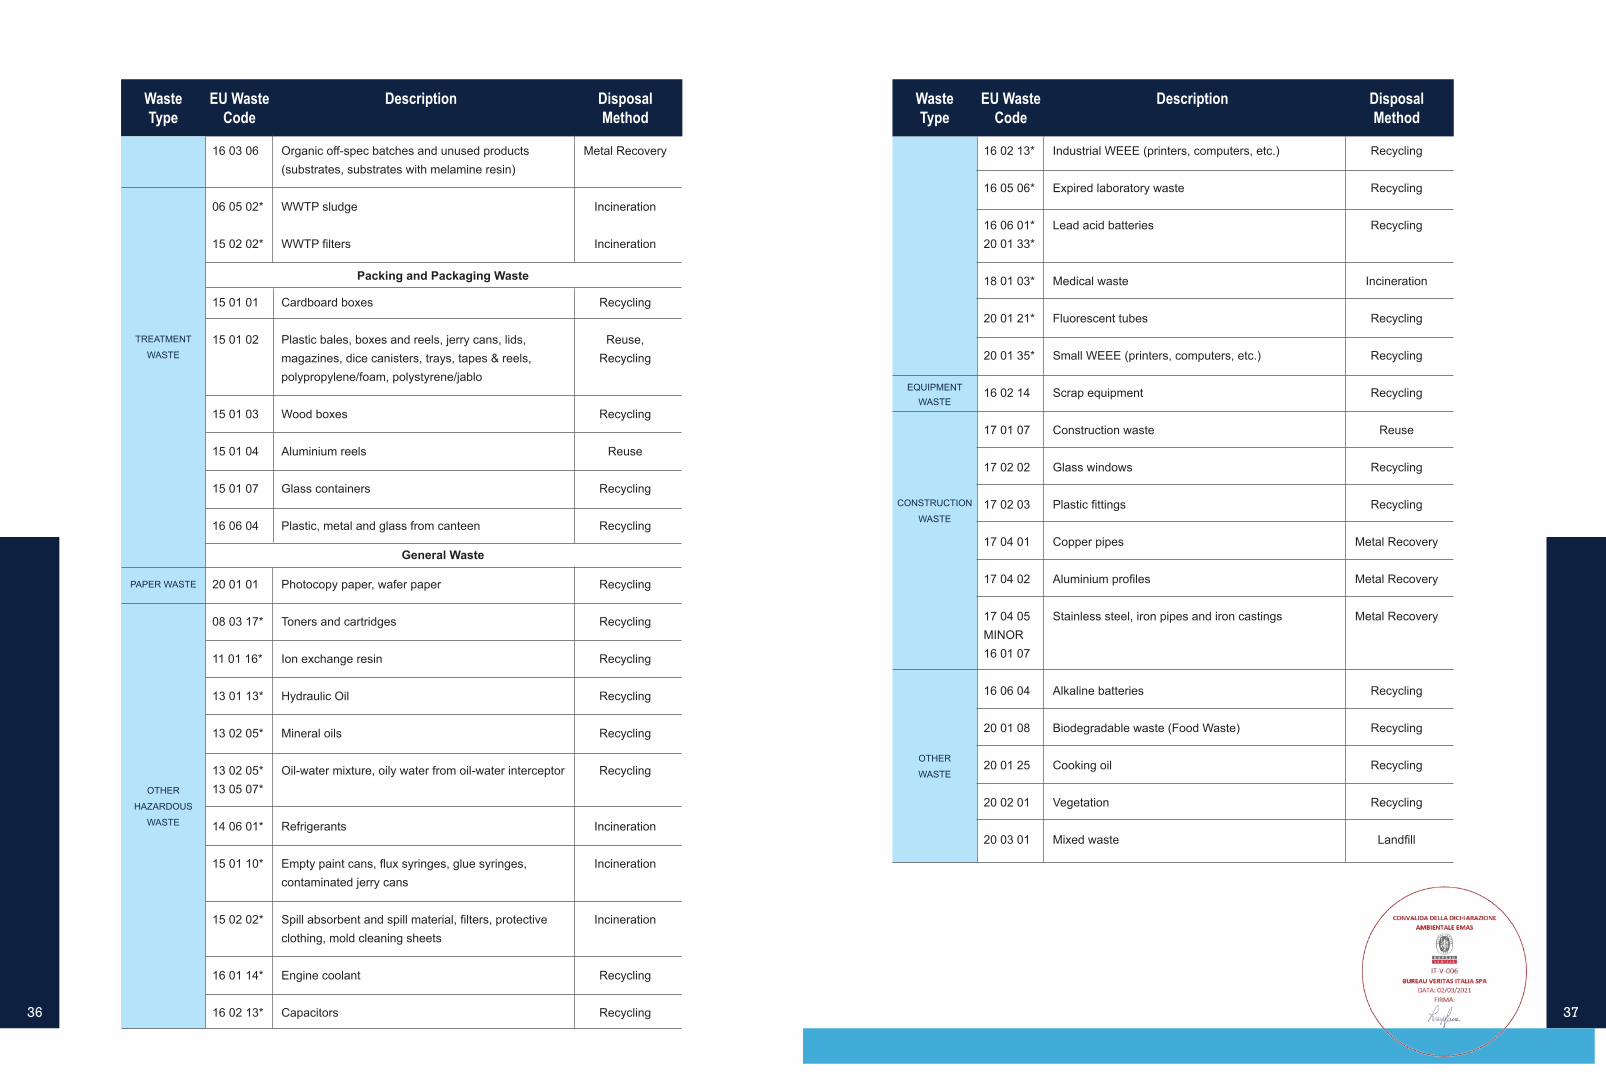
Waste Production7The site has various waste streams which are classified as manufacturing wastes, packing and packaging waste and general waste. All the waste is carefully managed through sorting and disposal via the appropriate channels. In 2014, STMicroelectronics underwent
its first Packing and Packaging producer audit, which is now done yearly. Table 5 lists the wastes on site together with the European Waste Code number and disposal method. Note that any waste marked with an asterisk (*) is considered as hazardous waste.
3736
WasteType
16 03 06
06 05 02*
15 02 02*
Organic off-spec batches and unused products (substrates, substrates with melamine resin)
WWTP sludge
WWTP filters
Metal Recovery
Incineration
Incineration
EU Waste Code
Description DisposalMethod
TREATMENT
WASTE
Packing and Packaging Waste
PAPER WASTE
OTHER
HAZARDOUS
WASTE
15 01 01
15 01 02
15 01 03
15 01 04
15 01 07
16 06 04
Cardboard boxes
Plastic bales, boxes and reels, jerry cans, lids, magazines, dice canisters, trays, tapes & reels, polypropylene/foam, polystyrene/jablo
Wood boxes
Aluminium reels
Glass containers
Plastic, metal and glass from canteen
Recycling
Reuse, Recycling
Recycling
Reuse
Recycling
Recycling
General Waste
20 01 01
08 03 17*
11 01 16*
13 01 13*
13 02 05*
13 02 05*13 05 07*
14 06 01*
15 01 10*
15 02 02*
16 01 14*
16 02 13*
Photocopy paper, wafer paper
Toners and cartridges
Ion exchange resin
Hydraulic Oil
Mineral oils
Oil-water mixture, oily water from oil-water interceptor
Refrigerants
Empty paint cans, flux syringes, glue syringes, contaminated jerry cans
Spill absorbent and spill material, filters, protective clothing, mold cleaning sheets
Engine coolant
Capacitors
Recycling
Recycling
Recycling
Recycling
Recycling
Recycling
Incineration
Incineration
Incineration
Recycling
Recycling
EQUIPMENT WASTE
CONSTRUCTION
WASTE
OTHER
WASTE
WasteType
16 02 13*
16 05 06*
16 06 01*20 01 33*
18 01 03*
20 01 21*
20 01 35*
16 02 14
17 01 07
17 02 02
17 02 03
17 04 01
17 04 02
17 04 05MINOR 16 01 07
16 06 04
20 01 08
20 01 25
20 02 01
20 03 01
Industrial WEEE (printers, computers, etc.)
Expired laboratory waste
Lead acid batteries
Medical waste
Fluorescent tubes
Small WEEE (printers, computers, etc.)
Scrap equipment
Construction waste
Glass windows
Plastic fittings
Copper pipes
Aluminium profiles
Stainless steel, iron pipes and iron castings
Alkaline batteries
Biodegradable waste (Food Waste)
Cooking oil
Vegetation
Mixed waste
Recycling
Recycling
Recycling
Incineration
Recycling
Recycling
Recycling
Reuse
Recycling
Recycling
Metal Recovery
Metal Recovery
Metal Recovery
Recycling
Recycling
Recycling
Recycling
Landfill
EU Waste Code
Description DisposalMethod
3938
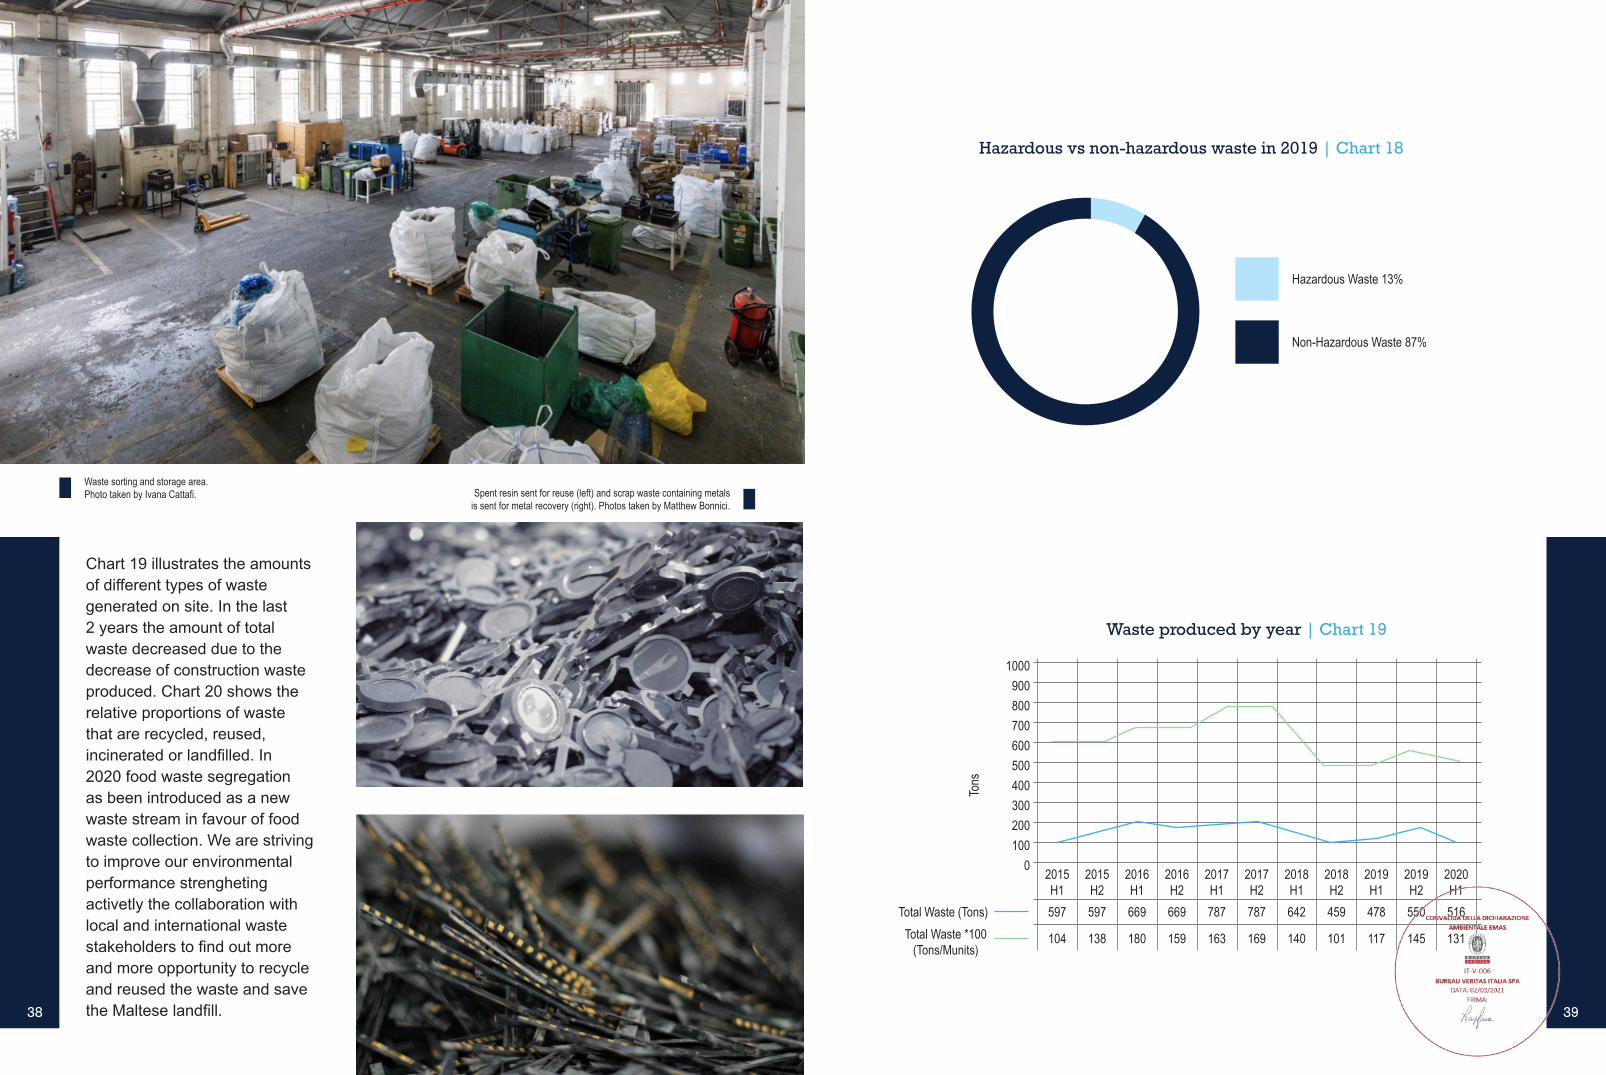
Chart 19 illustrates the amounts of different types of waste generated on site. In the last 2 years the amount of total waste decreased due to the decrease of construction waste produced. Chart 20 shows the relative proportions of waste that are recycled, reused, incinerated or landfilled. In 2020 food waste segregation as been introduced as a new waste stream in favour of food waste collection. We are striving to improve our environmental performance strengheting activetly the collaboration with local and international waste stakeholders to find out more and more opportunity to recycle and reused the waste and save the Maltese landfill.
Waste sorting and storage area.Photo taken by Ivana Cattafi. Spent resin sent for reuse (left) and scrap waste containing metals
is sent for metal recovery (right). Photos taken by Matthew Bonnici.
Hazardous Waste 13%
Non-Hazardous Waste 87%
Hazardous vs non-hazardous waste in 2019 | Chart 18
Waste produced by year | Chart 19
1000900800700600500400300200100
0 2015H1
Tons
2015H2
2016H1
2016H2
2017H1
2017H2
2018H1
2018H2
2019H1
2019H2
2020H1
597 597 669 669 787 787 642 459 478 550 516
104 138 180 159 163 169 140 101 117 145 131Total Waste *100 (Tons/Munits)
Total Waste (Tons)
4140
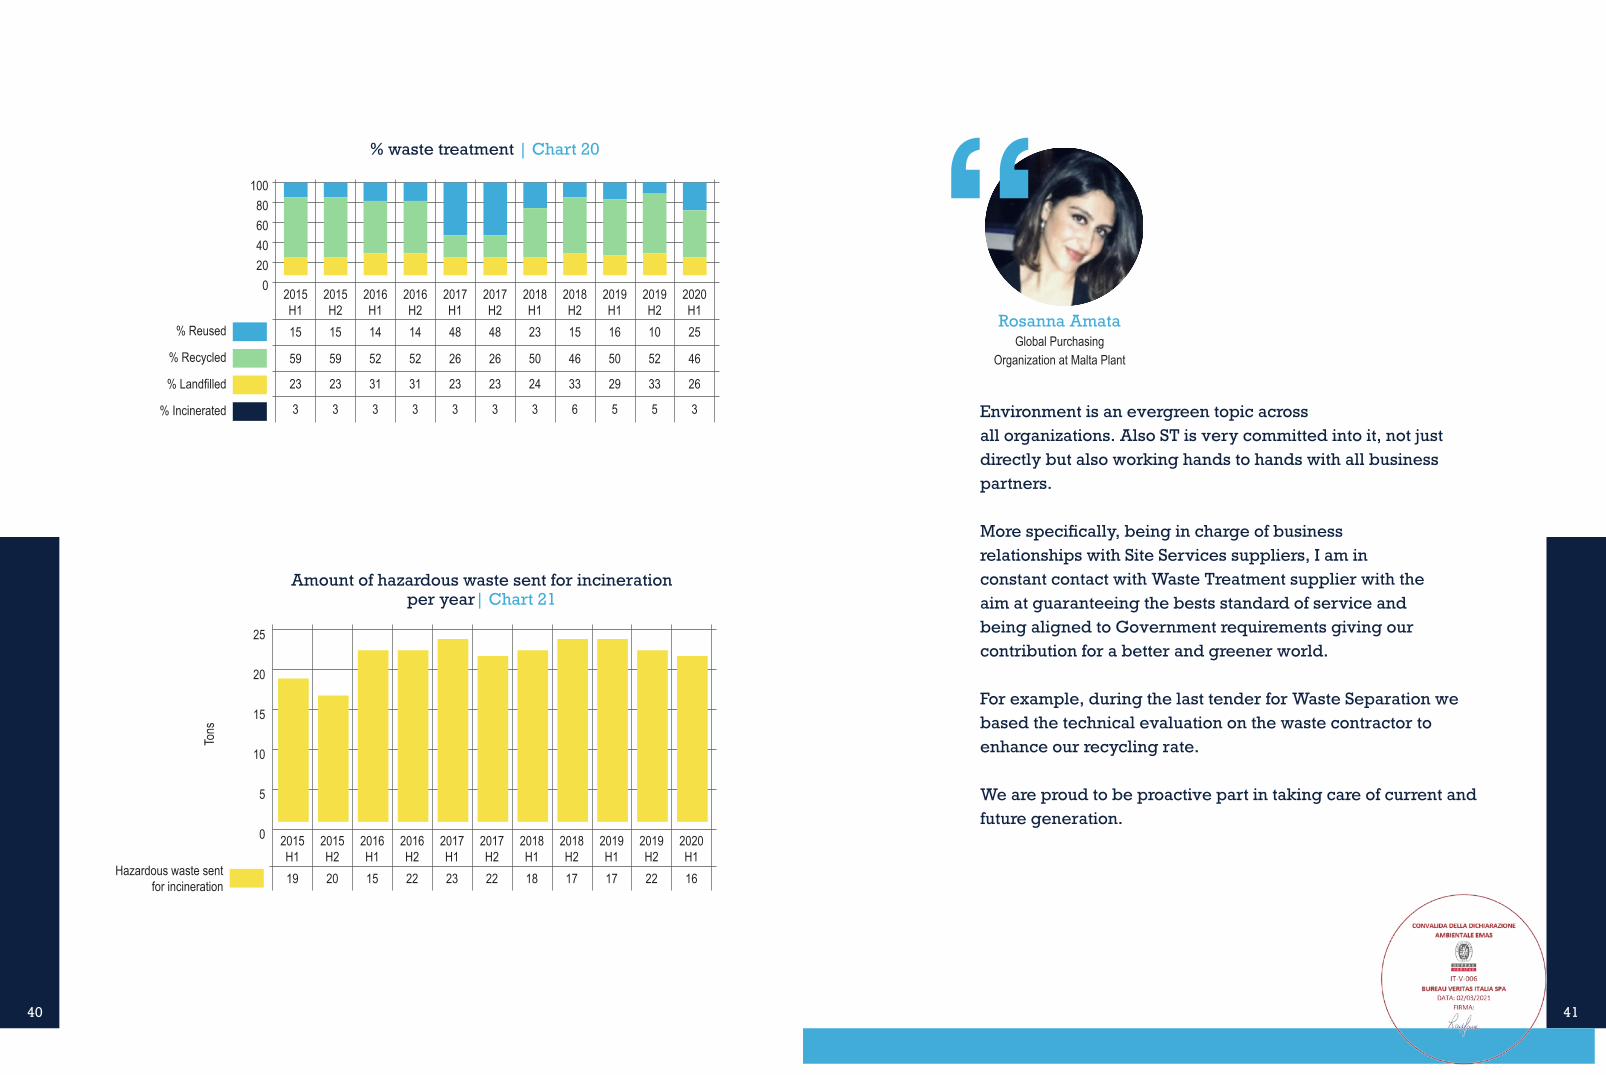
Amount of hazardous waste sent for incinerationper year| Chart 21
25
20
15
10
5
0
Tons
2015H1
2015H2
2016H1
2016H2
2017H1
2017H2
2018H1
2018H2
2019H1
2019H2
2020H1
19 20 15 22 23 22 18 17 17 22 16Hazardous waste sentfor incineration
% waste treatment | Chart 20
100806040200 2015
H12015H2
2016H1
2016H2
2017H1
2017H2
2018H1
2018H2
2019H1
2019H2
2020H1
15 15 14 14 48 48 23 15 16 10 25
59 59 52 52 26 26 50 46 50 52 46
23 23 31 31 23 23 24 33 29 33 26
% Recycled
% Landfilled
% Incinerated
% Reused
3 3 3 3 3 3 3 6 5 5 3
Rosanna AmataGlobal Purchasing
Organization at Malta Plant
“Environment is an evergreen topic across all organizations. Also ST is very committed into it, not just directly but also working hands to hands with all business partners.
More specifically, being in charge of business relationships with Site Services suppliers, I am in constant contact with Waste Treatment supplier with the aim at guaranteeing the bests standard of service and being aligned to Government requirements giving our contribution for a better and greener world.
For example, during the last tender for Waste Separation we based the technical evaluation on the waste contractor to enhance our recycling rate. We are proud to be proactive part in taking care of current and future generation.
4342
Storage & Handling of Potentially Harmful Liquids and other Emergency Situations
One way in which the site’s activities could negatively impact the environment is through accidents such as spills or leaks of acids, solvents, diesel fuel or other materials used on site. The site invested heavily in providing secondary containment for tanks, chemical storage facilities and hazardous waste storage areas. In the event of heavy rainfall, STMicroelectronics pumps water from the adjacent aquatic habitat in the quarry to prevent it from flooding. The site has its own firefighting and emergency response team and facilities and regularly tests its emergency response procedures. STMicroelectronics is regularly audited for risk management by its insurers HDI Gerling. In September 2016, the site underwent its first business continuity audit (ISO22301) while latest occurred in October 2020.
The site is equipped with a fire engine pump and emergency response facilities. Photos taken by Mark Mangion.
8 Indirect Effects9In addition to the direct effects on the environment as described above, the site’s activities can also give rise to indirect effects. The indirect effects that the site considers are:- The emissions of carbon dioxide, sulphur dioxide, and other pollutants from electricity generation - The electricity consumed by the municipal reverse osmosis plants to produce the mains water used by the site- The electricity consumed by the municipal wastewater treatment plants to treat sewage produced by the site- Emissions of pollutant from transportation of employees to and from work.
In order to reduce the impact of these indirect effects, the site maximises its efficiency and reduces consumption of electricity and water. All employees working on shift basis (almost 80% of employees) are encouraged to make use of collective transportation from home to work and back. The site also considers its indirect effects through supplier activities. Corporate suppliers, local suppliers and contractors are encouraged to follow EMAS, ISO 14001 and RBA standards. Major suppliers working with STMicroelectronics Malta are partially evaluated on environmental compliance to ISO 14001.
TRANSPORTATION:
Indirect emissions due to transportation are due to driving transportation (cars); collective transportation (bus); professional transportation (business travel); and goods transportation (freight/goods transportation). Chart 25 illustrates the amount of metric ton carbon equivalent (MTCO2E) emitted due to the different types of transportation, with the highest percentage MTCO2E due to transportation of around 500 day workers who mainly use their own cars. The 80% of workers entitled to collective transportation contribute to just 5% MTCO2E, which positively helps in reducing the negative impact of transportation. The MTCO2E for employee transportation is shown in Chart 26.
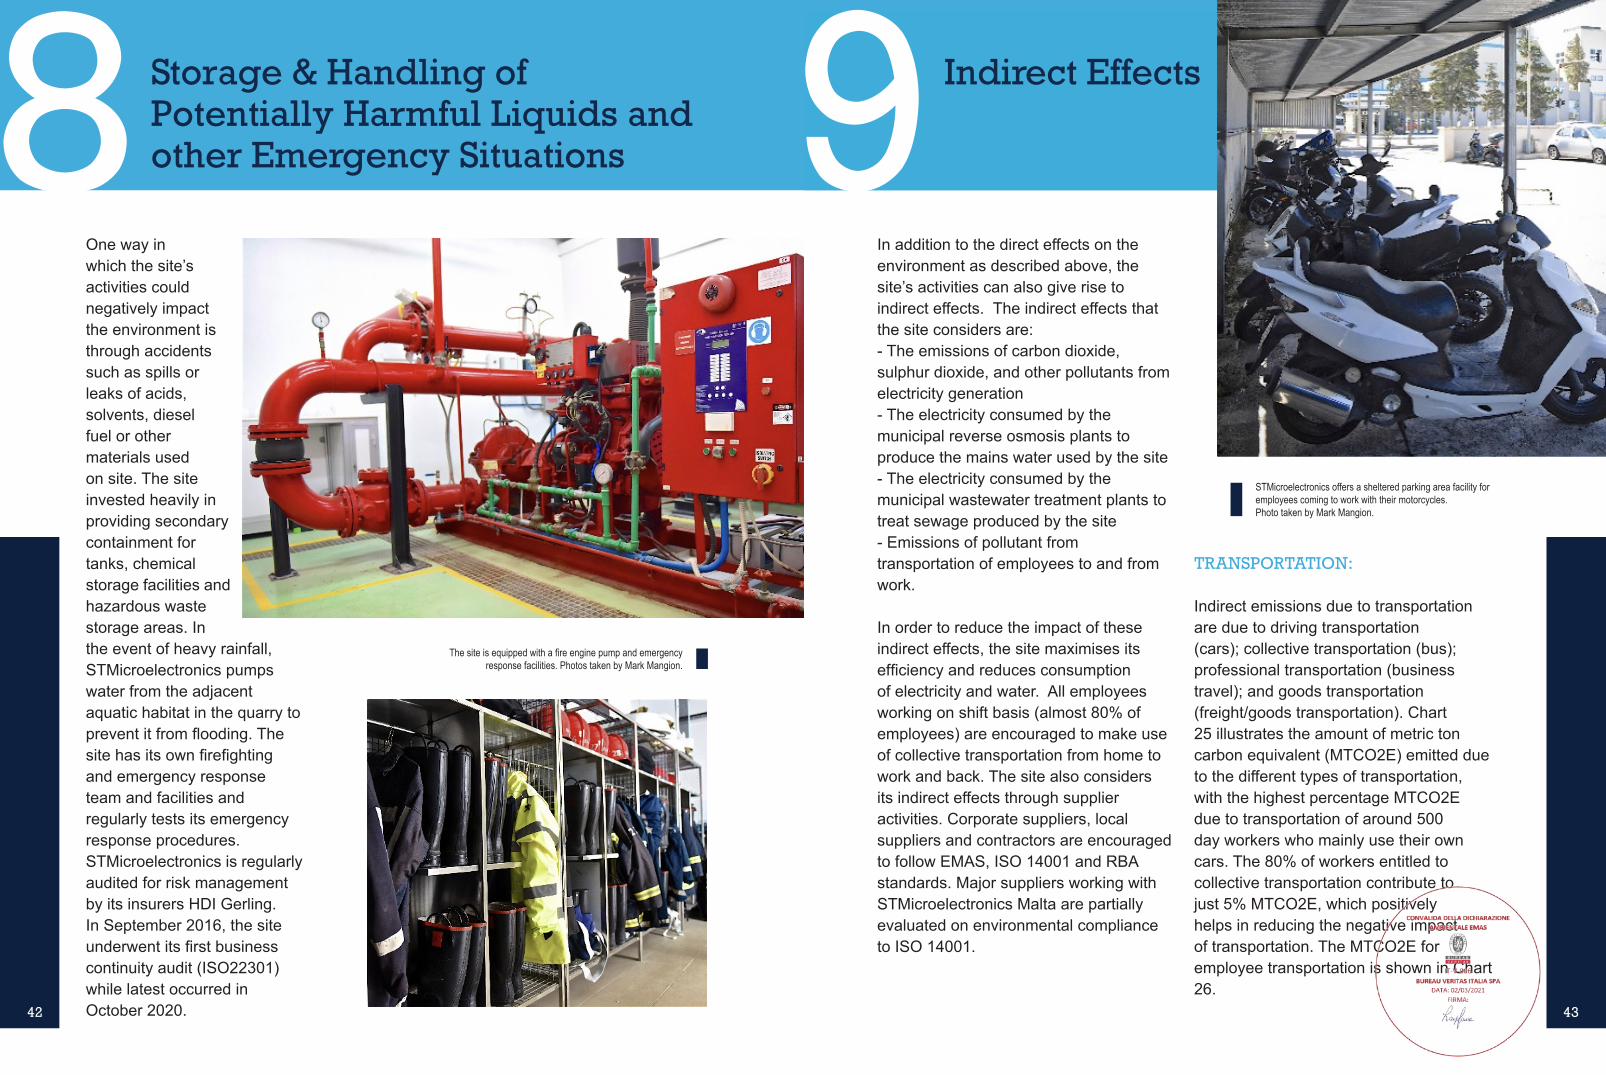
STMicroelectronics offers a sheltered parking area facility for employees coming to work with their motorcycles.Photo taken by Mark Mangion.

4544
MTCO2E for employee transportation(Scope 3) | Chart 26
700600500400300200100
0
MTCO
2E
2016H1
2016H2
2017H1
2017H2
2018H1
2018H2
2019H1
2019H2
2020H1
471 499 500 529518 559621 545 552MTCO2E
Goods Transportation 4%
Professional Transportation 5%
Collective Transportation 5%
Private Transportation 86%
MTCO2E from transportation activities | Chart 25
Eco Footprint10The eco footprint is an environmental indicator, taking the form of a radar chart with four input parameters: electricity, water, chemicals and material intensity (resin, chemicals, cardboard, paper and frames); and six output parameters: wastes, global warming, VOC emissions, atmospheric acidification, heavy metals and eutrophication in wastewater discharge. Each of these parameters is compared to the environmental standards that have been established by STMicroelectronics, as shown in.
The parameter results are converted into a weighted figure where the value of 1 reflects the corporate standard. The Eco-Footprint below shows the result of the eco footprint for the input and output parameters. In 2020 has been recorded a decrease in Eutophication due to the N and P abatment improvements done for WSC which receive our wastewater for uftrher treatment before to release it in the environment.
WaterElectricity
Material IntensityEutrophication
ChemicalsHeavy Metals
WasteAtmospheric
Global WarmingVolatile Organic
ST Malta 2020 Target 20192018 FTP Q2 2020

4746
Eco Foot-print
1. PEOPLE &
COMMUNITY
2. RISK
MANAGEMENT
3. ENERGY
MANAGEMENT
4. WATER
MANAGEMENT
DECALOGUE # MEASUREMENT TARGET
Top page indicator
1.1
1.2
1.3
2.1
2.2
2.3
2.4
2.5
3.1
3.2
3.3
3.4
4.1
4.2
To implement action plans effective to reduce it
Support local initiatives for sponsoring EHS projects, local EHS
events at each of our sites, encourage our people to lead or
participate in EHS committees, conferences
Strengthen our EHS culture through dedicated trainings and
communications
Promote volunteer activites and philantropic contributions through
dedicated programs
Adopt an approach based on precautionary principles when
assessing the EHS impacts of new operational processes,
chemicals and materials
Strive towards continuous control, reduction or elimination of risks
and of substances of concern in our processes and activities for
an environmentally friendlier, safer and healthier working place
Align materials management with Hazardous Substances
Process Management System Requirements
Within our Loss Preventation Program, rate all our manufacturing
sites HPR (Highly Protected Risk) or APR (Adequately Protected
Risk)
Continuously improve the management of the Supply Chain
requesting our suppliers to meet the Social, Environmental,
Health and Safety ST requirements, including ISO 14001 and
OHSAS 18001 or equivalent certifications
Continuously improve energy efficiency at equivalent production
level (Wh per production unit) through process and facilities
optimization, conservation and building design
Adopt, whenever possible, renewable energy sources through
energy procurement and/or green energy installations
Design and assess all new building and manufacturing sites
according to LEED (Leadership in Energy and Environmental
Design) or equivalent
Integrate energy efficiency performance as a key criteria for
design and execution of new facility projects
Continuously improve water efficiency at equivalent production
level through water saving programs and water recycling projects
(m3 per production unit)
Control any risks of pollution before discharging wastewater into
the natural environment
EFP
no. contributions to projects
no. EHS training hours
no. env communications
no. env suggestions
no. of activities/philatropic
contributions
no. of SCC meetings/
discussions
% waivers for all hazardous
products on site;
% of IH measurement <
Detection Limit
program deployment
rating
participation in local and
corporate SPE
MWh. Wh/pin
no. of renewable sources/
green energy installations
EPC rating for new buildings
EPC rating for new buildings
m3/Munits
% recycling rate
no. of NC
Objectives | Table 7
Site Environmental Objectives and Targets 2020
0.94
Sponsor trees, EHS
Week
4 hr/employee/yr
24 comm/yr
12 env suggestion/yr
1 activity/contribution
per year
1/month
100% waivers
95% IH <DL
100% fulfilling customer
requirements
APR or HPR
1 corporate SPE/yr
1 local SPE/yr
84381, 2.71
at least 1/yr
C or better
C or better
185,000
44.5%
0 NC
Eco Foot-print
5. GHG & AIR
EMISSIONS
6. WASTE
7.
MEASURMENT
& VALIDATION
8.
REGULATIONS
&
COMPLIANCE
Top page indicator
5.1
5.2
5.3
5.4
6.1
6.2
6.3
7.1
7.2
8.1
8.2
8.3
8.4
8.5
To implement action plans effective to reduce it
Indirect emissions (Scope 2): decrease CO2 indirect emission
through our energy management programs
Transportation emissions (Scope 3): reduce CO2 emissions (tons
CO2) per production unti) from transportation and logistics for our
products, materials and employees
Continue to compensate our direct emissions through
reforestation programs and compensation voluntary projects
Treat air emissions in appropriate abatement systems to
control risks of pollution before discharging them into th natural
environment
Strive to reduce to zero the quantity of hazardous waste in landfill
Remain among the best in class companies with a reuse and
recycle rate at 90%
Remain among the best in class companies with landfilled waste
rate at 3% or less
Continuously monitor our progress, including periodic audits and
cooperation with external stakeholders
Maintain environment certifications and validations of all our sites
(ISO 14001, ISO 14064, EMAS)
Comply at all of our locations with all applicable national, regional
and local environment regulations
Meet the most stringent of, either national/local environmental
regulations, or the Company Envrionment policies and
procedures
Ensure compliance to Environment legal requirements for all
products delivered worldwide
Strive towards ‘green procurement’ and purchase Eco-label or
other ‘green labels’ (when available) materials and products
Establish long standing partnership with our customers to comply
to their sustainability and EHS requirements
EFP
MTC02E of electricity
consumption
MTC02E/Munit
no. of projects
no. of NC
%
% Reuse + Recycle
% landfill waste vs total
waste
no. of MNC
no. of MNC
% compliance
% compliance
% compliance
no. of purchases
no. of NC in customer audits
0.94
38,858 TEqCO2
1.0 MTC02E/Munit
1 activity/contribution
per year
0 NC
0%
80%
20%
0 MNC
0 MNC
100%
100%
100%
10 green-label/yr
0 NC

4948
Objective
PEOPLE &
COMMUNITY
RISK
MANAGEMENT
ENERGY
MANAGEMENT
WATER
MANAGEMENT
GHG & AIR
EMISSIONS
WASTE
MANAGEMENT
MEASUREMENT
& VALIDATION
REGULATIONS
& COMPLIANCE
Key ActionsSponsor reforestation plan
EHS Week
Collection of plastic caps for charity
Environment training and communications
Collaborate with University and MCAST
Implement HSPM program (new)
IH monitoring program
Internal audit program through consultant
SPE program - completed local and key evaluation
Ring road light replaced with LED
Efficiency of new transformers in KK2 basement: 1.4 MWh per
transformer per month. Each monh from Aug to Dec we are going
to install one transformer per month
New cooling loop. To be installed in November. 50MVaH in
November and 50 MVAh in December
Get ISO 50001
Install Solar Panels
Purchase and installation of new RO train to increase DI output
capacity.
Phytoremediation Plant
Biocide dosing and filtering units
Rearrangement of RO trains
New Waste Water Treatment Plant
Conduct yearly air emission campaign
Spray booth Maintenance Program
Scrubber Maintenance Program
Investigate the possibility to install leak detector for chillers
ISO 14064 for GHG inventory
Integration of leak test in CMMS and X-site softwares
Investigate new opportunity for waste management contract (new)
Standardize separation bins in office
Start organic food collection
Conduct quarterly water monitoring campaign
Golder audit - week 4 (new)
ISO 14001:2015 Adult - to plan in April
ISO 14064
ISO 50001
Annual Environmental Report for ERA
PnP Producer Registration for ERA
Diesel Secondary Storage for REWS
Energy Audit exemption to EWA
Sewer Permit is valid, but we await the official certifciate from WSC
Diesel Filling Station permit
LPG tank commissioning
WEEE producer application
2020
x (postponed due
to COVID-19)
x
x (done)
x (done)
x (done)
x (done)
x (done)
x (CAR done)
x (ongoing)
x (done)
x (done)
x (done)
x (done)
x (done)
x (done)
x (done)
x (done)
x (done)
x (done)
x
Environmental program | Table 8
2021x
x
x
x
x
x
x
x
x
x
x
x
x
x
x
x
x
x
x
x
x
x
x
x
2022
x
x
x
x
x
x
x
x
x
x
x
x
x
x
Appendix 1Environmental Certifications
EMAS Registration (2020), EMAS Certification (2020) ISO 14001 (2018)
Appendix 2Green PartnerCertificates
SONY (2018) Green Partner Certificate

5150
Appendix 3Environmental Awards & Recognitions
Environmental Awards and Recognitions
EMAS Certificate of Registration, presented by the Malta Standards Authority
Stratospheric Ozone Protection Award for corporate leadership in eliminating Ozone
Depleting Substances, presented by the US Environment Protection Agency
Silver Environmental Award for the Energy Consumption Reduction Improvement
Team, presented by the STMicroelectronics Worldwide Back-end Manufacturing
1st Prize in the Environment Award for Industry 2001, presented by Cleaner
Technology Centre
The Management Award for Sustainable Development in the European Awards for the
Environment, presented by the European Commission
Honourable Mention, Environment Award for Industry 2002, presented by Cleaner
Technology Centre
1st product made with recycled waste resin, presented by Citrya
Best Effort in Clean up the World Campaign
EMAS Award participation trophy, presented by the European Commission
Most Improved Plant for EHS, awarded by STMicroelectronics Packaging & Test
Manufacturing
EMAS Award participation trophy, presented by the European Commission
EMAS Award participation trophy, presented by the European Commission
1st Prize in the Sustainable Enterprise Award, presented by the Ministry for Economy,
Investment and Small Businesses
National Pioneer EMAS Award, presented by the European Commission
Special Certificate for Continuing Commitment to Environment Protection in the
Environment Award for Industry 2015, presented by Cleaner Technology Centre
Associate of the Energy Efficiency Partner Initiative as per 2012/27/EU, presented by
the Sustainable Energy and Water Conservation Unit
Most improved plant in EHS award, presented by STMicroelectronics Back-end
Manufacturing & Technology
Environmental awards and recognitions | Table 9
Date
1995
1997
1998
2001
2002
2002
2002
2003
2005
2011
2014
2015
2015
2015
2016
2016
2017
Appendix 4Environmental Permits & Registrations
Subject
Environmental Permit
Public Sewer Discharge Permit
EMAS certificate of registration
Registration as a Packaging Producer
Registration as a Producer of Electronic and Electric Equipment
REWS authorisation for secondary storage of diesel
REWS permit authorisation for secondary storage tank of LPG
REWS Authorisation for the Operation of a petroleaum-Filling Station
Environmental permits and registrations | Table 10
Expiry of Current Permit
12/06/2022
awaiting
WSC
29/12/2020
31/03/2021
31/03/2021
01/01/2022
10/08/2030
29/10/2028
Date of Current Permit
12/07/2018
awaiting
WSC
30/12/2017
01/04/2020
01/04/2020
02/01/2018
11/08/2020
30/10/2018
PermitRef
EP043/09/E
DMU4103
MT-00001
WMP/05/07
WME/52/14
SSF/45
SS 319
CFS/09
BGA
Co2
dB(A)
EHS
EICC
EMAS
GHG
H
MEMS
Mpin
Ball Grid Array
Carbon Dioxide
A-weighted decibels
Environment, Healthy and Safety
Electronics Industry Citizenship Coalition Code of Conduct
Eco-Management and Audit Scheme
Greenhouse Gas
Half of a year (six months)
Micro Electro Mechanical Systems
Million pin
Acronyms
MTCO2E
Munit
P&P
PS
Q
QFP
SF6
VOC
WEEE
WWTP
YTD
Metric Tons CO2 Equivalent
Million unit
Packing and Packaging
Point Source
Quarter of a year (three months)
Quad Flat Pack
Sulfur Hexafluoride
Volatile Organic Carbons
Waste Electrical and Electronic Requipment
Wastewater Treatment Plant
Year to date, referring to the period of January to June

5352
Appendix 5Site Environmental Policy
54© STMicroelectronics - January 2021 - Printed in Malta - All rights reserved
ST and ST logo are registered and/or unregistered trademarks of STMicroelectronics International NV or its affiliates in the EU and/or elsewhere. In particular, ST and ST logo are Registered in the US Patent and Trademark Office.
For additional information about ST trademarks, please refer to www.st.com/trademarks. All other product or service names are the property of their respective owners.
For more information on ST products and solutions, visit www.st.com
020465
RECYCLED Paper made fromrecycled material


