
9787/17 ADD 5 SD/MI/lv
DG G 3 C EN
Council of the European Union
Brussels, 31 May 2017 (OR. en) 9787/17 ADD 5 RECH 211 COMPET 454 IND 142 MI 458 EDUC 272 TELECOM 148 ENER 255 ENV 551 REGIO 65 AGRI 289 TRANS 227 SAN 224
COVER NOTE
From: Secretary-General of the European Commission, signed by Mr Jordi AYET PUIGARNAU, Director
date of receipt: 29 May 2017
To: Mr Jeppe TRANHOLM-MIKKELSEN, Secretary-General of the Council of the European Union
No. Cion doc.: SWD(2017) 221 final - PART 6/16
Subject: COMMISSION STAFF WORKING DOCUMENT INTERIM EVALUATION of HORIZON 2020 ANNEX 1
Delegations will find attached document SWD(2017) 221 final - PART 6/16.
Encl.: SWD(2017) 221 final - PART 6/16

EN EN
EUROPEAN COMMISSION
Brussels, 29.5.2017
SWD(2017) 221 final
PART 6/16
COMMISSION STAFF WORKING DOCUMENT
INTERIM EVALUATION
of
HORIZON 2020
ANNEX 1
{SWD(2017) 220 final}
{SWD(2017) 222 final}
376
M. IMPACT OF THE NEW MANAGEMENT MODES ON THE PERFORMANCE OF HORIZON 2020
– FOCUS ON EXECUTIVE AGENCIES
M.1. Background
New Management Modes are a new way to manage implementation activities in the field of
EU research and innovation. Their first major use was in the Seventh Framework
Programme (FP7) when two Executive Agencies1 and five Joint Undertakings were
established2 with the aim to support Commission activities with a more focused and efficient
toolset tailored specifically to the implementation of FP7. As the political importance and
budgetary weight of research programmes increased, the Commission began looking into
alternative methods of accomplishing these goals.
With the substantial increase in budget allocated to Horizon 2020 (EUR 74,8 billion
compared to EUR 55 billion for FP7) and with the available human resources becoming
more and more scarce over its duration (5% staff reduction over 2014-2020 period), the
Commission has to make the best use of reduced human resources by focusing on its core
institutional tasks, such as policy-making, implementation and monitoring of the application
of EU law, and strategic management, whilst guaranteeing the most effective and efficient
implementation of spending programmes for which it remains ultimately responsible.
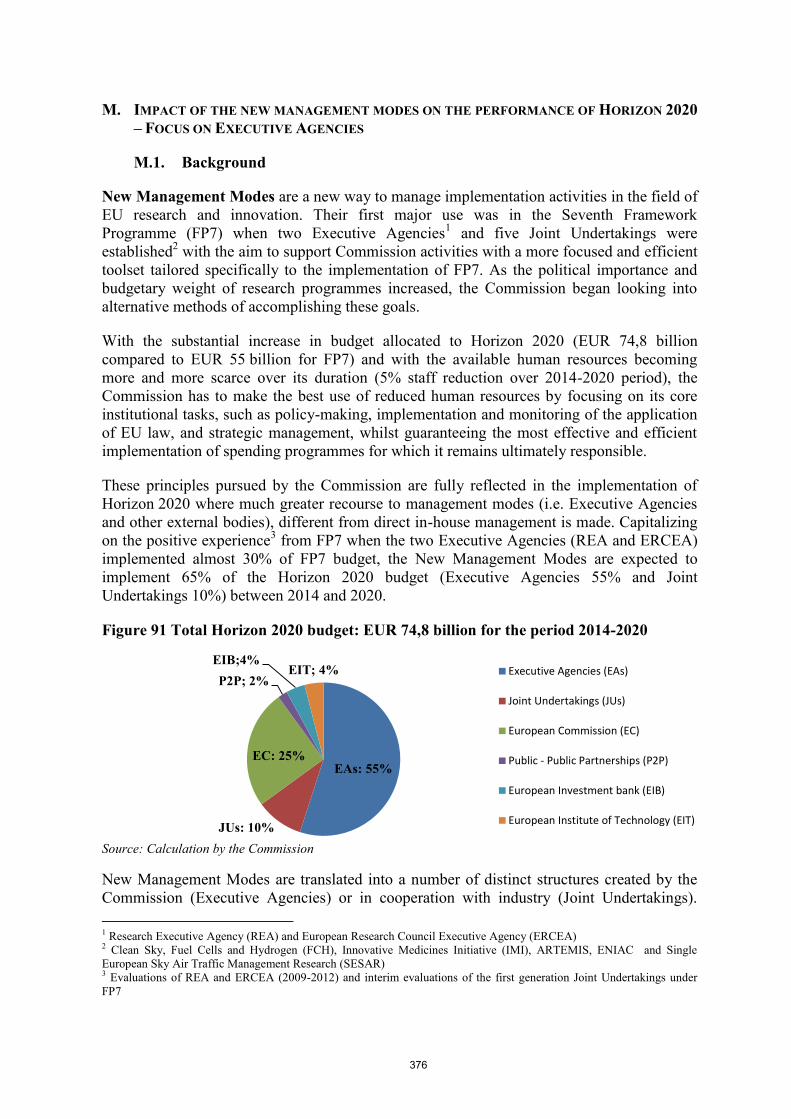
These principles pursued by the Commission are fully reflected in the implementation of
Horizon 2020 where much greater recourse to management modes (i.e. Executive Agencies
and other external bodies), different from direct in-house management is made. Capitalizing
on the positive experience3 from FP7 when the two Executive Agencies (REA and ERCEA)
implemented almost 30% of FP7 budget, the New Management Modes are expected to
implement 65% of the Horizon 2020 budget (Executive Agencies 55% and Joint
Undertakings 10%) between 2014 and 2020.
Figure 91 Total Horizon 2020 budget: EUR 74,8 billion for the period 2014-2020
Source: Calculation by the Commission
New Management Modes are translated into a number of distinct structures created by the
Commission (Executive Agencies) or in cooperation with industry (Joint Undertakings).
1 Research Executive Agency (REA) and European Research Council Executive Agency (ERCEA) 2 Clean Sky, Fuel Cells and Hydrogen (FCH), Innovative Medicines Initiative (IMI), ARTEMIS, ENIAC and Single
European Sky Air Traffic Management Research (SESAR) 3 Evaluations of REA and ERCEA (2009-2012) and interim evaluations of the first generation Joint Undertakings under
FP7
EAs: 55%
JUs: 10%
EC: 25%
P2P; 2%
EIB;4% EIT; 4% Executive Agencies (EAs)
Joint Undertakings (JUs)
European Commission (EC)
Public - Public Partnerships (P2P)
European Investment bank (EIB)
European Institute of Technology (EIT)

377
Though separate legal entities, they are bound to the common objectives through legal
means (Council Regulations or Establishment and Delegation Acts), political and budgetary
arrangements (they implement parts of the Union budget and are accountable to the College
or to the Parliament) and internal management arrangements put in place to monitor and
supervise their activities.
Currently, there are six Executive Agencies of which four are part of the Research family
and implement delegated Horizon 2020 tasks, namely: the Executive Agency for Small and
Medium-sized Enterprises (EASME), the European Research Council Executive Agency
(ERCEA), the Innovation and Networks Executive Agency (INEA) and the Research
Executive Agency (REA). They all have a different mission, from supporting small and
medium-sized enterprises, to assisting with the construction of large trans-European
infrastructure networks, to managing big project portfolios of high visibility in Horizon
2020, to supporting the cutting edge research no matter where it comes from or in which
form (see table below).
Table 72 Four Executive Agencies and their role in Horizon 2020
ERCEA REA INEA EASME Horizon
2020
Horizon 2020 delegated tasks
(number)
1 8 2 4 22
Delegated budget 2014-2020 (€
billion)
12,7 13,9 6,4 6,9 74,8
% of total Horizon 2020 budget 16.9% 18.1% 8.3% 8.9% 100%
Source: Delegation Acts
M.2. Setting up Executive Agencies under Horizon 2020
M.2.1. General framework
Since the very beginning of FP7, the Commission has been committed to ensuring good
coordination between the different Commission services implementing the programme. For
this purpose, the Commission has set up a range of mechanism (e.g. Research Enquiry
Service) for identifying and resolving instances of incoherent treatment by different
Commission services.
With the launch of Horizon 2020, the Commission decided to make more extensive use of
the existing Executive Agencies and entrusted the execution of 55% of the Horizon 2020
budget by delegating implementation tasks to them. The Commission has been conscious of
the potential risks associated with the more extensive recourse to Executive Agencies such
as, for example, increased fragmentation of Horizon 2020 implementation efforts and
ensuring a high level of transparency and effective coordination processes, clarity of roles
and responsibilities between the Commission and agencies as well as increased demand for
monitoring, governance and control arrangements. For these reasons, it introduced a number
of concrete rules and measures to ensure a coherent and harmonised implementation
process.

378
Under Horizon 2020, a single set of rules on reimbursement rates, evaluation and
grant management applies across the board, regardless of which implementing body
is managing the delegated parts of the programme. Simpler guidance and advisory
services to applicants and participants are provided through a unique IT portal, i.e.,
the Participant Portal.
Multi-annual Horizon 2020 work programmes are drafted with the participation of all
Horizon 2020 services designed to maximize the potential for synergies between
research and innovation programmes and minimize the risk for duplication of
research activities.
A Common Research Datawarehouse was set up, maintaining the complete Horizon
2020 historical data on submitted proposals and signed grant agreements, available to
and used by all Commission services.
Common rules have been developed relating to the feedback of results into policy
making as part of the 'Strategy for an Effective Dissemination and Exploitation of
Research Results in Horizon 2020'.
The Horizon 2020 Common Support Centre (CSC), hosted by DG RTD, is providing
services on legal support, business processes, IT systems and operations, programme
information and data, and ex-post audits. These services are provided to all DGs of
the Research and Innovation family and all Executive Agencies and Joint
Undertakings involved in the implementation of Horizon 2020.
Beside the CSC, the REA is providing common administrative and logistical support
services to the programme implementing actors, in particular support for the
evaluation of proposals, management of expert evaluators (contracting and paying)
and the validation of beneficiaries' legal status and financial data.
Both the CSC and REA's administrative and logistical support department are the
two facets of a centralised support aiming to provide a consistent application of the
single set of rules underpinning the implementation of Horizon 2020. Some of the
REA tasks have even been extended beyond Horizon 2020 to other programmes,
such as COSME, ERASMUS+, etc. as regards the validation of the legal entities and
verification of the financial capacity of participants.
M.2.2. Governance and division of responsibilities
The delimitation of responsibilities between the Executive Agencies and various parent DGs,
and the ERC Scientific Council (in the case of ERCEA4) is clear. Governance of each of the
Agencies is based on a well-developed framework providing detailed guidance on its
operation5, as explained below.
4 ERCEA is unique with respect to the rest of the other EAs in terms of mandate and the dual leadership under which the
Agency operates as the Dedicated Implementation Structure of the ERC. ERCEA is entrusted to handle the administrative
implementation and programme execution of the ERC actions and support the ERC Scientific Council in the conduct of all
its tasks.
5 The recent evaluations of REA and ERCEA concluded that no evidence regarding ‘micro-management’ was found. The
legal basis clearly distinguished the different roles of the Commission, the ERC Scientific Council in case of ERCEA and

379
Firstly, the political responsibility for the implementation of all parts of Horizon 2020
rests with the Commission which monitors the activities of the Executive Agencies on the
basis of the detailed legal provisions set inter alia in Council Regulation No 58/2003 and in
the respective Instruments of Delegation. More specifically, it is the Commission's
responsibility to strike the right balance between making sure that the Executive Agencies
are efficient and follow the instructions and objectives assigned to them as part of their
mandate while respecting the fact that they are separate legal entities with their own
leadership and management structures. Any attempt by the Commission to micro-manage by
interfering in the operation of an EA would be counter-productive, effectively leading to
duplication of roles and to a waste of resources and opportunities.
The Agencies are set up only to perform the tasks delegated by the Commission. The
division of tasks between the Commission services and the Agencies is clearly defined and
documented in the respective delegation acts;
The Commission’s departments perform tasks implying policy choices, in particular:
setting objectives and priorities, adopting work programmes (including financing
decisions), representing the Commission in the Programme Committees and adopting
award decisions subject to comitology.
The Agencies are responsible for implementing tasks, such as organising and carrying out
proposal evaluations, launching and concluding grant procedures, adopting, project
monitoring, financial control and accounting, and contributing to programme evaluation
and various support tasks.
The continuous coordination between the Commission and Executive Agencies on
procedures, tools and working arrangements ensures coherence and complementarities
and helps avoiding gaps in responsibilities or duplication of efforts. In addition, regular
contacts take place between the Executive Agencies and the parent DGs' services responsible
for the programmes that are implemented by the Executive Agencies These contacts take the
form of coordination meetings at Directors level, Head of Department/Head of Unit level
and contacts at working level. The Executive Agencies participate to the weekly Directors
meetings of their parent DGs. In addition, the Executive Agencies are involved in the
structures governing Horizon 2020 – challenge groups, cross-cutting issues groups, steering
committees and thematic working groups as well as in the governance of the Common
Support Centre (Executive Committee, Business Process steering committees and user
groups).
M.3. Assessment of implementation of Horizon 2020 activities delegated to the
Executive Agencies
M.3.1. Calls management
Since the start of Horizon 2020 in 2014, 148 calls launched by the Executive Agencies were
concluded by September 2016. The legal provisions along with the common rules,
procedures and IT tools catered by the CSC contributed significantly towards an increased
the agencies. The Steering Committees were efficiently used by the Commission as the key instrument for day-to-day
management of the Agencies.
380
harmonisation of project implementation practices and effective coordination among
Horizon 2020 implementing services, be them in Executive Agencies or in the Commission.
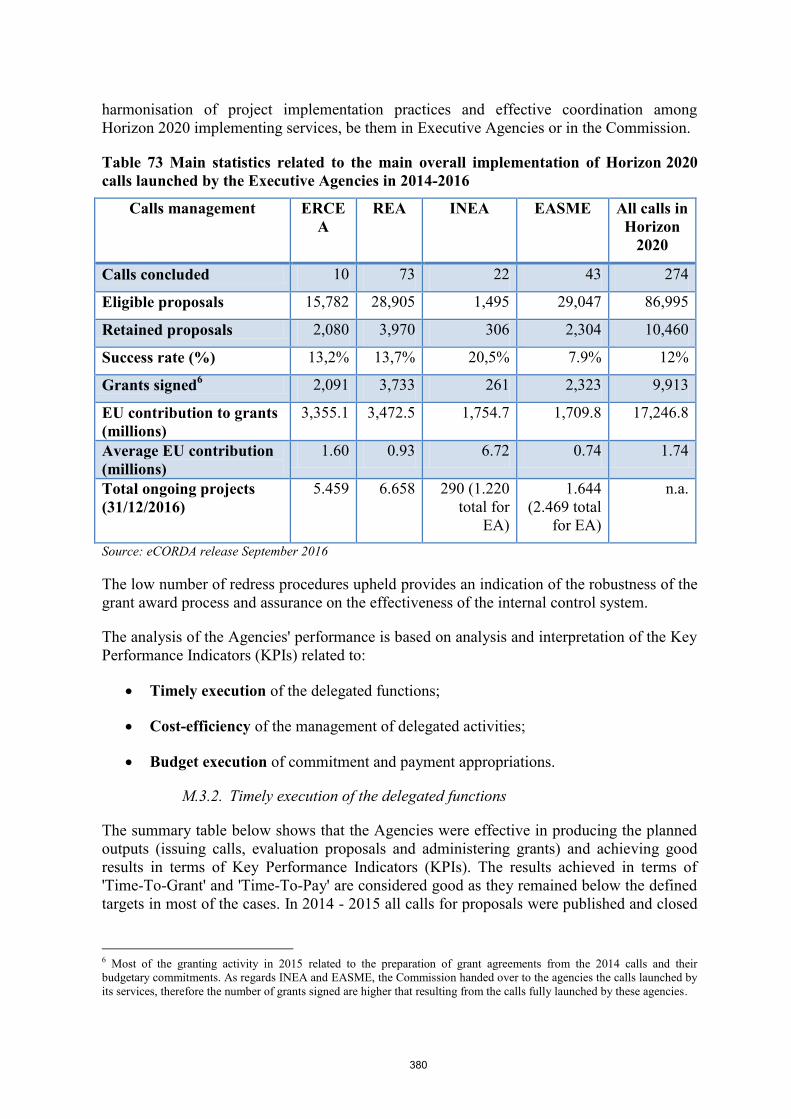
Table 73 Main statistics related to the main overall implementation of Horizon 2020
calls launched by the Executive Agencies in 2014-2016
Calls management ERCE
A
REA INEA EASME All calls in
Horizon
2020
Calls concluded 10 73 22 43 274
Eligible proposals 15,782 28,905 1,495 29,047 86,995
Retained proposals 2,080 3,970 306 2,304 10,460
Success rate (%) 13,2% 13,7% 20,5% 7.9% 12%
Grants signed6 2,091 3,733 261 2,323 9,913
EU contribution to grants
(millions)
3,355.1 3,472.5 1,754.7 1,709.8 17,246.8
Average EU contribution
(millions)
1.60 0.93 6.72 0.74 1.74
Total ongoing projects
(31/12/2016)
5.459 6.658 290 (1.220
total for
EA)
1.644
(2.469 total
for EA)
n.a.
Source: eCORDA release September 2016
The low number of redress procedures upheld provides an indication of the robustness of the
grant award process and assurance on the effectiveness of the internal control system.
The analysis of the Agencies' performance is based on analysis and interpretation of the Key
Performance Indicators (KPIs) related to:
Timely execution of the delegated functions;
Cost-efficiency of the management of delegated activities;
Budget execution of commitment and payment appropriations.
M.3.2. Timely execution of the delegated functions
The summary table below shows that the Agencies were effective in producing the planned
outputs (issuing calls, evaluation proposals and administering grants) and achieving good
results in terms of Key Performance Indicators (KPIs). The results achieved in terms of
'Time-To-Grant' and 'Time-To-Pay' are considered good as they remained below the defined
targets in most of the cases. In 2014 - 2015 all calls for proposals were published and closed
6 Most of the granting activity in 2015 related to the preparation of grant agreements from the 2014 calls and their
budgetary commitments. As regards INEA and EASME, the Commission handed over to the agencies the calls launched by
its services, therefore the number of grants signed are higher that resulting from the calls fully launched by these agencies.

381
according to the plans of in the respective work programmes. The KPIs achieved in 2016
demonstrated an improvement compared to the results achieved in 2014 and 2015.
Table 74 Summary tables for 2014, 2015 and 2016 on key indicators related to the
timely execution of the delegated functions – Executive Agencies
Call management (2016) ERCEA REA INEA EASME
Average Time to Inform (target -153 days) From 77 to
207 days
132 120 117
Average Time to Grant (target 245, ERCEA -
400)
399 193 226 224
Average Time to Pay (% on time within legal
deadlines)
98,8% 95,4% 100% 96%
Average evaluation cost per proposal - external
experts paid/ total number of proposals evaluated
€1.335 1.471 n.a. n.a.
Call management (2015) ERCEA REA INEA EASME
Average Time to Inform (target -153 days) From 94 to
164 days
142 139 131
Average Time to Grant (target 245, ERCEA -
390)
357,7 203 224 239
Average Time to Pay (% on time within legal
deadlines)
89,2% 96% 100% 94%
Average evaluation cost per proposal - external
experts paid/ total number of proposals evaluated
(% of the amount recommended for funding)
0,07% <2% 0,05% n.a.
Call management (2014) ERCEA REA INEA EASME
Average Time to Inform (target -153 days) From 118
to 133
141 152 n.a.
Average Time to Grant (target 245, ERCEA -
390)
173 217 238 240
Average Time to Pay (% on time within legal
deadlines)
91.4% 97% 100% 98%
Source : Annual Activity Reports 2014-2016, calculation by the Commission. Data refers to Horizon 2020
activities only
M.3.3. Cost-efficiency of the management of delegated activities
According to the financial regulation (Article 30), the principle of economy requires that the
resources used by the institution in pursuit of its activities shall be made available in due
time, in appropriate quantity and quality and the best price. The principle of efficiency
concerns the best relationship between resources employed and results achieved.
Efficiency for this analysis is defined as the ratio between inputs (staff) and outputs (the
budget managed by the Agency). The indicators for measuring efficiency are the ratio
between the administrative and operational budget (%) and the budget "per staff head" (€
million). The estimated average budget managed by 'head' for all Executive Agencies in the

382
Commission Communication7
was expected to increase from € 3,47 million in 2013 to €4,6
million per staff member in 2020.
Table 75 – Overview of administrative efficiency in Executive Agencies
Administrative efficiency 2016 ERCEA REA INEA EASME
Programme management cost ratio
(administrative/ operational budget)
2.75 % 2,6% (3,6%
with CSS)
0.77% 2,7 %
Research project - budget 'per head' (EUR
million)
4,42 3,28 11,4 5,2 (all EA
projects -3,8)
Average number of running research projects
per staff member (operational activities)
17 36 6,7 9 (all EA
projects -7,2)
Source: Annual Activity Reports 2016, calculation by the Commission.
The differences in the cost ratios, the overall number of running projects and the average
number of projects per staff can be explained by the different portfolios as well as nature of
projects of each agency which vary in terms of grant size, number of participants, duration
and number of transactions involved.
In order to allocate and mobilise human resources in a timely manner, REA developed a tool
for staff allocation based on workload measurement on the basis of the Cost Benefit
Analysis (CBA) model used at the time of the extension of REA's mandate in 2013. REA
runs the workload simulation every year at the time of establishing the Annual Work
Programme of the next year and allocates the resources accordingly.
In the same manner, ERCEA has developed workload indicators which are used on a yearly
basis for the purposes of establishing the staff allocation of the following year. The workload
estimations are revised annually taking into account the volume of transactions reported at
the end of the year.
As regards INEA, a workload analysis was prepared and revised each time the estimated
figures on the number of projects managed are updated. When necessary, the recruitment
and staffing plans are revised in order to balance the workload and temporary support can be
given from one unit to another.
Finally, based on the methodology of the recent common Cost Benefits Analyses, EASME
developed a pragmatic and cost-effective approach for a workload assessment that was first
performed in 2016. The assessment will serve as an input to the Agency staffing plans for
2017.
M.3.4. Budget execution of commitment and payment appropriations in 2014-
2015
All Agencies managed to execute their available budget almost at 100%, with the exception
of payments out of the administrative budget.
7 Communication to the Commission on the delegation of the management of the 2014-2020 programmes to executive
agencies (SEC(2013)493). 8 This does not include the REA staff providing the administrative and logistical central support services

383
Table 76 Budget execution in Executive Agencies
Budget execution 2014-2016 ERCEA REA INEA EASME
Operational budget
Budget execution (% to Commitments) 99,90% 100% 100% 100%
Budget execution (% to Payments) 100% 100% 100% 100%
Administrative budget
Budget execution (% to Commitments) 99,42% 99,40% 98.86% 99%
Budget execution (% to Payments) 93,45% 91,79% 96.14% 89,7%
Source: Annual Activity Reports 2014-2016, calculation by the Commission
M.3.5. Monitoring, dissemination and exploitation of research results
The existing monitoring arrangements and reporting obligations allow for an effective
provision of evidence for policy making. Specifically, supervision and monitoring of the
Executive Agencies is ensured by the drafting and submitting to the Commission of detailed
activity reports on a bi-annual basis. In order to harmonise the periodic reporting as much as
possible among the different Executive Agencies and Joint Undertakings, a set of common
KPIs and reporting templates have been designed.
The Strategy for an Effective Dissemination and Exploitation of Research Results in
Horizon 2020 was adopted in September 2015 and applies to all Horizon 2020 implementing
services including the Executive Agencies. The objective of the strategy is to increase the
availability of outputs stemming from EU funded research and innovation projects and thus,
increase their use in different contexts, such as having an impact on commercial markets,
helping create jobs and growth and supporting policies in tackling societal challenges.
Against this background, the strategy aims at outlining how the European Commission will
support and enhance the dissemination and exploitation activities of the project consortia,
and how it will benefit from the Horizon 2020 project results as input into its policy making
and programming activities.
Taking into account that the implementation of Horizon 2020 has been delegated to a large
extent to Executive Agencies, it is essential to ensure that there is no interruption in the flow
of research results from projects and programme implementation into policy making and
programming. The roles and competences of everyone involved have been defined in the
revised Memoranda of Understanding between parent DGs and the respective Executive
Agencies (signed in 2015).
M.3.6. Proximity to beneficiaries
The delegation of certain parts of Horizon 2020 has enabled the agencies to focus their
existing communication and outreach channels, which have developed over time to keep
them close to beneficiaries and to improve the EU's visibility as the promoter of the
programmes. In particular, the agencies provide an increased level of direct exchanges with
beneficiaries through info days, kick off meetings for larger and multi-annual projects, and
monitoring visits. At the same time, all potential beneficiaries have a single entry point.
In 2015 ERCEA continued its tailor-made services for ERC beneficiaries. Four training
conferences for Principal Investigators (PIs) have been organised (in Brussels, Sweden,

384
Spain and Austria). The aim of these conferences is primarily training PIs on procedures and
rules and facilitation of a dialogue amongst ERC grantees. Almost 200 PIs attended these
events and like in previous years, these training events were very well received.
The REA cooperates closely with the parent DGs on communication throughout its project
portfolio. It organise regular information days for proposers in Brussels and abroad,
coordinators' days for running projects and various other events related to the projects and
actions, in close collaboration with the parent DGs.
INEA mainly focused on two aspects. The first one is consolidating the stakeholders and
facilitating and preparing the communication aspects of project management relationships
with its key Horizon 2020 stakeholders – potential applicants and beneficiaries – to promote
funding opportunities. A total of 6.189 participants registered in Horizon 2020 events (e.g.
info days) organised by INEA in 2015 and 2016, and another 11.544 followed the events and
presentations online via web-streaming. 89,2% of the participants expressed their
satisfaction with these events. The events attracted 54,5% new participants in transport and
62% in energy sectors. The second is organising workshops with the representatives of the
ongoing projects on selected themes, such as geothermal energy, carbon capture and storage,
smart cities and communities, intelligent transport systems and urban mobility, in order to
encourage the projects to work together, to avoid duplication and promote synergies,
particularly in the dissemination and communication aspects of projects.
Three info days for Horizon 2020 beneficiaries were organised by EASME in 2015 and were
attended by close to 2.000 participants on site and several hundred on line, learning more
about upcoming calls for proposals. These events were very successful and had a very high
satisfaction rate. In addition, the Agency promoted the delegated programmes via
newsletters, on social media and during major events (such as, for example, the EU
Sustainable Energy week, Green Week, SME – instrument Innovation Summit).
M.4. Main findings and conclusions from the recent evaluations of ERCEA and
REA operations
The recently completed evaluations of the operations of ERCEA and REA cover the period
from July 2012 to July 2015, encompassing two different Framework Programmes (Seventh
Framework programme and Horizon 2020). The compulsory 3 year evaluations of the other
two Agencies that implement Horizon 2020 (INEA and EASME) will be carried out in 2017
and will cover the operations of these Agencies during the period 2014-2016. The main
conclusions drawn from the two parallel evaluation exercises are as follows.
The establishment of the two Executive Agencies resulted in significant savings to the EU
budget in comparison to the alternative options as shown by the retrospective CBAs (Cost-
Benefit Analyses) for 2012-2015. Overall, the results indicated that the Executive Agency
scenario remained considerably more cost-effective than the in-house scenario, generating
substantial savings to the EU budget.
As regards ERCEA, the analysis revealed that the actual costs of the Agency in 2012-2015
were by EUR 20.6 million (12%) lower than the initial estimation due to cost savings in
overheads. On the other hand, actual staff related expenditure exceeded estimations for the
period 2014-2015 because of higher than expected actual average staff costs. The actual
cost savings of the ERCEA scenario amounted to 23% in comparison to the in-house
385
Commission scenario. In real terms, the actual savings from the programme delegation to
the ERCEA in 2013 were very close to the initial CBA estimations, EUR 46.5 million
compared to EUR 44.6 million.
Similarly, the retrospective CBA analysis for REA revealed that the actual costs of the REA
in 2012-2015 were by EUR 34.8 million (15%) lower than the initial estimation due to cost
savings in the staff and infrastructure expenditure. The actual cost savings of the Executive
Agency scenario amounted to 21% in comparison to the in-house Commission scenario.
The actual savings from the programme delegation to the REA in 2013 were 24% higher
than the initial estimations, EUR 53.4 million compared to EUR 43.1 million.
The last evaluation of INEA (ex. TEN-EA) confirmed that the programme implementation
(TEN-T Programme) by the Agency during the period 2011-2013 proved to be better 'value
for money' in comparison to the DG MOVE in house scenario. The cost savings were
estimated to EUR 8.8 million.
The results of the CBA from the last evaluation of EASME (ex EACI) covering the 2011-
2013 period revealed considerable cost savings due to the Agency scenario, estimated
between EUR 27 million and EUR 36 million, depending on the extent to which the
Commission would use Contract Agents staff to carry out the delegated activities. The
evaluation concluded that the Agency effectively and efficiently implemented the
programmes entrusted to it.
The initial identification of tasks entrusted to the Executive Agencies and the produced
savings are still valid for justifying the outsourcing.
The mandates of ERCEA and REA remain highly relevant to the needs of the Commission
and the Agencies' applicants/beneficiaries for the remaining part of the programming period
(from mid-2015 to 2020).
The ERCEA and REA performed in an efficient and cost-effective way in implementing
the delegated programmes during the period 2012-2015.
The recent evaluations concluded that the process of grant management was judged to be
very efficient in ERCEA and efficient in REA. Both Executive Agencies were effective in
achieving objectives and producing planned outputs during the reference period (2012-
2015). Despite increases in the operational budget and the number of proposals, the ERCEA
and REA achieved good results in terms of main KPIs. The results achieved in terms of
'Time-To-Grant' and 'Time-To-Pay' are good and remained below the defined targets in most
cases.
The two Executive Agencies not only improved management of the programme, but also
rendered better services to the various stakeholders.
More specifically, the ERCEA beneficiaries' survey reported 93% of the respondents being
very satisfied or satisfied with the services provided by the ERCEA. The overall satisfaction
rate demonstrated an increasing trend during the 2011-2014 period (from 89% in 2011 to
93% in 2014). Moreover, an impressive 95% of independent experts were satisfied with the
services provided by the ERCEA. The REA beneficiaries' survey indicated 82% satisfaction
rate with regard to performance, up from 78% in 2011. In the area of support services (the
REA contracts and pays all expert evaluators), 98% of the independent experts were satisfied

386
with the service of the REA and expressed their willingness to work with REA as an
independent expert again in the future.
Externalisation of the research and development activities to the Executive Agencies allowed
the Commission services to better focus on policy-making by freeing up resources for
policy-related tasks and enabling a greater emphasis on their exercise. The benefits of
outsourcing that have been actually realised would not have occurred had Commission staff
worked on both policy-related issues and programme and project management at the same
time.
In conclusion, the ERC has become a recognised success of the FP7, having established
itself as an indispensable component of the European Research Area highly regarded for the
quality and efficiency of its operations. The level of competition in Horizon 2020 guarantees
excellence (success rate barely superior to 10%) and ERC grant is synonymous of Scientific
Excellence for the worldwide scientific community.
As regards REA, the largest Executive Agency in terms of staff, it delivered a high quality
and effective service to FP7 and Horizon 2020 participants and other stakeholders through
its central support services, contributing significantly to a more consistent application of the
Horizon 2020 rules.
As regards the other two agencies, INEA and EASME, during 2014-2015 the agencies grew
considerably in size and were heading towards cruising speed. In 2015 the Executive
Agency demonstrated their readiness to perform and implement the delegated activities and
have in place the necessary arrangements to accommodate the new programmes. The main
success would be the launch of Horizon 2020 calls in areas where no pre-existing research
expertise or base existed and full project cycle management of the delegated programmes
following the end of transitional arrangements when certain phases of the project life cycle
were managed in house by parent DGs.

387
N. THE IMPACT OF SIMPLIFICATION AND THE NEW FUNDING MODEL
N.1. Context and legal requirements – Horizon 2020 new funding model
The funding model of Horizon 2020 comprises major simplification compared to the model
used in the predecessor programme. In FP7, the reimbursement to which a project is entitled
is determined via a complex matrix of organisation categories and activity types, making the
financial management of the grant difficult and restricting the flexibility of the consortium in
the implementation of the project. Moreover, for the calculation of indirect costs (overheads)
in FP7, four different methods exist (two flat rate models, depending on the organisation
categories; real indirect costs and a simplified method of determining real indirect costs). In
particular, the real indirect cost options are a considerable source of financial errors.
The policy rationale for the Commission's proposal for the Horizon 2020 funding model was
the following:
To put the focus on the costs that are directly related to the project
To simplify the financial management of projects, by a reduced complexity of the
financial rules
To reduce the financial error rate detected in ex-post audits
To increase legal certainty for beneficiaries
To increase the attractiveness and ease of access to the programme, in particular for
newcomers, smaller actors, SMEs and industry
To contribute to the acceleration of the granting processes
Consequently, the funding model of Horizon 2020 is based on two main features:
A single reimbursement rate in a given project, without differentiation between
organisation categories or types of activities. The reimbursement rate is up to 100%
of the eligible costs for Research and Innovation Actions and up to 70% for
Innovation Actions (with one exception: non-profit organisations are reimbursed
100% also in Innovation Actions).
A single flat rate for contributing to the indirect costs. This flat rate of 25% is
applied to the direct costs9.
The results of a survey, addressed to all participants of signed Horizon 2020 grants in
September 2015, show that an overwhelming majority of the respondents having experience
with FP7 appreciate the new simplified funding model of Horizon 2020.
9 Except costs for subcontracting, costs of financial support to third parties and in-kind contributions not used on the
beneficiary's premises

388
Figure 92 How beneficial is the introduction of a single reimbursement rate for the
project?
Figure 93 How beneficial is the introduction of a single flat rate for indirect costs?
More than 77% of the respondents consider the single reimbursement rate in a project as a beneficial simplification. More than 74% welcome the single flat rate for indirect costs.
Another feature of the Horizon 2020 funding model is the additional remuneration scheme (Article 27.2 of the Rules for Participation) introduced during the legislative process by the legislator. The feedback received from Member States' representatives and stakeholders indicates that its implementation is complex. Besides, it has a negative financial effect on those beneficiaries whose usual remuneration practices are based on very variable levels of remuneration.
In some Member States the salaries of researchers in the public sector are strongly dependent on availability of external funding. Under those remuneration schemes, project-triggered remuneration may count, for example, for as much as two third thirds of the total salary of the employee. That leads to situations where the cap of EUR 8 000 results in the ineligibility of a substantial part of the personnel costs. For certain groups of beneficiaries the provisions on additional remuneration imply that the eligible personnel costs for the same person for the same work are lower in a Horizon 2020 action than in a FP7 project.

389
N.2. The impacts of the new model on attractiveness, accessibility and
participation in Horizon 2020
While a direct causal relationship between the funding model and the observed participation
figures cannot be established, the statistics on participation show clearly that Horizon 2020
is highly attractive. About 120,000 proposals were submitted so far. The oversubscription
rate (in terms of requested EU budget) is more than 8:1.
The programme attracts many newcomers (see Section R.3. Analysis of newcomers to
Framework Programme). Similarly, the programme attracts SMEs (see Section O. Analysis
of the companies participating in Horizon 2020). This shows the attractiveness of Horizon
2020 (including its funding model) for SMEs and newcomers.
Responding to the concerns of some large research organisations on the single flat rate for
indirect costs, the Horizon 2020 Rules for Participation provide for the "Large Research
Infrastructure" (LRI) scheme. To date, 13 entities (nine research organisations, three higher
education establishments, and one enterprise) have lodged a request for an ex-ante
assessment of the methodology for LRI.
Four entities (research organisations) have received a positive ex-ante assessment while 2
(research organisation) have been found not compliant. For five entities, the work is
ongoing. Two entities have voluntarily withdrawn their application.
In conclusion, the number of applicants for the LRI scheme remains modest – reflecting the
fact that overall only a few potential candidates comply with the set thresholds (minimum
value of the infrastructure of 20 M€; at least 75% of the asset value in the balance sheet is
research infrastructure).
This confirms that the thresholds as initially designed (i.e. targeting "large" infrastructure)
have achieved their objective: targeting large research organisations with expensive research
infrastructure and doing research as their core business.
N.3. The impacts of the new model on funding levels
The effective funding levels (EU contribution versus real project costs) in Horizon 2020 are
determined by the nominal reimbursement rates (100% or 70%) and the flat rate for indirect
costs (covering, on average, only a part of the real indirect costs). In FP7, the funding level is
a function of the organisation categories, the mix of types of activities in a project and the
choice by beneficiaries of the method for charging indirect cost (among the four existing
options).
In FP7, around 90% of participating universities and more than half of research
organisations use the 60% flat rate method for indirect costs and their reimbursement rate is
75%. For such organisations, the funding model of Horizon 2020 represents no major
change. Their funding levels, compared to FP7, are slightly increased (by about 4%). The
same applies to participations in projects under the European Research Council, for which
the only change from FP7 to Horizon 2020 is the increase of the flat rate for indirect costs
from 20% to 25%.
For industry and other organisations using in FP7 the real indirect cost option, the Horizon
2020 funding model represents a major change. A direct comparison of funding levels is not

390
possible. The average nominal funding level (EU contribution/ (direct costs + 25%) +
subcontracting)) for non-SME industry in Horizon 2020 is 64% (compared to 54% in FP7).
But this nominal funding level does not represent the effective funding level, as for these
entities the real indirect costs on average are higher than 25%.
An estimation of the effective funding level was made, based on the known real indirect
costs of the most frequent FP7 industry participants (non-SMEs) using the real indirect cost
option. This results in an estimated average real funding level for (non-SME) industry in
Horizon 2020 in the area of 58%, i.e. an increase of 4 percentage points compared to FP7
for this population of beneficiaries.
This moderate increase of the average effective funding level for non-SME industry did not
lead to a higher share of the total funding going to big industry. While overall industry
participation (including SMEs) has increased, the share in number of participations of non-
SME industry has decreased by 12% compared to FP7. The respective share in EU
contribution decreased even stronger by 28% compared to FP7. This is clear evidence that
the nominal increase of the reimbursement rate for (non-SME) industry, from 50% (35% for
demonstration activities) in FP7 to 100% (70% for Innovation Actions) in Horizon 2020, has
not lead to an increase of the share of EU funding going to this category of participants.
An overall direct comparison of funding levels on a programme level between FP7 and
Horizon 2020 is not possible, however estimations show that the average real funding level
in Horizon 2020 remains at the 70%, the same as in FP7.
N.4. Lessons learnt and areas for improvement
The expected benefits of the new funding model have largely materialised. A big majority of
the stakeholders appreciate the related simplification effects. The funding model is attractive
for newcomers and SMEs. Its reduced complexity contributes to the acceleration of the
granting process (88% of the grants in Pillars 2 and 3 are signed within 8 months from the
call deadline). The effects on the simplification of financial management in the projects and
on the error rate cannot yet be assessed, as very few financial reports were yet submitted and
no ex-post audits were yet finished.
During the inter-institutional negotiations on the Horizon 2020 Rules for Participation some
stakeholders raised concerns on potential detrimental effects of the proposed funding model
on certain categories of organisations:
The single 25% flat rate for indirect costs would deter organisations running big and
expensive research infrastructures, because their real costs would not be adequately
covered;
The 100% reimbursement rate would massively increase the share of EU contribution
going to big (non-SME) industry.
Concluding from the analysis of the data on the Horizon 2020 grants signed so far, these
effects have not materialised.
One area for improvement is the broader acceptance of beneficiaries' usual accounting
practice. Stakeholders indicate that there are still too many instances where they have to
collect data and information specifically for obligations in their Horizon 2020 grants, in

391
parallel to their usual accounting system. This concerns in particular the obligations on staff
time recording, the accounting for depreciation of equipment and for internally provided
consumables and services, the handling of personnel costs outside closed financial years and
some accounting detail for beneficiaries outside the Euro zone. The Commission has already
reacted to these concerns and adapted the Horizon 2020 model grant agreements accordingly
Another area for improvement concerns the unintended effects of the additional
remuneration scheme (Article 27.2 of the Rules for Participation) with the eur 8000 capping.
A change to the Horizon 2020 model grant agreement, providing that personnel costs for
researchers taking part in Horizon 2020 will be eligible at least at the level accepted in
national projects, is under preparation for providing a quick intermediate solution. For the
longer term, one could also consider a change to the Horizon 2020 rules for participation,
requiring a legislative procedure involving Parliament and Council.
As concerns more substantial changes, the European Court of Auditors has suggested that
the Commission should lean towards a trust-based approach in research funding and in this
respect should consider moving away from its current system of reimbursing beneficiaries
for proven costs, towards lump sum financing based on performance/results. The wider use
of output-based funding with lump sums has the potential to reduce drastically the financial
error rate and is also in line with the Commission's priority on Budget Focused on Results.
Such forms of funding aim to shift the focus from checking inputs (i.e. costs incurred) to
monitoring performance and outcome, covering the entire project life cycle, including new
ways of ex-post audits. The revised Financial Regulation provides a fresh opportunity for an
extended use of such simplified forms of funding (flat rates, unit costs, lump sums) and in
particular for funding based on results/output/performance/fulfilment of conditions. In
Horizon 2020 output-based funding with a lump sum is currently used only for the SME
instrument phase 1 and there are only very few R&I funding programmes worldwide with
similar schemes that could serve as an example. The challenge with funding based on
output/results/performance in the field of research is to define the conditions for the payment
of the lump sum. These conditions must take into account the intrinsically risky nature of
research and innovation projects (i.e. unexpected scientific results or no results despite
honest effort or the falsification of a scientific hypothesis must not be a reason for not paying
the lump sum).
On this basis, the Commission is reflecting on some pilot actions on output-based lump sum
funding within the last Horizon 2020 work programme (2018-2020), in view of the
preparation of the next R&I Framework Programme.

392
O. ANALYSIS OF THE COMPANIES PARTICIPATING IN HORIZON 2020
A summary of the main findings on companies participating in Horizon 2020 is as follows:
12,324 private for profit companies (PRC) take part in Horizon 2020, making up 62.5
% of all participants (02/2017).
EUR 6.841 billion or 28 % of the total Horizon 2020 granted budget was awarded
to companies (02/2017).
An average Horizon 2020 company has 1,715 employees and EUR 708 million
revenue a year (2014). However, most of the companies have revenue around EUR
4.5 million.
The most frequent Horizon 2020 company was created in 2012 and the average
company in 1997.
The average EC contribution to a unique Horizon 2020 company amounts EUR
555,125. The most frequent grant amounts EUR 50,000.
Bigger companies (in terms of revenues and number of employees) receive larger
grants.
Most of the Horizon 2020 companies are from the Professional, Scientific and
Technical activities sector (33 %), the Manufacturing sector (27 %) and the
Information and communication sector (17 %).
Start-ups: 23 % of Horizon 2020 companies are less than 5 years old.
SMEs: 77 % of Horizon 2020 companies have less than 250 employees and 74 %
have revenues up to EUR 50 million.
More than half of the Horizon 2020 companies come from Germany, Spain, the
United Kingdom, Italy, and France, while Czech Republic, Romania, Estonia,
Slovakia, Cyprus, Bulgaria, Luxemburg, Lithuania, Croatia, Latvia, and Malta
each contribute less than1 %of Horizon 2020 companies.
83 % of companies are from EU15 (89 % of grants), 9 % from EU13 (6 % of
grants) and 8 % from outside EU (5 % of grants).
Horizon 2020 private for profit companies (further referred to as Horizon 2020 companies)
were analysed on their country, age, employment, revenue, and economic sector. For this,
companies from the CORDA database were matched with their data in ORBIS, a database of
company data10
. The analysis is based on 10,128 successful matches for companies in the 28
EU Member States. Since the data on the country of origin and grants originates from
CORDA, non-Member States' participation is included.
As of mid-February 2017, 12,324 unique companies take part in Horizon 2020, making up
62.5 % of all distinct Horizon 2020 participants. 1,848 companies participated in more than
one project. Overall, EUR 6.841 billion or 28 % of total so far granted Horizon 2020 budget
10 Cut-off 16 January 2017. OrbisEurope was used, covering 38 countries: the EU-28 plus countries in Europe that are
associated to Horizon 2020 (such as Norway, Iceland, Switzerland, Turkey). Countries outside Europe, such as Israel, are
not covered in OrbisEurope. For the matching, companies' names were used as an identifier, using the batch search option
of OrbisEurope. Out of the 12,324 companies in Horizon 2020, 10,128 companies were successfully matched to their Orbis
data.

393
went to companies.11 An average grant per company amounts EUR 555,125 and most frequent amount granted is EUR 50,000, what indicates that the companies frequently obtain the SME Instrument phase I support.
Figure 94 Horizon 2020 distinct participants by type and EC contributions (N = 19,796)
Source: European Commission, based on Corda data 15/02/2017
O.1. Company sectors by age and grants
Horizon 2020 companies were sorted on their sector, using the main NACE code12. This classification comes with a caveat: companies can operate in more than one sector, especially big companies but also new companies that combine e.g. finance and ICT. However, it is the only classification available.
Younger Horizon 2020 companies come from more sectors than older ones. Companies set up since 1990 are active mainly in Professional, scientific and technical activities and Information and communication, next to Manufacturing sector. Additionally, slowly rising are Construction, wholesale and retail trade and Administrative sectors. Older companies are mainly active in Manufacturing. In the last decade, their share has decreased compared to 2000s, while the share of Professional, scientific and technical activities sector and Information and communication sector stayed relatively unchanged Figure 95.
11 Taking into regard total number of participations rather than distinct participants, companies (PRC) and higher and secondary education (HES) each represents 33 % of participations, research organisation (REC) 22 %, public bodies (PUB) 6 % and others (OTH) 5 % of participations. 12 NACE 2.0 main sections: the single letter code, as registered in the national registrations used by Orbis.

394
Figure 95 Companies by sector and decade (N = 9,763 companies)
Source: OrbisEurope, Corda16/01/2017.
More than two-thirds of Horizon 2020 companies come from only three sectors – 33 % are in Professional, scientific and technical activities (e.g. Siemens Healthcare GmbH, Wiener Stadtwerke Holding, The Vision Belgium, Sol Voltaics, Solar Polar), 27 % are in Manufacturing (e.g. Daimler, Basf, BMW, Safran, Lithoz GmbH, Adidas, Nokia) and 17 % in Information and communication (e.g. Deutsche Telekom, Telefonica Sa, Alten Netherland, Global Robots). The remaining one-third comes from 17 other sectors.
Figure 96 Horizon 2020 companies by sector (N = 9,908 companies)
Source: OrbisEurope, Corda16/01/2017.
395
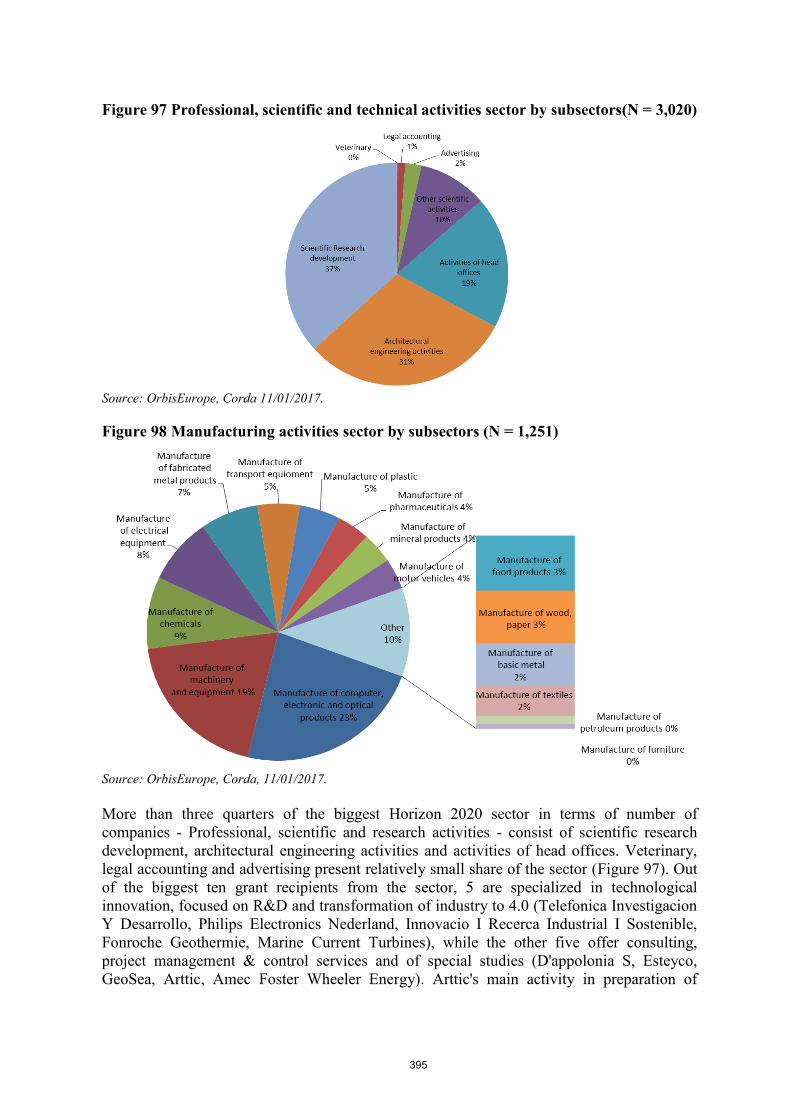
Figure 97 Professional, scientific and technical activities sector by subsectors(N = 3,020)
Source: OrbisEurope, Corda 11/01/2017.
Figure 98 Manufacturing activities sector by subsectors (N = 1,251)
Source: OrbisEurope, Corda, 11/01/2017.
More than three quarters of the biggest Horizon 2020 sector in terms of number of
companies - Professional, scientific and research activities - consist of scientific research
development, architectural engineering activities and activities of head offices. Veterinary,
legal accounting and advertising present relatively small share of the sector (Figure 97). Out
of the biggest ten grant recipients from the sector, 5 are specialized in technological
innovation, focused on R&D and transformation of industry to 4.0 (Telefonica Investigacion
Y Desarrollo, Philips Electronics Nederland, Innovacio I Recerca Industrial I Sostenible,
Fonroche Geothermie, Marine Current Turbines), while the other five offer consulting,
project management & control services and of special studies (D'appolonia S, Esteyco,
GeoSea, Arttic, Amec Foster Wheeler Energy). Arttic's main activity in preparation of

396
customers' Horizon 2020 roadmaps and has been so far participating in 19 Horizon 2020 projects and received more than EUR 7 million.
The second biggest sector - Manufacturing, is more diverse, although more than half of it consists of only three subcategories, manufacture of computer, electronic and optical products, manufacture of machinery and equipment and manufacture of chemicals (Figure 98). The smallest share represents companies producing furniture, petroleum products, textile and basic metal.
In contrast to manufacturing, the third biggest Horizon 2020 sector - Information and communication - is less diverse. More than three quarters of companies are in computer programming consultancy. Since there is no data on subsectors for all Horizon 2020 companies, the three analysed sectors are smaller than their respective shares.
80% of total grants to Horizon 2020 companies go to the three biggest sectors; 30 % to Professional, Scientific and Technical Activities, 35% to Manufacturing and 16% to Information and communication sector. The amount of grants awarded to each sector roughly follows the number of companies: money seems to be not sector-specific (Figure 99). The only slight exceptions are Manufacturing (relatively more money) and Professional, scientific and technical activities (less). This may be because of equipment costs in manufacturing and relatively smaller grants to consultancy companies.
Figure 99 Company grants by sector (N = 9,748 companies)
Source: OrbisEurope, Corda, 16/01/2017.
O.2. Company age and grants
The majority (60 %) of companies taking part in Horizon 2020 companies were created after 2000, 27 % after 2010, and 23 % since 2012 (‘start-ups’). The oldest companies were created well before 1900 (Figure 100). The most frequent Horizon 2020 company was created in 2012. The share of grants roughly corresponds to the share of companies created in each decade, though the oldest and most established companies get the highest grants, while the

397
average amount decreases for the younger companies. They probably have smaller shares in the projects.
Figure 100 Companies by decade of incorporation and grants (N = 9,959 companies)
Source: OrbisEurope, Corda16/01/2017.
Figure 101 zooms into the 8,128 companies that were set up in 1990 or later. It shows that the share of Horizon 2020 companies was more or less increasing since 1990, with the largest cohort starting in 2010. The cohorts 2015 and 2016 are smaller, since they could not take part in the first calls of Horizon 2020, but these numbers are expected to go up in the years to come when more grants are awarded.
Figure 101 Companies by year of incorporation and grants since 1990 (N = 8,128
companies)
Source: OrbisEurope,Corda 16/01/2017.
398
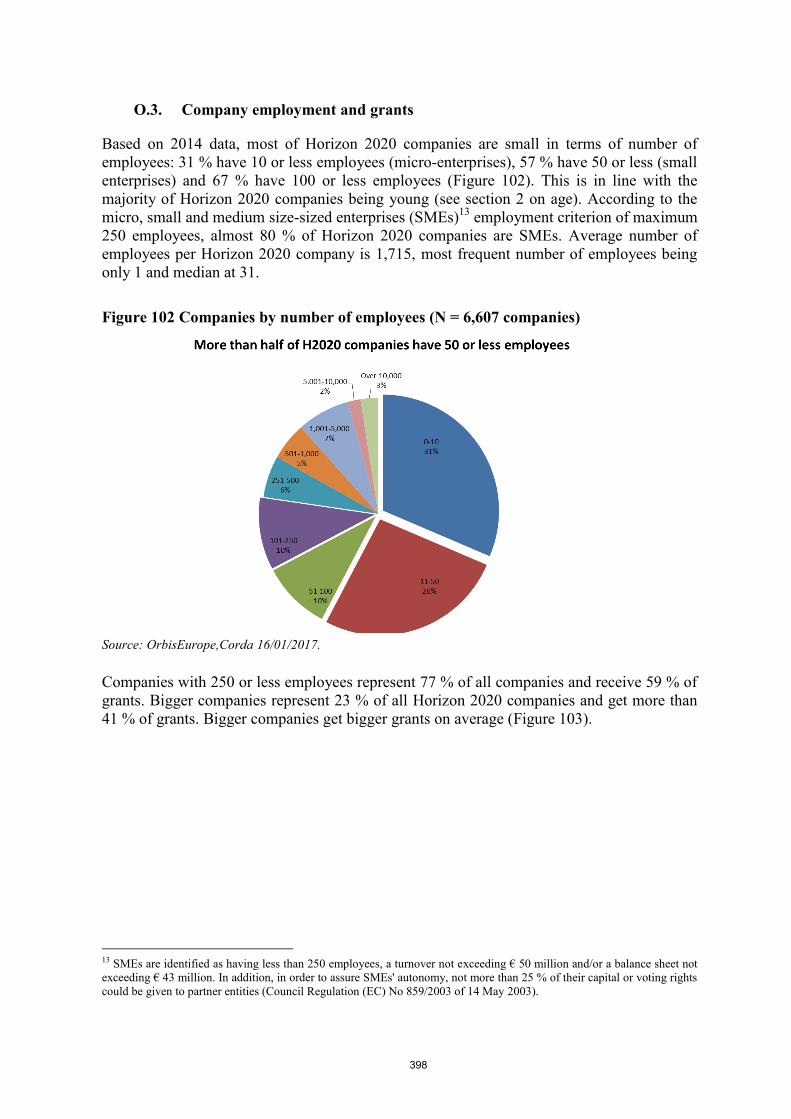
O.3. Company employment and grants
Based on 2014 data, most of Horizon 2020 companies are small in terms of number of
employees: 31 % have 10 or less employees (micro-enterprises), 57 % have 50 or less (small
enterprises) and 67 % have 100 or less employees (Figure 102). This is in line with the
majority of Horizon 2020 companies being young (see section 2 on age). According to the
micro, small and medium size-sized enterprises (SMEs)13
employment criterion of maximum
250 employees, almost 80 % of Horizon 2020 companies are SMEs. Average number of
employees per Horizon 2020 company is 1,715, most frequent number of employees being
only 1 and median at 31.
Figure 102 Companies by number of employees (N = 6,607 companies)
Source: OrbisEurope,Corda 16/01/2017.
Companies with 250 or less employees represent 77 % of all companies and receive 59 % of
grants. Bigger companies represent 23 % of all Horizon 2020 companies and get more than
41 % of grants. Bigger companies get bigger grants on average (Figure 103).
13 SMEs are identified as having less than 250 employees, a turnover not exceeding € 50 million and/or a balance sheet not
exceeding € 43 million. In addition, in order to assure SMEs' autonomy, not more than 25 % of their capital or voting rights
could be given to partner entities (Council Regulation (EC) No 859/2003 of 14 May 2003).

399
Figure 103 Companies by number of employees and grants (N = 6,738 companies)
Source: OrbisEurope,Corda 16/01/2017.
O.4. Company revenues and grants
Based on 2014 data, 30% of the Horizon 2020 companies have revenues up to EUR 1 million, 58% have revenues up to EUR 10 million and 73% have revenues up to EUR 50 million, the maximum amount for SMEs in the EC definition (the balance sheet and ownership criteria were not taken into account). Almost a quarter of the Horizon 2020 companies (23%) have revenues higher than EUR 50 million. 4% of the Horizon 2020 companies have revenues higher than EUR 1 billion (Figure 104). The latter is the reason for the relatively high average revenue of Horizon 2020 companies at EUR 708 million, with the most companies have revenues of around € 4 million (median at EUR 4.77 million and mode at € 4.16 million).
74 % of Horizon 2020 SMEs in terms of revenues receive 54% of all grants. 46% of grants go to larger companies. The participation is the highest among companies with revenues up to EUR 1 million (30 % of all Horizon 2020 companies that receive 18% of all grants) on one side and the biggest companies with revenues above EUR 150 million (17% of Horizon 2020 companies that receive 37% of all grants) (Figure 105
Bigger companies
SMEs

400
Figure 104 Companies by revenue (N = 6,222 companies)
Source: OrbisEurope,Corda 16/01/2017.
Figure 105 Companies by revenue and grants (N = 6,222 companies)
Source: OrbisEurope,Corda 16/01/2017.
Many of the Horizon 2020 companies are young. On average, they have a smaller turnover than older companies (Figure 106).
bigger companies
SMEs
bigge

401
Figure 106 Companies by decade of incorporation and turnover (N = 6,108 companies)
Source: OrbisEurope,Corda 16/01/2017.
Figure 107 EC contributions to SMEs and bigger companies (N = 5,276 companies)
Source: OrbisEurope, Corda 16/01/2017.
Taking into account both considered SME criteria, revenue and employment, 68% of all Horizon 2020 companies are SMEs based on 2014 data and receive 49% of all granted EC contributions to Horizon 2020 companies. Larger companies represent 32% of all Horizon 2020 companies and receive 51% of company contributions. However, if it was possible to apply the rest of the SME criteria, the SME proportion would likely decrease. The average

402
grant for larger companies is over EUR 1 million and more than twice of an average SME grant, which is below EUR 0.5 million.
O.5. Companies by Member State
More than half of the Horizon 2020 companies are based in five large countries: DE, ES, IT, GB and FR. Those countries have each more participant Horizon 2020 companies and receive greater shares of EC contributions than companies of new Member States put together. The shares of companies from 10 countries (CZ, RO, EE, SK, CY, BG, LU, LT, HR, LV and MT) are all lower than 1%. 83% of the Horizon 2020 companies come from EU15. They receive 89% of the total grant amounts. 9% of the Horizon 2020 companies come from the new Member States (EU13) and they receive 6% of the grants. 8 % of Horizon 2020 companies come from outside the EU and receive 5% of total grant amount. The average grant of the EU15 companies is higher than the average grant of the EU13 companies and companies from outside EU. Per capita performance could be categorized in four groups (see circles in Figure 108). Although most Horizon 2020 companies come from EU15 countries, their per capita performance is rather low. Front-runners from DE, ES, IT, GB, FR and GR are followed by better per capita performance fast followers from the rest of the EU15 countries (NL, BE, SE, AT, GR, FI, DK, IE). The best per capita performers are High Fliers: LU (78 Horizon 2020 companies per million citizens) and SI (64), followed by CY (61) and EE (55). The lowest company participation per capita is in the group of Slow Followers: RO (5), PL (6), BG (7) and HR (8).
Figure 108 Companies and their grants by Member State (N = 12,410 companies)
Source: European Commission, based on Corda 10/02/2017, Eurostat 03/01/2017.
EU-15 -IE EU-13+
IE
High-Fliers
Former Front-
runners Slow Followers
Fast Followers

403
P. POSITION IN INTERNATIONAL RANKINGS
P.1. Companies
An analysis of 10 international rankings of top performing or innovating companies was
undertaken in order to assess the percentage of those funded by Horizon 2020. The
distinction between those which have headquarters in the EU and those with headquarters
outside the EU was also considered.
The analysis revealed that the majority of the top companies have headquarters outside the
EU, with those participating in Horizon 2020 usually doing so through their subsidiary units
located in the EU.
Figure 109 Best performing companies according to different international rankings,
according to the location of their with headquarters (HQ) within or outside the EU
Source: European Commission services compilation based on published rankings
Concentrating on top companies that benefited from Horizon 2020 reveals a diverse picture
as presented in the following figure.
Figure 110 Best performing companies according to different international rankings,
according to whether they received Horizon 2020 support or not
Source: European Commission services compilation based on published rankings

404
Bigger companies and established innovators included in the European Patent Organisation
(EPO), the R&D Scoreboards, and Thomson Reuters top global innovators rankings are
greater beneficiaries of Horizon 2020 funds than younger innovators from the Wired
Europe's hottest start-ups, Deloitte's fastest growing European tech companies, Forbes' most
innovative companies, and CB Insights' Unicorns list.
The top-50 applicants for the European Patent Office often take part in Horizon 2020, with a
large majority of those participating through their divisions inside the EU. For example, the
Japanese Honda Motor participates in Horizon 2020 with its subsidiaries Honda Research
Institute Europe and Honda R&D Europe, both based in Germany. This again shows that
Horizon 2020 attracts frequent participation of non-EU based companies and organisations
often through their EU based subsidiaries and evinces the open innovation nature of the
programme.
As expected, most of the companies in the EU R&D Scoreboard take part in Horizon 2020,
such as Volkswagen, Daimler, Bosch, Sanofi, BMW, Siemens or Philips. Out of those which
are not participating in Horizon 2020, the banking and financial sector is the most
significant.
Wired Europe's hottest start-ups and Deloitte's fastest growing European tech companies
rankings reveal that these companies hardly take part in Horizon 2020. Out of the first
ranking, only two benefited from Horizon 2020 funding thus far: Portugal's Beta-i and
Unbabel. This is underlying the gap in reaching out to these young companies. Additionally,
CB Insight's list of unicorns or young fast growing companies reaching a capitalisation of $1
billion indicates that 18 out of the 176 are EU-based, including names such as Spotify or
Delivery Hero. Yet, no company in this list is currently benefiting from Horizon 2020.
In similar lines, only 12% of the MIT smartest companies and 3% of the Forbes most
innovative companies rankings participate in Horizon 2020, with notable examples such as
Huawei, Toyota, Oxford Nanopore, Movidius, Bosch, IBM, and Intel.
Several of the well-known companies are newcomers to Horizon 2020 and did not
participate in FP7, including: Panasonic, Cisco, Mitsubishi Electric or Caterpillar. Attracting
top performing companies (e.g. 3M Deutschland, Sumitomo, Unbabel, AlphaSense Oy,
Bluelinea, Syngenta, Interdigital or Johnson Controls) demonstrates that Horizon 2020
manages to attract newcomers even from the top companies.
P.2. Universities and research institutions
An analysis of nine international rankings of the best universities and research institutions
was undertaken in order to assess the percentage of those funded by Horizon 2020. The
distinction between those that have headquarters in the EU and those outside was made.
The Shanghai, Leiden International Rankings, QS Top World's Universities and the Times
Higher Education World University rankings show that around a quarter of the worlds' top
universities are based in the EU.

405
Figure 111 Best performing universities according to different international rankings,
according to the location of their with headquarters (HQ) within or outside the EU
Source: European Commission services compilation based on published rankings, Cut-off date: 01/11/2016.
All rankings represent their latest version by this date
As shown in the figure below, almost all of EU-based top universities participate in Horizon
2020. Among the top performing non-EU universities, more than half of them are also
participating in Horizon 2020. Even though Horizon 2020 already includes a significant base
of excellent universities worldwide, there are also newcomers to Horizon 2020, which did
not participate in FP7, the most notable example being the New York University or the
University of Utah.
Looking specifically at the participation in Horizon 2020 of the World's Most Innovative
Research Institutions, 8 out of the 25 top research institutions (32%) are based in the EU,
including the world's top 2: the Alternative Energies and Atomic Energy Commission in
France and the Fraunhofer Society in Germany. Almost all European institutions ranked here
take part in Horizon 2020, as do a third of the world's best research institutions which are not
based in the EU, such as Korea's Institute of Science & Technology, RIKEN - Japan's largest
comprehensive research institution and the Russian Academy of Science.
Figure 112 Best performing universities according to different international rankings,
according to whether they received Horizon 2020 support or not
Source: European Commission services compilation based on published rankings; Cut-off date: 01/11/2016.
All rankings represent their latest version by this date

406
Q. PARTICIPATION PATTERNS AND BALANCE BETWEEN LARGE AND SMALL PROJECTS
Q.1. Introduction and background
This Annex provides an overview of two methods developed by the Commission (DG RTD)
to assess participation patterns in large versus small projects in Horizon 2020 and their
findings.
This analysis is conducted as a result of the Regulation establishing Horizon 2020 (Recital
23) and the Council Decision establishing the Specific Programme implementing Horizon
2020 (Recital 13) stating that there should be an appropriate balance between small and large
projects, notably within the priority "Societal challenges" and the specific objective "LEIT".
However, the definitions of ‘project size’ as well as definition of ‘appropriate balance’ were
not spelled out.
A previous study looking into the optimal project size conducted under FP714
concluded
there is no optimal size for collaborative research projects to maximise their impact and
"finding an ideal number of participants, disciplines, sectors, NUTS 3 regions or countries is
elusive". The appropriate balance between large and small projects is also a continuous
priority of the European Parliament15
. Yet, based on their analysis16
, there are currently no
bottlenecks in terms of programme implementation in relation to project size (a EUR 5
million threshold was used for the assessment).
However, based on results of the stakeholder consultation carried out for the interim
evaluation of Horizon 2020, stakeholders seem to support the concept of the need for an
appropriate balance within the programme. Respondents noted that the balance between
small and large projects in calls for proposals is “good” or “very good” (57%), whereas 24%
foundnd it poor or very poor. In their open comments, some respondents asked for more
opportunities for small projects. Others commented in their position papers that a better
balance between small, medium and large projects should be achieved. In particular it was
mentioned that the effectiveness of very large size consortia should be reviewed while at the
same time smaller projects were argued to allow for higher participation of SMEs and
newcomers.
Given the complexity of the issue, two separate analysis were undertaken by Commission
services (DG RTD) in the framework of the interim evaluation of Horizon 2020. The
methods and results are presented in the sections below.
Q.2. Analysis 1 – Descriptive overview of participation in different-size projects
based on budget data
Key finding: Entities from EU-13 countries participate more in larger projects (i.e. projects
above EUR 5 million), but coordinate very small projects (i.e. project below EUR 200,000).
14 European Commission, DG-RTD, Study on Network Analysis of the 7th Framework Programme Participation, 2015,
p.118
https://ec.europa.eu/research/evaluations/pdf/archive/other_reports_studies_and_documents/network_analysis_of_fp7_parti
cipation_-_final_report.pdf 15 European Parliament, Scrutiny in Horizon 2020 focusing on the European Parliament's priorities, 2016, 16 Ibid, p. 17

407
The current funding going towards entities from EU-13 countries is spread between very
large projects (i.e. above EUR 5 million) and very small projects (i.e. below EUR 200,000).
Scope of the analysis: The analysis was carried out on all actions related to "Societal
challenges" and "LEIT". The analysis does not make a comparison with FP7.
Identification of threshold for large and small projects: A threshold was not identified.
Instead, the project size was analysed based on six budget categories (from EUR 1 – 0.2
million to EUR 10+ million).
Analysis: In terms of budget, a disproportionate share of funding went to projects larger than
EUR 5 million (92% of the total budget). The budget and grant allocation to projects below
EUR 5 million is relatively low.
The highest share of entities from EU-13 countries participate and receive EC contribution
from larger projects (projects above EUR 5 million). However, when looking at the
participation of entities from EU-13 countries within different project sizes, these seem to
coordinate and lead more if projects are smaller (but the current sample size is too low to
draw conclusions). At the same time, EU-13 entities seem to participate best in the EUR 1 –
5 million bracket. The share of EU-13 participants is significantly higher than in other
brackets and there is no significant differences between the share of participation in very
small projects under EUR 1 million or very big projects above EUR 5 million.
Figure 113 Project size (budget) and participation of EU13 (%)
Source: European Commission, DG RTD/A5 based on CORDA data extracted on 1.1.17

408
Figure 114 Share of total EU13 coordinators, grants, participants and EC Contribution
by project size
Source: European Commission, DG RTD/A5 based on CORDA data extracted on 1.1.17
Q.3. Analysis 2 – Composite threshold and comparison Horizon 2020 - FP7
Key finding: The share of participants from EU-13 countries and of newcomers is higher in
large than in small projects. There is a more balanced situation between large and small
projects in Horizon 2020 if compared to FP7 in terms of number of proposals, EC
contribution and number of participants.
Scope of analysis: The analysis was carried out only on 'Research and Innovation Actions'
and 'Innovation Actions' in LEIT and in three Societal Challenges of Horizon 2020. For FP7,
only collaborative projects in any priority where included in the analysis.
Identification of threshold: The identification of small or large projects was based on the
number of participants. The number of participants in each project was normalised by EUR
million of EC contribution to allow for comparisons between types of action and with FP7.
For each type of action or instrument, the average was estimated on the normalised number
of participants. If the number in a project was below or equal to the average, the project was
considered "small", if it was above the average, the project was considered "large".
Table 77 Ratio between large and small projects (1= perfect balance)
Average number of participants by EUR
million
Horizon 2020 - Innovation actions 3.1
Horizon 2020 - Research and Innovation
actions
2.93
FP7 - Collaborative Projects 3.6
Source: European Commission, DG RTD/A5 based on CORDA data extracted on 11.8.16

409
Identification of an appropriate balance: Based on the definition of the thresholds, the
method identified the appropriate balance both in terms of ratio between large and small
projects17
and in terms of ratio between the normalised number of participations in large and
small projects18
. A value that is close to 1 indicates that there is approximately the same
number of projects or participations between large and small projects. The same reasoning
was applied in other variables, such as a differentiation between different Societal
Challenges and LEIT areas, differences among country groups, newcomer participations, etc.
Analysis: The situation in Horizon 2020 both at aggregated and disaggregated level per
programme part takes into account that the overall average size of projects is 2.5 participants
per EUR million. At aggregated level, the balance between large and small projects tends
slightly towards a higher number of large projects compared to small projects: as a result, the
number of participations in large projects is 40% higher than in small projects.
Table 78 Ratio between large and small projects (1= perfect balance)
Programme
Part
Nr
Large
Projects
Nr of
Small
Projects
Ratio
Large vs
Small
Projects
Nr of
Participations
in Large
Projects
Nr of
Participations
in Small
Projects
Ratio
Participations
in Large vs
Small
Projects
LEIT-ICT 280 261 1,1 3.087 2.689 1,1
LEIT-NMBP 86 142 0,6 1.393 1.673 0,8
LEI-SPACE 101 20 5,1 822 140 5,9
SC1 88 150 0,6 1.368 1.633 0,8
SC2 81 28 2,9 1.600 369 4,3
SC3 93 109 0,9 1.132 1.531 0,7
SC4 200 126 1,6 2.116 1.279 1,7
SC5 66 40 1,7 1.326 556 2,4
SC6 84 4 21,0 955 26 36,7
SC7 50 24 2,1 760 276 2,8
Total 1.129 904 1,2 14.559 10.172 1,4
Source: European Commission, DG RTD/A5 based on CORDA data extracted on 11.8.16
Nonetheless, it can be observed that certain programme parts have ratio values that deviate
significantly from a perfect balance (value of 1). In LEIT-Space, for instance, large projects
account for more than five times the number of small projects and for six times in terms of
number of participations. In Societal Challenge 2, the number of large projects is almost
three times as big as the number of small projects and the number of participations in large
projects is more than four times higher than those in small projects.
In LEIT-Space, this deviation from the balance is explained by the fact that projects under
this programme part tend to be carried out in relatively small consortia in term of
participants (numerator) with high project costs (denominator). Despite the relative low
number of small projects, these account for 60% of the LEIT-Space budget.
17 A ratio above 1 implies that more large than small projects were financed; conversely a ratio below 1 indicate that more
small projects than large were financed. 18 If the ratio between the weighted number of participants is above 1, this implies that there is a predominance of
participants in large projects; whilst the opposite (a ratio below 1) implies a predominance of participants in small projects.

410
Results show a more balanced situation between large and small projects in Horizon 2020 in
case of Research and Innovation actions than in FP7 collaborative projects in terms of
number of proposals, EC contribution and number of participants. The share of participants
from EU-13 and newcomers is higher in large than in small projects. The following tables
summarize the results in more details.
Table 79 Ratio between large and small projects (1= perfect balance)
Number
of
proposals
EC
contribution
Number of
participants
Share of
participants
from EU-13
Share of
participants which
are newcomers
Horizon 2020 -
Innovation actions
0.54 0.22 0.50 1.21 1.13
Horizon 2020 -
Research and
Innovation actions
0.59 0.38 0.77 1.73 1.20
FP7 - Collaborative
Projects
0.58 0.31 0.68 1.46 N/A
Source: RTD/A5 based on CORDA data extracted on 11.8.16
Type of
project
Catego
ry
Number
of
projects
Total EC
contribution in
EUR
Particip
ants
EU
13
Share
EU13
New
comers
Share
Newcom
ers
FP7 -
Collaborative
Projects
Large 2204 5,880,664,597 29056 2281 7.9% N/A
Small 3794 18,776,147,693 42808 2295 5.4% N/A
Horizon 2020
- Research
and
Innovation
actions
Large 527 1,943,476,742 7894 751 9.5% 1561 19.8%
Small 899 5,120,568,745 10207 561.
0
5.5% 1676 16.4%
Horizon 2020
- Innovation
actions
Large 201 542,737,120 2290 181 7.9% 797 34.8%
Small 371 2,420,000,653 4618 302 6.5% 1424 30.8%
Source: European Commission, DG RTD/A5 based on CORDA data extracted on 11.8.16


