
The evolution of the Scientific Community through the Peer Review Dynamics in a
Multidisciplinary Journal (Content-Bias in the Peer Review Process at JASSS)
Pierpaolo Dondio & John Kelleher, Dublin Institute of Technology (IRL)Niccolò Casnici & Flaminio Squazzoni, University of Brescia (IT)

Aim of the study and research question
Using the JASSS dataset, our aim is to investigate if/to which extentthe content of a submitted paper can be predictive of the outcome ofthe peer review processes.
Research question:Can the content of a paper predict its acceptance? e.g. Is a paper similarto previously accepted papers more likely to be accepted and vice-versa?
***With content we mean an analysis of the terms used in the document, we do notconsider its quality, correctness or sematic structure.

Methodology
Similarity measure = two papers are similar if they use the same terms (or combination of terms) with the same frequency and importance. Similar documents would be together in a search engine output. Similar documents they (loosely) share topic. The similarity does not include style, correctness, semantic structures or quality. It is a purely terms-based similarity.
We tried to reconstruct the terms/topics associated to paperaccepted/rejected over the time @ JASSS
We defined a terms-based similarity measure betweendocuments and we wonder if being similar to an accepted paper increase thelikelihood of received a positive review and viceversa.

Possible uses (besides Research)
For the Editors:• It can spot trendy topics, helping editors to monitor topics
dynamic over time or compare their journal topics to otherjournals
• It can detect a bias if classifier performance changes• Editors could use it to automatically cluster/classify/catalog
papers
For the Authors:• Authors can have their paper pre-processed to see if they fit
the scope of the journal

Health Warning!
All models are wrong but some are useful
George Box
Technical Fundamentals
• In this presentation we are going to base our analysis on the distance/similarity between papers
• The methodology used is a vector-space representation of documents, using the TF-IDF metrics to weight each term in a document

Technicalities - Text Normalization
Starting Sentence We are a group of brilliant researchers studying
peer review, I suppose..
Tokenize
(smaller case)
[we, are, a, group, of, brilliant, researchers,
studying, peer, review, i, suppose]
Stopwords [group, brilliant, researchers, studying, peer,
review, suppose]
Stemming
(Porter algorithm)
[group, brilliant, research, studi, peer, review,
suppos]
• Stopwords and Stemming are needed to reduce the number of distinct terms used in the corpus (dimensionality reduction)
• Each document is represented as a “bag of words” after text normalization. This representation is used to build a vector space model

Representing Text: Vector Space Model
• Every document is represent by a vector. Each dimension of the vector represent the presence of absence of a word (the value could be weighted)
• The space has n dimension, where n is the number of distinct words in all the corpus
Documents I like apples lemons too
Doc1 I like apples 1 1 1 0 0
Doc2 I like lemons 1 1 0 1 0
Doc3 I like apples too 1 1 1 0 1

Weighting Word Counts (TF-IDF)
• TF-IDF is used to measure importance of terms in a document
– A term has high TD-IDF if it is very frequent in a paper and infrequent in the other papers. High TF-IDF means that the term is highly significant for the paper

Measuring Text Similarity
• We know that we can represent a text as a vector of tf-idf scores.
• Now we need to decide on how to compute the distance/similarity between texts.

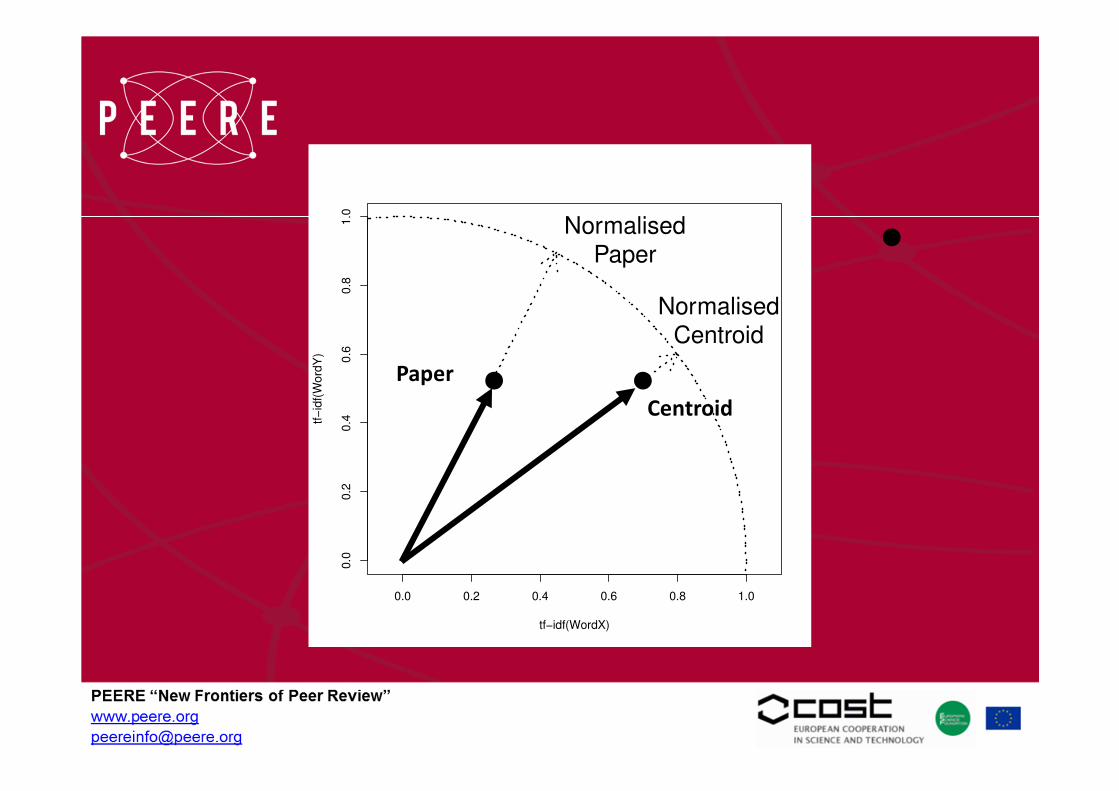
Cosine similarity illustrated
• It measures the angle between 2 vectors.
• It uses ratios
• Each vector represent a document in the vector space model
• Each dimension is a term
• A value of 1 means perfect matching, a value of 0 means no terms in common
11

0.0 0.2 0.4 0.6 0.8 1.0
0.0
0.2
0.4
0.6
0.8
1.0
tf−idf(WordX)
tf−
idf(
Wo
rdY
)

0.0 0.2 0.4 0.6 0.8 1.0
0.0
0.2
0.4
0.6
0.8
1.0
tf−idf(WordX)
tf−
idf(
Wo
rdY
)CENTROID
0.0 0.2 0.4 0.6 0.8 1.0
0.0
0.2
0.4
0.6
0.8
1.0
tf−idf(WordX)
tf−
idf(
Wo
rdY
)
Centroid
Paper
�
NormalisedCentroid
�
NormalisedPaper
Paper
Centroid

0.0 0.2 0.4 0.6 0.8 1.0
0.0
0.2
0.4
0.6
0.8
1.0
tf−idf(WordX)
tf−
idf(
Wo
rdY
)Normalised
Centroid
NormalisedPaper
θ

The Dataset
We had the following data for 681 Papers submitted toJASSS:
• Full text of submitted manuscriptdoc, docx, pdf, tex, rtf, html
• Decision of the Editoraccept or minor revision are considered positive decisions, rejectedor major revision are considered negative decisions
• Time of the submission

Pre-processing JASSS Corpus
We needed to reduce the dimensionality of the dataset (reduce the distintterms!)
• Basic text normalization, removal of stopwords• numeric tokens were removed• we expanded few common used acronyms using . For instance, “abm” was
expanded into agent-based models• we extracted the root of each term• we introduced a time windows w of n years (n=1,2,5).
The tokenization generated 11145 unique terms. The application of the Porter stemmer algorithm reduced it to 9705. The use of a time window of 2 years reduce the terms count to 6921.

Experiments with 2 Text-Mining Classifiers
Given a paper p, if the paper is closer to the group of previously accepted papers it will be accepted , otherwise rejected
1. Centroid-based Global Classifier
Given a paper p, if the most similar paper to p was accepted, then p will be accepted, otherwise rejected
2. KNN Local Classifier
(*) all the experiments use the time variable

Global Centroid Classifier
Submitted Paper01-01-2007
Corpus of Accepted Papers prior to 01-01-2007
Corpus of Rejected Papers prior to 01-01-2007
Computing Vector RepresentationComputing Vector Representation
Computing Centroid
Computing Centroid
Computing Similarity
J+ J-
Classification
J+ > J-POSITIVE NEGATIVE
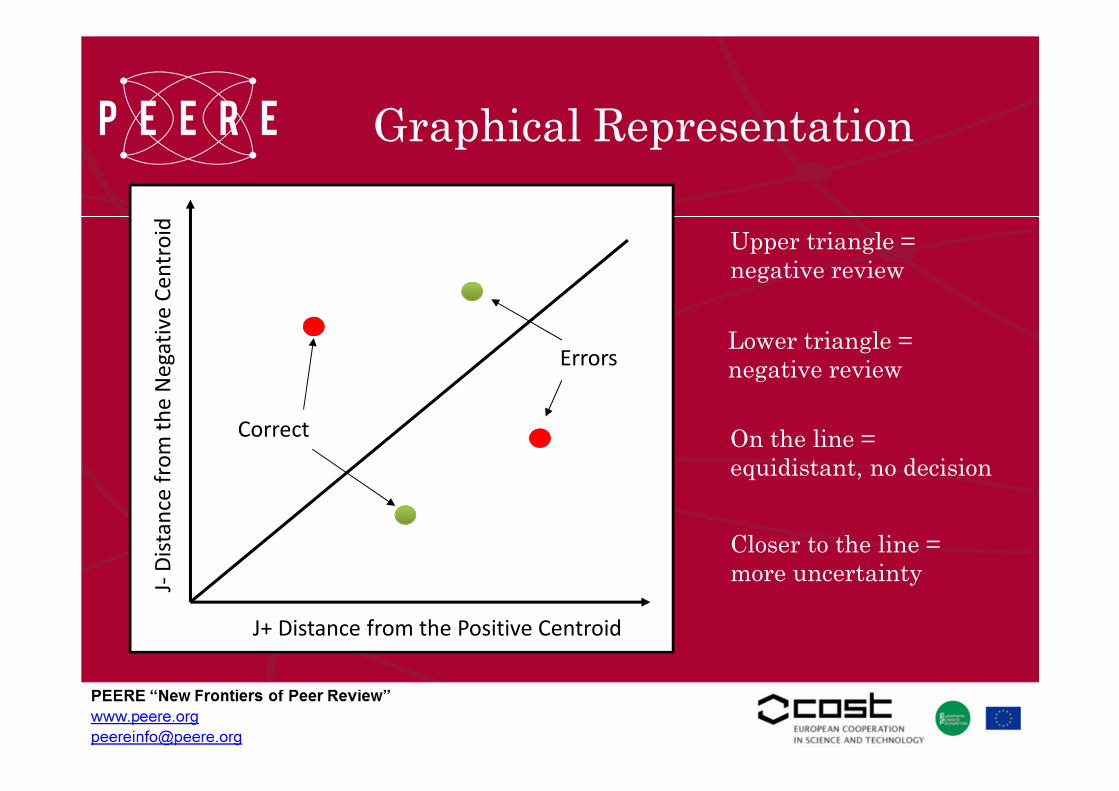
Graphical Representation
Upper triangle = negative review
Lower triangle = negative review
On the line = equidistant, no decision
Closer to the line = more uncertainty
J+ Distance from the Positive Centroid
J-D
ista
nce
fro
m t
he
Ne
ga
tive
Ce
ntr
oid
Correct
Errors
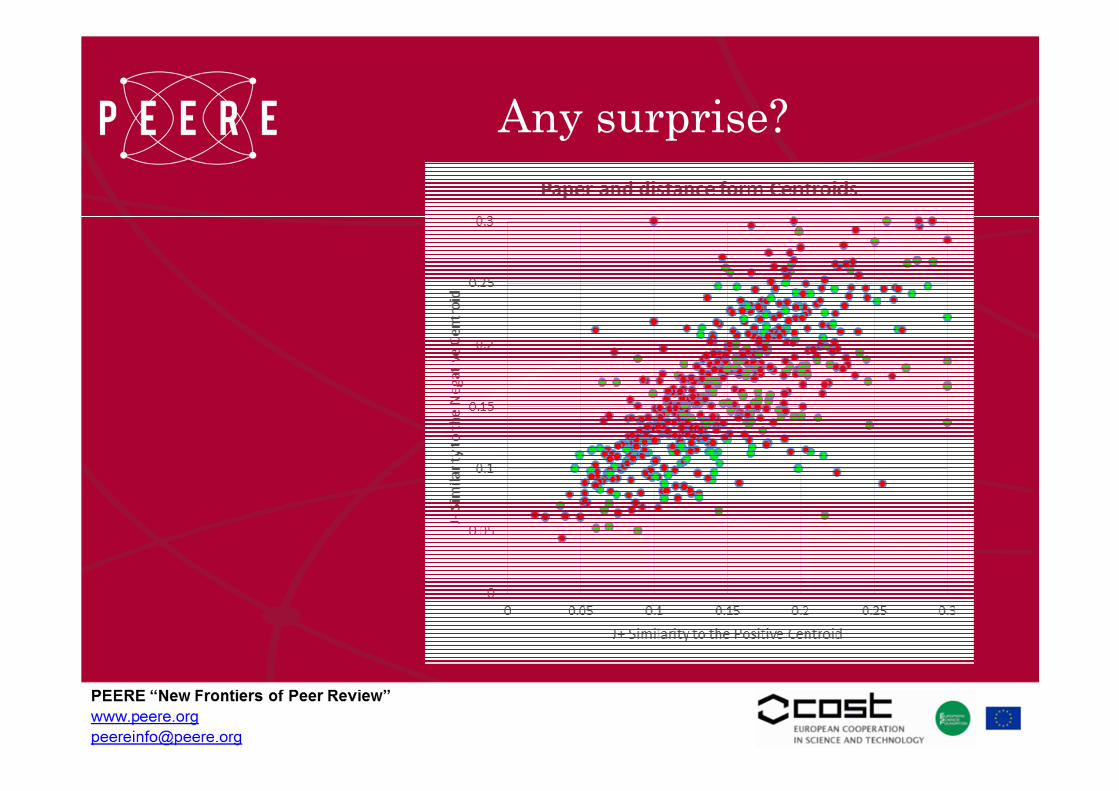
Any surprise?

Result – Global Classifier
• BaselineF-score: 0.568Accuracy: 56.9%Based on a random classifier with prior probabilities equalsto JASSS dataset: P(accept)=0.315 , P(reject)=0.685
• Global ClassifierF-score: 0.613Accuracy: 61.7%Significant but modest gain in performance.J+ more predictive than J-
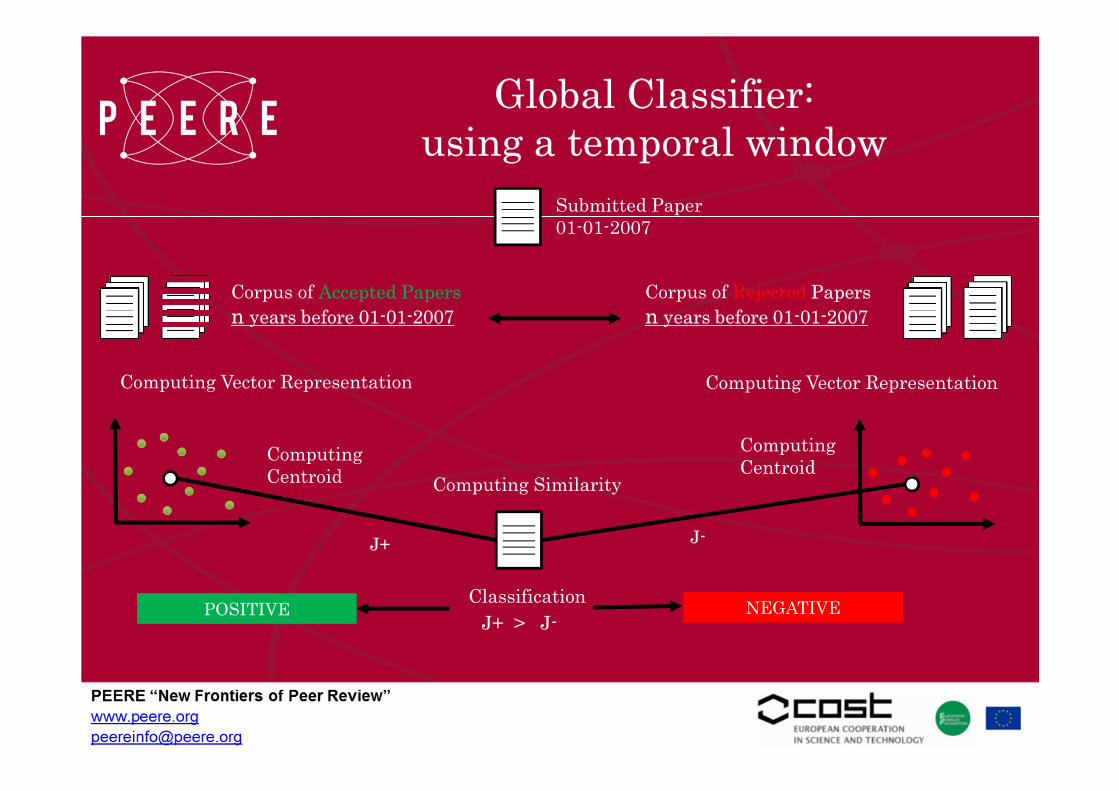
Global Classifier: using a temporal window
Submitted Paper01-01-2007
Computing Vector RepresentationComputing Vector Representation
Computing Centroid
Computing Centroid
Computing Similarity
J+ J-
Classification
J+ > J-POSITIVE NEGATIVE
Corpus of Accepted Papers
n years before 01-01-2007
Corpus of Rejected Papers
n years before 01-01-2007

Result – Global Classifier
• Do the performance improve by using a time windows?Yes, results increase with an maximum around 2-3 years.This suggests the presence of a time locality in JASSS, maybethe presence of fashionable topics?
Classifier F-score Accuracy Gain
Random Baseline 0.565 56.9%
Global 0.613 61.7% +4.8%
Global with time window 0.659 66.4% +9.5% (*)

Improving accuracy
ΔJ= J+ - J-Could be a measureof the certainty
of prediction

Smaller but better?
ΔJ= J+ - J-Could be a measureof the certainty
of prediction

Result – Global Classifier
• Do the performance improve by only take a decision whenthe model is more certain?
We take a decision only on a subset of papers, but (maybe) a betterdecision. The gap between J+ and J- is a measure of certainty. Wecan classify papers only if ΔJ is more than a threshold.Performance improves almost linearly
Size of the subset of Papers (percentile)
F-score
100 0.659
80 0.680
50 0.703
30 0.743
20 0.75
10 0.762

Result – Global Classifier
• Do performance change over time?Yes, overall performance improves over time. This suggests thatpapers are getting easier to classify. Time locality helps.This could suggests that JASSS had well defiend its topics?However, while rejection is constantly getting easier to predict,acceptance does not show a clear trend even if it has its maximum in2010 - 2012
Time Period F-score (for 100% of papers)
04-06 0.56
07-09 0.64
10-12 0.705

Global Classifier -Summary
• Modest results with a standard classifiers
• Good improvements with the introduction of a time windows(time locality)
• It is possible to increase the accuracy of the model by onlytreating less uncertain cases
50% of cases with accuracy around 70%30% of cases with accuracy around 75%
• The quality of the classifiers improves over time. However, itseems that negative reviews are easier to predict than positive

Global Classifier -Comments
• Making prediction based on documents terms is not trivial,similar papers could have different review outcomes. Topic isnot sufficient.
• The presence of time locality suggests that is easier to beaccepted if the topic is fashionable
• The increment of performance over time suggest a growingdistinction between papers with positive and negativereview
• The gap between J+ and J- is an efficient proxy ofuncertainty

Local KNN Classifier
Submitted Paper01-01-2007
Corpus of ALL papers submitted prior to 01-01-2007labelled as Accepted / Rejcted
K-NN Classifier
• K=1 Assign the label of the closest paper
• K=N Consider the N closest papers and assign the label based on majority rule or minimum quorum
• N cannot be too big when data are unbalanced
Vector Representation

Result – Local KNN Classifier
• BaselineF-score: 0.568Accuracy: 56.9%Based on a random classifier with prior probabilities equalsto JASSS dataset: P(accept)=0.315 , P(reject)=0.685
• KNN Classifier (K=1)F-score: 0.589Accuracy: 59.2%Performance similar to the baseline.Overall, locality does not help. The introduction of a timewindow improve performances (accuracy up to 64.1% with 2year window)
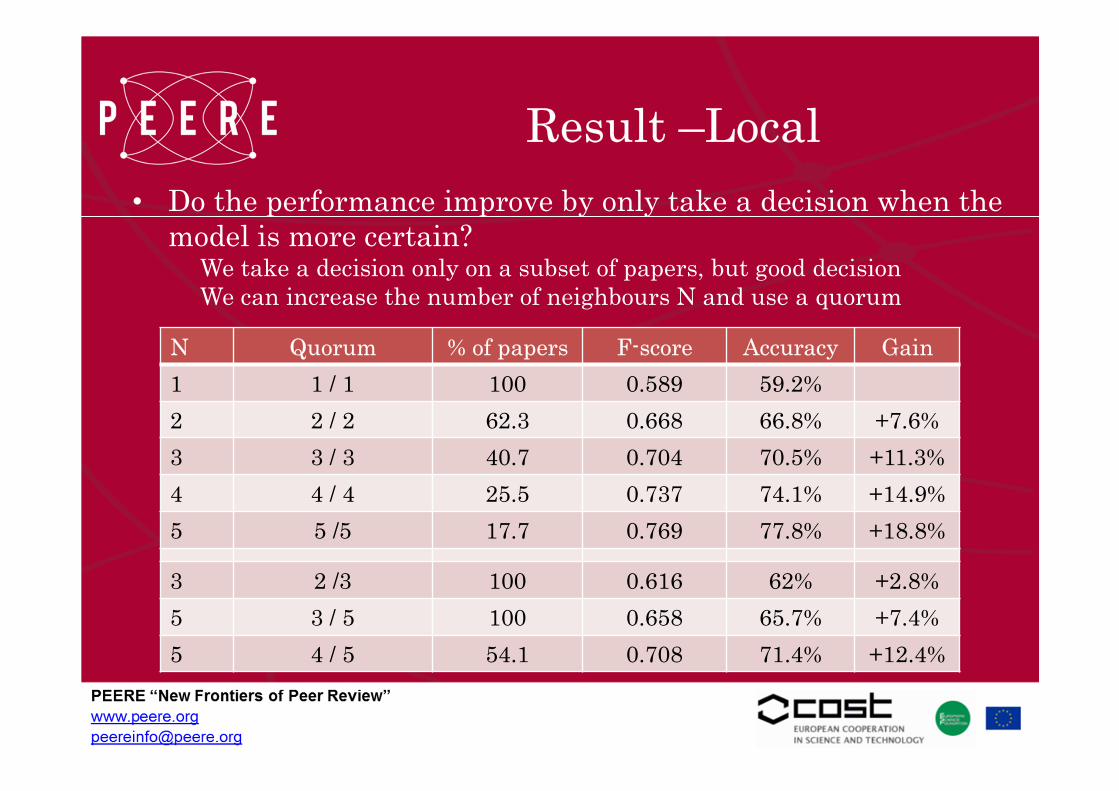
Result –Local
• Do the performance improve by only take a decision when themodel is more certain?
We take a decision only on a subset of papers, but good decisionWe can increase the number of neighbours N and use a quorum
N Quorum % of papers F-score Accuracy Gain
1 1 / 1 100 0.589 59.2%
2 2 / 2 62.3 0.668 66.8% +7.6%
3 3 / 3 40.7 0.704 70.5% +11.3%
4 4 / 4 25.5 0.737 74.1% +14.9%
5 5 /5 17.7 0.769 77.8% +18.8%
3 2 /3 100 0.616 62% +2.8%
5 3 / 5 100 0.658 65.7% +7.4%
5 4 / 5 54.1 0.708 71.4% +12.4%

Result – Global vs Local
• Are both the classifiers balanced?Let us compare the accuracy of the 2 classes separated
Model % papers Accuracy NEG
Global 2-yrs 20 77%
Global 2-yrs 50 75.70%
KNN 4 / 4 25.5 74.40%
Global 2-yrs 100 73.60%
KNN 4 / 5 54.1 72.80%
KNN 5 /5 17.7 72.60%
KNN 3 / 5 100 71.60%
KNN 3 / 3 40.7 71.50%
KNN 1 100 65.70%
Model % papers Accuracy POS
KNN 5 /5 17.7 86.4%
KNN 4 / 4 25.5 75.5%
KNN 3 / 3 40.7 66.1%
Global 2-yrs 20 64.7%
KNN 4 / 5 54.1 64.6%
Global 2-yrs 50 56.1%
KNN 3 / 5 100 52.4%
KNN 1 100 47.4%
Global 2-yrs 100 41.2%
• Locality helps to predict papers with a positive review

Comparing Classifiers
Overall, the classifiers have similar baseline performance but both of themimprove by introducing a time windows and by classifying only a subset ofless uncertain cases
Both of the classifiers can predict referee review outcome of 50% of thepapers with accuracy around 70%, and 1/3 of the papers with accuracyaround 74%
• However
The KNN classifiers are more balanced (they can predict negative andpositive outcomes), while the global classifiers predict the negative outcomebetter than the positive ones

Hot Topics examples
20042004 2005 2006 2007 2008 2009 2010 2011 2012
Opinion Dynamics
2003
Microsimulation
Reputation
Trust
Hottest
Hot

Hot Topics examples
20042004 2005 2006 2007 2008 2009 2010 2011 20122003
Network
Auctions
Citations
PR (?)
Marriage, DivorcePedestrian
Truth, Validation,
Epistemology
Logic
Hottest
Hot

Conclusions & Future Works
• Can we automatically predict review outcome by textsimilarity?
Overall, we obtained an improvement compared to the baseline, butmodest, that improves by considering the time dimension
However, for a subset of papers the accuracy of the classification isinterestingly high (70%-75%)
The study has also collected interesting experimental evidence of adynamic change in JASSS topics
Next Step on JASSS dataset:• LSA Analysis to name and discover changing and trending
topics


