THE EXTENT OF INFORMATION VISUALISATION IN TURKISHCONSTRUCTION INDUSTRY: A QFD APPROACH
A THESIS SUBMITTED TOTHE GRADUATE SCHOOL OF NATURAL AND APPLIED SCIENCES
OFTHE MIDDLE EAST TECHNICAL UNIVERSITY
BY
B�LGE ERDO�AN
IN PARTIAL FULFILLMENT OF THE REQUIREMENTS FOR THE DEGREE OF
MASTER OF SCIENCE
IN
THE DEPARTMENT OF CIVIL ENGINEERING
DECEMBER 2003
Approval of the Graduate School of the Natural and Applied Sciences
Prof. Dr. Canan ÖzgenDirector
I certify that this thesis satisfies all the requirements as a thesis for the degreeof Master of Science.
Prof. Dr. Erdal ÇokçaHead of Department
This is to certify that we have read this thesis and that in our opinion it is fullyadequate, in scope and quality, as a thesis for the degree of Master of Science
Assist. Prof. Dr. Yasemin NielsenSupervisor
Examining Committee Members
Assist. Prof. Dr. Metin Arıkan
Assist. Prof. Dr. Yasemin Nielsen
Inst. Dr. Engin Erant
Inst. Dr. Murat Gündüz
Pırıl �ahin (M.Sc. CE)

iii
ABSTRACT
THE EXTENT OF INFORMATIONVISUALISATION IN TURKISH
CONSTRUCTION INDUSTRY: A QFDAPPROACH
Erdo�an, Bilge
M.S., Department of Civil Engineering
Supervisor: Assist. Prof. Dr. Yasemin Nielsen
December 2003, 111 pages
Distances between dispersed locations may be largely overcome through
efficient use of modern data transfer and communication systems. Unfortunately
the conclusions drawn from research and surveys carried out in the industry show
that companies generally fail in using information technologies properly and that
there is a significant communication gap - therefore coordination and cooperation
gap - between the site offices and the main office due to data transfer lags and lack

iv
of visualised information. How information is presented has a great bearing on
quality of information and visualisation is one of the most important tools used to
improve data presentation.
The purpose of this thesis is to evaluate the extent of visualisation as a
communication tool in construction industry and to determine potential benefits to
be gained through implementation of visualisation. Therefore, available
visualisation resources are investigated among Turkish AEC companies. The
current status of visualisation use for communication in construction firms is
mapped and described. Information flow contents and types are analysed to
determine which information in the construction process can be visually
represented. Finally, a QFD approach is used for a combined evaluation of the
research findings together with the customer needs and requirements expected from
visualised information
Keywords: visualisation, communication, QFD, information flow

v
ÖZ
TÜRK �N�AAT ENDÜSTR�S�NDE B�LG�GÖRÜNTÜLENMES� VE GÖRSELL���N�N
KULLANIMI: B�R KAL�TE FONKS�YONAÇILIMI YAKLA�IMI
Erdo�an, Bilge
Yüksek Lisans., �n�aat Mühendisli�i Bölümü
Tez Yöneticisi: Y. Doç. Dr. Yasemin Nielsen
Aralık 2003, 111 sayfa
Modern data iletim ve ileti�im sistemlerinin etkin kullanılmasıyla da�ınık
yerler arasındaki uzaklıklar yenilebilir. Ne yazık ki sektörde yürütülmü� ara�tırma
ve incelemelerde �irketlerin genellikle bilgi teknolojilerini yerinde ve do�ru �ekilde
kullanmakta ba�arılı olmadıkları ve �antiyeler ile merkez ofis arasında data iletim
gecikmelerine ve görsel bilgilerin eksikli�ine ba�lı olarak ciddi bir ileti�im bo�lu�u
–dolayısıyla i�birli�i ve koordinasyon eksikli�i- oldu�u gözlemlenmi�tir. Bilginin

vi
sunulu� �ekli bilginin kalitesi üzerinde oldukça kuvvetli bir etkendir ve
görüntüleme/görselle�tirme bilginin sunumunu geli�tirmede kullanılan araçların en
önemlilerinden biridir.
Bu tezin amacı görselle�tirmenin in�aat sektöründe ileti�im amaçlı olarak
ne derece kullanıldı�ını belirlemek ve görüntüleme uygulamalarının getirece�i
potansiyel kazançları ortaya çıkartmaktır. Bu nedenle Türk tasarım ve in�aat
�irketlerindeki mevcut görsellik kaynakları ara�tırılmı� ve in�aat �irketlerindeki
görselle�tirme kullanımının bugünkü durumu tespit edilmi� ve betimlenmi�tir.
�irketlerdeki bilgi akı�ı içerikleri ve türleri, yapım sürecindeki hangi tip bilginin
görsel gösteriminin mümkün oldu�unun tespit edilmesi amacıyla incelenmi�tir. Son
olarak, ara�tırma sonuçları ile görsel bilgi sistemlerine dair kullanıcı istek ve
gereksinimlerinin birle�ik de�erlendirilmesi için Kalite Fonksiyon Açılımı
yakla�ımı kullanılmı�tır.
Anahtar kelimeler: görselle�tirme, , ileti�im, Kalite Fonksiyon Açılımı, bilgi akı�ı

vii
ACKNOWLEDGEMENTS
I would like to express great appreciation to Assist. Prof. Dr. Yasemin
Nielsen for her thorough supervision, guidance and continuous suggestions
throughout this research and preparation of this thesis. I also want to express my
sincere gratitude for her full support, encouragement, patience and friendship.
I acknowledge the firms interviewed for their contribution to this research.
I am thankful to all my friends, especially to Ça�la, Özlem, Aslı and Ali
Cihan for their moral support. I would like to express special thanks to my true
friends, Gülce Kumrulu and Bilge E�itgen, for the friendship and support they have
been providing for years. I thank to Lars Nielsen for his assistance and moral
support during the preparation of this thesis.
I am grateful to my family for their endless patience, encouragement,
support and help all my life and especially during my postgraduate education. I am
especially grateful to my sister for cheering me up whenever I am down.
viii
TABLE OF CONTENTS
ABSTRACT............................................................................................... iii
ÖZ.............................................................................................................. v
ACKNOWLEDGEMENTS....................................................................... vii
LIST OF TABLES..................................................................................... xiii
LIST OF FIGURES................................................................................... xv
LIST OF ABBREVIATIONS.................................................................... xvi
CHAPTERS
1.INTRODUCTION.................................................................................. 1
1.1 General………………………………………..…………………. 1
1.1.1 Quality of communication…………...…………………... 2
1.1.2 Quality of information……………………...……………. 3

ix
1.1.3 Visualisation……………………...……………………… 4
1.2 Objective and Scope………………………...…………………… 5
1.3 Brief Explanation of the Research Methodology………..………. 6
2.VISUALISATION IN CONSTRUCTION INDUSTRY AND
PREVIOUS RESEARCH………………..……………..……………….. 9
2.1 IT Approach in Construction……………………..……………... 9
2.2 Communication in Construction…………………..…………….. 11
2.2.1 Integration…………………………………..…………… 12
2.2.2 Quality of communication…………………..…………... 13
2.2.3 Quality of information………………………..…………. 14
2.2.3.1 Quality of information in construction…..…….. 15
2.2.3.2 Visual communication………….…….…..……. 18
2.2.3.3 Visualised communication between design and
site teams………………………….………....… 20
2.2.3.4 Visualised communication in scheduling and
planning…………………….………………..… 22
2.3 Why is this research performed?……………..………………….. 24

x
3 GENERAL VIEW OF IT& VISUALISATION IN CONSTRUCTION
INDUSTRY………………………………..………..…………………... 26
3.1 General Information on the Survey…………..………………….. 26
3.2 Strategy & IT Strategy……………………..……………………. 28
3.2.1 Vision……………..……………………………………... 32
3.2.2 Strategy versus IT strategy………..……………………... 32
3.2.3 Centralisation-decentralisation level…………..………… 34
3.3 Architecture……………………………………………………… 36
3.3.1 Data format………………………………………………. 36
3.3.2 Communication media…………………………………... 36
3.3.3 Website…………………………………………….…….. 38
3.3.4 Archiving systems……………………………………….. 38
3.4 Visualisation……………………………………………………... 39
3.4.1 Visualisation in design companies………………………. 40
3.4.1.1 Enabling multidisciplinary communication……. 40
3.4.1.2 Illustration of the completed look of the design... 41
3.4.1.3 Solving buildability problems………………….. 42

xi
3.4.2 Visualisation in contracting companies…………………. 43
3.5 Emerging Technologies and Mobility…………………………… 44
3.5.1 Wireless possibilities…………………………………….. 45
4. EXPANDING THE ENVELOPE OF VISUALISATION FOR
COMMUNICATION IN CONSTRUCTION…………………………… 49
4.1 Visual Communication in Turkish Construction………………... 49
4.1.1 Data Flows in construction……………………………… 49
4.1.2 Current visualisation level of the data flows…………….. 53
4.1.2.1 Data flow versus visualisation and IT tools
matrix…………………………………………... 53
4.1.2.2 Results obtained from the matrices…………….. 55
4.2 QFD Approach…………………………………………………... 57
4.2.1 Customer Perception…………………………………….. 60
4.2.2 Visualisation tools satisfying the needs…………………. 66
4.2.3 Constraints in visualisation applications………………… 68
4.2.4 Relationship between visualisation tools and
constraints; How are the tools affected by the constraints. 69
4.2.5 Satisfaction of needs vs. constraints for each data flow…. 71
xii
4.2.6 Discussion of results…………………………………….. 74
5.CONCLUSION....................................................................................... 78
5.1 Summary of the Survey Results…………………………………. 79
5.2 QFD for Setting the Visualisation Levels……………………….. 81
BIBLIOGRAPHY………..……………………………………………… 84
APPENDIX……………….……………………………………………... 94

xiii
LIST OF TABLES
TABLE
2.1 Data quality dimensions………………………………..…. 16
3.1 The outline of the survey aims……………………..……... 29
4.1 Data flows that (may) include visualisation………..……... 50
4.2 The current visualisation and communication tools used
vs. Data flow matrix………………………………………. 54
4.3 The QFD terms named in various ways…………………... 59
4.4 Notations used in the matrix evaluation…………………... 60
4.5 Customer needs vs Data flow matrix filled by a company.. 62
4.6 Customer needs vs Data flow matrix with assigned
importance values………………………………………….
63
4.7 Customer needs vs Data flow matrix with average weights 64

xiv
4.8 Customer needs vs Data flow matrix with normalised
average importance values………………………………... 65
4.9 Tools vs Needs matrix.......................................................... 67
4.10 The relative weight calculation of constraints..................... 69
4.11 Tools vs Constraints Matrix................................................. 70
4.12 Need Satisfaction Value calculation.................................... 72
4.13 Need Satisfaction Values and Constraints of visualisation
tools for each data flow........................................................ 73
5.1 Rank of visualisation tools for each data flow……………. 82

xv
LIST OF FIGURES
FIGURE
3.1 The relationship of IS, IT and business strategies………… 30
3.2 The IS/IT business strategies and relationships…………... 31
4.1 Context Diagram.................................................................. 52
4.2 The House of Quality……………………………………... 58

xvi
LIST OF ABBREVIATIONS
AEC Architecture, Engineering and Construction
AHP Analytic Hierarchy Process
BBS Bulletin Board System
CAD Computer Aided Design
CAVE Computer Assisted Virtual Environment
D Dimension
DIVERCITY Distributed Virtual Workspace for Enhancing
Communication within the Construction Industry
DSS Decision Support System
DXF Drawing Exchange Format
GIS Geographical Information Systems
GPRS General Packet Radio Services
GSM Global System for Mobile Communications
HOQ House of Quality

xvii
ICT Information and Communication Technology
IFC Industry Foundation Classes
IS Information System
IT Information Technology
LAN Local Area Network
LEWIS Lean Enterprise Web Information System
OSCON Open Systems for Construction
PC Personal Computer
PDA Personal Digital Assistance
QFD Quality Function Deployment
SWOT Strengths &Weaknesses - Opportunities & Threats
UMTS Universal Mobile Telecommunications Systems
VIRCON Virtual Construction Site
VR Virtual Reality
VRML Virtual Reality Modelling Language
WLAN Wireless Local Area Network
XML Extensive Mark up Language

1
CHAPTER 1
INTRODUCTION
1.1 General
Construction activities are carried out by many parties collaborating to
successful completion of a project creating value to all involved. The traditional
approach is similar to a relay race with the assumption that the project life cycle is
divided into a series of sequential and separate operations undertaken by individual
parties (Egan 1998). In this approach it is considered that each party is responsible
for the assigned stage and does not have to pay attention to the previous or the
following stages. This system seldom works out well due to the nature of the
construction industry with unique, information-intensive projects requiring
extensive co-ordination and communication between parties involved including all
designers, engineers, constructors, suppliers, client etc.
How this co-ordination and communication will be provided depends on
many items; the characteristics of the company, the type of job undertaken, type
and format of data required, etc. The strength of the link between the main office

2
and the site office in a contracting company is determined according to
centralisation-decentralisation level of that company. If the centralisation level is
high, meaning that the decisions are made in the main office, then the data provided
from sites will be in higher amount than a company with a lower centralisation
level. No matter how the type and characteristics of the communication differs, the
fact that the success of the projects is mainly dependent on quality of
communication between construction parties is valid for all. The problems arising
from the misunderstanding or incomprehension of the data transferred from one to
another can be reduced or eliminated if the quality of communication media and
quality of communication data are improved
1.1.1 Quality of communication
The capability of accessing or transferring the right information at the
right time can be designated as communication quality. Therefore communication
quality includes concepts such as type of communication media, speed of data
transfer, amount of time lags, format of data, type of data, amount of data, data
accessibility, amount of collaboration and cooperation between parties,
organisation type, mobility, efficiency, effectiveness etc. The quality is not hard to
establish provided that the communication structure rests on two rigid foundations
one of which is the communication data and the other one is work organisation
characteristics. No optimum generic solution or communication type can be
suggested since each company has its own characteristics and business system.

3
However each company has to establish its communication structure based on the
above foundations stated above in order to provide quality of communication.
The staggering advances in information technology now allow
construction industry to hold data in electronic format and to transfer through an
electronic environment. According to the centralisation level, the type of job and
the data format, the means of data transfer may change from fax or e-mails to well
structured network systems. Put simplistically, a simplistic method chosen by the
company is acceptable as long as it supplies the right information at the right time.
On the other hand the construction sector has rarely succeeded in choosing and
applying the optimum methods of keeping, transferring and transmitting data.
1.1.2 Quality of information
Construction sector is a multi party-sector requiring cooperation and
collaboration between the parties. General view of the sector provides a picture of
sequential and separate operations assigned to individual parties. Conversely some
firms have attempted themselves from this method of operation established
improved cooperation of the parties in each operation through exploitation of IT
(Information Technology) technologies supporting a higher level of integration.
Whatever does the construction company choose as a way of business, the
information exchange between the parties and operations are inevitable and
improving the quality of communication and quality of data will improve the
company’s competitive status.

4
In this research, the ability of the comprehension and ease of capturing the
idea is referred as one of the most important quality characteristics of information.
The communication between the parties and offices are generally established by
traditional methods, by exchange of drawings and sketches which have often been
found inadequate to provide sufficient information to builders regarding design
ideas, methods, procedures or details.
Many problems on site that reportedly occur due to unclear design
information are generally caused by the misunderstanding or incomprehension of
the design data, complete but presented in old-fashioned form. The presentation of
data affects the comprehension time and correctness. It is observed that sometimes
even a chart can shorten the comprehension time. Therefore how information is
presented has a great bearing on quality of information. One of the most important
tools used to improve the presentation of data is visualisation.
1.1.3 Visualisation
Vision is the most highly developed human sense. Visualisation is
therefore a means of communication in which comprehension is instant, but also
with considerable depth of the information delivered. It may typically be used for
clarification of a subject that is difficult to explain in any other notation.
Visualisation is directly related with the quality of the information, enhancing
faster and easier human comprehension.

5
Visualisation is the visual representation of information to maximise
human comprehension. It has throughout history been a ‘soft’ discipline restricted
to the areas of art and architecture. The term visualisation often denotes a
mechanism of the mind; to ‘visualise’ something is to make a picture in one’s head
of a complicated situation for the purpose of understanding or design development.
Computerized visualisation is generally the task of rendering a 3D model into a 2D
picture or animation. This is accomplished by rendering appearance of objects
(colour, reflections, texture mapping, light sources) in the 3-dimensional model.
Simple 3D visualisation or functionality characteristics (like simulation) may in
many cases be the purpose of a visualisation, but if required photo-realistic images
and animations can be produced by means of sophisticated render algorithms. With
real-time human interface with artificial 3D environments created from computer-
based data, we enter the realm of virtual reality (VR).
1.2 Objective and Scope
The purpose of this research is to evaluate the extent of visualisation as a
communication tool in construction industry and to determine potential benefits to
be gained through implementation of visualisation.
In 1990’s there was a Canon camera commercial on television in which
after a long, flashy series of tennis forehands, backhands, and other shots, Andre
Agassi turns to the screen and says, "Image is everything." This phrase is accepted
as the fundamental principle of many organisations in design, advertising,

6
computer and art industry nowadays. In the commercials, since the time is limited,
the visual objects are crucial to bring about sudden flashes in the viewers mind and
provide immediate comprehension. In construction, time is extremely limited too.
This research is built upon the question “Why would not the construction
companies benefit from the same principle in order to decrease the time spent for
understanding the information transferred between the parties?”
1.3 Brief Explanation of the Research Methodology
Firstly the current status of visualisation use for communication in
construction firms is mapped to determine what has to be done in order that the
construction companies obtain optimum benefit from visualisation. Whether
construction sector has seized the opportunities offered by visualisation tools are
examined.
The general characteristics of the Turkish construction sector -IT in
general and visualisation in particular- are derived through a survey composed of
both open ended and closed ended questions directed to top level managers of the
construction companies during interviews conducted. The IT tools used in order to
provide communication between the parties involved in construction processes, the
format used to keep and transfer data are investigated. The appropriateness of the
IT tools used and IT decisions made to the IT and corporate strategies of the
companies are studied. Which data are transferred in which format and from which
construction nodes to which construction node are explored.

7
The current visualisation level of the companies and the level of
visualisation required for the construction firms are also derived. The visualisation
tools used for visualisation of each data flow are determined. Some examples and
past experience stories are provided by the companies enlightening the
complexities and possible problems to be faced through the visualisation
applications. The survey also aimed to determine the level of visualisation which
will balance time, effort and cost of the visualisation process versus the time, effort
and cost spent for the advantages brought by visualisation.
Findings of this survey are explained in a detailed manner in the third
chapter, “General View of IT& Visualisation in Construction Industry” and the
fourth chapter of this thesis study, “Expanding the envelope of visualisation for
communication in construction”
Under the light of the survey, whether the tools used currently in the
construction sector satisfy the requirements of the construction companies are
investigated and possible visualisation enhancements are discussed. The
advantages and disadvantages of the visualisation tools are revealed and possible
implementation hesitations, pressures, and restraints are questioned. These analyses
are carried out through a number of matrix evaluations which are explained in
detail in the chapter “Expanding the envelope of visualisation for communication
in construction”. In this chapter the use of visualisation is evaluated, computerized
or otherwise, in Turkish construction in order to determine an optimum level of
visualisation implementation for each data flow.

8
In this research, it is fully realised that there will be cases where graphical
or visual means are unnecessary, such as in cases where the necessary information
can be presented in one sentence of text. Similarly, some data are considered to be
hard to visualise and it would be fruitless to deal with visualisation for some data if
it is not that complex to prevent fast comprehension. However, there is general
consensus among construction management researchers that visualisation is a key
technological theme with great potential to improve the construction process.

9
CHAPTER 2
VISUALISATION IN CONSTRUCTION
INDUSTRY AND PREVIOUS RESEARCH
2.1 IT Approach in Construction
New technological advances are arising each day and most sectors gain
advantage of the technologies directly applicable to them or convertible into new
forms to be applied to their particular sector. IT has provided these sectors with
great advantages in speed of operation, consistency of data generation, accessibility
and exchange of information. [Mohamed and Stewart 2003] With the emergence of
technological innovations, the distance and spatial boundaries have been blurred to
the point where any organization can theoretically participate in a design or
construction project in any location. [Chinowsky 2000]
Mohamed and Stewart (2003) state that the scope and boundaries of the
use and performance of IT in construction are defined in different ways as follows:

10
• use of all electronic means of information transfer (computer
networks, LANs (Local Area Network), Internet, mobile phones,
faxes, etc)
• use of the latest technology, such as, knowledge-based systems,
computer-based decision support systems and object orientated
CAD
• part of management strategies and concepts of concurrent
engineering, just-in-time production and process reengineering
All these definitions are valid and gain varying importance under certain
circumstances. The construction companies are driven to adopt new information
technologies by four forces; competitive advantage, process problems,
technological opportunities and external requirements. [Mitropoulos and Tatum
2000] Despite all these four forces are active, construction sector is still slow in
following the technological developments. Stewart et. al. (2002) proposes a
strategic IT/IS (Information System) implementation framework, using strategic
management principles and tools such as SWOT (Strengths &Weaknesses -
Opportunities & Threats), AHP(Analytic Hierarchy Process), story telling, risk
mitigation etc to accelerate the rate at which changes in people, tasks and
organisational structure take place in order to keep up with or at least reduce the
distance between the rate at which the technology changes.
11
New technological advances are arising each day and construction sector
can either adapt these as they are or redesign the technical systems into the forms
appropriate for the sector. Apart from the appropriate design of technical systems,
the success of implementing a new ICT (Information and Communication
Technology) system requires complete understanding of end users and
organizational requirements. [Soetanto et. al.2003] Dasgupta (1997) argued that
organization size, the degree of centralization in decision making, formalization of
work and organizational culture all influence ICT adoption.
The new technologies, adapted properly to construction sector, may
reduce distances between geographically dispersed offices and form a continuous
collaboration and cooperation link between the parties but it is observed in the
industry that the firms generally fail in implementing the information technologies
properly. The problem in construction sector is not a lack of technology but more a
lack of awareness of how to exploit it and of how important major process and
culture change is in order to allow this to happen. [Betts and Ofori 1999] A
technology will be appropriate if and only if the trinity of right technology, at the
right place and in the right time is achieved. [Nielsen and Erdogan 2003]. How the
firms can achieve this trinity of is one of the main targets of this study.
2.2 Communication in Construction
Construction projects are generally carried out by many parties consisting
of people with various skills, knowledge and disciplines. The sector is full of

12
problems and complexities resulting from the multi party character and
geographically dispersed offices, which have to maintain continuous
communication. The importance of effective communication for project success is
unquestionable. In a study carried out by Thamhain (1992), in which the top thirty
potential problems contributing to poor project performance are classified into five
categories, communication problems are listed as the third category. Nevertheless,
all the other categories -problems with organizing the project team, weak project
leadership, conflict-confusion and insufficient upper-management involvement- are
directly related to or involve communications which makes quality of
communication critical for project success.
2.2.1 Integration
The traditional approach in construction sector is that the project is
divided into a series of sequential and separate operations undertaken by individual
parties (Egan 1998). The traditional separation of design from execution, the
uniqueness of each project, and the temporary teams set up for each project are but
some of the aspects causing a complicated construction process. On the other hand
for the success of the projects better integration is required since collaboration and
cooperation between the parties are inevitable. The integration problems are
therefore closely linked to the problem of communication.
According to Fischer et. al. (1998) integration is defined as the
“continuous interdisciplinary sharing of data, knowledge and goals among project

13
participants” and is classified as single project, multi-project and industry-wide
project integration, social and technical contexts of which are discussed in detail.
In order to achieve continuous interdisciplinary sharing of data two
categories of interaction should be achieved [Bennett 1985, Ganah et. al. 2000].
• Communication of information: information should be first
translated into text or graphics that the other team is likely to
understand. These data need to be communicated to the other team
through communication medium.
• Work organisation: clear organisation of work allows the work of
teams to fit together. In other words teams should coordinate their
actions and decision making should follow management structure.
Communication of information, in this thesis, is handled as the
combination of communication medium and communicated information, therefore
speaking of their improvement, quality of communication and quality of
information are referred respectively.
2.2.2 Quality of communication
The effectiveness of communication can be measured using critical
communication variables; accuracy, procedures, barriers, understanding, timelines
and completeness. [Thomas et. al. 1998] Luiten and Tolman (1997) state that the
quality of communication is dependent firstly on the organisational changes, which

14
will bridge the gap between design and construction information and between
design and construction management stages, and secondly on computer aided
communication approach.
The communication between parties is generally carried out through the
exchange of drawings, sketches and text documents. If the data are created as
written or plotted hard copy documents then the transfer is performed through mail,
cargo or courier. Otherwise the electronic environment is used for information
transfer. Electronic mail, electronic bulletin board, virtual reality, network
applications and web based communication systems are a few examples of
electronic transfer. The complexities and problems of construction projects can be
reduced by increasing the effectiveness, efficiency and quality of the
communication through the introduction of the appropriate IT and visualisation
tools offered by the emerging technologies.
2.2.3 Quality of information
Data quality can be a unique source of competitive advantage and
construction companies have to treat information as a strategic source for the aims
of sustainable competitive advantage. The necessity to improve the quality of data
is well explained by Redman (1996) as follows:
Only four types of organizations need to worry about data quality.
• Those that care about their customers
• Those that care about profit and loss

15
• Those that care about their employees
• Those that care about their futures
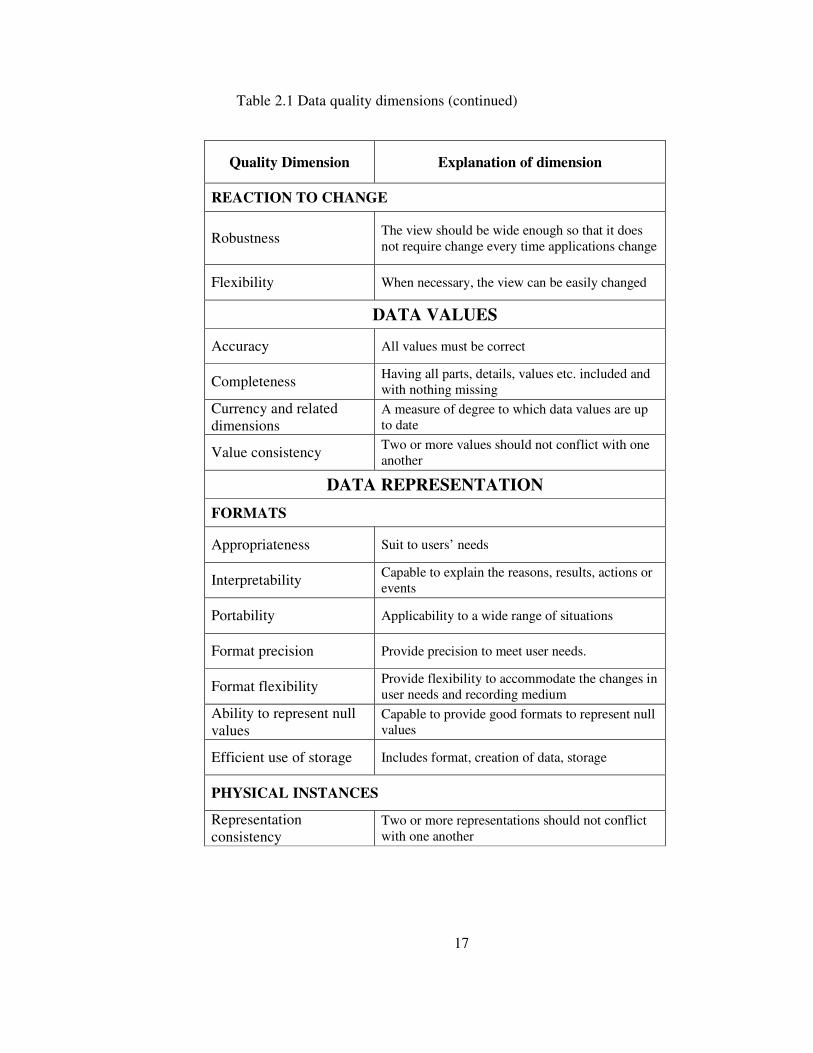
Data quality dimensions are defined by Redman (1996) and classified into
four main groups: conceptual view, data values, data representation, information
technology.
These data quality dimensions groups and their subgroups may be
examined in table 2.1.
In this thesis, the data quality in construction sector is the issue of concern,
and the focus is mainly on how to present data in order to provide maximum
comprehension within minimum time and how to share and transfer those data to
the other parties.
2.2.3.1. Quality of information in construction
Many parties coming together on projects have only a casual working
relationship because they are from different disciplines and often also from
different organisations. [Liston et. al. 2001] Nonetheless each of them needs to
access the other’s data in order to complete their parts. This information is
generally kept in a format according to the creator’s discipline neglecting the other
parties’ disciplines. Many problems arise from unclear presentation of material
between the professionals even within the same discipline

16
Table 2.1 Data quality dimensions
Quality Dimension Explanation of dimension
CONCEPTUAL VIEWCONTENT
Relevance The view should provide data needed by theapplication
Obtainability Data values should be easily obtainable
Clarity of definition Each term in the definition of the view should beclearly defined
SCOPE
Comprehensiveness Each needed data item should be included
Essentialness No unneeded data items should be included
LEVEL OF DETAIL
Attribute granularity The attributes should be defined at the right levelof detail to support applications
Domain precision The domains of possible values should be justlarge enough to support applications
COMPOSITION
Naturalness Each item in the view should have a “natural”counterpart in the real world
Occurrence identifiability The view should make identification of individualentities easy
Homogeneity Entity types should be defined to minimize theoccurrence of unnecessary attributes
Minimum redundancy Redundancy should be kept to a minimum
VIEW CONSISTENCY
Semantic consistency The view should be clear and unambiguous andconsistent
Structural consistency Entity types and attributes should have the samebasic structure wherever possible
17
Table 2.1 Data quality dimensions (continued)
Quality Dimension Explanation of dimension
REACTION TO CHANGE
Robustness The view should be wide enough so that it doesnot require change every time applications change
Flexibility When necessary, the view can be easily changed
DATA VALUES
Accuracy All values must be correct
Completeness Having all parts, details, values etc. included andwith nothing missing
Currency and relateddimensions
A measure of degree to which data values are upto date
Value consistency Two or more values should not conflict with oneanother
DATA REPRESENTATIONFORMATS
Appropriateness Suit to users’ needs
Interpretability Capable to explain the reasons, results, actions orevents
Portability Applicability to a wide range of situations
Format precision Provide precision to meet user needs.
Format flexibility Provide flexibility to accommodate the changes inuser needs and recording medium
Ability to represent nullvalues
Capable to provide good formats to represent nullvalues
Efficient use of storage Includes format, creation of data, storage
PHYSICAL INSTANCES
Representationconsistency
Two or more representations should not conflictwith one another
18
The communication between the design teams and site is generally
established by traditional methods, by exchange of drawings and sketches which
have often been found inadequate to provide sufficient information to builders
regarding design ideas, methods, procedures or details. [Erdogan and Nielsen 2002]
The problems on site that reportedly occur due to unclear design information are
generally caused by the misunderstanding or incomprehension of the design data,
complete but presented in old-fashioned methods. Present computer technologies,
such as electronic mail and Internet allow for the electronic exchange of
information and can substantially increase the amount and variety of project
information communicated as compared to traditional manual methods [Zaneldin
et. al. 2001].
2.2.3.2. Visual communication
Visual and written communication can be considered as supports for one
another. It is generally accepted that written communication had a pictographic
origin, initially as pictorial representation of concrete objects. In most writing
systems this simple relationship was later replaced by the concept that a
pictographic symbol could be used for its phonetic value. This system – the rebus
principle – led to the alphabets [Robinson 1995]. Simplicity of scripts, made
possible by the alphabets’ phonetic efficiency, has had an importance to human
history that cannot be overstated. However, complexity and pace of human
endeavours have increased immensely, especially in the last century, and there is a
continuous increase in the need for information creation and flow. Meanwhile,
technologies have evolved in the last decades that allow for creation and

19
communication of information, or data, with such ease, that there is an
overabundance of information in society, in organisations and in projects.
Communication with the written word is no longer the best choice for all cases
where there is a need for brief, understandable or particularly complex information.
Due to the overwhelming amounts of written communication in a modern project
environment, the support brought forward by visual means has become ever more
essential.
In our present day, pictographic communication is still highly successful,
for example in engineering in the form of drawings or diagrams. Such symbolic or
logographic communication, however, is often extremely specific in the type of
information it can convey. The effectiveness of symbols is inherently limited, they
are most efficient when they represent objects and much less efficient in
representing a process or activity.
Vision is the most highly developed human sense. Visualisation is
therefore a means of communication in which comprehension is instant, but also
with considerable depth of the information delivered. It may typically be used for
clarification of a subject that is difficult to explain in any other notation.
Visualisation has throughout history been a ‘soft’ discipline restricted to the areas
of art and architecture. The term visualisation often denotes a mechanism of the
mind; to ‘visualise’ something is to make a picture in one’s head of a complicated
situation for the purpose of understanding or design development.

20
At this point it is important to realize that visualisation is a communication
method made accessible to all by the progress in information technology.
Computerized visualisation is generally the task of rendering a 3D model into a 2D
picture/animation, normally using one of the many software tools available.
2.2.3.3. Visualised communication between design and site teams
The use of computer visualisation tools will improve communication
between design offices and site teams, and insure proper and correct
implementation of design, and facilitate the collaboration between site and design
teams to solve buildability problems [Ganah et. al. 2000].
Design, planning, and scheduling of construction projects requires
complicated decision making concerning functional requirements of the project;
designs to meet those requirements; plans for the design, construction, start-up and
operations processes; budget justification and tracking; scheduling and tracking;
and managing the organisation that will do the design, construction and operation.
[Kunz et. al. 2002] The plans and designs prepared for these processes and all data
transferred between each can be made more effective if visualisation
implementations are used.
VR (virtual reality) forms a natural medium for building design as it
provides 3D visualisation, which through real-time manipulation can be used
collaboratively to explore different stages of the construction process and VR
environments can be built from CAD models through data translation approach,

21
library-based approach or straightforward translation approach. [Whyte et. al.
2000] The DIVERCITY project, Distributed Virtual Workspace for Enhancing
Communication within the Construction Industry, using VR technologies, is aiming
to develop innovative workspace technologies for the briefing and design phases of
the lifecycle that will allow construction companies to conduct client briefing,
design reviews, simulate what if scenarios, test constructability of buildings and
communicate and coordinate design activities between teams. [Aspin et. al 2001,
Aspin et. al. 2002] Another research project focused on solving the problems of
design fragmentation and the gap between the design and construction processes is
OSCONCAD (Open Systems for Construction CAD), which uses an object-
oriented database, model based CAD system and VRML (virtual reality modelling
language). [Marir et. al. 1998]
Another application is the multiuser workspace allowing communication
between designers and public, between designers and between designers and client
through the exchange of text files, images, movies, and 3D objects (CAD or
VRML) via Web Robots, BBS [Woo et. al. 2001]
Cory (2002) proposes a database driven web page through which can be
accessed 3D renderings and 3D animations created from 2D and 3D data through
modelling, rendering, animating and compressing.

22
2.2.3.4. Visualised communication in scheduling and planning
Visualisation technologies in construction are also used to improve
scheduling and planning. The state-of-art in this area is the 2D and 3D animations
and simulation, 4D CAD applications used to demonstrate the construction
activities. Animation enables the user to visualise on a computer screen the change
of status of a construction process and dynamic interactions in the process over
simulated time, and provides an opportunity for the user to observe the dynamic
interactions between interlinked events. [Zhang et. al. 2002] Besides, visual 4D
planning and scheduling technique that combines 3D CAD models with
construction activities (i.e. time) has proven benefits over the traditional tools.
[Akbas 1998] In 4D models, project participants can effectively visualise and
analyse problems regarding sequential, spatial, and temporal aspects of
construction schedules [Dawood et. al. 2002].
The vision of 4D-CAD and the functionality of the next generation 3D and
4D tools needed to generate 4D+X models (time, space and additional types of
planning information such as cost, productivity and interference) are pictured by
McKinney and Fischer (1998).
Another VR based model is proposed by Retik and Shapira (1999) aiming
to manage an effective integrated project networking tool for resource planning and
scheduling, by means of combining construction scheduling tools, an object
oriented database, a visual basic interface and VR tools.

23
Liston et. al. (2001) demonstrates scenarios, tested in the iRoom, for
interactive information workspaces with different visualisation and IT tools, 3D
CAD, 4D CAD, CAVE (Computer Assisted Virtual Environment), IFC (Industry
Foundation Classes), to support multidisciplinary decision making. The details
regarding the iRoom, interactive room, which aims to develop and test new ways to
model, visualise, analyse and evaluate the multidisciplinary performance of design-
construction projects are explained by Kunz et. al. (2002)
The research DVC, Dynamic Construction Visualiser, proposes
visualisation of modelled construction operations and the evolving products in 3D
virtual space via several simulations, which allows effectively designed, planned,
and scheduled operations without relying solely on the planner’s judgement,
imagination, intuition, and experience [Kamat and Martinez 2000, 2001].
VIRCON, Virtual Construction Site, and LEWIS, Lean Enterprise Web
Information System, are two other research projects in this area. VIRCON is about
developing a methodology and DSS (Decision Support System) for evaluation,
visualisation and optimisation of construction schedules; and LEWIS is about
reengineering workforce information where actual production is being performed
on construction sites and provide tools to capture and process construction site
information [Christiansson et. al. 2002, Dawood et. al. 2002, Heesom and
Mahdjoubi 2002].
PHOTO-NET II is a computer-based monitoring system that uses Internet
as a communication medium and links images taken from construction sites via

24
analog video cameras and standard scheduling tools such as a critical path method
engine [Abeid et. al. 2003].
2.3 Why is this research performed?
Visualisation is a significant technological theme that may help in
increasing the effectiveness of communication during the construction process.
Continuous advances of IT have made it possible for many construction issues to
be addressed by use of visualisation at steadily lower cost. Up to now, whether
visualisation can be entered to data keeping, transferring and receiving has been
investigated for most of these processes and visualisation applications are
combined with appropriate IT technologies in order to create effective and efficient
communication systems.
Although many researchers have dealt with sophisticated communication
tools, none of the papers has considered what information site managers at the
workface actually need in order to perform the most important function of
construction, the actual building and managing the project [Christtianson et. al.
2002]. The search for improved communication in construction projects is ongoing.
Visualisation is a means of improving representation of many types of project
information. The question, of which information in the construction process can be
visually represented, seems a logical one. What implications follow if the
information is not communicated effectively has to be investigated as well.

25
Retrieving the current situation in Turkish construction industry and the
actual need of the construction industry is one of the aims of this thesis. The survey
carried out to achieve this goal is explained in the following chapter.
Types of information that can be visualised; information content and
quality, problems due to information clarification, are issues considered in this
thesis. There will be cases where graphical or visual means are unnecessary or
unsuitable, There is an optimum level for implementation of visualisation. This
optimum point is project-specific, and furthermore dynamic, as the envelope of
visualised information types is expanding, for example due to technological
development.
26
CHAPTER 3
GENERAL VIEW OF IT& VISUALISATION
IN CONSTRUCTION INDUSTRY
3.1 General Information on the Survey
The construction sector has long been a key economic factor in Turkey
with a history of significant works completed both domestically and worldwide.
Turkish construction is a multi-billion dollar industry performing diverse project
types: infrastructure, water resources, energy, process and housing. The
construction industry's economic 'pull' to the rest of the economy is one of the
highest among all economic sectors in Turkey and construction can therefore be
considered one of the economic locomotives of the country. With such an
economic importance there is plenty of potential to benefit from a well-considered
implementation of IT technologies.
To establish the current situation as regards IT in general and visualisation
in particular within Turkish construction, a survey has been carried out. The target

27
groups are 16 AEC companies, most of which are large-scale companies. The
survey is composed of both open-ended and close-ended questions. Interviews with
the IT managers, project coordinators, project managers and other top-level
managers are conducted and open-ended questions are directed to them.
Interviewers also filled out the questionnaire composed of close-ended questions
prepared in multiple-choice, fill in the blanks and matrix formats. The survey had
built-in flexibility so that respondents could include additional comments or real-
life stories, for example buildability problems or site construction outside of design
intent due to erroneous or insufficient information.
The survey mainly aims at analysing the current situation in Turkish
construction industry, understanding what kind of IT applications are used in
communication and collaboration, examining how/what visualisation is performed,
highlighting the pitfalls met during the planning or implementation stages,
identifying what kind of benefits the firm gained by implementing visualisation
techniques and detecting what visualisation types the firm requires. The aims are
outlined in Table 3.1.
The format used to keep and transfer data are investigated. The
appropriateness of the IT tools used and IT decisions made to the IT and corporate
strategies of the companies are studied. Which data are transferred in which format
and from which construction nodes to which construction node are explored. The
visualisation tools used for visualisation of each data flow are also determined. The
results of this survey are provided in this chapter in the following sections.

28
The survey also aimed to determine the level of visualisation which will
balance time, effort and cost of the visualisation process versus the time, effort and
cost spent for the advantages brought by visualisation. The evaluations and
decisions for this level are provided in the following chapter.
3.2 Strategy & IT Strategy
In construction worldwide there is a mind shift from viewing IT as a set of
tools for internal efficiency to strategic technology redefining the boundaries of
industries and application areas. It is realised that IT, properly implemented,
reaches beyond improving discrete processes. Rather IT is evaluated strategically,
as has been done in other economic sectors where IT strategy and business strategy
are inseparable. A strategic perspective must justify an implementation of
visualisation, as for any other information technology. Therefore, the alignment
between the company (business) strategy and IT strategy of the interviewed
companies are also investigated and the effects of this relation on the efficiency of
the IT applications are examined.
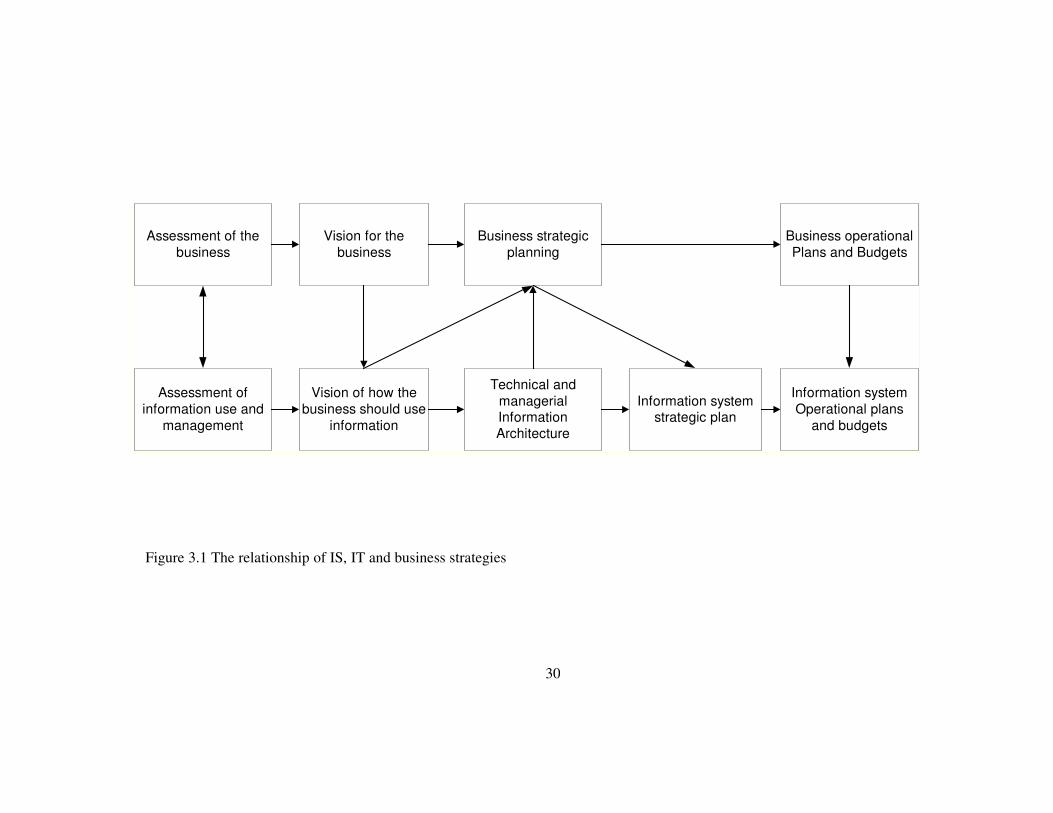
Figure 3.1 and Figure 3.2 are examples of how the company’s business
strategies are closely linked to its Information System strategy.

29
Table 3.1 The outline of the survey aims
IT STRATEGY
• Vision and strategy • Nature of IT support • Centralisation-decentralisation approach of the
company
ARCHITECTURE & VISUALISATION
• Goal-setting • Information transfer • Head office – site office information transfer • Which information – in which format • Web use • Visualisation use • Visualisation and communication tools available • Examining how/what visualisation is performed • Visualisation needs • Virtual reality use • Buildability areas with potential problems during
construction • Collaboration between site team and design team in
solving design problems • Communicating the problems on site with the
design team • Shared database use • Highlighting the pitfalls met during the planning or
implementation stages • Identifying what kind of benefits the firm gained by
implementing visualisation techniques • Assessment of visualisation and communication
tools and methods. • Wish-list • Mobile applications
EMERGING TECHNOLOGIES
• Company’s approach to emerging/new technologies • Any investigation into emerging technologies in
general • Any investigation into new telecommunication and
wireless technologies
30
Assessment of thebusiness
Vision for thebusiness
Business strategicplanning
Business operationalPlans and Budgets
Assessment ofinformation use and
management
Vision of how thebusiness should use
information
Technical andmanagerialInformationArchitecture
Information systemstrategic plan
Information systemOperational plans
and budgets
Figure 3.1 The relationship of IS, IT and business strategies

31
Figure 3.2 The IS/IT business strategies and relationships [Ward and Griffiths 1996]
32
3.2.1 Vision
Information vision is a written expression of the desired future for
information use and management in the organisation. All of the companies stated
that they have a vision for implementation despite the general observation that the
vision concept is new in Turkish construction companies. Even though there had
been a vision in the minds of the shareholders and owners, it started to be
expressed literally after the rebuilding of the management system in order to obtain
quality certification and awards. All companies that won quality awards assume
that the employees do their jobs in accordance with the company vision. Semi
annual process control reports are prepared in order to check this accordance. Some
traditional companies fail in giving the vision to all levels of the company resulting
in unpredicted and erroneous decisions on strategic or tactical levels.
3.2.2 Strategy versus IT strategy
The information technology architecture depicts the way information
resources should be deployed to deliver the information vision. The results
obtained through the interviews with top-level management revealed that all
companies are aware of the fact that having a well-defined business strategy fitting
the company expectations is the initial step for sustainable success. On the other
hand, most of the companies’ strategies are built upon intuitions of the shareholders
or top-level managers. Even if they use some strategic management techniques
such as SWOT, risk analysis & management, benchmarking, growth- share matrix,

33
industry attractiveness- business strength matrix, scenario analysis etc. the
techniques are not applied properly or formally. In other words the application of
the techniques are mostly carried out by the combination of little computational
evaluation with high amount of gut feeling.
There are at least 30 current available evaluation methods for IT benefits
[Andreasen 1999]. They can be split into objective methods, which quantify inputs
and output, and subjective methods, relying on attitudes and opinions of users and
system builders. The IT strategies observed in this survey are based on gut feeling.
None of the large-scale companies interviewed lack IT strategy, their IT strategies
are either completely or partially defined. The completely defined IT strategies are
parallel to the corporate strategy of the company. But the partially defined IT
strategies, mostly observed in medium size companies, sometimes include elements
inappropriate to the corporate strategy. Realizing the importance and necessity of
IT in success of the company, large scale companies spend time and money for
defining an IT strategy parallel to the company strategy. They also conceive that
major IT investments, which generally require substantial investment, effort and
attention, are very risky without a well-defined IT strategy and action plans to
realise that strategy.
The large-scale companies either have well-established IT departments or
an IT company under the umbrella of the corporate firm providing the IT service to
the company. The companies interviewed state that all IT applications are managed
by the IT department and top-level management commitment exists in most of the

34
IT actions. The technical support for the IT applications is provided by the
technical service groups in the IT department. In the circumstances that the
technical service groups can not solve the problems, required service is outsourced
to an agreed technical support company.
The external forces’ effect on IT investment is very high. The most
effective driving force is to gain competitive advantage in the market. The other
driving forces are the demands from the client or requirements for developing
strategic alliance in some of the projects. The other stated factors driving the
construction companies to initiate IT investment and applications are following the
advances in IT sector and keeping up with the enhancements in construction sector.
A small minority of interviewed companies state that they choose to establish and
support their own IT structures since the IT sector has not developed solutions
directly applicable to construction.
3.2.3 Centralisation-decentralisation level
Since the centralisation and decentralisation level of the company changes
the amount, type and format of information sharing and thus the IT and
visualisation approach, the companies’ centralisation tendencies are also
investigated in the survey.
The interviewed companies have two different approaches in their
centralisation-decentralisation level. Some of them consider construction sites as
independent company entities, thus sites have right to decide on many subjects
35
except the decisions requiring high financial amounts. These kinds of decisions are
made or approved by the main offices. As one company put it, the firm empowers
the sites to cure their headaches themselves but ask for approval for expensive
medicine expenditures.
On the other hand some companies choose to provide the control and
management of the sites from the main office. These companies are generally
either centralized or in a process of centralization, having many large sites
geographically dispersed to many locations. These companies intend to control the
processes from the main office. Unlike in medium size construction companies
where generally the sites and the jobs are also minor, in the case of large scaled
companies, the cumulative of the minor losses from all sites will surely cause a
problem. Another reason is resource planning, i.e. the company has to make a
balance between the sites in using equipment, money and labour. The status of the
sites is constantly examined and the construction plan is modified dynamically to
obtain the optimum resource distribution with minimum losses. Therefore the firm
establishes a structured IT system and thus an IT investment including
visualisation, to decrease the distances between offices in case of centralised
approach. Ideally this system must be formed according to the IT strategy of the
company prepared in parallel to the company strategy but during the observations
in the companies it is realised that the companies sometimes fail in acting in
accordance with the IT strategy when they are trying to find a short term solution.

36
3.3 Architecture
3.3.1 Data format
Medium and large scaled companies are storing data both in electronic
format and as hard copies. The data format used varies according to the data flow
types and according to the field of the projects. Notwithstanding that design and
consultancy companies are working with information only, they are observed to
work in electronic environment more efficiently than contracting companies and
their visualisation skills are also better than contracting companies. Electronic data
are preferred to hard copies whenever possible since the electronic data losses are
generally recoverable; storing and archiving are easy; and transfer in the electronic
medium is faster. Filing and archiving hard copies is considered a time consuming
process. Furthermore finding a document in those files is another time consuming
process regardless of how well the filing system is.
3.3.2 Communication media
E-mail is the preferred communication media among all companies
interviewed. Document transfers over e-mail include DXF (Drawing Exchange
Format) files, text files, charts, CAD drawings, digital photographs, virtual models
and simulation models as e-mail attachments between the offices. Files of large
size are written on CDs (compact disk) and transferred via cargo or post. The hard
copies of drawings and text files are also transferred via cargo, courier or post.

37
All have network system and multi user databases in their main offices
and LAN’s at the sites. The authorization allowance and restrictions are defined for
each user or user group according to their departments or projects they are involved
in.
Some of the large-scale companies provide inter-organisational
communication via lease lines, ISDN or Intranet. These companies are large scale
companies having strong centralisation strategies and their communication system
is designed in order that any information recorded on site, generally material,
labour and equipment data, can be accessed from each office right after the record.
Companies communicating through the web-based medium also have electronic
bulletin board applications but they are not used efficiently. Even if bulletin board
applications are set, the use is limited to top-level management posting general
announcements to inform the employee about company wide subjects.
Electronic communication is preferred for data transfer mostly between
the offices of the company for the high speed, immediate response and data
recovery characteristics. On the other hand most companies suffer from the senior
engineers and project coordinators, highly experienced but failing to follow many
technological advances, since they can not use the electronic opportunities at
maximum efficiency themselves.
Electronic communication is also preferred between design offices and
construction offices but the communication with the client is mainly on hard
copies. Even if exchange of electronic copies takes place, the legally accepted

38
copies remain hard copies. This is due to the fact that many clients are public
organisations with relatively traditional or old-fashioned business processes.
3.3.3 Website
All large-scale companies interviewed have websites but only half of the
companies included possibility for future intranet and extranet applications in the
servers’ planning and design. The websites’ primary aim is presenting the company
for possible strategic partnerships and clients, therefore only general information
on company and its short history are published on the website. The completed
projects and under construction projects are listed and contact information is given.
3.3.4 Archiving systems
The data are kept in electronic format but they are not archived well for
the future. Moreover the current archiving systems are hard copy format in most of
the companies. However, some firms are either planning or currently starting a new
system. Some firms use web based archiving systems that can be accessed from
each node of the construction company but these are archiving systems built for
accounting data.
Most of the firms do not treat information as a strategic resource; they feel
the importance of it but have been unable to structure a system transferring a
person’s experience, gained through projects, to a database to be used in future
decisions.

39
3.4 Visualisation
Construction sector has adopted visualisation slower and at different levels
of intensity compared to other industries, even though substantial academic efforts
have been applied in the construction phase of the building process. All of the
companies examined in this survey use visualisation to varying extent defined by
the company itself. They consider visualisation as a means of communication in
which comprehension is simpler compared to other methods, however project
design and contracting companies use visualisation in different ways. Design
companies make use of it in showing the final project where contracting companies
make use in following the progresses on site from the main office.
There is only one ‘very traditional’ contracting firm in the survey targets
in spite of its large scale. Here, not all of the data are in electronic format and there
is still some paperwork in many processes including communication. However,
despite resorting to conventional methods this company also benefits from
visualisation, although not in sophisticated configurations but in simple and
advantageous formats. The methods and tools are 2D and 3D CAD drawings saved
and transferred in DXF format. Digital pictures and videos are captured on site and
are sent to main office to show the current views of site. It caught attention that the
firm has a database in an electronic environment (Paradox based), and is planning
to convert it to a database on a web-based environment and improve searching and
retrieval functions. This idea may be considered as an intention to use modern
methods and tools.

40
The remaining companies can be accepted as information age companies
when their management techniques, methods and tools are examined. As far as
visualisation is concerned, the extent changes from one company to another. The
general visualisation approach in the companies interviewed is given below. The
details of visual communication in companies are provided in the chapter 4.
3.4.1 Visualisation in design companies
Design companies generally use visualisation tools in rather more
sophisticated ways. The reason of project design companies to implement
visualisation techniques can be:
• Enabling multidisciplinary communication
• Illustration of the completed look of the design
• Solving buildability problems
3.4.1.1. Enabling multidisciplinary communication
Construction projects are multi-disciplinary. The professionals from
disciplines other than engineering or architecture will surely have problems in
acquiring insight of the project or details in the design when only 2D design
drawings are provided. If 3D drawings are provided together with some virtual
images or videos, then they will be able to picture the design, which is closer to the
original design in their minds. Since they are able to visualise better their decisions
will be much more reasonable and to the purpose. A bridge designed for Haliç

41
(Golden Horn) Istanbul can be given as an example. The project had to be designed
in a way that the bridge would not damage the historical characteristics of the
environment but provide harmony with them. During the project stage, many
alternatives are created and presented as virtual images prepared by combination of
CAD and 3D Studio works. The virtual images were photo-realistic and were
presented to the board consisting of professionals specialised on history, art history,
art and archaeology. The board examined the virtual images and discussed some
topics with the design team and after several meetings and modifications a final
design alternative was selected. . It must be realized that there are many
stakeholders in a construction project from outside architecture and engineering,
and the requirements of these stakeholders can more easily be evaluated using
visualisation techniques. In the vast majority of construction projects, the final
customer is not an architect or engineer. Using visualisation as a communication
medium is a method to better meeting customer needs and eventually providing
customer satisfaction.
3.4.1.2. Illustration of the completed look of the design
The visualisation may be a part of a project or is prepared for either
presentation purposes, or on demand of the client. In highway design projects, the
client generally asks for a 3D simulation of the final project. These simulations are
presented on a video animation showing the highway from the focus of a camera
either on a plane flying over or on a car travelling on the highway designed. The
geographical characteristics of the surroundings, the existing structures are shown
42
and the structures designed in the project – highway, viaducts and tunnels on the
route, crossroads, bridges, and expropriation etc. – are demonstrated by using CAD
tools and 3D modules of CAD.
Another example can be given from water supply or sewerage system
projects. The pipelines designed are shown on the ortho-photographs obtained from
satellites and presented to the client for approval.
3.4.1.3. Solving buildability problems
Finding space for heating and ventilation installations is a frequently
occurring problem in building design. During actual site works it has often been
observed that structural and mechanical designs collide, unnoticed by the designers.
A very typical example is a missing block-out in a concrete element where the
mechanical design prescribes a heating duct. Such collisions are time-consuming
and delay the construction progress. Lighting, acoustic, heating and thermal
installations and facilities management designs are built on top of the architectural
design. However, electrical and mechanical installations have often considerable
space requirements and advanced geometry. In order that the installers understand
the design details better, designers provide 3D CAD drawings or rendered images
of the buildings to the installers. Outside the housing sector the extent of advanced
geometry is even higher; bridges, tunnels and dams are all multi-disciplinary
project types with many interfaces between civil and mechanical works. For a dam
project, the designer may want to visualise the functioning of a gate..

43
3.4.2 Visualisation in contracting companies
The contracting companies’ approach visualisation from another
perspective since the aim of a contracting company is rarely illustrating the final
stage of a construction. However, contracting companies are required to show
progress – completed jobs/total jobs – and also clarify method of construction.
There is an intensive information flow between the contracting companies and the
site during construction, where visualisation may play a very important role.
The site office has to provide site information to the main office
continuously. Some of the companies send photographs or videos from the site
upon request by the client. Contractors maintaining communication between site
and main office by e-mail take the photographs themselves and send these via e-
mail. Some companies having lease lines, ISDN or intranets, in other words the
companies maintaining continuous communication and data transfer, place local
cameras on the site. The cameras generally do not send continuous views, since this
is not considered a requirement for observing construction activity. Furthermore, it
is undesirable to keep data transfer lines busy continuously. The cameras take
steady images in 30 or 60 second intervals and send it to the system making up-to-
date photographs available whenever a manager at the main office wants to check
what is happening on site.
When an unexpected situation is observed at the site, the contracting
company uses photographs and videos for design problems communication.

44
The contracting companies dealing with housing also offer virtual reality
applications like walkthrough animations. Typically in walkthrough animations,
structural and environmental objects such as walls, columns, buildings, and trees
remain stationary while the camera moves through the scene. Walkthrough
animations are used to sell houses before construction is complete, giving the buyer
possibility to evaluate the house in its completed state.
3.5 Emerging Technologies and Mobility
IT and telecommunications have been converging for many years.
Wireless LANs and 3G telecommunications are vital components in IT-Telecoms
convergence but they are only two of several technologies are contributing to the
mobile revolution: Mobile telecoms through 3G, portable/handheld computing as
well as the Internet, notably through XML (Extensive Markup Language) and e-
business protocols.
New developments in portable PC (Personal Computer) types support the
needs of an increasingly mobile economy. PocketPCs, PDAs ( or tablet PC’s have
reached remarkable levels of performance and functionality and handwritten input
is now nearly fully developed.
Already the fastest growing method of Web browsing is through wireless
devices. The Internet has a robust data container in XML, which can be considered
as an option to transfer of highly structured data, especially over the Web. XML

45
enables business to be conducted over the Internet, which in turn is spreading to
mobile devices through new generations of mobile networks. The mobile
revolution is not driven by one industry group, but by an enormous momentum
from hardware, software and telecom sectors together.
The new paradigm of IT is therefore the technology’s adoption to the way
we work rather than docking us to the desktop, even when staying continuously on-
line. For construction, with its core processes geographically dispersed outside the
main office, there are wide possibilities for integration of IT in our primary
functions and therefore in all corners of the construction process. Control of a
project depends totally on visibility and communication. By extending digital
project data to any location where it is needed in real time, the construction process
can be simplified and matured.
3.5.1 Wireless possibilities
Given the unquestionable progress of mobile IT, one of the first questions
to be asked is: Who might benefit from real-time, mobile access to project data?
Software vendors to the AEC industry have already identified obvious
areas where handheld IT solutions can help improve efficiency.
Construction/engineering professionals normally take large paper
drawings into the field. These drawings are familiar and easy to navigate.
Conversely, they’re costly to print out, cumbersome to carry, and often slightly out-

46
of-date. Quite regularly, these professionals get to the job site only to realize they
don’t have all the required drawings. So they’re forced to drive back to the office or
work on-site without all the information at hand.
Another example is the completion of a quality control check-sheet, which
is traditionally filling out blanks on a pre-printed form. In case an online project
tool is used (like a project website) the information from the paper sheet will have
to be re-entered into the tool.
Mobile access to project data would allow architects, designers, surveyors,
and field engineers of all kinds to:
• Enter on-site progress data avoiding much of the ‘paper chase’;
quality control, check of design, entry of as-built, material ordering, etc.
• Leave bulky design drawings at the office
• Review, mark up, and measure the most up-to-date digital design
data at the point of activity - using handheld computers
• Remotely access design and mapping data on an organization’s
central servers, review it, and mark it up digitally.
• Exchange data between handheld devices and project tool or
corporate server.
• Embed digital photos in GIS (Geographical Information Systems)
systems.
• Gain freedom from their desktop PC’s. More time can be spent on
site with the job and field workers.
47
• Less ‘painfully’ to update of project tool / project website through
entering data only once – in the portable PC.
In the longer term mobile IT may in general improve the way construction
projects are run. Construction is thinking ‘process’ but handover points in the
construction process are often geographically dispersed. Mobile solutions can
bridge geographical distance and allow for centralized process control and
decision-making. Mobile IT is not the solution to constructions’ problems, but it is
a tool helping the solution to the lacking integration in construction. It is obvious
that the case for mobile access to real-time project data is strong.
The upcoming 3G networks will play a vital role in enabling mobile
solutions. While the highly successful GSM (Global System for Mobile
Communications) standard allows for international roaming due to standardization,
the implications of 3G are much wider. GSM is a voice (phone) communication
standard only. UMTS (Universal Mobile Telecommunications Systems) is a
packet-switching protocol from the unset foreseen to be able to offer mobile, high-
speed data (like Internet) wherever a network is available. UMTS networks will
eventually cover areas to the same extent as GSM networks today. This means
minimal investment in hardware for the individual construction project. For
Turkey, there are no immediate plans by the operators to roll out 3G networks, but
this will change once the business case of 3G has been proven elsewhere.
GPRS (‘2.5G’) (General Packet Radio Services) is an overlay to GSM
offering always-on data capabilities. The importance of GPRS is that it is expected

48
to have a complementary role, using the same wireless devices (dual-mode), in
locations where UMTS is not available, although with lower transfer speeds.
Turkey has countrywide coverage of GPRS and some contractors have been seen to
use it in simplistic ways. The main problems is price: 1 MB transfer over GPRS is
approximately 1,5 million TL, one CD-full of information would therefore cost far
in excess of 1 billion TL, which must be considered too expensive.
WLAN (Wireless Local Area Network) networks may also have a main or
complementary role, where available. The 3GPP organisation is currently
discussing degree of integration (roaming) between 3G and WLAN. WLAN access
is limited to capacity spots for certain areas, but transfer speeds exceed those
possible with UMTS/3G. In some areas it may be beneficial to create internal
WLAN coverage on the entire building site, although this may limit the possibility
of working off the site area (for example if a handheld computer is used to log on
to corporate server outside the building site).

49
CHAPTER 4
EXPANDING THE ENVELOPE OF
VISUALISATION FOR COMMUNICATION IN
CONSTRUCTION
4.1 Visual Communication in Turkish Construction
4.1.1 Data Flows in construction
This research is based on the premises that visual information must be
augmented in construction projects, an attempt must be made to expand the
envelope of visual communication, and that there is an optimum level for
implementation of visual communication. In order to suggest an optimum level of
visual communication, as a first step all data flows between design and build teams,
and data flows between site offices and main office of the contracting company are
determined. The context diagram given in Figure 4.1 shows the data flows in the
information system of design and construction teams. Secondly, the revealed data
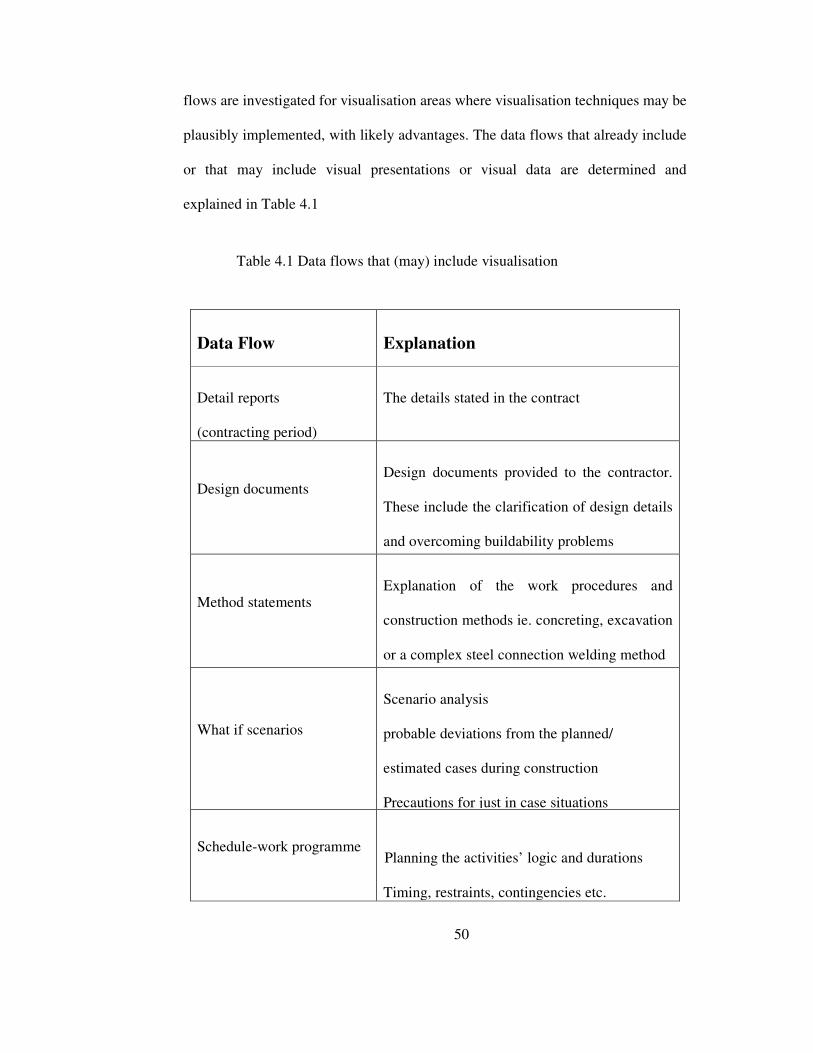
50
flows are investigated for visualisation areas where visualisation techniques may be
plausibly implemented, with likely advantages. The data flows that already include
or that may include visual presentations or visual data are determined and
explained in Table 4.1
Table 4.1 Data flows that (may) include visualisation
Data Flow Explanation
Detail reports
(contracting period)
The details stated in the contract
Design documents Design documents provided to the contractor.
These include the clarification of design details
and overcoming buildability problems
Method statements Explanation of the work procedures and
construction methods ie. concreting, excavation
or a complex steel connection welding method
What if scenarios
Scenario analysis
probable deviations from the planned/
estimated cases during construction
Precautions for just in case situations
Schedule-work programme Planning the activities’ logic and durations
Timing, restraints, contingencies etc.

51
Table 4.1 Data flows that (may) include visualisation (continued)
Data Flow Explanation
Resource planning Labour, Materials, Equipment
Progress reports Work done vs. planned
% work completed
Design problems
communication
How is the design office notified if a problem
occurs due to misleading or missing design
information?
Daily site records
Daily site records kept on site about
• Site environment conditions, weather,
ground
• Work-force and plant parameters
• Description of the work task completed that
day
• Minutes of site meetings
RFI Request for Information The requests of contractors from the client or
design office
Change Order When client requests changes to project scope
or specs and how these are transferred

52
Figure 4.1 Context Diagram [Sayar 2000]

53
4.1.2 Current visualisation level of the data flows
The visualisation tools that may be used in visualising the construction
data flows are determined as: 2D CAD drawings, 3D CAD drawings, 2D Graphics,
Charts, 3D Graphics, Charts, Tables, Photographs, Virtual Photographs (3D Studio,
studio max), Virtual Reality, Walkthrough, Video, Animation, Simulation, Steady
images, Text Documents, Daily/Weekly/ Monthly Reports, 3D Models
It is also observed that the data are transferred via: e-mail, facsimile,
telephone, CD, mail- cargo- courier, ISDN, leased lines, cable networks (e.g
Cablonet), LAN/ WAN, Electronic bulletin board, intranet, extranet, www, video
conference, virtual reality, instant messaging programs (i.e. msn, icq), mobile
technologies (i.e. PDA, blue tooth, handheld comp..), Wireless LAN, Face-to-face
meetings.
4.1.2.1. Data flow versus visualisation and IT tools matrix
In order to determine where and which visual elements are used in the data
flows, and via which common tool, “Current visualisation and communication
tools used versus Data flows matrix” is prepared (Table 4.2).
The interviewees are asked to fill in the prepared matrix according to the
currently used IT and visualisation applications in their company
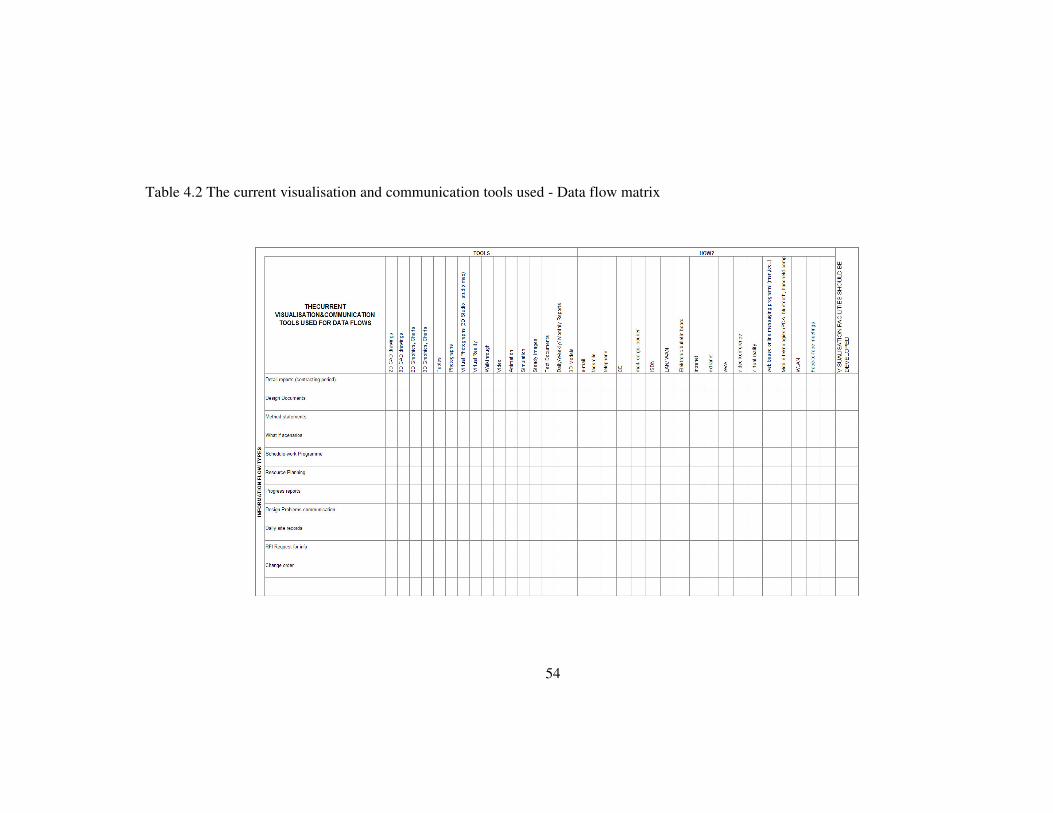
54
Table 4.2 The current visualisation and communication tools used - Data flow matrix

55
4.1.2.2. Results obtained from the matrices
Currently in the construction industry, information media for the purpose
of clarification is limited to 2D drawings, written statements and face-to-face
meetings. According to the results of this survey, just a few construction companies
are using physical and 3D models, which are limited in use. More than 60% of the
design companies interviewed are using simulation tools, but almost none of the
contracting companies interviewed use such tools.
The common methods of communication between the design and
construction teams are traditional methods and limited to 2D drawings, written
statements, face-to-face meetings, telephone, fax and e-mail. Most of the
buildability problems are due to insufficient understanding of the drawings and
design details, poor communication, and conflicting design information.
Construction delays due to buildability problems correspond to about one third of
the total project delay.
It is only a few of the interviewed companies who are using a set of
visualisation tools, physical and 3D models. Design and construction teams of the
companies who are using visualisation tools and physical models have already
experienced benefits. They report less communication problems, less project delay
time and cost. They have also experienced increase in the quality of information,
characterized by more accurate, predictive and clear information.
Less than 5% of the interviewed companies are using videoconferencing,
56
but this is a tool used not to provide communication between the design and
construction teams but for the communication between the top-level managers.
Document transfers over e-mail, which is the most common
communication media, include DXF files, text files, digital photographs, virtual
models and simulation models as e-mail attachments.
80% of the companies interviewed had an unenthusiastic attitude towards
the use of new wireless technologies and integration themes, but they were more
interested in visualisation methods.
More than 60% of the design companies interviewed are using simulation
tools to exchange information between design and construction teams and for
scheduling mainly due to the client’ s requirement. In contrast, the contracting
companies interviewed are not using simulation tools. All contractors communicate
through digital photographs taken at site and sent to the main office via e-mail or
through images of steady image cameras via ISDN lines.
The simulation of the work progress in a virtual environment enables
comparison of the completed work tasks versus a baseline of planned work tasks. A
dynamic 3D site can be constructed in the virtual environment, in which the entire
construction project can be reflected. Such a visual simulation environment would
enable a much more intuitive and simple monitoring of site activities and site-
related decision-making will be facilitated.

57
4.2 QFD Approach
The aim of this research is to determine the optimum level of visualisation
in construction data flows. Since visualisation and IT integration are two important
themes aiming at increasing quality of information and communication, the
evaluation of the optimum level can be achieved through a quality planning
perspective. In this thesis, the “optimum level of visualisation” does not refer to
optimum visualisation tools but to the optimum combination of the visualisation
tools to result in the optimum solution The chosen method for evaluation is the
QFD (Quality Function Deployment) approach and the qualitative calculations are
computed through matrices inspired from QFD.
QFD is a method for structured product planning and development that
enables a development team to specify clearly the customer’ s wants and needs, and
then to evaluate each proposed product or service capability systematically in terms
of its impact on meeting those needs [Cohen 1995]. In this research the customer is
the construction company desiring to improve the communication and visualisation
quality. The QFD product to be produced is the framework of visualisation types
and levels for each data flow. The product or service capability is set using the
technical characteristics, designated as Substitute Quality Characteristics by some
QFD professionals.
QFD process involves constructing one or more matrices through which
the subjective customer perspective is converted to technical characteristics. The

58
most common matrices system is HOQ (House of Quality), taking its name from
the shape of the combined matrices. The customer needs and wants are listed along
the left of HOQ and the technical characteristics to satisfy those needs are listed
along the top. Figure 4.2 shows an example of HOQ.
A customer perception matrix is used for prioritisation of the customer
needs and relative importance weights of the needs are determined. The roof of
HOQ shows the correlations between the technical characteristics, in other words it
shows the impact of one technical characteristic on another one. The ‘How Much’
matrix lists the rank ordering of the technical responses. The terms used to denote
the HOQ elements in literature are shown in Table 4.3.
Figure 4.2 The House of Quality

59
Table 4.3 The QFD terms named in various ways
Customer requirement Customer needs
Customer wants
WHATs
Technical characteristic Technical response
Substitute quality characteristic
Engineering characteristic
Design requirement
Technical specification
Product requirement
HOWs
Customer perception Importance weight
Planning Matrix
Technical Matrix Objectives
Targets
HOW MUCHes
Technical correlations Tradeoffs
Impact Matrix

60
4.2.1 Customer Perception
The general visualisation and IT requirements of companies are
determined during interviews and the companies are asked to evaluate the
importance of each need for each data flow by using the following notations.
Table 4.4 Notations used in the matrix evaluation
It is assumed that the customer needs and requirements’ rank of
importance would vary for each data flow thus far the interviewers’ comments and
evaluations proved that the assumption was correct. The procedure of evaluating
the customer perception through the matrix evaluations is explained below in a step
wise manner.
• Interviewers evaluate the importance of each need for each data
flow by entering L, M, H to the cells or leaving them empty or
using 0 in order to imply that the need is not important or
irrelevant to the data flow. An example of a filled matrix by a
company is given in Table 4.5.
Notation Meaning Assigned value
Not important 0
L Low 1
M Medium 3
H High 5
61
• The values of L, M, H are replaced by 1,3 and 5 respectively. The
empty spaces have a value equal to 0. The example in Table 4.5is
modified according to these replacements and shown in Table 4.6.
• The values entered to the cells by each company are added up and
divided by the number of interviewed companies, which is equal to
16 for this research. The values calculated are the average
importance values of needs (Table 4.7).
• The average importance values of needs, calculated in the previous
step, in the same column are summed up (Table 4.7).
• The average importance values are normalised by dividing the
overall importance value of their column. The relative importance
total of the needs in the same data flow column becomes equal to 1
after this step (Table 4.8).
The values calculated through these steps provide the customer perception
perspective. For example if the values in the Design Documents column are
investigated it will be realised that the most important needs to be satisfied are
better comprehension, quick comprehension, clarification of design details.

62
Table 4.5 Customer needs vs Data flow matrix filled by a company (L=1, M=3, H=5)
Custom
er N
eeds-
Data
Flo
w Mat
rix
Det
ail r
epor
ts (c
ontra
ctin
g pe
riod)
Res
ourc
e P
lann
ing
Sch
edul
e-w
ork
Pro
gram
me
DATA FLOW TYPES
RF
I Req
uest
for i
nfo
Met
hod
stat
emen
ts
Des
ign
Pro
blem
s co
mm
unic
atio
n
Wha
t if s
cena
rios
Cha
nge
orde
r
Pro
gres
s re
port
Dai
ly s
ite re
cord
s
Des
ign
Doc
umen
ts
easy to develop H M H M H M H M M M M
electronic data transfer H H M M M M M M L H H
fast data transfer (with fast connection availability) H H H H H H H H L H H
easy access in remote ares M M H H M M H M H H
continuous communication (min data transfer lag) H M L H M H H H M H H
can clarify design details H H H M M M H M M H H
can clarify construction methods H M H M L M M H M M M
suitable for conveying gained project experience to future projects M M L L M M M M M M M
allow mutidisciplinary communication M M H H M H H M M M M
better comprehension H H H H M M H H H M M
quick comprehension H H H H M M H H H H H
platform mobility M M M H M L L L M M
check what if scenarios M M L H H H H H H H H
help conflict resolution M M M L M M H M M M M
possibility for online meeting M L L L L L L M M M M
Custom
er N
eeds-
Data
Flo
w Mat
rix
CU
STO
ME
R N
EE
DS
AN
D R
EQ
UIR
EM
EN
TS
Det
ail r
epor
ts (c
ontra
ctin
g pe
riod)
Res
ourc
e P
lann
ing
Sch
edul
e-w
ork
Pro
gram
me
RF
I Req
uest
for i
nfo
Met
hod
stat
emen
ts
Des
ign
Pro
blem
s co
mm
unic
atio
n
Wha
t if s
cena
rios
Cha
nge
orde
r
Pro
gres
s re
port
Dai
ly s
ite re
cord
s
Des
ign
Doc
umen
ts

63
Table 4.6 Customer needs vs Data flow matrix with assigned importance values
DATA FLOW TYPES
RFI
Req
uest
for i
nfo
Met
hod
stat
emen
ts
Des
ign
Pro
blem
s co
mm
unic
atio
n
Wha
t if s
cena
rios
Cha
nge
orde
r
Pro
gres
s re
port
Dai
ly s
ite re
cord
s
Custom
er N
eeds-
Dat
a Flo
w Mat
rix
Det
ail r
epor
ts (c
ontra
ctin
g pe
riod)
Res
ourc
e P
lann
ing
Sch
edul
e-w
ork
Pro
gram
me
Des
ign
Doc
umen
ts
easy to develop 5 3 5 3 5 3 5 3 3 3 3
electronic data transfer 5 5 3 3 3 3 3 3 1 5 5
fast data transfer (with fast connection availability) 5 5 5 5 5 5 5 5 1 5 5
easy access in remote ares 3 3 5 5 3 3 5 3 5 5
continuous communication (min data transfer lag) 5 3 1 5 3 5 5 5 3 5 5
can clarify design details 5 5 5 3 3 3 5 3 3 5 5
can clarify construction methods 5 3 5 3 1 3 3 5 3 3 3
suitable for conveying gained project experience to future projects 3 3 1 1 3 3 3 3 3 3 3
allow mutidisciplinary communication 3 3 5 5 3 5 5 3 3 3 3
better comprehension 5 5 5 5 3 3 5 5 5 3 3
quick comprehension 5 5 5 5 3 3 5 5 5 5 5
platform mobility 3 3 3 5 3 1 1 1 3 3
check what if scenarios 3 3 1 5 5 5 5 5 5 5 5
help conflict resolution 3 3 3 1 3 3 5 3 3 3 3
possibility for online meeting 3 1 1 1 1 1 1 3 3 3 3
RFI
Req
uest
for i
nfo
Met
hod
stat
emen
ts
Des
ign
Pro
blem
s co
mm
unic
atio
n
Wha
t if s
cena
rios
Cha
nge
orde
r
Pro
gres
s re
port
Dai
ly s
ite re
cord
s
Custom
er N
eeds-
Dat
a Flo
w Mat
rix
CU
STO
ME
R N
EE
DS
AN
D R
EQ
UIR
EM
EN
TS
Det
ail r
epor
ts (c
ontra
ctin
g pe
riod)
Res
ourc
e P
lann
ing
Sch
edul
e-w
ork
Pro
gram
me
Des
ign
Doc
umen
ts

64
Table 4.7 Customer needs vs Data flow matrix with average weights
D A T A F L O W T Y P E S
RFI
Req
uest
for i
nfo
Met
hod
stat
emen
ts
Des
ign
Pro
blem
s co
mm
unic
atio
n
Wha
t if s
cena
rios
Cha
nge
orde
r
Pro
gres
s re
port
Dai
ly s
ite re
cord
s
Custom
er N
eeds-
Data F
low Matr
ix
Det
ail r
epor
ts (c
ontra
ctin
g pe
riod)
Res
ourc
e P
lann
ing
Sch
edul
e-w
ork
Pro
gram
me
Des
ign
Doc
umen
ts
e asy to d e ve lo p 3 .1 7 3 .5 0 3 .8 3 2 .3 3 4 .6 7 4 .33 4 .67 3 .0 0 2 .8 3 2 .3 3 2 .3 3
e le c tron ic d a ta tra n s fe r 2 .3 3 3 .5 0 2 .0 0 2 .3 3 2 .8 3 3 .17 3 .17 2 .3 3 2 .0 0 2 .6 7 2 .6 7
fa s t da ta tra n s fe r (w ith fa s t co n n e c tio n a va ila b ility) 2 .6 7 3 .1 7 2 .3 3 2 .3 3 3 .1 7 4 .33 3 .50 2 .6 7 2 .1 7 2 .8 3 2 .8 3
e asy acce ss in rem o te a re s 1 .1 7 2 .3 3 2 .3 3 2 .6 7 3 .0 0 3 .67 3 .00 3 .0 0 2 .5 0 2 .3 3 2 .6 7
co n tinu o u s co m m u n ica tio n (m in d a ta tra ns fe r lag ) 2 .3 3 2 .0 0 2 .3 3 2 .3 3 3 .5 0 4 .67 3 .83 2 .6 7 2 .3 3 2 .6 7 2 .3 3
ca n c la r ify de s ig n d e ta ils 2 .6 7 4 .3 3 4 .0 0 2 .3 3 2 .6 7 3 .00 2 .67 2 .8 3 2 .3 3 2 .6 7 2 .6 7
ca n c la r ify con s truc tion m e tho d s 3 .1 7 3 .1 7 3 .8 3 2 .3 3 2 .0 0 2 .33 1 .67 3 .5 0 2 .3 3 2 .3 3 2 .3 3
su ita b le fo r co nve yin g g a in ed p ro je c t e xp e rien ce to fu tu re p ro jec ts 2 .0 0 2 .0 0 1 .6 7 1 .6 7 3 .3 3 3 .33 3 .67 2 .0 0 2 .5 0 2 .0 0 2 .0 0
a llo w m u tid is c ip lin a ry co m m u n ica tio n 1 .6 7 3 .5 0 3 .8 3 2 .0 0 3 .8 3 4 .17 2 .67 3 .8 3 1 .6 7 1 .6 7 1 .6 7
b e tte r co m p re he n s io n 2 .8 3 4 .6 7 3 .8 3 1 .6 7 3 .3 3 3 .50 3 .50 2 .5 0 2 .1 7 2 .6 7 2 .6 7
q u ick co m p reh e n s ion 2 .6 7 4 .6 7 2 .6 7 2 .3 3 2 .6 7 2 .83 2 .50 3 .1 7 2 .3 3 3 .6 7 3 .6 7
p la tfo rm m o b ility 1 .1 7 2 .3 3 2 .0 0 2 .0 0 3 .5 0 2 .33 2 .00 2 .0 0 2 .0 0 2 .0 0 2 .0 0
ch eck w ha t if s ce n a rios 1 .0 0 1 .5 0 1 .1 7 1 .6 7 2 .6 7 2 .67 2 .67 2 .1 7 1 .3 3 1 .6 7 1 .6 7
h e lp co n flic t reso lu tio n 2 .5 0 3 .6 7 2 .3 3 2 .0 0 2 .1 7 2 .83 2 .50 3 .1 7 2 .3 3 2 .3 3 2 .3 3
p oss ib ility fo r on lin e m ee tin g 1 .3 3 1 .0 0 0 .6 7 1 .0 0 0 .6 7 1 .00 1 .00 1 .8 3 1 .3 3 1 .3 3 1 .3 3
T O T A L 3 2 .6 7 4 5 .33 38 .83 31 .0 0 4 4 .0 0 4 8 .1 7 4 3 .0 0 4 0 .6 7 3 2 .1 7 3 5 .1 7 3 5 .1 7
RFI
Req
uest
for i
nfo
Met
hod
stat
emen
ts
Des
ign
Pro
blem
s co
mm
unic
atio
n
Wha
t if s
cena
rios
Cha
nge
orde
r
Pro
gres
s re
port
Dai
ly s
ite re
cord
s
Custom
er N
eeds-
Data F
low Matr
ix
CU
STO
ME
R N
EE
DS
AN
D R
EQ
UIR
EM
EN
TS
Det
ail r
epor
ts (c
ontra
ctin
g pe
riod)
Res
ourc
e P
lann
ing
Sch
edul
e-w
ork
Pro
gram
me
Des
ign
Doc
umen
ts

65
Table 4.8 Customer needs vs Data flow matrix with normalised average importance values
Customer
Nee
ds- D
ata F
low M
atrix
Det
ail r
epor
ts (c
ontra
ctin
g pe
riod)
Res
ourc
e P
lann
ing
Sch
edul
e-w
ork
Pro
gram
me
DATA FLOW TYPES
RFI
Req
uest
for i
nfo
Met
hod
stat
emen
ts
Des
ign
Pro
blem
s co
mm
unic
atio
n
Wha
t if s
cena
rios
Cha
nge
orde
r
Pro
gres
s re
port
Dai
ly s
ite re
cord
s
Des
ign
Doc
umen
ts
easy to develop 0.07 0.05 0.07 0.06 0.07 0.06 0.07 0.05 0.07 0.05 0.05
electronic data transfer 0.05 0.05 0.04 0.06 0.05 0.04 0.05 0.04 0.05 0.06 0.06
fast data transfer (with fast connection availability) 0.06 0.05 0.04 0.06 0.05 0.06 0.05 0.05 0.05 0.06 0.06
easy access in remote ares 0.03 0.04 0.04 0.07 0.05 0.05 0.05 0.05 0.06 0.05 0.06
continuous communication (min data transfer lag) 0.05 0.03 0.04 0.06 0.06 0.06 0.06 0.05 0.06 0.06 0.05
can clarify design details 0.06 0.07 0.07 0.06 0.04 0.04 0.04 0.05 0.06 0.06 0.06
can clarify construction methods 0.07 0.05 0.07 0.06 0.03 0.03 0.03 0.06 0.06 0.05 0.05
suitable for conveying gained project experience to future projects 0.05 0.03 0.03 0.04 0.05 0.05 0.06 0.03 0.06 0.04 0.04
allow mutidisciplinary communication 0.04 0.05 0.07 0.05 0.06 0.06 0.04 0.07 0.04 0.04 0.04
better comprehension 0.07 0.07 0.07 0.04 0.05 0.05 0.05 0.04 0.05 0.06 0.06
quick comprehension 0.06 0.07 0.05 0.06 0.04 0.04 0.04 0.05 0.06 0.08 0.08
platform mobility 0.03 0.04 0.04 0.05 0.06 0.03 0.03 0.03 0.05 0.04 0.04
check what if scenarios 0.02 0.02 0.02 0.04 0.04 0.04 0.04 0.04 0.03 0.04 0.04
help conflict resolution 0.06 0.06 0.04 0.05 0.03 0.04 0.04 0.05 0.06 0.05 0.05
possibility for online meeting 0.03 0.02 0.01 0.02 0.01 0.01 0.02 0.03 0.03 0.03 0.03
Customer
Nee
ds- D
ata F
low M
atrix
CU
STO
ME
R N
EE
DS
AN
D R
EQ
UIR
EM
EN
TS
Det
ail r
epor
ts (c
ontra
ctin
g pe
riod)
Res
ourc
e P
lann
ing
Sch
edul
e-w
ork
Pro
gram
me
RFI
Req
uest
for i
nfo
Met
hod
stat
emen
ts
Des
ign
Pro
blem
s co
mm
unic
atio
n
Wha
t if s
cena
rios
Cha
nge
orde
r
Pro
gres
s re
port
Dai
ly s
ite re
cord
s
Des
ign
Doc
umen
ts

66
4.2.2 Visualisation tools satisfying customer needs
The customer needs are revealed through discussions with the
interviewees. Likewise, they are asked to prioritise the needs for each data flow. As
a result, the average normalised importance weights of needs are determined.
All visualisation tools have different characteristics causing variations in
how and to what extent the customer needs are met. Considering the characteristics
and capabilities of the visualisation tools, the effectiveness of each tool on the
satisfaction of the customer needs are evaluated using L, M, H notations, which are
assigned 1, 3 and 9 values, which are the most commonly used values in QFD
approach. These values are used in this evaluation process to emphasize the strong
relationships in order to determine the parameters to focus on during the design
process. If the tool and the need are irrelevant, then 0 is used. The assessments are
marked in a matrix where the visualisation tools are listed along the left and
customer needs are listed along the top. For example, if the relevance between the
need “can clarify design details” and 3D CAD drawings is considered, the impact is
assessed as High since 3D CAD drawings have high presentation capabilities
which create a 3D picture in the user’ s mind quickly and explain all details
visually. In contrast, the same need has no relevance with daily/weekly/monthly
report which are not unimportant, but typically 1-page paper reports with a
different purpose altogether, and therefore the relation is evaluated as 0. The matrix
showing the evaluation of the degree of customer need satisfaction is given in
Table4.9.

67
Table 4.9 Tools vs Needs Matrix (L=1, M=3, H=9)
HOW MUCH DOES THE TOOL SATISFY THE CUSTOMER NEEDS?
easy
to d
evel
op
elec
troni
c da
ta tr
ansf
er
fast
dat
a tra
nsfe
r (w
ith fa
st c
onne
ctio
n av
ailib
ility
)
easy
acc
ess
in re
mot
e ar
es
cont
inuo
us c
omm
unic
atio
n (m
in d
ata
trans
fer
lag)
can
clar
ify d
esig
n de
tails
can
clar
ify c
onst
ruct
ion
met
hods
suita
ble
for c
onve
ying
gai
ned
proj
ect e
xper
ienc
e to
futu
re p
roje
cts
allo
w m
utid
isci
plin
ary
com
mun
icat
ion
bette
r com
preh
ensi
on
qui
ck c
ompr
ehen
sion
plat
form
mob
ility
chec
k w
hat i
f sce
nario
s
help
con
flict
reso
lutio
n
poss
ibili
ty fo
r onl
ine
mee
ting
2D CAD drawings H H H M H M M H M M M H M M H
3D CAD drawings M H H M H H H H H H H H H H H
2D Graphics, Charts H 0 0 L 0 M M H M L L L 0 M 0
3D Graphics, Charts, Virtual photographs (3D Studio, studio max) M H H M H H H H H H H H H H H
Tables H H H M H M 0 H L L L H M L H
Photographs H 0 0 L 0 H M H H M M M 0 M 0
Digital photographs H L H M H H M H H M M H 0 M H
Virtual Reality L M M L M H H H H H H M H H M
Walkthrough M M M M M M M H H H H M 0 M M
Video H L H M M M H H H H H H 0 H H
Animation M L H M M M H H H H H H H H H
Simulation L M H M L L H M H H H H H H H
Steady images H 0 H M H M M H H H H H 0 H H
Text Documents H H H M H M L H H L L H 0 L H
Daily/Weekly/ Monthly Reports (on paper) H 0 0 0 0 0 0 H M L L L 0 M 0
3D Models H 0 0 0 0 H 0 H H M M 0 0 0 0
TOO
LS
NEEDS

68
4.2.3 Constraints in visualisation applications
In all IT implementations, there are constraints as well as benefits. The
constraints and factors that cause negative effects on the implementation; i.e.
factors that cause hesitation to its implementation and use, are determined during
interviews: training need, requirement of user skills, legal constraints due to
electronic environment, software and hardware requirement and availability
problems, complex or difficult using, user interface, keyboard or operating system
inappropriateness and high cost
Taking into account discussions with the companies and also current
research in construction IT, it was decided that the constraints will not vary for
each data flow�������� Therefore the interviewed companies are asked to prioritise the
determined constraints. All interviewees evaluated the constraints’ negative impact
using a five-point scale. If the constraint is highly effective the value used is 5, if
the effect is medium or low, the grades assessed will be 3 or 1 respectively. As in
the prioritisation of needs assessment, ‘irrelevance’ is rated as 0. The average
values of the ratings are calculated and normalised to determine the relative weight
of implementation constraints. The average weight of the interviewers and relative
weight of constraints are shown in Table 4.10. As seen from the table the highest
hesitation is due to the high cost and of second–most importance the interviewees
state a training requirement, which is also highly related with cost. The companies
are aware, that making a software work in the organisation, i.e. training costs can
be comparable or higher, than the cost of the software itself.

69
Table 4.10 The relative weight calculation of constraints
Average scale
Relative weight
Needs training 4.00 0.157User skills required 3.00 0.118Legal constraints due to electronic environment 3.50 0.137Software and hardware requirement and availibility problems 3.75 0.147High cost 4.75 0.186Complex or difficult to use: 3.50 0.137User interface, keyboard, running system differences (inc. Language) 3.00 0.118
TOTAL 25.50
4.2.4 Relationship between visualisation tools and constraints;
How are the tools affected by the constraints?
Considering the characteristics and capabilities of the visualisation tools,
the negative effects of each tool are evaluated using the same procedures as used
for prioritisation of customer needs. Similarly, the constraints are evaluated using
L, M, H notations, which are assigned 1, 3 and 9 values and irrelevance is graded
as 0. The assessments are marked in a matrix where the visualisation tools are
listed along the left and customer hesitations are listed along the top. (Table 4.11)
The effect of the prioritisation of these constraints are reflected on these
relationships by multiplying two values. The sum of the products in each row
determines the overall constraint affects created by the visualisation tool in that
row. The importance weights of the constraints do not vary according to each data
flow. Therefore the constraint calculations shown in Table 4.12 for design
documents data flow will not change for the other data flows. The calculated
constraint affection values for all data flows are shown in Table 4.13

70
Table 4.11 Tools vs Constraints Matrix (L=1, M=3, H=9)
HOW MUCH ARE THE TOOLS AFFECTED BY THE CONSTRAINTS?
Nee
ds tr
aini
ng
Use
r ski
lls re
quire
d
Lega
l con
stra
ints
due
to e
lect
roni
c en
viro
nmen
t
Sof
twar
e an
d ha
rdw
are
requ
irem
ent
and
avai
libili
ty p
robl
ems
Hig
h co
st
Com
plex
or d
iffic
ult t
o us
e:
Use
r int
erfa
ce, k
eybo
ard,
ope
ratin
g sy
stem
diff
eren
ces
(inc.
Lan
guag
e)
2D CAD drawings M M M M H M L
3D CAD drawings H H M M H H M
2D Graphics, Charts M M L 0 0 0 L
3D Graphics, Charts, Virtual photographs (3D Studio, studio m ax) H H M H H H M
Tables L M M L L M L
Photographs L L 0 0 L 0 0
Digital photographs L L H L M L L
Virtual Reality H M H H H H H
W alkthrough H M 0 H H M M
Video L L L L M 0 0
Anim ation H M 0 H H L H
Sim ulation H M 0 H H L H
Steady im ages 0 L L M M L 0
Text Docum ents L L H L 0 L H
Daily/W eekly/ Monthly Reports 0 L 0 0 0 0 M
3D Models L L 0 0 L 0 0
TOO
LS
CONSTRAINTS

71
4.2.5 Satisfaction of needs vs. constraints for each data flow
In the Tools versus Needs matrix the impact of the visualisation tools on
satisfying the customer needs are assigned through values of 0, 1, 3, 9. Besides, the
interviewers have also determined the importance of the needs. The product of
these two values gives the weighted impact of the visualisation tool on satisfying
the needs.
The sum of these weighted impacts termed the Need Satisfaction Value.
This value shows the capability of the visualisation tool to satisfy the needs defined
by the customer according to the prioritisation, reflecting the customer’ s
perspective, of the needs.
In Table 4.12 the need satisfaction value calculations for the Design
Documents are shown at the right side of the matrix. When the values are observed,
3D CAD drawings, 3D Graphics, charts, virtual photographs, animations and
videos seem to be the most effective media. To draw the boundaries of the
visualisation tools this technique can be used effectively. On the other hand
although 3D CAD drawings have the highest Need Satisfaction Value for design
documents data flow this does not necessarily mean that the optimum visualisation
tool to be used in design documents communication is 3D CAD drawings. But it
can be stated that 3D CAD drawings usage should be prioritised in the visualisation
applications. The calculated need satisfaction values for all data flows are shown in
Table4.13.

72
Table 4.12 Need Satisfaction Value calculation
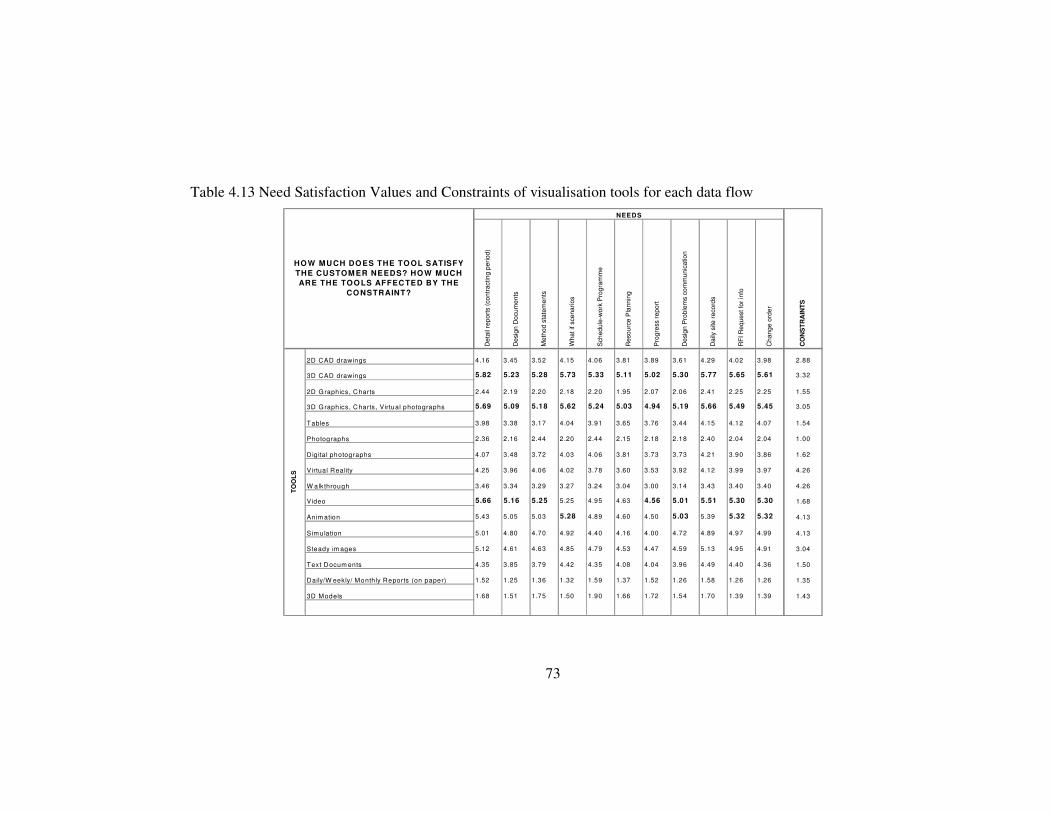
73
Table 4.13 Need Satisfaction Values and Constraints of visualisation tools for each data flow
2D CAD drawings 4.16 3.45 3.52 4.15 4.06 3.81 3.89 3.61 4.29 4.02 3.98 2.88
3D CAD drawings 5.82 5.23 5.28 5.73 5.33 5.11 5.02 5.30 5.77 5.65 5.61 3.32
2D Graphics, Charts 2.44 2.19 2.20 2.18 2.20 1.95 2.07 2.06 2.41 2.25 2.25 1.55
3D Graphics, Charts, Virtual photographs 5.69 5.09 5.18 5.62 5.24 5.03 4.94 5.19 5.66 5.49 5.45 3.05
Tables 3.98 3.38 3.17 4.04 3.91 3.65 3.76 3.44 4.15 4.12 4.07 1.54
Photographs 2.36 2.16 2.44 2.20 2.44 2.15 2.18 2.18 2.40 2.04 2.04 1.00
Dig ita l photographs 4.07 3.48 3.72 4.03 4.06 3.81 3.73 3.73 4.21 3.90 3.86 1.62
Virtual Reality 4.25 3.96 4.06 4.02 3.78 3.60 3.53 3.92 4.12 3.99 3.97 4.26
W alk through 3.46 3.34 3.29 3.27 3.24 3.04 3.00 3.14 3.43 3.40 3.40 4.26
Video 5.66 5.16 5.25 5.25 4.95 4.63 4.56 5.01 5.51 5.30 5.30 1.68
Anim ation 5.43 5.05 5.03 5.28 4.89 4.60 4.50 5.03 5.39 5.32 5.32 4.13
Sim ulation 5.01 4.80 4.70 4.92 4.40 4.16 4.00 4.72 4.89 4.97 4.99 4.13
Steady im ages 5.12 4.61 4.63 4.85 4.79 4.53 4.47 4.59 5.13 4.95 4.91 3.04
Text Docum ents 4.35 3.85 3.79 4.42 4.35 4.08 4.04 3.96 4.49 4.40 4.36 1.50
Daily/W eekly/ Monthly Reports (on paper) 1.52 1.25 1.36 1.32 1.59 1.37 1.52 1.26 1.58 1.26 1.26 1.35
3D Models 1.68 1.51 1.75 1.50 1.90 1.66 1.72 1.54 1.70 1.39 1.39 1.43
CO
NS
TRA
INTS
HO W MUCH DO ES THE TO OL SATISFY THE CUSTOM ER NEEDS? HO W M UCH ARE THE TOO LS AFFECTED BY THE
CO NSTRAINT?TO
OLS
Des
ign
Pro
blem
s co
mm
unic
atio
n
Dai
ly s
ite re
cord
s
RFI
Req
uest
for i
nfo
Cha
nge
orde
r
NEEDS
Det
ail r
epor
ts (c
ontra
ctin
g pe
riod)
Des
ign
Doc
umen
ts
Met
hod
stat
emen
ts
Wha
t if s
cena
rios
Sch
edul
e-w
ork
Pro
gram
me
Res
ourc
e P
lann
ing
Pro
gres
s re
port

74
4.2.6 Discussion of results
In this research quality perspective of visualisation as well as the current
situation in construction sector is examined. The customer needs and requirements
are explored during the interviews organised with the top level managers of
construction companies. The interviewees are asked to set importance weights to
their perceived needs they stated. Likewise the constraints for the application of the
visualisation tools and their importance weights are determined.
Using the QFD approach and the matrices, the voice of customer is
converted into technical specifications, which are applied to visualisation tools in
this research. The final outputs of this approach are the need satisfaction values
obtained for each visualisation tool for each data flow and the constraint value
determined using the same procedures and scale. The final values are shown in
Table 4.13 and the visualisation tools in the highest three or four rank are written in
bold numbers.
According to the calculations, the general tendency of the optimum is the
3D CAD drawings, 3D Graphics, Charts, Virtual Photographs, videos and
animations. This is not surprising since the customers’ importance of need
evaluations came up as high averages the needs such as; easy to develop, better
comprehension, quick comprehension, clarification of methods and design details,
relatively higher than the other tools. Since the visualisation tools, 3D CAD,
graphics, videos, and animations have these advantages, both the weighted

75
averages and the rated satisfaction values have yield a high Need Satisfaction
Values of these particular tools. Therefore the degree of visualisation tools usage
should be in accordance with the rank of need satisfaction values.
Although the qualitative approach yields an optimum level through rating
techniques and matrix evaluation, the visualisation tool highlighted as the optimum
is not necessarily the optimum solution for that data flow since each visualisation
tool has specific characteristics and offers varying solutions to different problems.
But it provides the prioritisation of the technical characteristics, visualisation tools,
to be used in order to achieve the customer needs ranked according to the customer
importance weights. It can not be stated that, for example, since the highest need
satisfaction value for the schedule and work programme data flow is 3D CAD
drawings, starting to use or increasing the use of 3D CAD drawings in this data
flow will solve all the problems and the optimum visualisation level will be
achieved. But it can be said that to achieve the needs defined within the rank
provided by the customer, the visualisation tools to be used should be ranked
according to the need satisfaction values.
Visualisation tools may have totally different characteristics. On the other
hand, some of them may have similar characteristics but they may have unique
features, which may make them the only solution for a particular task. In some
situations a particular tool may be the unique solution for a task. In other situations,
there may be tools with similar functions where we may choose the most suitable.
Despite rating techniques of QFD are applied to convert the qualitative

76
characteristics into quantitative characteristics the subjectivity is still in the
matrices. The subjectivity of the companies is natural, since there is no way that
precise metrics can be applied in an attempt to re-shape the manner which
information is conveyed Oppositely it is defended that the optimum tool selection
must be based on the decisions and evaluations of each company on its own
Furthermore, projects are unique and level of implementation of visualisation tools
must be considered project-specific, for reasons of cost-intensity, type (special
engineering or standard construction works), and so on.
In this thesis a general application of the method is provided. An overview
is presented of what is entailed in QFD as a background to assessing levels for
visualised information in the construction process. In most cases, however, a QFD
approach in this area would rather involve one individual company.
In this method constraints are also examined. And a final weighted
average constraint value, which is calculated reflecting the prioritisation of the
constraint affect of the tools, is determined. On the other hand although the two
values, need satisfaction value and the overall constraint value are calculated via
the same procedure and with the same scales, comparative results from other
evaluation techniques, such as benefit - cost technique or similar are not done. It is
believed in this research that all constraints must be evaluated separately, although
the overall constraint value reflects the affect of each single constraint.
If the satisfaction/constraint proportion is used in this analysis to find the
optimum text documents and daily/weekly/ monthly reports (on paper) would have

77
the greatest ratios. Although they do not satisfy any visualisation need since the
constraints other than the inappropriateness of the keyboard, user interface and
operating system would be very low the ratio will be very high. Therefore in this
research satisfaction values and overall satisfaction values are calculated
separately.

78
CHAPTER 5
CONCLUSION
Visualisation has been recognized as a significant technological theme that
may help in increasing the effectiveness of communication during the construction
process. Continuous advances of IT have made it possible for many construction
issues to be addressed by use of visualisation at steadily lower cost. In this thesis
some of the advantages of visualisation have been presented together with a
qualitative approach to evaluate use of visualisation techniques in Turkish
construction.
It has been attempted to identify types of information that can be
visualised; by considering information content, information quality, and problems
due to information clarification. The field study has taken place using interviews
and survey questionnaires applied with the top level managers of Turkish
construction companies.
There are many ways to help overcome conflicts and resistance in the
construction process, but effective communication is maintained as central to

79
successful project performance. Traditional methods are increasingly incapable of
providing fast and effective communication and in most cases modern networking
and telecommunications has greatly increased the amount but not the quality of
information. In fact, where information technology had long been hailed the
enabler of the ‘paperless office’ , it has instead caused an increase in the amount of
paper.
In most construction projects the client is not an architect or an engineer.
Project stakeholders are not all technically based, meaning that using traditional 2D
drawings and sketches is not always effective or efficient when the overall project
is considered from decision making, communication and customer requirements
perspective.
5.1 Summary of the Survey Results
It is observed that computerized visualisation mainly consists of 2D and
3D drawings, although in project design companies some simulations and
animations are also added to these views. In contracting companies visualisation is
generally used for following the progress at site from main office. No cases were
found where visualisation was implemented during construction stage to
specifically circumvent buildability problems, for collaborative design, information
exchange with site, clarification of technical details or construction methods, etc.
Project decisions are based on visualisation in cases where the purpose of the
visualisation is a presentation for the client; but visualisation does not leave the

80
conceptual design stage.
The question posed was; to what extent should visualisation be used for
information and communication in a construction project. There will be cases
where graphical or visual means are unnecessary. It follows that there is an
optimum level for implementation of visualisation. This optimum point is project-
specific, and furthermore dynamic, as the envelope of visualised information types
is expanding, for example due to technological development. Nonetheless, the
advantages presented in this thesis, compared with the survey result show that use
of information visualisation and its tools is very low in construction. Logic dictates
that, due to the ever-increasing amount of information needed in projects, we are
below such an optimum point.
According to the field observations performed in this study, visualisation
has not been fully embraced as a strategic tool for construction. There has been
increase in extent of use but no change in the role of visualisation. This can be
ascribed to construction not evaluating IT strategically, but rather implementing IT
as tools on a project-basis. It is tempting to compare to the development of CAD.
Unlike CAD however, which became fully implemented in the AEC industry
because it fulfilled an already existing task (manual drawing methods) more cost-
efficiently, visualisation represent a way of displaying information which is not
rooted in construction tradition. The key, however, to appropriate and industry-
changing utilisation of IT is effective strategic thinking, in the case of visualisation
thinking about how to communicate efficiently.

81
5.2 QFD for Setting the Visualisation Levels
“ Time was when a man could order a pair of shoes directly from the
cobbler. By measuring the foot himself and personally handling all aspects of
manufacturing, the cobbler could assure the customer would be satisfied," stated
Dr. Yoji Akao, one of the founders of QFD, in his private lectures.
The origin of QFD technique is based on the aim to achieve converting the
voice of customer into technical characteristics. In this thesis the customer voice is
collected during the interviews conducted with the top level managers of the
companies. The technical characteristics are the visualisation tools. The
interviewees defined the importance weights for the needs for each data flow, and
the relationships between the visualisation tools and the needs are determined.
QFD technique implemented in this thesis takes the needs and their prioritisation as
input, makes assessments using the relations between the needs and the tools, and
gives out a rank of visualisation tools to satisfy the needs according to the
prioritisation levels. In this thesis, the “ optimum level of visualisation” does not
refer to optimum visualisation tools but to the optimum combination of the
visualisation tools to result in the optimum solution. Besides, QFD can not be used
to find the optimum visualisation tool to achieve the desired needs’ satisfaction.
The output will always be the rank of visualisation tools to be improved starting
from the one having the highest need satisfaction value. In Figure 5.1 are shown
these evaluated visualisation tools’ ranks for each data flow.

82
Table 5.1 Rank of visualisation tools for each data flow
83
It is observed that the trends are similar in each data flow. This is not
surprising since the highest importance weights of the customer needs were alike.
In the results the highest need satisfaction values correspond to 3D CAD drawings,
3D graphics, charts, virtual photographs, animations and videos. As a result, to
improve the quality of information used in construction communication these
visualisation tools are the first tools that should be used or improved –if it has
already been used.
It is also observed that the visualisation tools in the first three rank are the
tools that are determined to be used by just a few companies in Turkish
construction industry and within limited extents. The reason for this is the high cost
of these tools. They also require qualified users and training must be provided at
the beginning of the implementation. Generally, the construction companies
hesitate to implement visualisation techniques since they find their investment
quite costly. However, they ignore the chance of lowering projects costs arising due
to less rework of the wrongly built items and improved communication in general
in an inherently inefficient construction process. If they can predict the long term
benefits to be gained through the implementations other than the satisfaction of the
customer needs the visualisation use level of the communication will increase. On
the other hand the appropriateness of the visualisation implementations to the IT
strategy of the company and the appropriateness of the IT strategy to the business
strategy are the important critical success factors that must not be ignored.
Otherwise the implementations will serve solutions only for short term periods but
return of investment will not be possible in the long term.

84
BIBLIOGRAPHY
• Abeid, J., Allouche, E., Arditi, D., Hayman, M. (2003)
PHOTONET-II: a computer-based monitoring system applied to
project management. Automation in Construction, 12, 603-616
• Akbas, R. (1998) 4D Modelling and product model
transformations in experience music project,
http://www.stanford.edu/group/4D/4D-home.html
• Aspin, R., DaDalto, L., Fernando, T., Gobbeti, E., Marache,
Mathieu, Shelbourn, M., Soubra, S. (2001) A Conceptual
Framework for Multi-modal Interactive Virtual Workspaces.
Itcon, 7, 149-162
• Aspin, R., Tawfik, H., Fernando, T. (2002) An Interactive 3D
Visualisation and Analysis for the Development and
Communication of Abstract Conceptual Building Design. In:
Proceedings of the Third International Conference on Decision
Making in Urban and Civil Engineering, Khosrowshahi, F. (Ed.),
6-8 November 2002, London, 880-886

85
• Beier, K. B. (2000) Web-based Virtual Reality in Design and
Manufacturing Applications. In: Proceedings of COMPIT’ 2000.
March 29-April 4 2000, Potsdam, Germany
• Bennet, J. (1985) Construction Project Management. London,
Butterworths
• Betts, M, Smith, D. (1999) Strategic management of IT in
construction. USA, Blackwell
• Chinowsky, P. S., Meredith, J. E. (2000) Strategic Management
in Construction. Journal of Construction Engineering and
Management, 126 (1), 1-9
• Christiansson, P., Dawood, N., Svidt, K. (2002) Virtual
Buildings (VB) and Tools to Manage Construction Process
Operations. In: Proceedings of the CIB W78, 12-14 June 2002,
Aarhus School Of Architecture
• Cohen, L, (1995) Quality Function Deployment: How to Make
QFD Work for you. USA, Addison-Wesley

86
• Cory, C., (2002) Visualisation over the Internet. In: Proceedings
of the Third International Conference on Decision Making in
Urban and Civil Engineering Khosrowshahi, F. (Ed.), 6-8
November 2002, London, 887-891
• Dasgupta, S., (1997) The role of culture in info technology
diffusion in organizations. In: Proceedings of the Portland
International Conference on Management of Engineering and
Technology, 27-31 July 1997, Portland, 353-356
• Dawood, N., Sriprasert, E., Mallasi Z. (2002) Development,
interim report for the VIRCON project. In: Visualisation 2002,
January 2002, University of Teesside
• Dawood, N., Sriprasert, E., Mallasi Z., Hobbs B. (2002) 4D
Visualisation Development: Real Life Case Studies. In:
Proceedings of the CIB W78, 12-14 June 2002, Aarhus School
Of Architecture
87
• Egan, J. et al (1998), Rethinking Construction, The report of the
Construction Task Force to the Deputy Prime Minister, John
Prescott, on the scope for improving the quality and efficiency of
UK construction, Department of Environment, Transport and the
Regions, HMSO, London.
• Erdogan, B., Nielsen, Y., (2002) The Extent Of Visualisation As
A Communication And Decision Aid - Tool In Turkish
Construction. In: Proceedings of the Third International
Conference on Decision Making in Urban and Civil Engineering
Khosrowshahi, F. (Ed.), 6-8 November 2002, London 989-994
• Fischer, M. A., Waugh, L. M., Axworthy, A. (1998) IT Support
of single project, multi project and industry wide integration.
Computers in Industry, 35, 31-45
• Ganah, A., Anumba, C. J. and Bouchlaghem, N. M (2000) The
use of Visualisation to communicate Design Information to
Construction Sites. In: Proceedings of the 16th Annual
Conference of the Association of Researchers in Construction
Management, Akintoye, A. (Ed.), September 2000, Glasgow
Caledonian University, 833-841

88
• Gallagher, R. S, (1994) Computer Visualisation, Graphic
techniques, Boca Raton, CRC
• Heesom, D., Mahdjoubi L. (2002) A Dynamic 4D Simulation
system for construction space planning. In: Proceedings of the
Third International Conference on Decision Making in Urban
and Civil Engineering, Khosrowshahi, F. (Ed.), 6-8 November
2002, London, 860-866
• Kamat. V.R and Martinez J.C. (2000) 3D visualisation of
simulated construction operations. In: Proceedings of the 2000
Winter Simulation Conference, 2000, 1933-1937
• Kamat. V.R., Martinez J.C. (2001) Visualizing Simulated
Operations in 3D. Journal of Computing in Civil Engineering,
15 (4), 329-337
• Kunz, J., Fischer, M., Liston, K., Singhal, V., Stone, M. (2002)
Virtual Design and Con in the CIFE iRoom. In: Proceedings of
the Third International Conference on Decision Making in
Urban and Civil Engineering Khosrowshahi, F. (Ed.), 6-8
November 2002, London, 873-879

89
• Laing, R., Davies A. M., Hargreaves, A., Scott S. (2002) The
Application of 3D Modelling Techniques in Built Environment
Evaluation. In: Proceedings of the Third International
Conference on Decision Making in Urban and Civil
Engineering, Khosrowshahi, F. (Ed.), 6-8 November 2002,
London, 867-872
• Laptali, E., Bouchlaghem, N., Wild, S. (1997) Planning and
estimating in practice and the use of integrated computer
models. Automation in Construction, 7, 71-76
• Liston, K, Fischer, M., Winograd, T. (2001) Focused Sharing of
Information for Multi-disciplinary Decision Making By Project
Teams. Itcon, 6, 69-79
• Luiten, G. T. B., Tolamn, F. P. (1997) Automating
Communication in Civil Engineering. Journal of Construction
Engineering and Management, 123 (2), 113-120
• Mak, S. (2001) A model of information management for
construction using information technology. Automation in
Construction, 10, 257-263
90
• Marir, F., Aquad, G., Cooper, G. (1998) OSCONCAD: A Model
Based CAD System Integrated With Computer Applications.
Itcon, 3, 25-43
• McKinney, K., Fischer, M. (1998) Generating, evaluating and
visualizing construction schedules with CAD tools. Automation
in Construction, 7, 433-447
• Mitropoulos, P., Tatum, C. B. (2000) Forces Driving Adoption
of New Information Technologies. Journal of Construction
Engineering and Management, 126 (5), 340-348
• Mohamed, S., Stewart, R. A. (2003) An empirical investigation
of users’ perceptions of web-based communication on a
construction project. Automation in Construction, 12, 43-53
• Nielsen, Y., Erdogan, B. (2003) Expanding The Envelope Of
Visualisation For Communication In Construction. In:
Proceedings of the 19th Annual Conference of the Association of
Researchers in Construction Management, Greenwood, D. (Ed.),
September 2003, University of Brighton, 685-694

91
• Nielsen, Y., Sayar, T. (2001) Web-based Information Flow
Modelling in Construction. In: Proceedings of the 17th Annual
Conference of the Association of Researchers in Construction
Management, Akintoye, A. (Ed.), September 2001, University of
Salford
• Redman, T. C, (1996) Data Quality for the Information Age.
USA: Artech House. Pages 247
• Retik, A., Shapira, A. (1999) VR-based planning of construction
site activities. Automation in Construction, 8, 671-680
• Robinson, A. (1995) The Story of Writing. London: Thames &
Hudson.
• Saad, I. M. H., Hancher, D. E. (1998) Multimedia for
Construction Project Management: Project Navigator. Journal of
Construction Engineering and Management, 124 (1), 82-89
• Sayar, T. (2000) “ Web-based Information Sharing and
Document Control in Construction Companies” , Master of
Science Thesis, Middle East Technical University.

92
• Soetanto, R., Dainty, A. R. J., Price, A. D.F., Glass, J. (2003)
Utilizing Socio-technical Systems Design Principles to
Implement New ICT Systems. In: Proceedings of the 19th
Annual Conference of the Association of Researchers in
Construction Management, Greenwood, D. (Ed.), September
2003, University of Brighton, 695-704
• Stewart, R. A., Mohamed, S., Daet, R. (2002) Strategic
implementation of IT/IS projects in construction: a case study.
Automation in Construction, 11, 681-694
• Thamhain, H. J. (1992) Criteria for controlling projects
according to plan. Project Management Journal, XVII(2), 75-81
• Thomas, S. R., Tucker, R. L., Kelly, W. R. (1997) Critical
Communications Variables. Journal of Construction
Engineering and Management, 124 (1), 58-66
• Thorpe, T., Mead, S. (2001) Project Specific Web Sites: Friend
or Foe? Journal of Construction Engineering and Management,
127 (5), 406-413
• Waly, A. F., Thabet, W. Y. (2002) A Virtual Construction
Environment for preconstruction planning. Automation in
Construction, 12, 139-154

93
• Ward, J., Griffiths, P. (1996) Strategic Planning for Information
Systems. Wiley. Chichester
• Whyte, J., Bouchlaghem, N., Thorpe, A., McCaffer, R. (2000)
From CAD to virtual reality: modelling approaches, data
exchange and interactive 3D building design tools. Automation
in Construction, 10, 43-55
• Woo, S., Lee, E. and Sasada, T. (2001) The multi-user
workspace as the medium for communication in collaborative
design. Automation in Construction, 10, 303-308
• Zaneldin, E., Hegazy, T., Grierson, D. (2001) Improving Design
Coordination For Building Projects. II: A Collaborative System.
Journal of Construction Engineering and Management, 127 (4),
• Zhang, H., Shi, J. J., Tam, C. M. (2002) Iconic Animation for
Activity-based Construction Simulation. Journal of Computing
in Civil Engineering, 16 (3), 157-164

94
APPENDIX A
INTERVIEW QUESTIONS
Corporate Strategy & IT Strategy
1. Does the firm have any determined strategy?
a) no b) partially determined c) yes
2. If yes who has determined this strategy?
a) owners and/or shareholders of the firm
b) top level management
c) top and middle level management
d) employees of the firm
3. Which of the following techniques for analysis has been used in determining
the general strategy of the firm?
a) SWOT
Strength and weakness opportunities and threat

95
b) Risk Analysis and Management
c) Benchmarking
d) Growth share matrix
e) Industry Attractiveness-Business strength matrix
f) Experience Curve
g) Scenario Analysis
h) Other :___________________________________
i) No technique for analysis has been used
4. If you have marked the option i in question 3; how and according to which
determinants has your firm’ s strategy been determined?
_______________________________________________________________
_______________________________________________________________
_______________________________________________________________
5. Does your firm have a vision?
a) yes b) no
6. In which way the vision of the firm is described and how is it transferred to
your employees?
_______________________________________________________________
_______________________________________________________________
_______________________________________________________________

96
7. If you have a vision, are all employees acting in accordance with this vision?
a) yes b) no
8. If you answered the above question as ‘yes’ , how do you control whether they
act in accordance with it or not?
_______________________________________________________________
_______________________________________________________________
_______________________________________________________________
_______________________________________________________________
9. If your answer is ‘no’ what can be the reason? (you can choose more than one
option)
a) The vision is only been known by the general manager and /or the top
level management.
b) The vision of company has not been worded.
c) The vision has been prepared for the purpose of acquiring a quality
certificate.
d) The vision has been described appropriately but it has not been
understood by the employees
e) The vision has been described appropriately but it has not been adopted
by the employees.
f) Other: ________________________________________
10. Is there any determined IT strategy of the firm?
a) no b) partially determined c) yes

97
11. If yes, who has described it? (You can mark more than one option)
a) Owners and/or shareholders of the firm
b) Top level management
c) Top and middle level management
d) Employees of the firm
e) IT department
f) Other: ___________________________________
12. How often the following statements are observed in your firm?
neve
r
som
etim
es
alw
ays
a) IT applications are determined in accordance with the
studies that the IT department has conducted.
b) Studies in the field of IT start on directions coming from
high-level management of the company.
c) Studies in the field of IT start on the demand of employees
d) Studies in the field of IT start due to the external forces like
rivalry, developments in the sector and/or IT.
d) IT strategies are developed parallel to the corporate strategy
of the firm.
e) IT investments are developed and implemented within the
framework of determined IT strategy of the firm.
f) The purchase of even a small IT equipment is evaluated
with respect to the IT strategy of the company.
g) IT expenditures are concentrated mainly on the purchase of
computers.
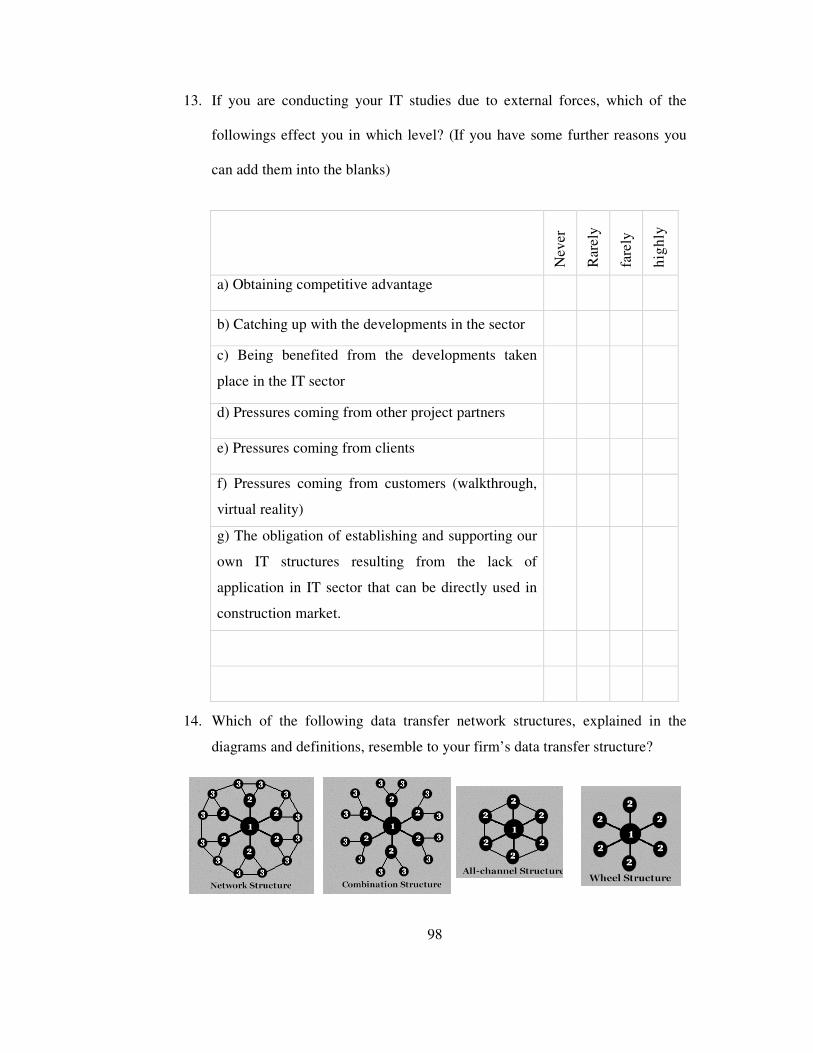
98
13. If you are conducting your IT studies due to external forces, which of the
followings effect you in which level? (If you have some further reasons you
can add them into the blanks)
Nev
er
Rar
ely
fare
ly
high
ly
a) Obtaining competitive advantage
b) Catching up with the developments in the sector
c) Being benefited from the developments taken
place in the IT sector
d) Pressures coming from other project partners
e) Pressures coming from clients
f) Pressures coming from customers (walkthrough,
virtual reality)
g) The obligation of establishing and supporting our
own IT structures resulting from the lack of
application in IT sector that can be directly used in
construction market.
14. Which of the following data transfer network structures, explained in the
diagrams and definitions, resemble to your firm’ s data transfer structure?

99
a) Network structure: Communication takes place between the ones who
directly need knowledge and the ones who have the knowledge
b) Combination structure: Sub-group leaders are communicating with
principal group leaders. Sub-group members are in communication with the
other members of their group.
c) All-channel structure: Partially independent group members are
communicating with other members of their group and leader of the group.
Besides they create products individually and/or as a group.
d) Wheel structure: Partially independent group members are only
communicating with the group leaders and they produce individual
products.
e) Indefinite hierarchical structure: Group members take certain roles in
their group and there are no limitations in their communication channels.
e) Other: _______________________________________________
15. Which of the followings are valid for the IT applications of your firm?
Yes No
a) There is a specific IT department, whose responsibilities and
authority is clearly defined, in the firm.
b) There is a group of employees supplying technical IT
support.
c) IT applications are conducted only by the IT department.
d) High level managers are also responsible for IT studies
together with the IT department.

100
16. How is the necessary technical support for IT applications of firm supplied?
a) By the technical support group functioning bounded to the IT department
in the firm.
b) By a contractually agreed technical support firm.
c) By temporarily agreed technical support firm upon a specific need.
d) By a group functioning bounded to IT department of the firm and when it
is inefficient, by a contractually agreed technical support firm.
e) By a group functioning bounded to IT department of the firm and when it
is inefficient, by temporarily agreed technical support firm.
f) Other _____________________________________________________
Data Architecture
17. Who and at which level, uses IT applications in the firm?
poor fare advance
a) General manager
b) High level manager
c) Project manager
d) Site manager
e) Engineers
f) Technicians
g) Employees in the site (foreman, craftsman...)
h) Accountants on site

101
18. Please evaluate the validity of the following propositions for the data transfer
and access in your firm.
Yes No
a) All information within the firm is recorded transmitted
electronically.
b) Information is recorded and classified electronically.
c) Both electronic copies and hard copies are kept.
d) All electronic data is also recorded and kept as in hardcopies.
e) Drawings are mostly kept as drafts. And their transmittals are
realized as drafts.
f) In the data transfers, time difference (difference between the
sender and the receiver) is usually observed.
g) Sometimes, because of using hardcopies, loss of data occurs
h) Data loss also occurs in electronic communication.
i) Data loss in electronic communication can be remedied.
j) Electronic communication is preferred due to the increased
amount of time saving relative to other methods.
k) Electronic communication is used if there are external forces
making electronic communication an obligation.
l) It is observed that employees hesitate to use electronic
communication.
m) Especially, senior engineers, who are highly experienced but
also are far from the technological developments, are not able to
benefit from electronic communication.
n) Studies are conducted to remove the hesitations of the
employees towards the electronic communication.

102
19. Are definitions of permissions available for each user and group in the access
of electronically kept data?
a) yes b) no
20. If you have answered YES to the question 19, which criteria determine these
limitations? (You can mark more than one option)
a) Department based (permission to view for only the data related with their
department)
b) Project based (permission to view the data related with the project in
which they work)
c) User based.
d) Based on organisational hierarchy
e) Based on division of labours determined for multi-projects
21. Which data are kept electronically in the site? (You can mark several options)
a) Environmental conditions of the site (weather, place etc.)
b) Workforce parameters (number of the workers, qualification levels etc.)
c) Daily reports and head/equipment counts etc...
d) Site meeting minutes.
e) Revisions taken place in planning and programming.
f) Financial data.
e) The data concerning planning and scheduling.
f) Difficulties faced with in the phase of construction.

103
22. Has the web site of the firm designed considering the possible intranet and
extranet applications?
a) yes b) no
23. Does the firm’ s web site take place in the data transfer and decision making
mechanisms?
a) yes b) no
24. Among which locations, your information systems and IT structure elements
are satisfactory?
a) Only in head office.
b) In head office and the site offices in other cities without access problem.
c) In head office and the site offices in other countries without access
problem.
d) Between head office and the site offices whether there are access
problems or not (even valid for the remote areas)
e) Other _____________________________________________________
Common Problems
25. In which degree, your data transfer methods are organised?
(standardized data transfer methods, printed forms for these methods…etc.)
a) None b) Very low c) Low d) Medium e) High f) Very high

104
26. Are there any defined standard rules for the data transmission?
a) None b) Very low c) Low d) Medium e) High f) Very high
27. How often do you face inconsistency and vagueness problems due to various
forms of information transfer made by different people?
a) Never b) Rarely c) Sometimes d) Frequently e) Very frequently
28. From the human originated factors given below please state the amount of
problems arise during the site record keeping and transfer processes.
a. Insufficient time for record keeping
a) None b) Very low c) Low d) Medium e) High f) Very high
b. Insufficient number of site personnel
a) None b) Very low c) Low d) Medium e) High f) Very high
c. Varying levels of experience among the site personnel
a) None b) Very low c) Low d) Medium e) High f) Very high
d. Insufficient level of knowledge
a) None b) Very low c) Low d) Medium e) High f) Very high

105
29. How often do you face problems similar to the ones given below in your site.
a. Uneasy reach to the required data
a) Never b) Rarely c) Sometimes d) Frequently e) Very frequently
b. Readability
a) Never b) Rarely c) Sometimes d) Frequently e) Very frequently
c. Missing data
a) Never b) Rarely c) Sometimes d) Frequently e) Very frequently
d. Discrepancy
a) Never b) Rarely c) Sometimes d) Frequently e) Very frequently
30. How often do you face problems during the construction due to undefinite,
ambiguous project information?
a) Never b) Rarely c) Sometimes d) Frequently e) Very frequently
31. How often do you use simulation technologies?
a) Never b) Rarely c) Sometimes d) Frequently e) Very frequently
106
Database
32. Do you have multi user common databases?
a) yes b) no
33. If your answer is yes to the previous question, please evaluate the proposals
given below for your company.
Yes No
a) Common databases should be electronic.
b) Strategic data should be kept in electronic environment.
c) Decision making tools connected to databases should exist
d) Data base is web based.
e) Easy access to the database from all offices and sites.
f) Only main office may access the database.
g) Database contains only numerical data.
h) Database also contains visual information.
34. What are the decision criteria in the selection of visualisation and information
methodologies and tools?
a) Ease of use
b) Client requirement
c) Cost ratio
d) Market availability
107
e) Widespread utilization in the sector
f) Competitive advantage
g) Others_______________________________________________
35. If you had a web based system with visualisation features, where would you
use it efficiently?
a) Feasibility study
b) Planning
c) Design
d) Pre-construction stage
e) Construction stage
f) At the end of the job, at the delivery stage
g) Operation stage
h) Others: ______________________________________________
Mobility
36. Do you use mobile technologies?
a) yes b) no
37. If your answer is yes to the question 36, in which areas do you use?
_______________________________________________________________
_______________________________________________________________

108
38. Which type of mobile devices and technologies do you use?
a) Cellular phones
b) Handheld computer
c) PDA (personal digital assistant)
d) Bluetooth
e) GPRS
f) WLAN
g) Others _____________________________________________________
Visualisation Approach
39. Some factors effective during the visualisation use are given below. Please add
the factors that you find important but missing to the empty rows at the end of
the table below.
Evaluate the degree of effectiveness of the factors below during a visualisation
application using a 5-point scale. (0-not important) (5-very important)
Possible difficulties encountered Degree of importance
a) Training and seminars
b) Education level
c) Legal constraints due to electronic environment
d) Level of responsibilities and authorization

109
e) Software availability
f) High costing
g) Uneasy use
h) Risks
i) Language (user interface, running system,
keyboard)
j) Other: ____________________________
k) Other: ____________________________

110
40. In the matrix given below left column indicates the information flow types during the construction stage. Please add the
missing flow types in the empty boxes. Please indicate the tools currently used in your company with an X.
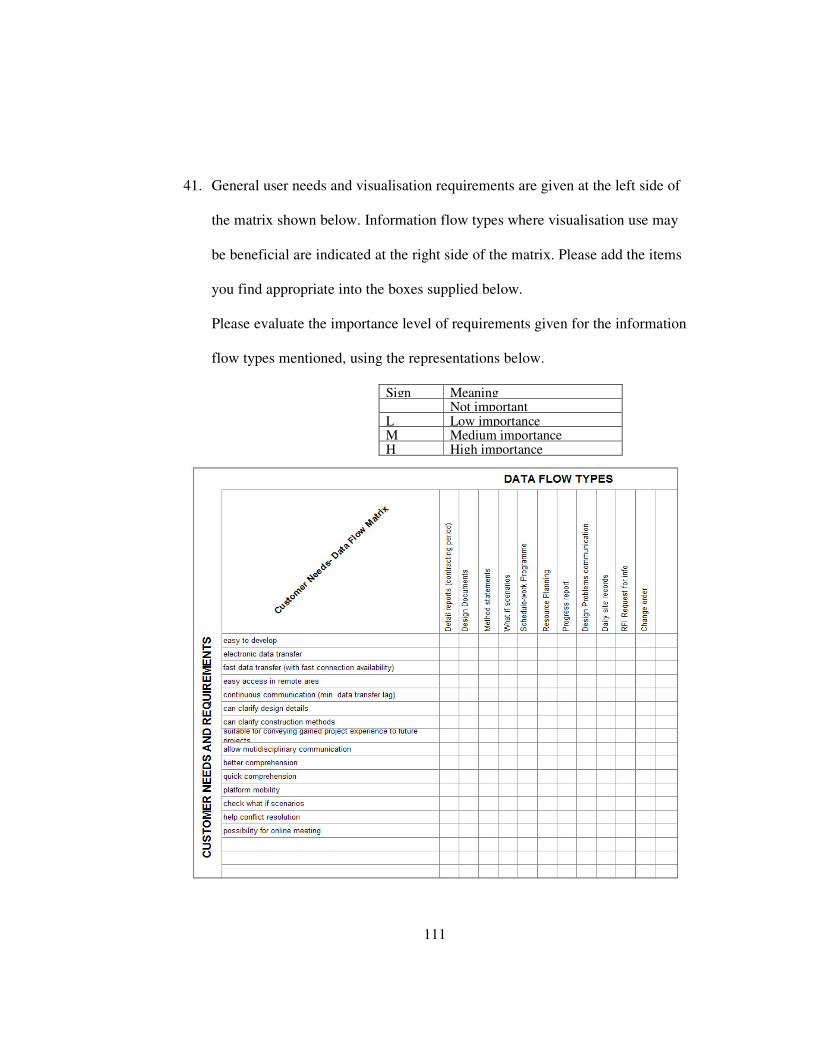
111
41. General user needs and visualisation requirements are given at the left side of
the matrix shown below. Information flow types where visualisation use may
be beneficial are indicated at the right side of the matrix. Please add the items
you find appropriate into the boxes supplied below.
Please evaluate the importance level of requirements given for the information
flow types mentioned, using the representations below.
Sign Meaning Not important L Low importance M Medium importance H High importance


