Download - The GAP Process - Solar Value Project
The GAP Process:A Streamlined Economic Analysis
for Procurement and Pricing of Community Solar
Summary Report • August 2017Community Solar Value Project
Joe Bourg, Millennium EnergyJill Cliburn, Cliburn and Associates
John Powers, Extensible Energy
CommunitySolarValueProject.com

Introduction
Utility-led community solar programs often struggle with the economics of
community-scale solar and the need for pricing that is both cost-based and
competitive. While policymakers work to address fundamental changes to
utility rate-design policies, program designers still need an internal process
to help advance solar projects and programs today.
CSVP has worked with its advisory Forum to address this need. Its GAP
process objectives include
1.Basing the analysis on a program narrative, which concisely describes all
the benefits of the procurement and the program;
2.Utilizing the analytic processes as a tool for decision-making, and not as
an end in itself;
3.Encouraging the introduction of customized solar design elements that
add strategic net value;
4.Including a rigorous solar- benefits analysis, narrowly focused on
achieving the GAP pricing goal;
5.Adapting familiar rate-design strategies for pricing the offer.

What is the GAP?
The GAP analysis is named for need to
fill the gap between the baseline
“sticker price” on a solar procurement
and the net value that the utility can
accept, in order to achieve competitive
pricing on the program offer.
The GAP analysis is a process to “Get
A Price” that reflects strategic DER
value, but conforms closely enough to
utility norms that it can be achieved and
accepted by decision-makers in a
relatively short time.

Methodology for the Study
The GAP analytic process evolved through a series of modeling exercises,
supplemented by reviews from CSVP Utility Forum participants, led by
Sacramento Municipal Utility District (SMUD) and the Platte River Power
Authority. Models completed for these utilities were transformed into
generic scenarios that preserved some situational characteristics, while
replacing others to increase model replicability. The GAP process continues
to evolve, thanks in part to additional peer reviewers:
•Technical Assistance supported by Solar Market Pathways program, with
Bryan Palmintier, senior engineer at NREL (2015 and 2017)
•Presentation and discussion at the National Solar Conference 2016
•Presentation and discussion at Solar Market Pathways Leadership
Workshop, including advisors from the Regulatory Assistance Project
•Feedback from presentations at various utilities, workshops and a CSVP
webinar in July 2017

Key Findings from the GAP Process Study
1) Community-scale PV in distributed applications can compete on
price and value with utility-scale and customer-sited PV systems
2) A streamlined analysis approach can provide accurate
information to guide the design of community solar (CS) projects
and programs. This approach maintains a focus on decision
criteria. It avoids falling prey to “analysis paralysis,” and it
minimizes risks of prolonged internal debate
3) The GAP process can help utilities develop cost-based pricing
for their CS program
4) A fleet approach1 to growing the CS portfolio can provide
additional benefits by bundling projects within a longer term
procurement and by achieving the technical benefits of
geographically dispersed PV projects
5) The GAP analysis identifies distributed PV benefits that can be
monetized by the utility, and the these cost savings can be
reflected in an adjusted PPA Price or reflected in other,
acceptable rate-making strategies.

• One metric often used in evaluating resource acquisition
decisions is the Levelized Cost of Energy (LCOE)
• LCOE is defined as the net present value (NPV) of project
costs divided by the NPV of kWh output evaluated over
the project life
• Traditionally, since most electricity resources were
procured from central station projects on the transmission
grid, only the NPV of project costs were compared
• When considering DERs, it is important to evaluate the
net LCOE, which also incorporates incremental benefits of
distributed PV on a levelized basis, i.e., the LBOE
• Even without including every possible benefit, the net
LCOE analysis provides a more valid comparison of DPV
resources
Basis for the GAP Analytic Process

CSVP defines the LBOE categories as falling into four areas:
Generation
Transmission
Distribution
Societal
The equations for calculating the net LCOE are:
LCOEDPV NET = LCOEDPV GROSS - LBOEDPV
Where,
LBOEDPV= LBOEGENERATION + LBOETRANSMISSION +LBOE DISTRIBUTION + LBOESOCIETAL
Once the LCOEDPV NET is calculated, the utility’s non-bypassable wires
charge may be included, as usual, for bottom-line CS program pricing.
While some alteration of the wires charge may be warranted, most utilities
find that very difficult to achieve. Modifications to support better pricing
may be presented as an Adjusted PPA Price or Gross PPA Price +
credit.
Equations
PPA Price DPV Benefits

DPV Value Streams / Screening and Analysis
To identify appropriate value streams for assessment, the first step is to
collect data specific to the utility designing the CS program. This is
accomplished with a data collection form. Some utility data should be
readily available. Regarding solar value, the process encourages utility
staff to provide ranges of values for DPV benefit categories that may be
difficult to quantify.
For different regional scenarios in this study, the DPV values were
based on available data from participating utilities. Then, ranges were
estimated for data not readily available, utilizing the best data available
for the region or for utilities with similar characteristics. A sample utility
data request is illustrated below, and on the following slides:

DPV Value Streams / Screening and Analysis

Sample Data Request Checklist (cont.)
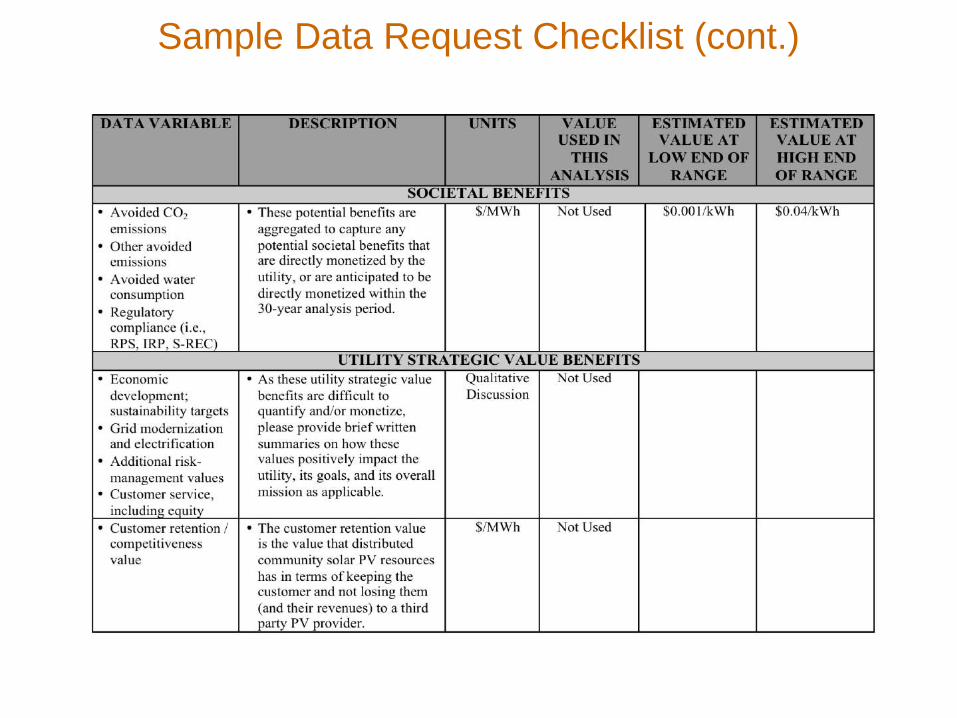
Sample Data Request Checklist (cont.)
How Does the GAP Analysis Differ from VOS?
The GAP Analysis focuses on high-value DPV benefits that are both
appropriate to the particular utility/situation, and sufficient to meet
target costs. In discussion with utility staff, the analyst prioritizes
benefits, in order to test those that are most likely to yield significant
value and to be acceptable to utility decision-makers. Where data is
unclear or values are contentious, the GAP analysis may use a
conservative value that stakeholders can agree upon without delay.
By contrast, a VOS analysis aims to count all applicable solar
benefits and to work through regulatory channels to set the full net
value of DPV.
By focusing on the minimum DPV benefits required to meet the cost
and pricing target, fewer values become contentious, and the work
environment can be more collaborative. This is not a critique of VOS,
except that the more streamlined GAP approach is well-suited to
internal program-design and decision-making, whereas VOS is
primarily a policy instrument.

Universe of Categories forGAP Benefit Analysis
• Avoided costs of conventional
wholesale power**
• Avoided/deferred conventional
generation capacity investment**
• Fuel price hedging**
• Avoided transmission losses
• Avoided transmission ancillary services
• Reduced distribution line losses
• Distribution ancillary services
• Improved distribution capacity
utilization; may avoid/defer upgrades
• Solar geographic diversity benefits,
risk management
• Potential resilience benefits
• Solar siting, design & operational
flexibility to capture strategic benefits
• Reduce GHG and other emissions**
• Reduce water use**
• Conserve ag land, sensitive land
• Meet local sustainability goals
• Other compliance values**
• Potential DR companion
measures
• Potential customer-side storage
• Potential added project-design
values, e.g., shading
** Also available to centralized PV projects

Benefits Selected for Each Scenario Vary
DPV Benefit Central California
Desert Southwest
Rocky Mountain
Avoided Transmission Costs ✔ ✔ ✔
Strategic DPV Design ✔ ✔ ✔
Customer Retention Value ✔
Avoided Transmission Losses ✔ ✔
Avoided Distribution Losses ✔
Grid Resilience and Reliability ✔
Coincident Demand Reduction ✔
Distribution Upgrade Deferral ✔
For each scenario, additional benefits could be included, but those indicated
provide the LBOE values that would be most readily quantified and accepted
by utility staff.

High-Value Design Solutions
For this study, the CSVP analyst also applied innovation to maximize
the benefits available. CSVP has additional resources available on
high-value DPV. Depending on the situation, these may include:
• Strategic Site Characteristics• Fleet Siting to Take Advantage of Geographic Diversity of Multiple Projects• Single-Axis Tracking Mount• Optimized Orientation and Tilt Angle of Fixed-Tilt Mount or Carport • Matching Cell Types to Geographic / Site Conditions• Use of Smart Inverters• Use of Storage or DR Companion Measures• Supplemental Technology Strategies (EV Charging)• Financing and Business Model Strategies• Programmatic Strategies

A Simplified Analysis Approach with Robust Modeling Behind It
The GAP analysis is a streamlined approach to DPV valuation, but it is also a robust
model. The image below shows the detail and complexity behind the simplified
formulas used to calculate net value. There are four categories of analysis: Impacts,
Costs, Benefits, and Metrics. The first step in the analysis process is to document
the assumptions, based on the utility data request results, and then to input them
into this modeling tool. A sample Assumption Table from the evaluation tool is
presented below:
PROJECTDESCRIPTION1(a):MWACCommunitySolarSolarPhotovoltaicPlant/SingleAxisTracking/WholesalePPA
ASSUMPTIONS Source
DiscountRate 4.5 % Assumption
PVSystemSize 1 MW Assumption
Turn-keyPlantCapitalCost 1,750,000 $/MW Estimatedbasedoncurrentindustrycosts
PowerPurchaseAgreementPrice 65.00 $/MWh Estimatedbasedoncurrentindustrycosts
AnnualDegradation 0.50 % NRELSystemAdvisorModeldefault
AnnualEnergyYield 1,719 MWh/MW NRELSystemAdvisorModel
AnnualCapacityReductionCredit 3.07 MWofCapacityCredit/MWInstalledCalculatedfromSAMoutput
AvoidedTransmissionLineLossFactor 1.82 % UtilityDataRequest
TransmissionAccessCharge 10.00 $/MWh ConservativeEstimateReducedFromEIAValue
BlendedCostofAvoidedWholesaleEnergyPurchases 35.00 $/MWh UtilityDataRequest
ValueofCapacityCredit 3,960 $/MW PerPURPATariff
ProgramStart-upCosts(Year1) 20,000 $/MW Estimatedbasedonliteraturereview
AnnualProgramAdministrationCosts 2,500 $/MW Estimatedbasedonliteraturereview
CustomerSubscriberRetailRate(notincludingcustomersurcharge) 65.50 $/MWh WholesalePPARate+SolarPremium
DeferrelValue(50%ofFleetcapturesvalue) 37,500 $/MW Basedon$1Mdeferralat7.5%interest
ResidentialCustomerRetailRate(EnergyCostOnly) 55.44 $/MWh UtilityDataRequest
ResidentialCustomerRetailEnergyEscalationRate 2.50 % UtilityDataRequest
ResidentialCustomerRetailRateForwardSchedule $55.44 $56.83 $58.25 $59.70 $61.20 $62.73 $64.29 $65.90 $67.55 $69.24
ForwardTranmissionAccessChargeSchedule 0.99 1.03 1.07 1.11 1.17 1.24 1.29 1.33 1.35 1.38
ForwardTAC($/MWh) 9.85 10.34 10.68 11.08 11.74 12.37 12.91 13.28 13.50 13.78
*- Note that the above data and assumptions are for illustrative purposes only

Evaluation of Community Solar Impacts
The first step in the quantification of net benefits of a CS program is to calculate
the impacts of the community solar fleet. This is determined by using solar
production modeling software (such as SAM or PVsyst) to calculate the hourly
and annual generation output for each year of the analysis period. Most of the
impacts associated with DPV benefits are derived from the hourly and annual
data sets generated by the solar modeling, including for example, the avoided
annual wholesale energy and capacity purchases and avoided line losses
attributable to a fleet of CS projects. A sample of the Impacts section of the
evaluation tool is provided below:
IMPACTS 1 2 3 4 5 6 7 8 9 10
AnnualEnergyProduction(MWh) 1,719 1,710 1,702 1,693 1,685 1,676 1,668 1,660 1,651 1,643
AnnualAggregatedCapacityReductionValue(MW) 3.07 3.05 3.04 3.02 3.01 2.99 2.98 2.96 2.95 2.93
AnnualAvoidedLineLosses(MWh) 31 31 31 31 31 31 30 30 30 30
*- Note that the above data and assumptions are for illustrative purposes only

Evaluation of Community Solar Costs
The second step in the quantification of net value for a CS program is to
calculate the costs associated with implementation of the community solar
program. These include the costs of the solar energy or PV projects (i.e., the
power purchase agreement cost, or the capital and annual O&M costs), the
costs to implement and manage the program, and the lost retail revenues
attributable to the portion of the bill that the customer is no longer paying (i.e.,
the commodity cost of energy on their monthly utility bill). These annual values
for each cost category are then summed to indicate the annual costs of the CS
program, which are used in calculating the program metrics later in the analysis.
A sample of a portion of the Costs section of the evaluation tool is provided
below:
COSTS 1 2 3 4 5 6 7 8 9 10
AnnualPPACosts $111,735 $111,176 $110,620 $110,067 $109,517 $108,969 $108,425 $107,882 $107,343 $106,806
LostRetailRevenues $95,301 $97,195 $99,127 $101,097 $103,107 $105,156 $107,246 $109,377 $111,551 $113,768
ProgramAdministrationCosts $20,000 $2,500 $2,553 $2,607 $2,662 $2,719 $2,776 $2,835 $2,895 $2,957
AnnualCosts $227,036 $210,872 $212,301 $213,772 $215,286 $216,844 $218,447 $220,095 $221,790 $223,532
*- Note that the above data and assumptions are for illustrative purposes only

Evaluation of Community Solar Benefits
The third step in the quantification of net value for a CS program is to calculate the
benefits associated with implementation of the community solar program. These
may include a variety of of DPV-related benefits, as identified in the data request
and initial screening assessment. Typical benefits may include avoided wholesale
energy and capacity purchases, avoided transmission access charges, T&D line
losses, and CS program subscriber revenues. Other benefits would be calculated
on a measure specific basis such as for distribution deferral upgrades, deferred
generation capacity additions, provision of grid services, and/or compliance value
for example. These individual benefit values are used in calculating the LBOE of
specific DPV benefits; in addition, summing these values to determine the annual
benefits are used in the determination of overall program metrics later in the
analysis. A sample of a portion of the Benefits section of the evaluation tool is
provided below:
BENEFITS 1 2 3 4 5 6 7 8 9 10
AvoidedWholesaleEnergyPurchases $60,165 $61,361 $62,580 $63,824 $65,093 $66,386 $67,706 $69,051 $70,424 $71,823
CoincidentDemandReductionCredit $12,149 $12,390 $12,637 $12,888 $13,144 $13,405 $13,672 $13,943 $14,221 $14,503
AvoidedTransmissionAccessCharges $16,940 $17,678 $18,174 $18,770 $19,782 $20,740 $21,537 $22,039 $22,298 $22,647
AvoidedLineLossValue $308 $322 $331 $342 $360 $377 $392 $401 $406 $412
DistributionUpgradeDeferralValue $37,500 $37,500 $37,500 $37,500 $37,500 $37,500 $37,500
CustomerSubscriberRevenues $112,595 $112,032 $111,471 $110,914 $110,359 $109,808 $109,259 $108,712 $108,169 $107,628
AnnualBenefits $239,657 $241,283 $242,693 $244,237 $246,238 $248,216 $250,065 $214,148 $215,517 $217,014
*- Note that the above data and assumptions are for illustrative purposes only

Quantification of Program Metrics
The final step in the quantification of overall and net value for a CS program is to calculate
the economic metrics associated with the program as a whole, as well as the individual
LBOEs of the DPV values. The CSVP used a proprietary version of the SAM model (NREL)
for its analysis. Readers may customize that free resource for their own use, or contact the
authors for further support. The CSVP approach quantifies the LBOE of DPV benefits
individually and in aggregate to feed into the overall program value analyses, as well as to
support the pricing analysis as the final step of the program analysis process. Sample
output below:
Note that the above data and assumptions are for illustrative purposes only.
They are based on a one generic case. Customization per utility/project
Is required.
ECONOMICMETRICS
ValueofLifecycleCashFlow $1,798
NPVofLifecycleCashFlow $87,165
AverageAnnualCashFlow $60 /year
YearstoCashFlowPositive 1 year
NPVofCosts $1,540,768
NPVofMWh 23,704 MWh
LevelizedCostofEnergy $65.00 /MWh
InternalRateofReturn 0.36%
Benefit-CostRatio 1.00
NPVofCoincidentDemandReductionCredit $250,543
LBOEofCoincidentDemandReductionCredit $11 /MWh
NPVAvoidedTranmissionAccessCharges $381,239
LBOEofTransmissionAccessCharges $16 /MWh
NPVofTransmissionLineLossValue $6,939
LBOEofTransmissionLineLossValue $0.29 /MWh
NPVofDistributionUpgradeDeferralValue $220,976
LBOEofDistributionUpgradeDeferralValue $9 /MWh
LBOEOFDISTRIBUTIONVALUES $36 /MWh

Quantification of Program Metrics (cont.)
Based on the generic case above, these graphics depict the annual and cumulative
cash flows associated with the CS program and its various DPV cost and benefit
attributes. It is useful to view these two metrics in a graphic format, to see the
variations in cash flows over time. Gaining an understanding of program cash flows
also aids in program design efforts to insure that any required costs in “out years”
are properly budgeted for in the program planning stage. See examples below.
*- Note that the above data and assumptions are for illustrative purposes only
-$15,000
-$10,000
-$5,000
$0
$5,000
$10,000
$15,000
$20,000
$25,000
$30,000
$35,000
1 2 3 4 5 6 7 8 9 101112131415161718192021222324252627282930
Do
llars
Year
AnnualCashFlow
AnnualCashFlowFromCommunitySolarProgramw/WholesalePPA
$0
$50,000
$100,000
$150,000
$200,000
$250,000
1 2 3 4 5 6 7 8 9 101112131415161718192021222324252627282930
Do
llars
Year
Cumula veCashFlow
Cumula veCashFlowfromCommunitySolarProgramw/WholesalePPA

Generic GAP Analysis Calculation
DPV Value Category (LBOE) Value ($/kWh)
DPV Benefit Category #1 $0.010
DPV Benefit Category #2 $0.005
DPV Benefit Category #3 $0.005
TOTAL OF DPV BENEFITS (LBOEGROSS) $0.020
PV PPA Price (LCOEGROSS) $0.075Baseline Cost
Aggregated DPV Benefits
PPA Price Adjustment Calculation Value ($/kWh)
Baseline PPA Price (LCOEGROSS) $0.075
Aggregated DPV Benefits (LBOEGROSS) $0.020
Adjusted PPA Price (LCOENET) $0.055Cost Minus Benefits
Program Price Offering Calculation Value ($/kWh)
Adjusted PPA Price $0.055
Non-Bypassable Wires Charge $0.045
Community Solar Program Price $0.10Indicative Pricing Estimate

• The CSVP team modeled three cases to demonstrate value
and pricing approaches for utility-driven CS fleets in different
regions of the country
• These models illustrate the technical and economic
impacts of various solar fleet configurations, and help
assess DPV values in regions with varying solar resources
and varying DER benefits
• The analyses were also designed to answer specific
questions for CS project and program designs:
• Central California: Central PV Versus Distributed PV
• Desert Southwest: Value of Solar Carports
• Rocky Mountain: Program Pricing
Overview of Regional Cases

For this Case: • A municipal utility in California’s Central Valley
• 20-MW Central PV project + 6 MW of DPV projects
• Tariff-based program
• Seeking balance between NEM based and utility-provided ;
manage pace of the shift to third-party providers of NEM-based
PV systems
• CS program interested in looking at a fleet approach to
pricing, incorporating both CPV and DPV resources
• DPV benefit categories focused for this scenario were:
▪Avoided Transmission Access Charges (due to high costs in California)
▪Strategic PV Design (incorporate tracking and carports to maximize
summer energy production and optimize the offset of higher avoided
costs during the summer months)
▪Customer Retention (calculate the utiltiy/system value of the customer’s
choice to join a community-solar program, instead of rooftop NEM)
The Central California Scenario

The Central
California Scenario:
DPV & Fleet Analyses
DPV Value Category Value (kWh)
LCOE of DPV (PPA Price) $0.075
Avoided Transmission $0.010
Strategic DPV Design $0.006
Customer Retention $0.012
Adjusted PPA Price $0.047
6 MW DPV Alone
26 MW Fleet
(20 MW Central + 6 DPV)
Analysis Results
Price Category Value (kWh)
LCOE of CPV (PPA Price) $0.050
LCOE of DPV w/o Benefits (PPA Price) $0.075
LCOE of 26 MW Fleet w/o DPV Benefits $0.055
LCOE of 26 MW Fleet w/ DPV Benefits $0.049
By combining a centralized green power product with a DPV community
solar product, the utility builds a stronger, diverse and affordable portfolio.

Customer-facing pricing for the
fleet-based community solar program
For this case, it was assumed the program could not move forward for timely
implementation, unless the utility imposed the wires charge.
Yet, the net LCOE + wires charge for the fleet-based offer adds up to a
competitive price. In fact, the solar developer would not offer this net LCOE price.
Thus, the net LCOE shown here would not represent a full pass-through, but
rather, pass-through of an “adjusted PPA” price.
Price Category Value (kWh)
LCOE of CS PV Fleet $0.049
Non-Bypassable Wires Charge $0.050
Community Solar Program Price Offering $0.099

The Desert Southwest Scenario
For This Case:• A utility with a large service area
in the Desert Southwest
• 5-MW CS fleet, entirely of solar carports•Strategically located on the grid to optimize resiliency
and reliability, as well as line loss reductions over 6%
•Demonstrated strategic design benefits of a flat mount
system optimized for summer production
• PPA price of the 5-MW DPV canopy fleet: $0.103/kWh
• Utility-led, tariff-based CS program w/ full wires charges

The Desert Southwest Scenario
DPV benefit categories for this scenario:
• Avoided Transmission Access Charges (reflecting high costs in the region)
• Strategic PV Design (incorporating flat-mount PV carports to maximize summer
energy production and optimize the offset of higher avoided costs during the
summer months; also lowers siting and construction costs)
• Avoided T&D losses (primarily distribution, due to the documented high line loss
values for the periods of PV production in the region)
• Grid Resiliency (due to the critical importance and high value of maintaining grid
reliability and security in the region, especially during summer heat waves)
This case was modeled on published data, without up-front input from the utility, but
with feedback from CSVP Utility Forum members. It illustrates use of current U.S.
EIA data on both transmission values and line losses that occur during summer
days, when the PV is generating. This analysis, unlike standard approaches,
recognized that the analysis should focus on hours of PV generation.

The Desert Southwest Scenario: DPV & Pricing Analyses
DPV Value Category Value (kWh)
LCOE of DPV (PPA Price) $0.103
Avoided Transmission Costs $0.010
Strategic DPV Design $0.005
Avoided T&D Losses $0.005
Grid Resilience & Reliability $0.010
Adjusted PPA Price $0.073
5 MW DPV Analysis Results
CS Program Price Analysis Results
Price Category Value (kWh)
LCOE of CS PV Canopy Fleet $0.073
Non-Bypassable Wires Charge $0.031
Community Solar Program Price Offering $0.104
The scenario also assumes an adjusted-PPA pricing strategy.

The Rocky Mountain Scenario
For This Case:•A public power utility with a JAA power supplier in the Rocky Mountain West
•Very low avoided wholesale power-purchase cost
•A 5-MW CS fleet of fixed-tilt PV systems strategically located to capture distribution upgrade deferral benefits
•Estimated PPA price of the 5-MW DPV fleet: $0.065/kWh
•Utility-led, tariff-based CS program w/ full wires charges
•Analyzed a modified approach to the “adjusted PPA” pricing methodology to recover all program costs and lost revenues
Because of the very low avoided wholesale power-purchase cost, this analysis looked at more benefits. Alternatively, the GAP could be filled with high-value companion measures or a slight premium.

The Rocky Mountain Scenario
The DPV benefit categories focused on for this scenario were:
▪ Avoided Transmission Access Charges (due to the relatively high costs in the
region)
▪ Strategic PV Design (incorporate PV tracking systems to “test” the ability to capture
additional value of higher avoided energy costs in the summer and shoulder periods*)
▪ Avoided Transmission Losses (as the utility owned its own transmission assets)
▪ Coincident Demand Reduction (value based on assuming an anchor CS customer
and including utility incentive for customer-sited generation assets)
▪ Distribution Upgrade Deferral (using GAP methodology for calculating distribution
system deferral value, by discounting the standard estimated value, to address
engineering skepticism of this high-value strategy)
* A striking finding of this case analysis was that single axis tracking (SAT) is at about parity with
fixed-tilt, and though the savings, given current rate structures and costs, were not dramatic, the
flexibility of the SAT design a risk mitigation strategy.

The Rocky Mountain West Scenario: DPV & Pricing Analyses
DPV Value Category Value (kWh)
LCOE of DPV (PPA Price) $0.065
Avoided Transmission Costs $0.016
Strategic DPV Design* $0.000
Avoided Transmission Losses $0.0003
Coincident Demand Reduction $0.011
Distribution Upgrade Deferral $0.009
Adjusted PPA Price $0.029
5 MW DPV Analysis Results
CS Program Price Analysis Results
Price Category Value (kWh)
Baseline “Break-Even” Price for All Program Costs $0.065
Non-Bypassable Wires Charge $0.046
Community Solar Program Price Offering $0.111
*SAT for risk management; see above.

Summary of Findings
• The GAP streamlined methodology and approach for CS Valuation and Program Pricing offers a flexible approach that is easily adapted to different: CS program designs PV system types Utility situations Solar-Plus companion technologies (i.e., storage and demand response) Alternative pricing structures
• Critical to conduct preliminary program planning, to identify key characteristics desired for the program, areas of high value DPV benefits, and to answer important questions for the project
• A GAP approach that is streamlined and conservative, yet rigorous in its analytics, can be an effective tool in garnering management support for a CS program, and for distributed PV in general.
• Contact [email protected] or the authors for an expanded report on each scenario and for more information on GAP process facilitation.

Small Print: Acknowledgements and Disclaimer


