
The Geology and Rock Mass Quality of the
Cenozoic Kalahari Group,
Nchwaning Mine Northern Cape
by
R.A. Puchner
Submitted in fulfillment of the academic requirements for the degree of
Master of Science
in the School of Geological and Computer Sciences, University of Natal, Durban.
December 2002
As the candidate's supervisor I have/have not approved this dissertation/or submission.
Signed: _____ _ Name: -------------- Date: -----

11
ABSTRACT
With the extension of the Nchwaning Mine shaft complex in the Northern Cape
Province, various geological and geotechnical complications needed to be identified in
order to ensure correct use of tunnelling methods and support techniques. An
understanding of the geological history of the area and the resulting geotechnical nature
was important in defining the rock mass quality ahead of shaft development. A total of
12 geotechnical boreholes were drilled, and an additional 18 old boreholes revisited to
accurately detennine the stratigraphy, geological structure and associated weathering
effects. Various soils and rock testing helped quantify the materials encountered.
Sands of the Gordonia Fonnation fonn the surface cover of this area, and together with
the weathered calcrete, calc-arenite, conglomerate and clay, they fonn part of the
Cenozoic Kalahari Group. The 30m thick basal unit of red clay is common throughout
this region. This silty clay material is problematic in that it is expansive and
hygroscopic. The clay unit rests unconfonnably on folded, faulted and highly weathered
shale of the Proterozoic Lucknow and Mapedi Fonnations of the Olifantshoek
Supergroup. Unconfonnably below this sequence lies the manganiferous ore deposits of
the Hotazel Member, which is contained within the Voelwater Fonnation of the
Griqualand West Supergroup.
F or the development of the decline shaft through the Gordonia F onnation a box cut was
excavated to a depth of 25m. The anticipated poor geotechnical conditions for a further
125m below the Gordonia sands called for high quality pennanent tunnel support in the
upper weathered horizons. Barton's Q-analysis was adopted as a recognized tunnelling
quality index to predict and quantify the rock mass characteristics ahead of the shaft.
The highly variable and generally low Q-values from borehole core analysis indicated
that precast tunnel lining be used for 800m (at 11.5°) through the entire weathered
Cenozoic sequence and into the weathered shales immediately below the Red Clay.
111
PREFACE
The work described in this dissertation was carried out through the School of Geological
and Computer Sciences, University of Natal, Durban from March 2001 to December
2002, under the supervision of Professor Mike Watkeys and co-supervision of Professor
Colin Jermy and Professor Rodney Maud.
This dissertation represents original work by the author and has not otherwise been
submitted in any form for any degree or diploma to any other tertiary institution. Where
use has been made of the work of others it is duly acknowledged in the text.
Date: '2" jOlt (zoo ~
IV
CONTENTS Page
1 INTRODUCTION 1
1.1 Background 1
1.2 Objectives 4
1.3 Fieldwork 6
2 PHYSICAL DESCRIPTION AND REGIONAL GEOLOGY 10
2.1 Physical Description 10
2.2 Regional Geology 10
3 DETAILED SITE GEOLOGY 16
3.1 Kalahari Group 16
3.2 Red Clay Layer 28
3.3 Lucknow Shale 37
3.4 Ongeluk Andesite 38
3.5 Structural Geology 38
3.6 Geohydrology 39
3.7 Weathering 44
4 ROCK PROPERTIES AND EXCAVATION 46
4.1 Box Cut Excavation 46
4.2 Shaft Excavation - Rock Strength 50
4.3 Shaft Excavation - Rock Mass Assessment 57
4.4 Q-Value Results and Rock Mass Subdivision 61 4.5 Current Tunnelling Practice 66
5 CONCLUSIONS 70
ACKNOWLEDGEMENTS 72
REFERENCES 73
v
LIST OF FIGURES Page
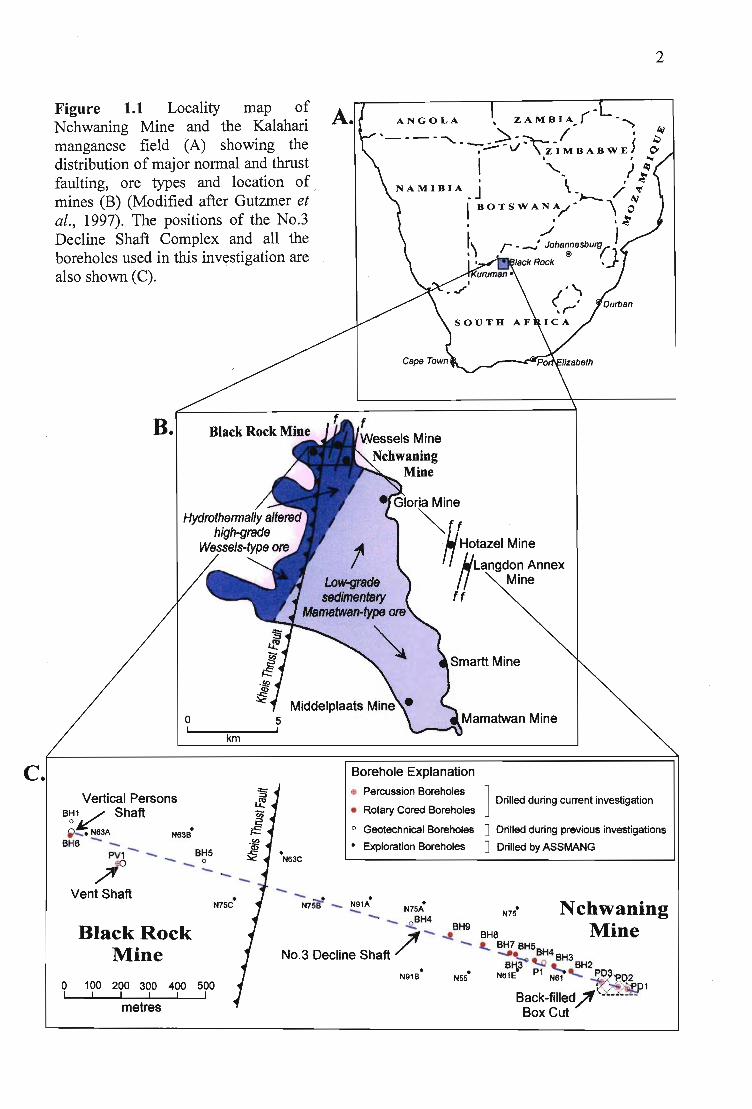
Figure 1.1 Site locality ofNchwaning mine and the Kalahari Manganese Field. 2
Figure 1.2 Site photograph of Black rock and Nchwaning mines. 3
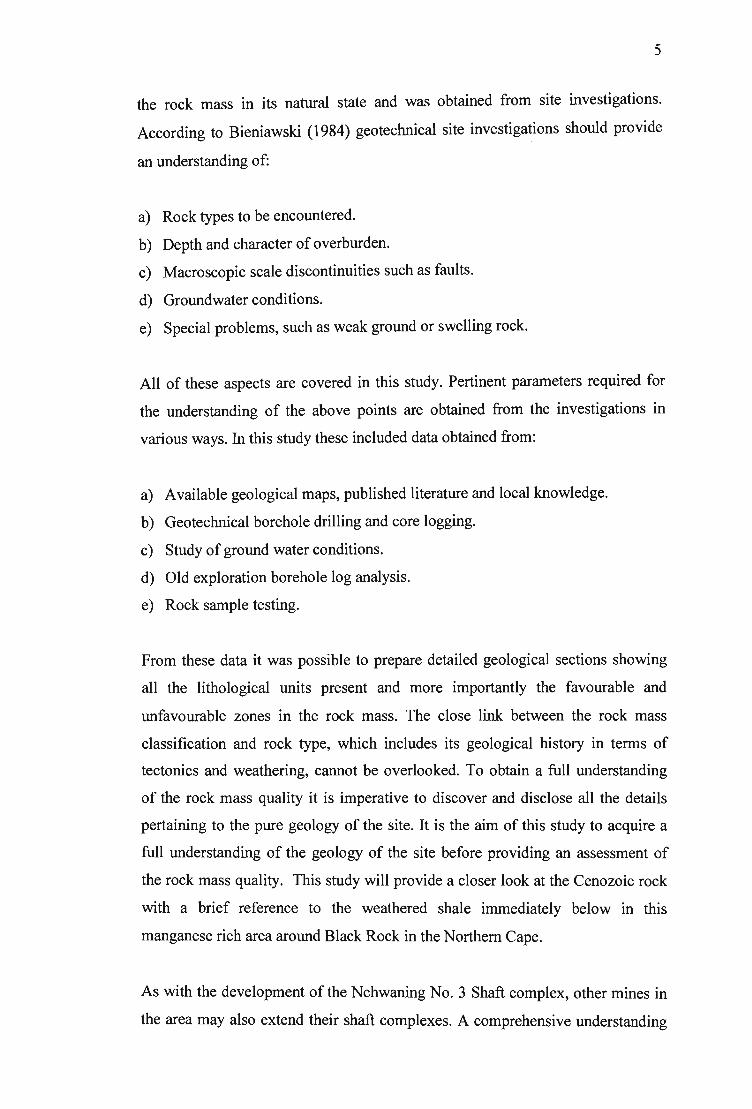
Figure 1.3 Aerial photograph of Nchwaning No.3 Decline Shaft box-cut. 7
Figure 1.4 Photograph of rotary core borehole drilling ahead of the No.3 Decline Shaft development. 7
Figure 2.1 Distribution of and thickness of the Kalahari Group of southern Africa. 11
Figure 2.2 Simplified stratigraphic column at Nchwaning Mine. 11
Figure 3.1 Geological cross section of the entire No.3 Decline Shaft Complex. 17
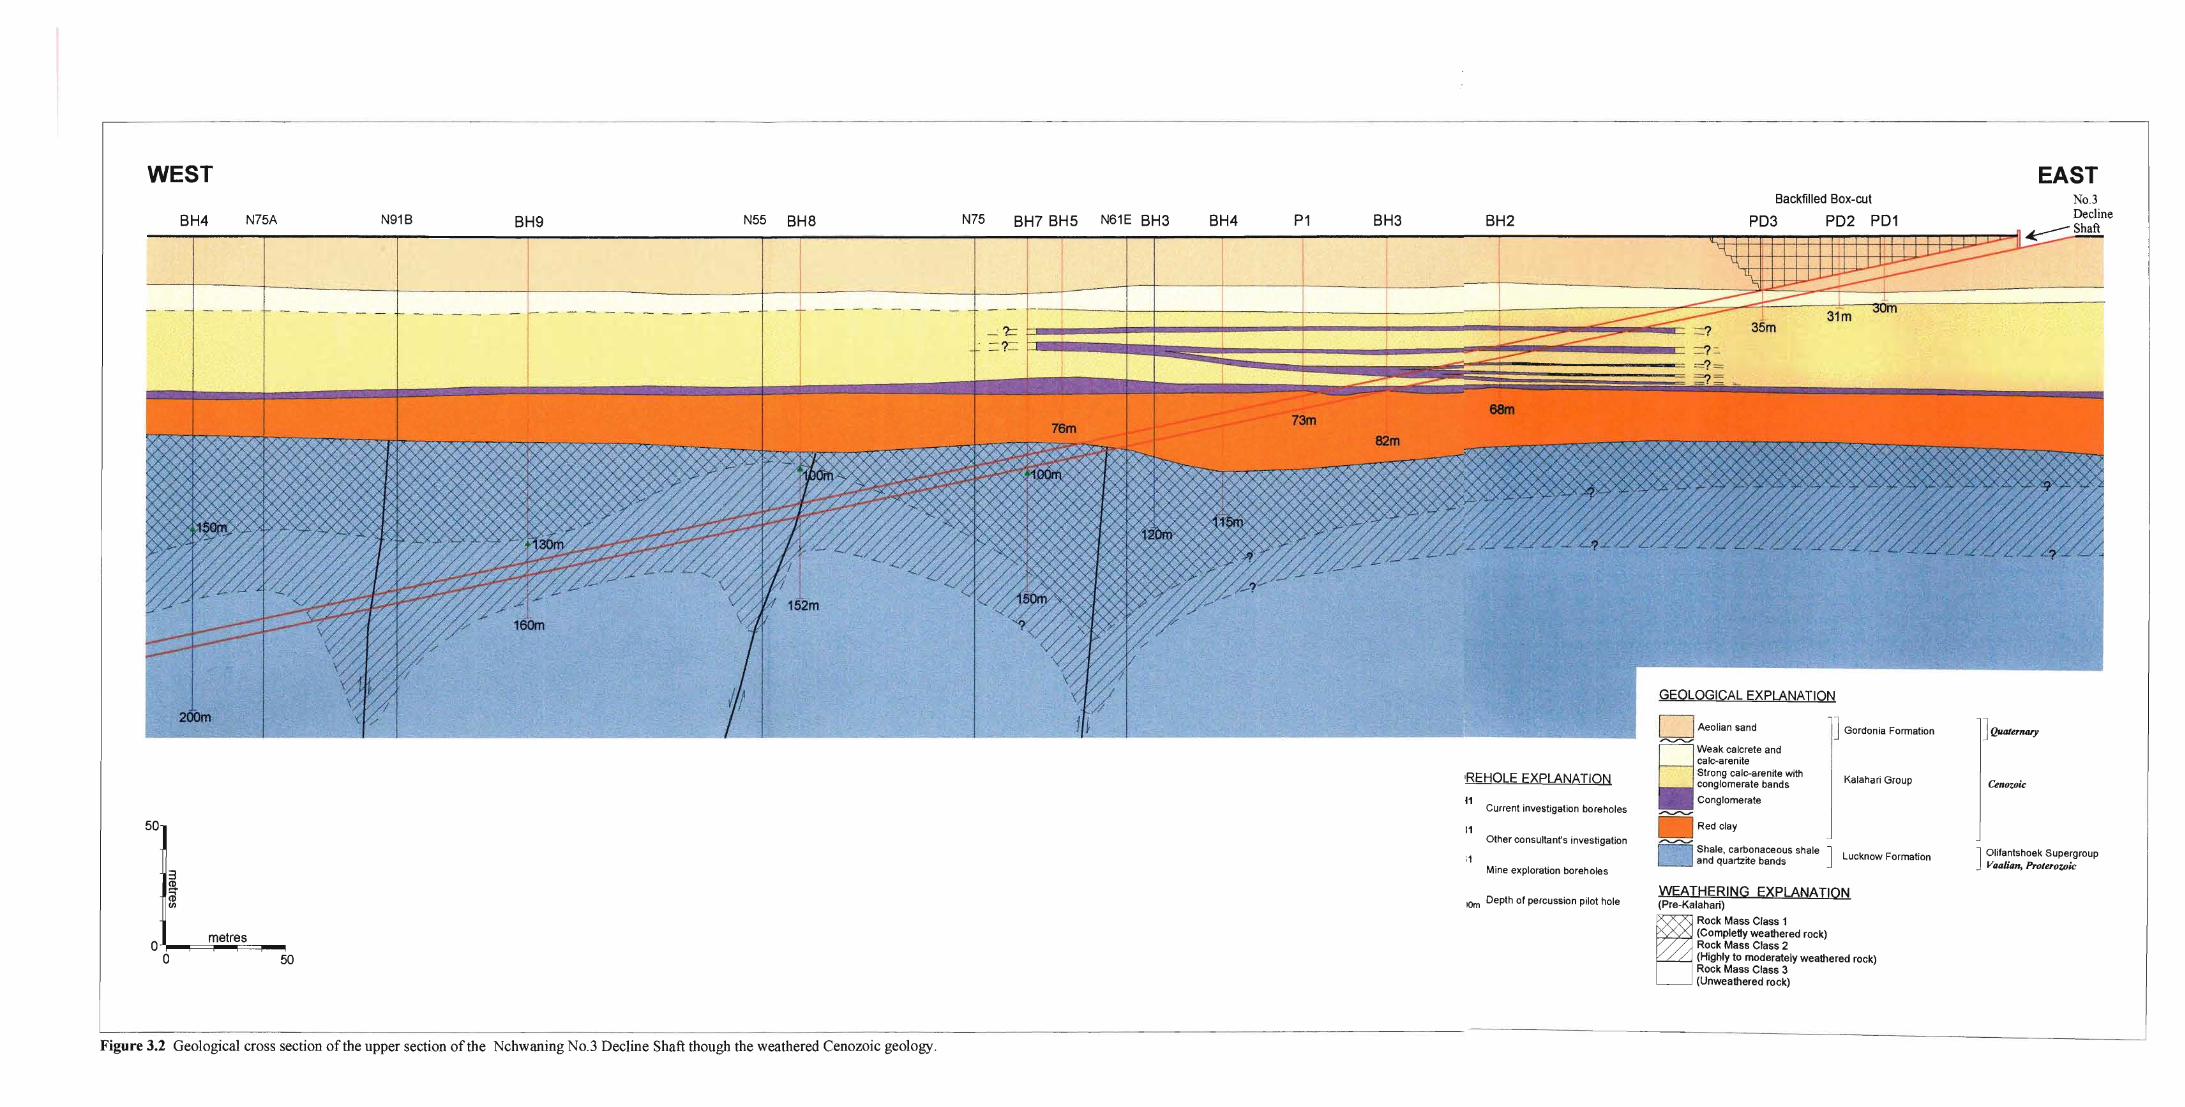
Figure 3.2 Geological cross section of the upper section of the No.3 Decline shaft. 18
Figure 3.3 Simplified representative borehole log of BH4 and BH7 drilled on the No.3 Decline Centreline, Nchwaning Mine. 19
Figure 3.4 Core photographs of BH4 showing the typical profile of the Kalahari Group and Red Clay. 20
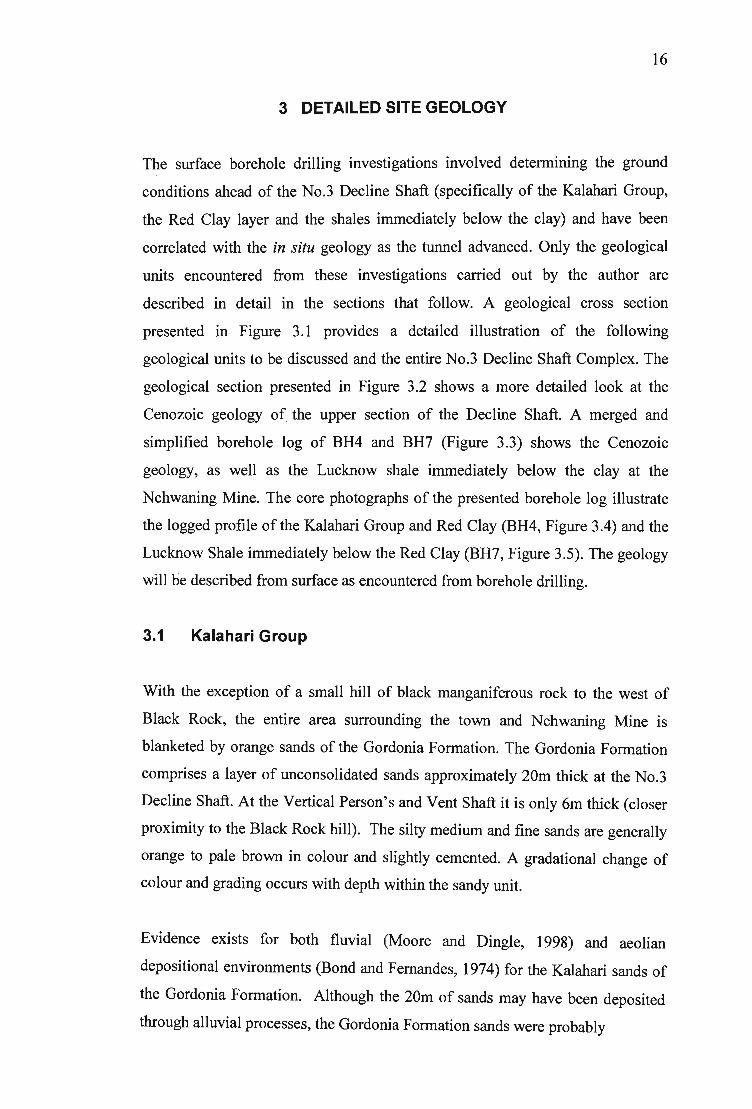
Figure 3.5 Core photographs of BH7 showing the typical profile of the Lucknow Shale immediately below the Red Clay. 22
Figure 3.6 Photograph of the No.3 Decline Shaft box cut showing the Gordonia sand profile. 26
Figure 3.7 Photograph of the pebble lag at the base of the Gordonia Formation. 26
Figure 3.8 Photograph of the silcrete mottling within the calc-arenites of the Kalahari Group. 26
Figure 3.9 Sketch face map of Red Clay and overlying conglomerate contact. 30
Figure 3.10 Photograph of a block of Red Clay showing the white, polished joint and slickensided surfaces. 30
Figure 3.11 Potential expansiveness graph of average clay percentage vs. average plasticity index of all the tested clay samples. 35

VI
LIST OF FIGURES (continued) Page
Figure 4.1 Graph of the average corrected N value of all DPSH tests with depth through the Gordonia sands. 49
Figure 4.2 The relationship between phi (friction angle) and depth through the Gordonia sands. 49
Figure 4.3 Comparison of inferred DCS from PLI testing with actual laboratory DCS results. 54
Figure 4.4 Calculated (inferred) DCS vs. depth from point load index testing carried out on Kalahari Group core samples from boreholes drilled along the No.3 Decline Shaft (BH2-BH5) and at the Vertical Person' s Shaft (BH6). 55
Figure 4.5 Calculated (inferred) DCS vs. depth from point load index testing carried out within the Lucknow shale from boreholes drilled below the Red Clay layer (BH7 -BH9). 58
Figure 4.6 Graphs of Barton' s Q-values vs. depth for each borehole drilled at the No.3 Decline Shaft (BH2-BH5) and at the Vertical Person's Shaft (BH6). 63
Figure 4.7 Graph of Barton's Q-values vs. depth within the Lucknow shale from boreholes drilled below the Red Clay layer (BH7 - BH9). 65
Figure 4.8 Photograph of the ITC machine and its conveyor belt 'tail'. 67
Figure 4.9 Photograph of the ITC machine as it begins the tunnelling into the weathered Kalahari Group calc-arenite. 67
Figure 4.10 Photograph of the sinking of the caisson of the Vertical Person's Shaft. 68

LIST OF TABLES
Table 1.1 Summary of all boreholes drilled.
Table 3.1 Summary of Gordonia sand grading and indicator and shear/phi test results.
Table 3.2 Averages of Gordonia sand grading and indicator and shear/phi test results.
Table 3.3 Summary of Red Clay XRD and XRF test results
Table 3.4 Summary of laboratory test results carried out on the Red Clay from grab and BH3 samples.
Table 3.5 Comparison of averages of laboratory test results carried out on the Red Clay from grab with BH3 samples.
Table 4.1 Summary ofPenetrometer test results at the Box-cut.
LIST OF TABLES (in Appendix A)
Table Al Face map summary during excavation of the No.3 Decline Shaft.
Tables A2 a-p Gordonia Formation Calculated Phi Values from tests DPSHI-DPSHI6.
Tables A3 a-h PLI and calculated UCS for boreholes BH2-BH9.
Tables A4 a-h Calculation ofQ value per core run of bore holes BH2-BH9.
LIST OF APPENDICES
Appendix A Data Tables
Appendix B Borehole Logs
Appendix C Laboratory Test Results
NOTE: All appendices are contained on the attached compact disc.
Only example sheets have been printed.
vu
Page
8
24
24
31
34
36
47

1
1 INTRODUCTION
1.1 Background
The small mining towns of Hotazel and Black Rock are approximately 70km
north of Kuruman in the Northern Cape Province, South Africa (Figure 1.1).
Their associated mines are well known for producing high-grade manganese ore
from the Early Proterozoic Kalahari Manganese Field, which is amongst the
largest land based sedimentary manganese deposits in the world (KleyenstUber,
1984; Gutzmer et al., 1997). The mine associated with Black Rock, Nchwaning
Mine (Figure 1.1 and Figure 1.2), is currently extending its shaft complex by the
addition of another decline shaft and associated vertical person's and ventilation
shafts. The new 9m wide decline shaft (Nchwaning No.3 Decline Shaft) is
inclined at 11.5° and will continue for 2.1km at the same gradient, where it will
link up to the Vertical Person's and Ventilation shafts, some 400m below
surface. Various geological and geotechnical complications had to be identified
to ensure correct tunnelling methods and support techniques were employed,
particularly within the weathered upper units. Prior to tunnelling through the
varied geology, a box cut was excavated to facilitate entry of the decline shaft
through the upper 20m of sand (see Figure 1.3).
The Kalahari region is characterized by low rainfall of less than 250mm per
annum (Thomas and Shaw, 1990), high rates of evapotranspiration, and a general
lack of surface water. Most of the Kalahari Manganese Field is buried beneath a
cover of Cenozoic deposits comprising wind blown sands of the Gordonia
Formation, as well as caicretes, calc-arenites, conglomerates and a thick unit of
clay (SACS, 1980; Tankard et al., 1982). All these units form the Kalahari
Group. In the area of study, these sediments attain a thickness of up to 90m. The
Kalahari Group has a relatively long history of study by previous authors (e.g.
Du Toit, 1954; Thomas and Shaw, 1990; Haddon, 2000), but the remoteness of
the terrain, poor exposure, and lack of suitable fossils for dating purposes, has
resulted in an unclear understanding of their age and depositional history.
C
Figure 1.1 Locality map of Nchwaning Mine and the Kalahari manganese field (A) showing the distribution of major normal and thrust faulting, ore types and location of , mines (B) (Modified after Gutzmer et al., 1997). The positions of the No.3 Decline Shaft Complex and all the boreholes used in this investigation are also shown (C).
B.
o !
km
Vertical Persons B~~ Shaft
" ~_" N63A N63B BH6 -_
PV1 - - BH5
/'feD - 0 - - -
ANGOLA \ ZAMBIA_r """> '----, ~-:-r- I (
- -:-..::- - V - \ Z-I M B A B W E /
I " ;; , \' ~
N A M I B I A _ J -~ / 1lV~
I BOTSWANA/- "\ 0 , ,~
../ I r ---..' JOhannasbUlYr ./R1ID/o~"Rock @ ,)
Mine
~Wf . Hotazel Mine
J/Langdon Annex II Mine ff
Borehole Explanation
<B Percussion Boreholes ] Drilled during current investigation
2
• Rotary Cored Boreholes
o Geotechnical Boreholes
" Exploration Boreholes
] Drilled during previous investigations
] Drilled by ASSMANG
Vent Shaft ~75i ...... N91A·· N h "
- N7SA N7S" C wanIng - - "",H4 BH9 M' Black Rock
Mine 0 100 200 300 400 I I I I I
metres
500 I
? - ...t BH8 Ine . - .... BH7BH5
NO.3 Decline Shaft - . BH4 BH3 B'13" "'" ..... BH2
N91B" NSS" N61E P1 N61 '- ~~02 .~1
Back-filled )f'~ - -Box Cut

Figure 1.2 View south of the site showing the relative positions of the Black Rock and Nchwaning Mines. The approximate centreline of the No.3 Decline shaft is indicated by the dashed line. (photograph: R. Puchner, March 2002) w

4
The excavatability of the Cenozoic rock poses many problems mainly due to its
weathered nature. However one unit of particular concern is a 30m thick unit of
red clay. This clay is problematic in that it is expansive and incredibly
hygroscopic. Not noted before from the previous geotechnical investigation of
the No. 3 Decline Shaft (Warkwick and Spears, 1998) the Mesozoic shale of the
Lucknow Formation below the clay unit has experienced intense faulting with
associated folding. Ground water has been able to penetrate deep into the steeply
dipping faults and facilitate weathering to over lOOm below current ground level.
Geotechnical investigations carried out in this study along the centreline of the
new decline shaft _focused on determining the geotechnical nature of the upper
calcified Kalahari Beds above the red clay layer, as well as the stratigraphy and
geological structure of the rock mass immediately below the red clay layer. The
red clay layer is well known in this area due to its very problematic nature. The
red clay comprises a silty clay which is highly active and ranges in thickness
from 25 to 35m. The upper unconformable scoured contact, below the Kalahari
Group, is at approximately 64 to 68m below surface. The basal contact of the
clay unit is 90 to lOOm below surface and appears to rest unconformably on
weathered shale bedrock.
Poor geotechnical conditions were anticipated and some concerns were raised as
to the need for high quality permanent tunnel support in this zone. In order to
establish a basis for understanding the rock mass characteristics of the weathered
ground above and below the red clay layer, the Q-analysis procedure of Barton
(1988) was adopted as a recognized tunnelling quality index. For this analysis, it
was necessary to generate a number of rock mass parameters from the borehole
core logging.
1.2 Objectives
When faced with rock, whether it be on surface for construction purposes or
below surface for tunnelling, one must consider the characteristics of both the
intact material as well as the discontinuities present within the rock mass. Input
information needed for design purposes included geological characterization of
5
the rock mass in its natural state and was obtained from site investigations.
According to Bieniawski (1984) geotechnical site investigations should provide
an understanding of:
a) Rock types to be encountered.
b) Depth and character of overburden.
c) Macroscopic scale discontinuities such as faults.
d) Groundwater conditions.
e) Special problems, such as weak ground or swelling rock.
All of these aspects are covered in this study. Pertinent parameters required for
the understanding of the above points are obtained from the investigations in
various ways. In this study these included data obtained from:
a) Available geological maps, published literature and local knowledge.
b) Geotechnical borehole drilling and core logging.
c) Study of ground water conditions.
d) Old exploration borehole log analysis.
e) Rock sample testing.
From these data it was possible to prepare detailed geological sections showing
all the litho logical units present and more importantly the favourable and
unfavourable zones in the rock mass. The close link between the rock mass
classification and rock type, which includes its geological history in terms of
tectonics and weathering, cannot be overlooked. To obtain a full understanding
of the rock mass quality it is imperative to discover and disclose all the details
pertaining to the pure geology of the site. It is the aim of this study to acquire a
full understanding of the geology of the site before providing an assessment of
the rock mass quality. This study will provide a closer look at the Cenozoic rock
with a brief reference to the weathered shale immediately below in this
manganese rich area around Black Rock in the Northern Cape.
As with the development of the Nchwaning No. 3 Shaft complex, other mines in
the area may also extend their shaft complexes. A comprehensive understanding

6
of the geology to be intersected is critical to the design and excavation of the
potential new shafts in the area. As part of the objectives in providing a link
between geology and rock mass quality, it is hoped that this information may be
of use for these new developments with similar geological complications.
1.3 Fieldwork
The field investigations involved the drilling of boreholes (percussion and rotary
core) and the testing of soil consistency by means of Dynamic Probe Super
Heavy (DPSH) tests. The drilling of boreholes included three percussion holes
for the box cut investigation (with 16 DPSH tests), eight rotary-cored boreholes
to a maximum depth of 160m for the No.3 Decline Shaft investigation, one
rotary-cored borehole to 105m depth at the Vertical Person's Shaft, and one
percussion borehole to 150m depth at the Vent Shaft. A summary of the
boreholes drilled is contained in Table 1.1. A plan of the site, Figure 1.1 shows
the layout of the shaft complex and boreholes drilled in this investigation, and
Figure 1.4 shows the drilling of a borehole from this investigation ahead of the
No.3 Decline Shaft.
All the core drilled during this investigation has been geotechnically logged by
the author. Point load index (PU) testing was also conducted in the field on the
borehole core and laboratory Unconfined Compressive Strength (UCS) testing
was carried out on selected core samples. The drilling from surface through the
sandy Gordonia Formation, the weathered Kalahari Beds, and the heaving red
clay layer involved two methods of bore hole drilling:
a) The drilling though the sandy Gordonia Formation was done by means of
washboring (poor material recovery) with immediate installation of temporary
steel casing. Once through the sands diamond rotary core drilling was done with
a NDW4 core barrel. This barrel is a spilt double-tube, which minimizes drilling
vibrations and provides maximum core recovery. Poor core recovery was
indicative of poor rock mass quality. The NX sized core is 54mm in diameter.
Temporary casing was still needed within these units, especially when drilling
through the conglomerate beds.
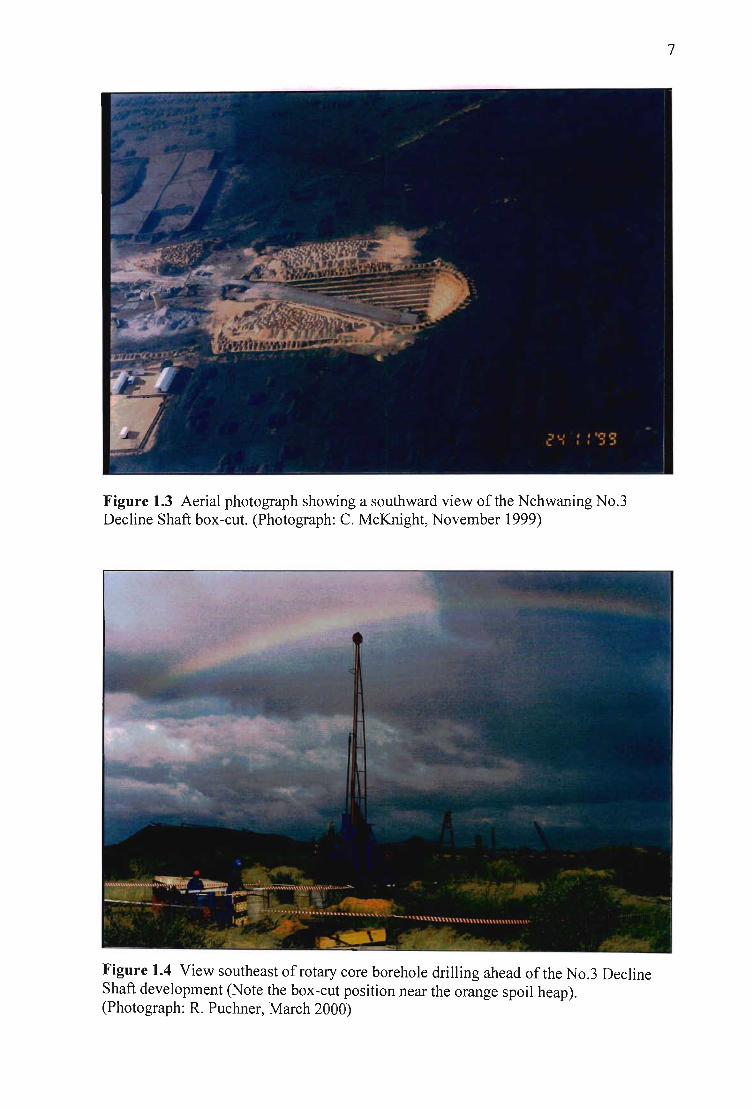
Figure 1.3 Aerial photograph showing a southward view ofthe Nchwaning No.3 Decline Shaft box-cut. (Photograph: C. McKnight, November 1999)
Figure 1.4 View southeast of rotary core borehole drilling ahead of the No.3 Decline Shaft development (Note the box-cut position near the orange spoil heap). (Photograph: R. Puchner, March 2000)
7

8
TABLE 1.1 Summary of Boreholes Drilled
Borehole Percussion Wash Rotary Drilled to Bored to Cored to Comments
Number (m) (m) (m)
PD1 31.1 Percussion drilled though Gordonia Sands and stopped in calcrete.
PD2 30.1 Percussion drilled though Gordonia Sands and stopped in calcrete.
PD3 35.1 Percussion drilled though Gordonia Sands and stopped in calcrete.
BH2 19.5 68.3 Hole stopped due to collapse in red clay layer.
BH3 21.6 82.4 Hole stopped due to collapse in red clay layer. Piezometer installed.
BH4 52.5 115.3 Original hole collapsed at 66.6m. Re-drilled by percussion to 97.0m.
BH5 20.5 76 Hole stopped due to collapse in red clay layer. Piezometer installed.
BH6 14.5 105.5 Drilled at Vertical Person' s Shaft. No red clay layer present.
BH7 100 150.6 Percussion drilled though red clay, and continued with rotary coring.
BH8 100 152.7 Percussion drilled though red clay, and continued with rotary coring.
BH9 130 157.8 Percussion drilled though red clay, and continued with rotary coring.
PVl 150.0 Percussion drilled only at Vent Shaft. Aquifer testing carried out.
9
b) Where the boreholes were required to penetrate the 30m thick clay layer
into the underlying shale it was necessary to first drill a permanently cased pilot
percussion hole (2I.6cm diameter) to a depth just below the clay layer
(approximately 90m below surface). Previous attempts of drilling through the
clay with conventional diamond rotary core drilling, which involved drilling
fluids, caused the hole to collapse and the drilling rods to become stuck within
the hole. Once the percussion hole had been drilled and cased (done within 24hrs
or the hole would also fail) the rotary core drilling (by means of a NDW4 core
barrel) could continue. Rotary core drilling within the shale immediately below
the clay also proved to be a great challenge. The highly weathered and broken
shale caused drilling to proceed very slowly, and core recovery was very poor.
During the advance of the No.3 Decline Shaft numerous visits to the face of the
tunnel were recorded by the author (Table Al in Appendix A). The face maps of
the geology encountered accurately corresponded to the core from the boreholes
drilled ahead. A few samples of the red clay layer (and Gordonia Formation
sands) were selected and tested in a commercial laboratory.
Piezometers were installed in select boreholes drilled along the No.3 Decline
Shaft, and at the Vertical Person's Shaft. The water levels were monitored and
recorded. A single hydrological percussion borehole was drilled at the Vent
Shaft. Pump out and recovery tests were conducted to quantify the aquifer
present within the conglomerate unit of the Kalahari Beds at the position of the
Vent Shaft.
10
2 PHYSICAL DESCRIPTION AND REGIONAL GEOLOGY
2.1 Physical Description
The Black Rock area is situated on an inland plateau at an elevation of
approximately 1000m amsl. The relief is generally low with a broad flat infilled
valley of the low mountain ranges to the far east and west. The area of the
Kalahari in which the manganese field is situated is referred to as the Gordonia
region. It is relatively flat and sand covered, with arid type vegetation comprising
scattered grasses and small thorned acacia trees and shrubs. Owing to the regions
semi-arid nature no permanent surface water is found. The regional drainage
pattern is northwards and the few river courses are ephemeral and flow extremely
infrequently (Verhagen, 1985). The average annual rainfall is in the range of 150
to 250mm, of which some 60 per cent occurs in the months of January to April
(Thomas and Shaw, 1990). Monthly evaporation rates can exceed the
precipitation by a factor of six or more (Meyer et al., 1985).
2.2 Regional Geology
The entire Early Proterozoic (2300 to 2100Ma) Kalahari manganese field
(Gutzmer et al., 1997) in the Kuruman area is covered by calcretized sediments
of the Cenozoic Kalahari Group (Key et al., 1998; Gutzmer et al., 1997; Thomas
& Shaw, 1990; Jennings, 1986; Nel et al., 1986). Figure 2.1 shows the
distribution and thickness of the Kalahari Group across southern Africa. The
basin into which the Kalahari Group sediments were deposited is elongated in a
north northeast to south southwest direction.
The Kalahari Group comprises up to 20m of windblown, unlithified sand of the
Gordonia Formation (Pleistocene to Holocene), which unconformably overlies
calcified sand, and gravel. The upper section of the Kalahari Group has
undergone pedogenesis to form a thick capping of calcrete. The Kalahari Group
is up to 65m in thickness and unconformably overlies a 30m thick red clay layer.
The red clay layer in turn unconformably blankets the Olifantshoek Supergroup.
Figure 2.2 provides a simplified strati graphic column of the geology present at

WEST Vertical Persons
/' Shaft
BH1 N63A PV1 N63B BH5 N75C N63C N75B N91A
200
3 100 ~
(il C/l
50
0 metres 0 50 100 200
.. Figure 3.1 Geological cross section of the Nchwaning No.3 Decline Shaft Complex showing geological interpretation and weathering fronts .
EAST Fs~ee~~~~~----------------------------------------------------------------------------------' NO.3
BH4 N75A N91B BH9 BH3 N61 BH2
GEOLOGIQAL EXPLANATION
Aeolian sand
\i HERING EXPLANATION Calcrete and calc-arenite (i ahari) with conglomerate bands
f Rod< ",,' Cl", 1 Conglomerate
(Completly weathered rock) Rock Mass Class 2
Red clay (Highly to moderately weathered rock) Rock Mass Class 3
Shale, carbonaceous shale 1 (Unweathered rock) and quartzite bands
El -lOLE EXPLANATION Quartzite
Shale
1 Current investigation boreholes
Shale and quartzite bands
Other consultant's investigation Banded ironstone ] and manganese ore Mine exploration boreholes Andesite lava ]
Backfilled Box-cut PD3 PD2 PD1
] Gordonia Formation
Kalahari Group
Lucknow Formation
Mapedi Formation
] Qllatemary
Cenozoic
Olifantshoek Supergroup
Decline Shaft
Vaolian, Protuoz,oic
Hotazel Member, 1 Cox Group, Voelwater Formation Griqualand West Ongeluk Andesite Formation Supergroup
VtuJlion, Protuoz,oic
WEST
BH4 N75A N918 BH9 N55 BH8 N75 BH? BH5 N61E BH3 BH4 P1 BH3 BH2
tREHOLE EXPLANATION
11 Current investigation bore holes
50 11 Other consultanfs investigation
Mine exploration boreholes
IOm Depth 01 percussion pilot hole
Figure 3.2 Geological cross section of the upper section of the Nchwaning No.3 Decline Shaft though the weathered Cenozoic geology.
Backfi"ed Box-cut
PD3 PD2 PD1
GEOLOGICAL EXPLANATION
D Aeolian sand "-"-""
~ Weak calcrete and calc-arenite
'.' . .. . Strong calc-arenite with '. conglomerate bands
Conglomerate ~
Red clay
] Gordonia Formation
Kalahari Group
WEATHERING EXPLANATION (Pre-Kalahari)
~ Rock Mass Class 1 (Completly weathered rock) Rock Mass Class 2 (Highly to moderately weathered rock) Rock Mass Class 3 (Unweathered rock)
EAST No.3
] Qllaternary
] Olilantshoek Supergroup Vaalian, Proterowic

-~ lA ;' --'- ........
,.- . /
JoI'anne~;ou,ra @
,,.r-,, r' 1
f \,-SOUTH AFRICA
~
<50m
51-100m
101-200m
201-300m
>300m
Thickness unknown
11
Figure 2.1 Distribution and thickness of the Kalahari Group of southern Africa (After Thomas and Shaw 1990, and Thomas and Shaw 1991).
D Aeolian sand ~
~ Calcrete and calc-arenite with conglomerate bands
Conglomerate
Red clay
Shale, carbonaceous shale 1 and quartzite bands
Quartzite
Shale 1 Shale and quartzite bands
Banded ironstone and manganese ore
Andesite lava
] ]
] Gordonia Formation
Kalahari Group
Lucknow Formation
Mapedi Formation
] Quatemary
Cenozoic
Olifantshoek Supergroup Vaalian, Proterozoic
Hotazel Member, 1 Cox Group, Voelwater Formation Griqualand West Ongeluk Andesite Formation Supergroup
Vaalian, Proterozoic
Figure 2.2 Simplified stratigraphic column of the geology encountered at Nchwaning Mine (After SACS 1980; Visser, 1984 and Grobbelaar et aI., 1995).
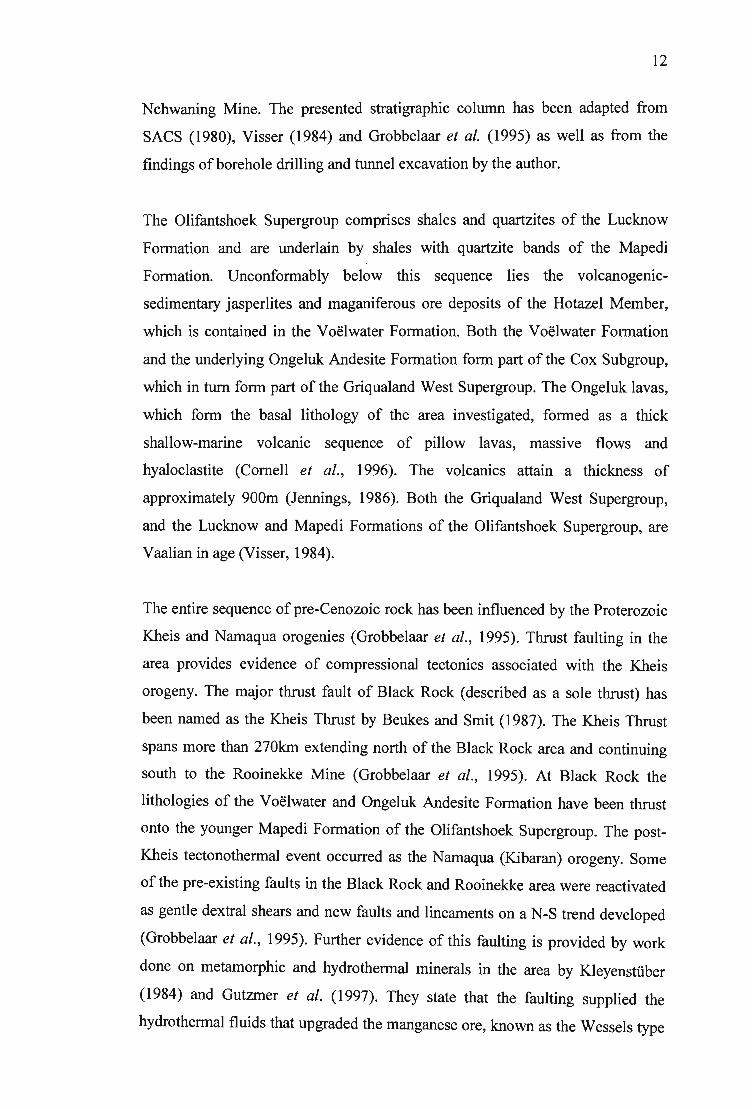
12
Nchwaning Mine. The presented strati graphic column has been adapted from
SACS (1980), Visser (1984) and Grobbelaar et al. (1995) as well as from the
findings of bore hole drilling and tunnel excavation by the author.
The Olifantshoek Supergroup comprises shales and quartzites of the Lucknow
Formation and are underlain by shales with quartzite bands of the Mapedi
Formation. Unconformably below this sequence lies the volcano genic
sedimentary jasperlites and maganiferous ore deposits of the Hotazel Member,
which is contained in the Voelwater Formation. Both the Voelwater Formation
and the underlying Ongeluk Andesite Formation form part of the Cox Subgroup,
which in turn form part of the Griqualand West Supergroup. The Ongeluk lavas,
which form the basal lithology of the area investigated, formed as a thick
shallow-marine volcanic sequence of pillow lavas, massive flows and
hyaloclastite (Comell et al., 1996). The vo1canics attain a thickness of
approximately 900m (Jennings, 1986). Both the Griqualand West Supergroup,
and the Lucknow and Mapedi Formations of the Olifantshoek Supergroup, are
Vaalian in age (Visser, 1984).
The entire sequence of pre-Cenozoic rock has been influenced by the Proterozoic
Kheis and Namaqua orogenies (Grobbelaar et al., 1995). Thrust faulting in the
area provides evidence of compressional tectonics associated with the Kheis
orogeny. The major thrust fault of Black Rock (described as a sole thrust) has
been named as the Kheis Thrust by Beukes and Smit (1987). The Kheis Thrust
spans more than 270km extending north of the Black Rock area and continuing
south to the Rooinekke Mine (Grobbelaar et al., 1995). At Black Rock the
lithologies of the Voelwater and Ongeluk Andesite Formation have been thrust
onto the younger Mapedi Formation of the Olifantshoek Supergroup. The post
Kheis tectonothermal event occurred as the Namaqua (Kibaran) orogeny. Some
of the pre-existing faults in the Black Rock and Rooinekke area were reactivated
as gentle dextral shears and new faults and lineaments on a N-S trend developed
(Grobbelaar et al., 1995). Further evidence of this faulting is provided by work
done on metamorphic and hydrothermal minerals in the area by Kleyensruber
(1984) and Gutzmer et al. (1997). They state that the faulting supplied the
hydrothermal fluids that upgraded the manganese ore, known as the Wessels type

13
ore of the Kalahari Manganese Field (Figure 1.1). After compressional stresses
relaxed, a tensional stress field developed where the above mentioned structures
reverted to normal faults, forming horsts and grabens. It is well documented that
a prominent N-S trending graben structure exists between Black Rock and
Nchwaning mines.
The presence of the Karoo Supergroup in the Gordonia area is well documented
by various authors. From boreholes drilled in the Tshabong area of southern
Botswana (to the northwest of the manganese field) Key et al. (1998) found two
southwest-trending valleys infilled with lower Karoo Supergroup strata. These
formations were identified as a thick basal glacial sequence of Dwyka Group
tillites, followed by sandstones of the Ecca Group and overlying argillites of the
Beaufort Group. Jennings (1986) indicates 50 to 180m of Dwyka tillite overlying
the Voelwater Formation at the Middelplaats Mine, some 20km south of Black
Rock. Numerous exploration boreholes drilled in the Black Rock area identified
Dwyka Group tillite occurring below the red clay layer. The presence of these
tillites resting unconformably on Precambrian basement rocks provides evidence
that the southern part of the Kalahari basin has been in existence from the
Palaeozoic (Thomas and Shaw, 1991). Although there may well be Dwyka
Group tillite and shale infilling palaeo-glacial valleys below the Kalahari Group
in this area, this glacial lithology was not found in any of the boreholes drilled
for the investigation of the No.3 Decline Shaft centreline, nor was it seen during
the excavation of the tunnel.
For a long time the term Kalahari Formation has been used to describe the oldest
post-Karoo deposits of the Kalahari. Where studies are done on Precambrian
rocks of central southern Africa, the Kalahari beds form a "frustrating" mantle
of continental debris (Key and Rundle, 1981). Although SACS (1980) states that
the Kalahari deposits extend in age down to at least Paleocene to Oligocene,
other authors suggest an earlier start to the formation of the Kalahari basin.
Du Toit (1954) states that the development of the Kalahari basin started in the
Cretaceous, Partridge and Maud (1987) say toward the end of the Cretaceous.
However it seems most likely to have its earliest origins during the late Jurassic,
related to the breakup of Gondwana (Haddon, 2000).
14
It is well known that climate during much of the Cretaceous was warm and
humid (Tyson and Partridge, 2000), which not only allowed deep weathering
mantles to develop (Partridge and Maud, 2000), but also facilitated rapid erosion
and the formation of the African Erosion Surface (King, 1962). The
epeirogenesis and widespread erosion of the weathered mantle characterized the
Cenozoic history of southern Africa (Tankard et al., 1982). Haddon (2000) states
that much of the sediment accumulation occurred in arid or semi-arid climates
between the Middle Miocene and the Upper Pliocene or Early Pleistocene,
finally attaining an average thickness of 100-200m. Most authors concur that the
main development of the Kalahari basin was during the Cenozoic.
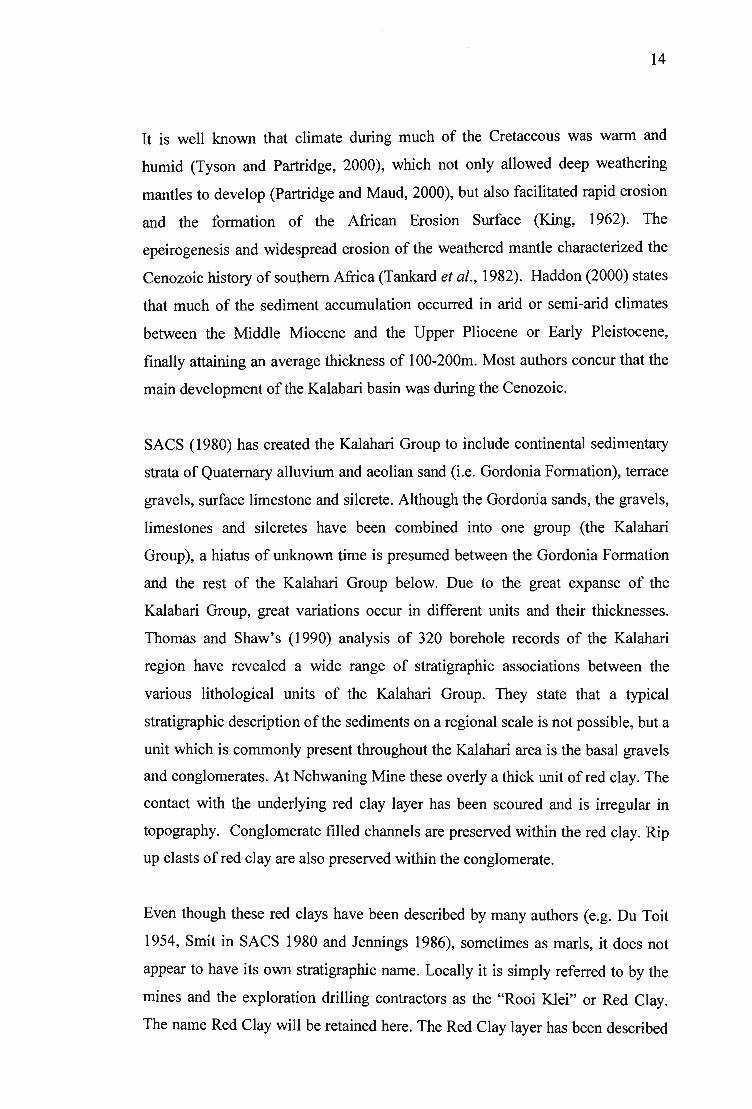
SACS (1980) has created the Kalahari Group to include continental sedimentary
strata of Quaternary alluvium and aeolian sand (i.e. Gordonia Formation), terrace
gravels, surface limestone and silcrete. Although the Gordonia sands, the gravels,
limestones and silcretes have been combined into one group (the Kalahari
Group), a hiatus of unknown time is presumed between the Gordonia Formation
and the rest of the Kalahari Group below. Due to the great expanse of the
Kalahari Group, great variations occur in different units and their thicknesses.
Thomas and Shaw's (1990) analysis of 320 borehole records of the Kalahari
region have revealed a wide range of strati graphic associations between the
various lithological units of the Kalahari Group. They state that a typical
strati graphic description of the sediments on a regional scale is not possible, but a
unit which is commonly present throughout the Kalahari area is the basal gravels
and conglomerates. At Nchwaning Mine these overly a thick unit of red clay. The
contact with the underlying red clay layer has been scoured and is irregular in
topography. Conglomerate filled channels are preserved within the red clay. Rip
up clasts of red clay are also preserved within the conglomerate.
Even though these red clays have been described by many authors (e.g. Du Toit
1954, Smit in SACS 1980 and Jennings 1986), sometimes as marls, it does not
appear to have its own stratigraphic name. Locally it is simply referred to by the
mines and the exploration drilling contractors as the "Rooi Klei" or Red Clay.
The name Red Clay will be retained here. The Red Clay layer has been described
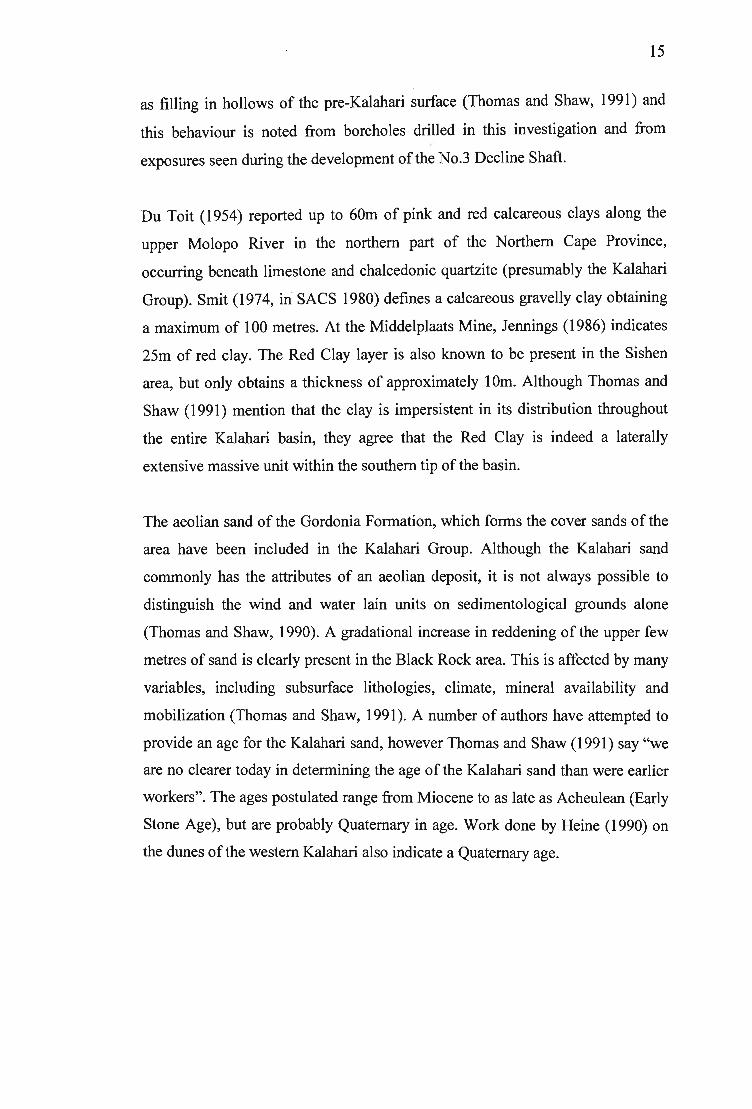
15
as filling in hollows of the pre-Kalahari surface (Thomas and Shaw, 1991) and
this behaviour is noted from boreholes drilled in this investigation and from
exposures seen during the development of the No.3 Decline Shaft.
Du Toit (1954) reported up to 60m of pink and red calcareous clays along the
upper Molopo River in the northern part of the Northern Cape Province,
occurring beneath limestone and chalcedonic quartzite (presumably the Kalahari
Group). Smit (1974, in SACS 1980) defines a calcareous gravelly clay obtaining
a maximum of 100 metres. At the Middelplaats Mine, Jennings (1986) indicates
25m of red clay. The Red Clay layer is also known to be present in the Sishen
area, but only obtains a thickness of approximately 10m. Although Thomas and
Shaw (1991) mention that the clay is impersistent in its distribution throughout
the entire Kalahari basin, they agree that the Red Clay is indeed a laterally
extensive massive unit within the southern tip of the basin.
The aeolian sand of the Gordonia Formation, which forms the cover sands of the
area have been included in the Kalahari Group. Although the Kalahari sand
commonly has the attributes of an aeolian deposit, it is not always possible to
distinguish the wind and water lain units on sedimentological grounds alone
(Thomas and Shaw, 1990). A gradational increase in reddening of the upper few
metres of sand is clearly present in the Black Rock area. This is affected by many
variables, including subsurface lithologies, climate, mineral availability and
mobilization (Thomas and Shaw, 1991). A number of authors have attempted to
provide an age for the Kalahari sand, however Thomas and Shaw (1991) say "we
are no clearer today in determining the age of the Kalahari sand than were earlier
workers". The ages postulated range from Miocene to as late as Acheulean (Early
Stone Age), but are probably Quaternary in age. Work done by Heine (1990) on
the dunes of the western Kalahari also indicate a Quaternary age.
16
3 DETAILED SITE GEOLOGY
The surface borehole drilling investigations involved determining the ground
conditions ahead of the No.3 Decline Shaft (specifically of the Kalahari Group,
the Red Clay layer and the shales immediately below the clay) and have been
correlated with the in situ geology as the tunnel advanced. Only the geological
units encountered from these investigations carried out by the author are
described in detail in the sections that follow. A geological cross section
presented in Figure 3.1 provides a detailed illustration of the following
geological units to be discussed and the entire No.3 Decline Shaft Complex. The
geological section presented in Figure 3.2 shows a more detailed look at the
Cenozoic geology of the upper section of the Decline Shaft. A merged and
simplified borehole log of BH4 and BH7 (Figure 3.3) shows the Cenozoic
geology, as well as the Lucknow shale immediately below the clay at the
Nchwaning Mine. The core photographs of the presented borehole log illustrate
the logged profile of the Kalahari Group and Red Clay (BH4, Figure 3.4) and the
Lucknow Shale immediately below the Red Clay (BH7, Figure 3.5). The geology
will be described from surface as encountered from borehole drilling.
3.1 Kalahari Group
With the exception of a small hill of black manganiferous rock to the west of
Black Rock, the entire area surrounding the town and Nchwaning Mine is
blanketed by orange sands of the Gordonia Formation. The Gordonia Formation
comprises a layer of unconsolidated sands approximately 20m thick at the No.3
Decline Shaft. At the Vertical Person's and Vent Shaft it is only 6m thick (closer
proximity to the Black Rock hill). The silty medium and fine sands are generally
orange to pale brown in colour and slightly cemented. A gradational change of
colour and grading occurs with depth within the sandy unit.
Evidence exists for both fluvial (Moore and Dingle, 1998) and aeolian
depositional environments (Bond and Femandes, 1974) for the Kalahari sands of
the Gordonia Formation. Although the 20m of sands may have been deposited
through alluvial processes, the Gordonia Formation sands were probably

PID
72.2 15.8
89.5
60.0 0.0
Moist , reddish orange, loose, massive, medium and fine SAND. Gordonia Formation.
Moist, very pale orange, massive, dense to very dense, medium and fine SAND. Gordonia Formation.
Moist, reddish orange, massive, dense to very dense, medium and fine SAND. Gordonia Formation.
Pale brownish grey, mottled off-white, stained brownish orange, moderately to highly weathered, fine to medium-grained, medium jointed, weak rock becoming strong rock below 32,Om. CALC-ARENITE. Kalahari Group.
Pale off white, stained grey, unweathered to slightly weathered, fine to medium grained, widely jointed, ~ strong to strong rock. CALC-ARENlTE. Kalahari Group.
Pale grey to white, stained brownish red, medium to coarse grained, medium to widely jointed, strong rock. CALC-ARENITE. Kalahari Group.
Pale brown speckled dark brown and black, highly weathered , medium to coarse grained, weak rock. PEBBLY CALC-ARENITE. Kalahari Group.
Pale brownish grey to off-white, highly weathered, medium jointed, fine to medium grained, weak to very weak rock. CALC-ARENITE. Kalahari Group.
Pale brown, speckled dark brown and black, completely weathered, medium to coarse grained, polymictic, ~ weak to weak rock. CONLOMERATE. Kalahari Group.
Moist, reddish brown, slickensided, relict jointed, stiff to very stiff, silty CLAY. Red Clay.
Note: iBiack sub-rounded cobbles (10 - 20mm) within clay
from 77 - 78m and 84 - 85m. t---/-mn---t---f-,-- 90.00
Purplish brown to pinkish red, completely weathered, very closely jointed, fine grained, very weak rock. SHALE. Luclcnow Formation.
3.8 110
130
140
99.00
Light reddish brown to maroon, stained and banded yellowish white, highly to completely weathered, very closely jointed, fme grained, very weak and weak rock. ·SHALE. Luclcnow Formation.
122.16 --------------------1 Light reddish brown to maroon, banded and stained yellowish white, highly weathered, medium to closely jointed, fine grained. very weak and weak rock. SHALE. Luclcnow Formation.
+---I~ __ -4~~:I__--145.30 --------------------1
150 Bluish grey, stained reddish brown and · orange, moderately to highly weathered, very closely jointed, fine grained, medium strong rock. SHALE. Lucknow Formation.
150.66 --------------------1 End of hole.
NOTES
1) BH4 washbored (W/B) to 22.1m. cored to Red Clay.
2) BH7 percussion drilled (PlO) to 100.64m. cored to 150.66m.
19
Figure 3.3 Simplified representative borehole log of BH4 and BH7 drilled on the No.3 Decline Centreline, Nchwaning Mine.

20
Borehole BH4
O.OOm
42.54m
Figure 3.4 Core photographs of BH4 showing the typical profile of the Kalahari Group and Red Clay. (Photographs: R. Puchner, May 2000)

21
Borehole BH4
42.54m
86.09m
Figure 3.4 (Continued) Core photographs of BH4 showing the typical profile of the Kalahari Group and Red Clay. (Photographs: R. Puchner, May 2000)
22
Borehole BH7
150.66m
Figure 3.5 Core photographs of BH7 showing the typical profile of the Lucknow Shale immediately below the Red Clay. (Photographs: R. Puchner, July 2000)
23
reworked and deposited as aeolian dunes. Fossilized linear dunes in the area
(Haddon, 2000; Helgren and Brookes, 1983; Heine, 1990) and the lack of fluvial
gravel beds or channels within the unit further confirm this.
In the area of the No.3 Decline Shaft the upper 4.5 to 6.0m of the Gordonia
Formation consists of moist, reddish orange, medium and fine grained sand. This
material is cohesionless with a low clay content (2 to 8%). The aeolian sand
becomes paler in colour with depth, changing to orange yellow below the
oxidized layer (Figure 3.6). Natural moisture content varies with depth from 6%
within the upper 12m to 3% below. In the basal drier zone, the material is usually
more orange in colour. The sand deposit appears weakly stratified with lenses of
very fine sand interlayered with slightly coarser material.
The abovementioned soils testing, and all other physical soils testing referred to
from hereon, were carried out by Soiltech Laboratories in Johannesburg
according to standard test methods (Standard methods of testing road
construction materials TMHl, 1986). The relevant pages of the publication have
been included in Appendix C.
Numerous samples of the Gordonia Formation sands were obtained at
incremental depths from percussion drilling of the box-cut investigation. These
samples were tested (at Soiltech Laboratories, Johannesburg) and the results of
which have been summarised in Table 3.1. All original test results are contained
within Appendix C.
Table 3.2 shows the averages of the laboratory test results above, which have
been grouped into three arbitrary depth zones. It can be seen from the table that
as the clay content increases with depth, the plasticity index increases slightly
with depth. The natural moisture content is highest within the middle zone of the
sandy unit and lowest in the lower 12 to 20m of the profile. This correlates to the
highest silt content in the middle zone and the probable lack of hygroscopic
movement of water beyond this zone to the lower zone.

24
TABLE 3.1 Summary of Gordonia Sand Grading and Indicator and ShearlPhi Test Results
Sample No. PD PD PD PD PD PD PD PD PD PD 211 2/2 2/3 2/4 2/5 2/6 217 2/8 2/9 2110
Sample depth (m) 1.7 3.7 5.7 7.7 9.7 11.7 13.7 15.7 17.7 19.7
Liquid Limit 24.0 18.0 29.0 25.0 23.0 27.0 33.0 29.0 22.0 22.0
Plasticity Index 0.9 1.2 0.9 5.1 0.9 1.0 5.3 5.2 1.0 1.4
Nat. Moist. Cont. 4.4 5.7 5.8 5.7 5.5 5.7 3.2 3.4 3.1 3.3
% Gravel 0.0 0.0 0.0 0.0 0.0 0.1 0.0 0.1 0.1 0.1
% Sand 91.7 91.8 87.2 81.8 47.3 89.5 84.7 86.9 83.4 81.4
% Silt 6.1 6.0 7.7 12.4 46.9 4.6 8.4 8.0 8.2 10.9
% Clay 2.2 2.2 5.1 5.8 5.8 5.8 6.9 5.1 8.3 7.6
Unified Class SP/SM SP/SM SM SC/SM ML SM SM SM SM SM I I I I I
Cohesion (kN/m2) 12 17 16
Friction angle N 30.70 30.40 31.40
TABLE 3.2 Averages of Gordonia Sand Grading and Indicator and ShearlPhi Test Results
Depth (m) 0-6 6 -12 12 - 20
Liquid Limit 23.7 25.0 24.3
Plasticity Index 1.0 2.3 2.5
Nat. Moisture Content 5.3 5.6 3.3
% Gravel 0.0 0.0 0.1
% Sand 90.2 72.9 83.9
% Silt 6.6 21.3 9.0 % Clay 3.2 5.8 7.0 Unified Class SP/SM SC/SM SM
Cohesion (kN/m2) 12 17 16 Friction angle N 30.70 30.40 31.40
25
At the base of the aeolian sand there is a prominent medium to coarse grained
gravel lag (approximately 50 to 100mm thick) of subrounded and rounded
gravels which forms an unconformity with the underlying older calcretes
(Figure 3.7). This layer is uncalcified and the base is gently undulating and varies
from 21.0m to 22.5m depth. Passarge (1904, in Thomas and Shaw, 1991) also
noted that the base of the Kalahari sands contained fluviatile gravels in places.
The older calcified medium and fine grained sand deposits and conglomerate
beds of the Kalahari Group lie below the Gordonia Formation. This material is
residual calc-arenite that has been re-cemented as a pedogenic layer (calcrete).
At the No.3 Decline Shaft the total thickness may vary from 24 to 28m, where as
at the Vertical Person's and Vent Shaft the Kalahari Group is 60 to 68m thick.
In the area of the No.3 Decline Shaft the calcified medium and fine grained sand
deposits are fining upward arenaceous sediments. The upper 11 to 13m of this
calcrete layer has deteriorated due to weathering into a friable weak to medium
strong rock. Note that for description purposes the following strength categories
of the International Society of Rock Mechanics (ISRM, 1981) were adopted:
Description UCS {.MPa2
Very weak rock <5
Weak rock 5 - 25
Medium strong rock 25 - 50
Strong rock 50 - 100
Very strong rock 100 - 250
Extremely strong rock >250
This calcrete layer is pale brownish grey in colour and stained pale orange
brown, highly weathered, fine to medium grained, medium to very closely
fractured rock. Irregular pockets of completely weathered calc-arenite do occur
and the unit may range from strong to very weak in strength. Secondary
calcretization is evident. There are patches of brown silicification (Figure 3.8),
scattered fine rounded gravels and rip-up clasts scattered throughout this unit.
OccasionaI'slickenside surfaces are present. Joint surfaces may be stained brown,

26
Figure 3.6 View westward of the No.3 Decline Shaft box cut showing the Gordonia sand profile. (Photograph: C. McKnight, November 1999)
Figure3.7 The pebble lag at the base of the Gordonia Formation exposed in the No.3 Decline Shaft box cut. (Photograph: R. Puchner, March 2000)
Figure 3.8 Brown silcrete mottling within the calc-arenites of the Kalahari Group exposed in the No.3 Decline Shaft box cut. (Photograph: R. Puchner, April 2000)
27
and may have preserved within them fine rootlets. Small dissolution structures
are occasionally present.
With depth, the calcrete layer becomes increasingly whiter in colour and stronger
(very strong rock), with distinct zones of brown silicification mottles. The strong
calc-arenite layer is 5 to 8m thick, massive and generally occurs from 31.5 to
39.5m vertical depth. It is off-white stained pink to pale red in colour and is more
widely jointed. It may contain thin gritty or small pebble conglomerate bands.
From approximately 39.5m depth, the calc-arenite becomes slightly weaker in
strength, with a coarser grain size and variable colour from white to pale greenish
brown. Slickenside surfaces are common and pebbly horizons appear. The core
ranges in strength from weak to strong rock. Fine dissolution structures may be
present.
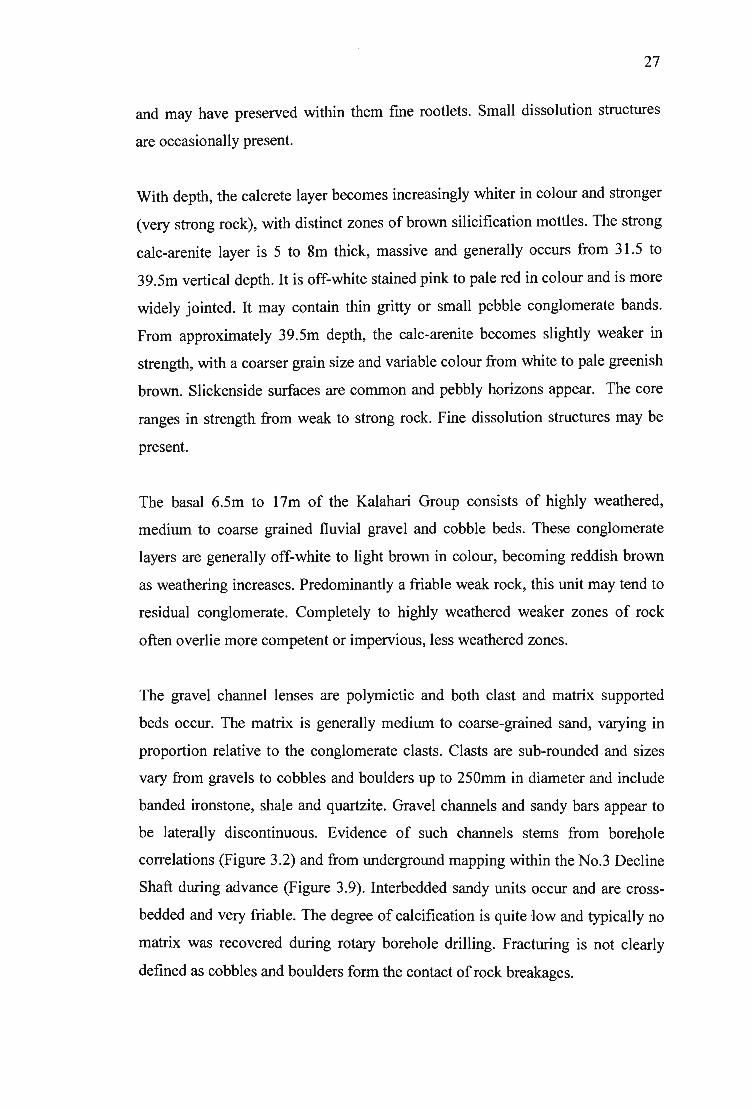
The basal 6.5m to 17m of the Kalahari Group consists of highly weathered,
medium to coarse grained fluvial gravel and cobble beds. These conglomerate
layers are generally off-white to light brown in colour, becoming reddish brown
as weathering increases. Predominantly a friable weak rock, this unit may tend to
residual conglomerate. Completely to highly weathered weaker zones of rock
often overlie more competent or impervious, less weathered zones.
The gravel channel lenses are polymictic and both clast and matrix supported
beds occur. The matrix is generally medium to coarse-grained sand, varying in
proportion relative to the conglomerate clasts. Clasts are sub-rounded and sizes
vary from gravels to cobbles and boulders up to 250mm in diameter and include
banded ironstone, shale and quartzite. Gravel channels and sandy bars appear to
be laterally discontinuous. Evidence of such channels stems from borehole
correlations (Figure 3.2) and from underground mapping within the No.3 Decline
Shaft during advance (Figure 3.9). Interbedded sandy units occur and are cross
bedded and very friable. The degree of calcification is quite low and typically no
matrix was recovered during rotary borehole drilling. Fracturing is not clearly
defined as cobbles and boulders form the contact of rock breakages.
28
At the Vertical Person's Shaft the main calc-arenite occurs from 16.0m to 55.8m.
The fine to medium grained calc-arenite is off-white to pale brownish green and
highly weathered to moderately weathered. This layer ranges in strength from
weak to very strong rock. Slickensided surfaces are also present as are minor fine
dissolution cavities. Pale brown patches of silcrete commonly occur. From 55.8m
to 68.0m (12.2m in thickness), there is a fining upward layer of fluvial gravels
and cobbles of the deeply weathered basal conglomerate. The conglomerate band
is polymictic and mostly clast supported. Rotary core drilling recovery was
generally very poor due to the highly leached nature of the carbonate cement.
The in situ strength of the unit is defined as a weak rock.
The Kalahari Group sediments are probably an aggrading fluvial fan (proximal
and distal) deposit that formed as a result of epeirogenic uplift along the
Griqualand-Transvaal axis to the south of Kuruman during the Late Cretaceous
period (Partridge and Maude, 1987). The conglomerate layer is considered to be
the basal unit of the aggrading Kalahari Group.
Where the No.3 Decline Shaft intersected the contact between the conglomerate
and the clay layer, the depth from surface was approximately 3.0m deeper than
anticipated from borehole correlations. Undulating erosion of the clay layer by
local scour within a large alluvial system occurred into which channel fill was
deposited. Face exposure on 6th August 2000 clearly showed the erosive nature
of the contact (Figure 3.9).
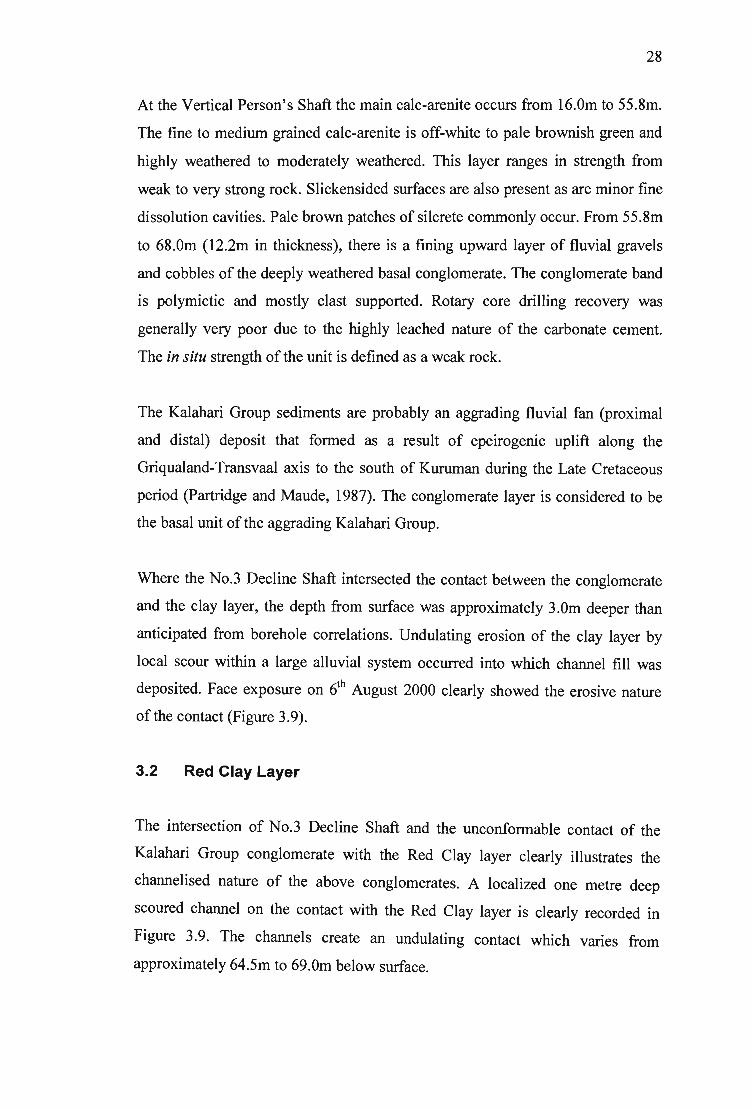
3.2 Red Clay Layer
The intersection of No.3 Decline Shaft and the unconformable contact of the
Kalahari Group conglomerate with the Red Clay layer clearly illustrates the
channelised nature of the above conglomerates. A localized one metre deep
scoured channel on the contact with the Red Clay layer is clearly recorded in
Figure 3.9. The channels create an undulating contact which varies from
approximately 64.5m to 69.0m below surface.
29
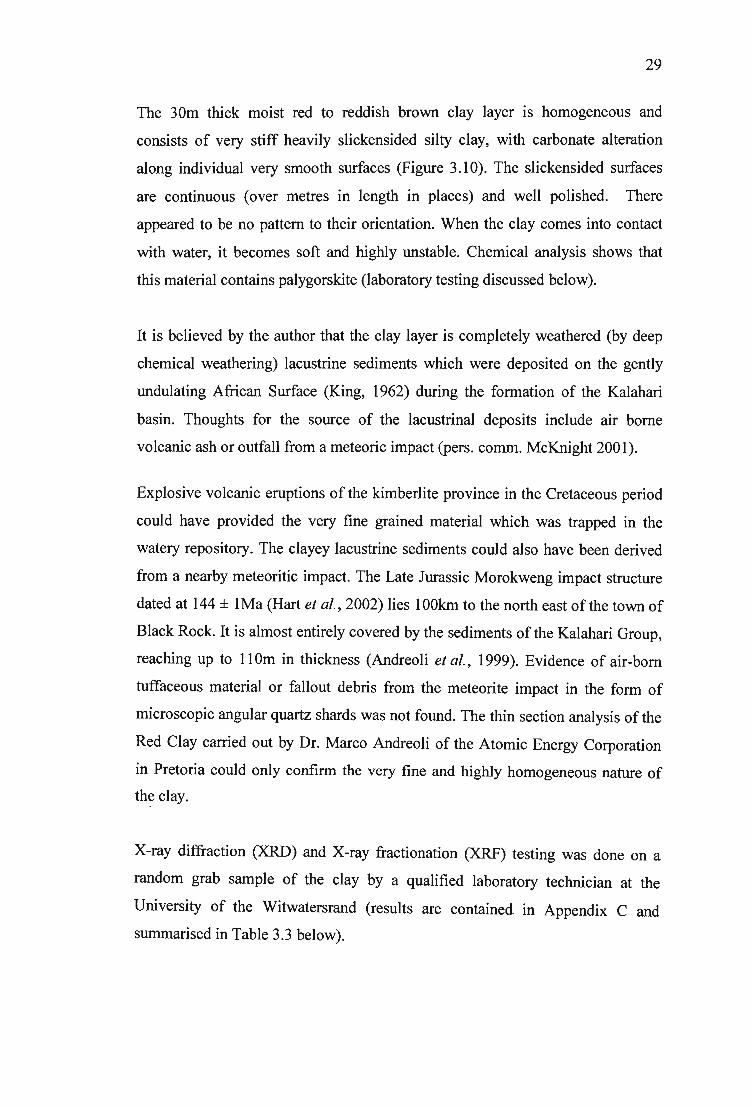
The 30m thick moist red to reddish brown clay layer is homogeneous and
consists of very stiff heavily slickensided silty clay, with carbonate alteration
along individual very smooth surfaces (Figure 3.10). The slickensided surfaces
are continuous (over metres in length in places) and well polished. There
appeared to be no pattern to their orientation. When the clay comes into contact
with water, it becomes soft and highly unstable. Chemical analysis shows that
this material contains palygorskite (laboratory testing discussed below).
It is believed by the author that the clay layer is completely weathered (by deep
chemical weathering) lacustrine sediments which were deposited on the gently
undulating African Surface (King, 1962) during the formation of the Kalahari
basin. Thoughts for the source of the lacustrinal deposits include air borne
volcanic ash or outfall from a meteoric impact (pers. comm. McKnight 2001).
Explosive volcanic eruptions of the kimberlite province in the Cretaceous period
could have provided the very fine grained material which was trapped in the
watery repository. The clayey lacustrine sediments could also have been derived
from a nearby meteoritic impact. The Late Jurassic Morokweng impact structure
dated at 144 ± IMa (Hart et al., 2002) lies 100km to the north east of the town of
Black Rock. It is almost entirely covered by the sediments of the Kalahari Group,
reaching up to 110m in thickness (Andreoli et al., 1999). Evidence of air-born
tuffaceous material or fallout debris from the meteorite impact in the form of
microscopic angular quartz shards was not found. The thin section analysis of the
Red Clay carried out by Dr. Marco Andreoli of the Atomic Energy Corporation
in Pretoria could only confirm the very fine and highly homogeneous nature of
the clay.
X-ray diffraction (XRD) and X-ray fractionation (XRF) testing was done on a
random grab sample of the clay by a qualified laboratory technician at the
University of the Witwatersrand (results are contained in Appendix C and
summarised in Table 3.3 below).

m below surface
65 r 66 r 67
t 68
69
70 1
sw
30
Calc-arenite
NE
Figure 3.9 A sketch map of the exposed face ofNo.3 Decline Shaft at the contact of the Kalahari Group and the Red Clay.
~.
Figure 3.10 A block of Red Clay obtained from the tunnel face shown in Figure 3.9. Note the polished white joint and slickensided surfaces. (Photograph: R. Puchner, December 2001)
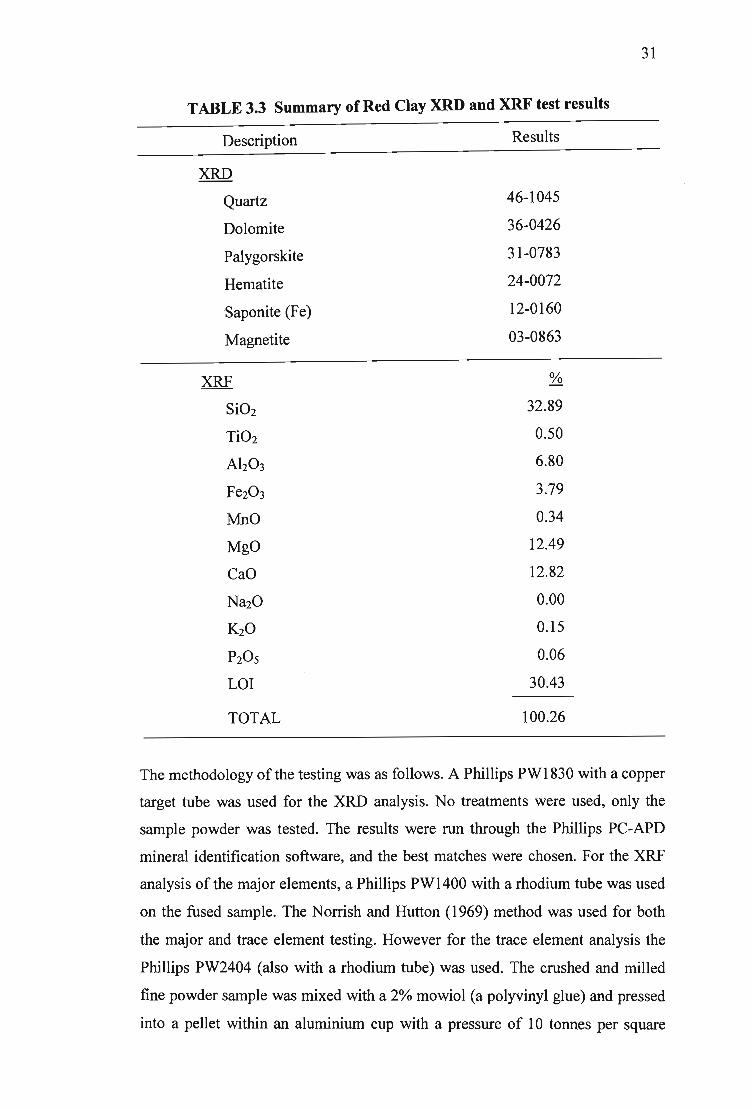
TABLE 3.3 Summary of Red Clay XRD and XRF test results
Description
XRD
Quartz
Dolomite
Palygorskite
Hematite
Saponite (Fe)
Magnetite
XRF
Si02
Ti02
Ah03
Fe203
MnO
MgO
CaO
Na20
K20
P20s
LOI
TOTAL
Results
46-1045
36-0426
31-0783
24-0072
12-0160
03-0863
32.89
0.50
6.80
3.79
0.34
12.49
12.82
0.00
0.15
0.06
30.43
100.26
31
The methodology of the testing was as follows. A Phillips PW1830 with a copper
target tube was used for the XRD analysis. No treatments were used, only the
sample powder was tested. The results were run through the Phillips PC-APD
mineral identification software, and the best matches were chosen. For the XRF
analysis of the major elements, a Phillips PW1400 with a rhodium tube was used
on the fused sample. The Norrish and Hutton (1969) method was used for both
the major and trace element testing. However for the trace element analysis the
Phillips PW2404 (also with a rhodium tube) was used. The crushed and milled
fine powder sample was mixed with a 2% mowiol (a polyvinyl glue) and pressed
into a pellet within an aluminium cup with a pressure of 10 tonnes per square
32
inch. Matrix correlation was done by using the De Jongh model with Super Q
software, which automatically calculates the concentrations.
The results of the XRD testing revealed that the main mineral composition of the
sample was quartz, palygorskite and dolomite. The redness of the Red Clay
suggests the presence of iron-rich minerals. When looked for, the presence of
hematite and magnetite is possible, however their main peaks coincide with that
of the dolomite peaks, and is thus not conclusive. Another possible mineral
containing iron is saponite. This mineral was also not conclusive in the analysis.
The XRF results indicated the presence of high Si02 with CaO, MgO and lesser
amounts of Ah03, Fe203. Since no Na20 was found, the suspected presence of
montmorillonite was abandoned. The presence of palygorskite is confirmed by
the relatively high content MgO.
In light of the high dolomite content of the clay sample it would appear that a
sedimentary lacustrinal deposit, rather than volcanic or meteoritic impact fallout,
is the most likely origin of the Red Clay. Chamley (1989) says "a general
correspondence exists between the mineral composition of most fresh water lakes
and the average clay mineralogy of the rocks and soils in the surrounding
drainage basins". The dolomite content could have been transported by rivers
flowing into the lake from chemically weathered dolomitic areas (Ghaap Plateau
formed by the Campbell Group, Griqualand West Supergroup) to the northeast,
east, southeast and south of Black Rock.
Although palygorskite is a relatively rear mineral, it may occur locally in
abundance in certain lacustrine and peri-marine basins (Chamley, 1989). Several
of the most extensive deposits of lacustrine Mg-smectites are characterized by
thick beds of these clays, often in close association with deposits of the fibrous
clay minerals palygorskite and sepiolite (Veld, 1995). The shallow water
lacustrine occurrences required for the clay's formation are only found in arid to
semi-arid climate settings adjacent to areas of intensive chemical weathering and
subjected to strong evaporation and frequent mixing with supplies of fresh water
(Veld, 1995).

33
Although palygorskite is not strictly a sheet silicate it has chemically absorbed
water, similar to that of smectites, within its needle like structure (Veld, 1995). It
is thus able to swell, and heave. The swelling Red Clay Layer is highly unstable,
with very short stand-up times as observed in the decline tunnel and it exhibits a
potential free swell strain of up to 15% (Warkwick and Speers, 1998). These high
swelling pressures are possible once the clay material is exposed to additional
water. When exposed to air for extended periods of time the clay desiccates and
the stability begins to deteriorate as small slabs fall off the decline face. This was
evident when the material was exposed within the No.3 Decline Shaft tunnel.
Numerous failures in the tunnel roof and from the decline face in the form of
large slumps occurred during excavation.
A clay layer in the vicinity of the Vertical Person's and Vent Shafts has been
previously misinterpreted as being the equivalent of the Red Clay layer. From
these investigations it has been identified as completely weathered andesite.
Where the clay material at the Decline Shaft is a red sedimentary deposit, the
clay at the Vertical Person's and Vent Shafts is in fact pale orange, completely
weathered andesite. The gradational weathering effects of which were clearly
visible in a borehole (BH6) drilled at the Vertical Person's Shaft.
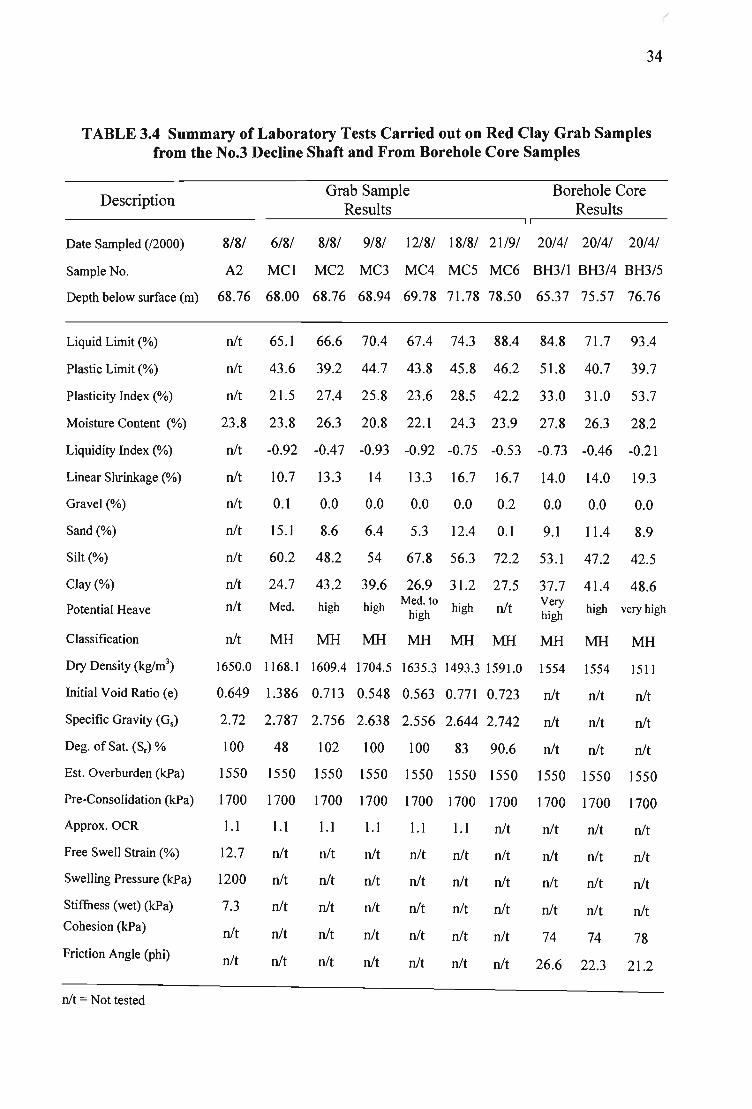
A number of samples of the Red Clay layer were taken from BH3 as core
samples and from the tunnel face as grab samples during the advance of the No.3
Decline Shaft. The laboratory results of both sampling methods has been
summarised in Table 3.4 (The original laboratory results from Soiltech in
Johannesburg are contained within Appendix C). The results of laboratory testing
show that the clay layer is actually a clayey silt (MH) and is potentially highly
active and nearly fully saturated. Prior to any testing done on the clay, it was
suspected that the potential expansiveness of the clay was high. When plotting
the average of the clay percentage versus the plasticity index of all the tested clay
samples, it plotted within the high to very high zones of the Potential
Expansiveness graph of van der Merwe (1964) (Figure 3.11). The clay shows
some grading with depth, where the silt and clay percentage increases and the
sand percentage decreases. The in situ moisture content shows no apparent trend
with depth, and averages 23.6%.
34
TABLE 3.4 Summary of Laboratory Tests Carried out on Red Clay Grab Samples from the No.3 Decline Shaft and From Borehole Core Samples
Description Grab Sample
Results Borehole Core
Results -------------------------------------------------.," --------------
Date Sampled (/2000) 8/8/ 6/8/ 8/8/ 9/8/ 12/8/ 18/8/ 21/9/ 20/4/ 20/4/ 20/4/
Sample No. A2 MCl MC2 MC3 MC4 MC5 MC6 BH311 BH3/4 BH3/5
Depth below surface (m) 68.76 68.00 68.76 68.94 69.78 71.78 78.50 65.37 75.57 76.76
Liquid Limit (%)
Plastic Limit (%)
Plasticity Index (%)
Moisture Content (%)
Liquidity Index (%)
Linear Shrinkage (%)
Gravel (%)
Sand (%)
Silt (%)
Clay (%)
Potential Heave
Classification
Dry Density (kglm3)
Initial Void Ratio (e)
Specific Gravity (Gs)
Deg. of Sat. (Sr) %
nit 65.1 66.6 70.4 67.4 74.3 88.4 84.8 71.7 93.4
nit 43.6 39.2 44.7 43.8 45.8 46.2 51.8 40.7 39.7
nit 21.5 27.4 25.8 23.6 28.5 42.2 33.0 31.0 53.7
23.8 23.8 26.3 20.8 22.1 24.3 23.9 27.8 26.3 28.2
nit -0.92 -0.4 7 -0.93 -0.92 -0.75 -0.53 -0.73 -0.46 -0.21
nit
nit
nit
nit
nit
nit
nit
10.7 13.3 14 13.3 16.7 16.7 14.0 14.0 19.3
0.1 0.0 0.0 0.0 0.0 0.2 0.0 0.0 0.0
15.1 8.6 6.4 5.3 12.4 0.1 9.1 11.4 8.9
60.2 48.2 54 67.8 56.3 72.2 53 .1 47.2 42.5
24.7 43.2 39.6
Med. high high
26.9 31.2 Med. to high
high
27.5
nit
37.7 Very high
41.4 48.6
high very high
MHMHMHMHMHMHMHMHMH
1650.0 1168.1 1609.4 1704.5 1635.3 1493.3 1591.0 1554 1554 1511
0.649 1.386 0.713 0.548 0.563 0.771 0.723 nit nit nit
2.72 2.787 2.756 2.638 2.556 2.644 2.742 nit
100 48 102 lOO 100 83 90.6 nit
nit
nit
nit
nit
Est. Overburden (kPa) 1550 1550 1550 1550 1550 1550 1550 1550 1550 1550
Pre-Consolidation (kPa) 1700 1700 1700 1700 1700 1700 1700 1700 1700 1700
Approx. OCR
Free Swell Strain (%)
Swelling Pressure (kPa)
Stiffness (wet) (kPa)
Cohesion (kPa)
Friction Angle (phi)
nit = Not tested
1.1 1.1
12.7 nit
1200 nit
7.3 nit
nit nit
nit nit
1.1
nit
nit
nit
nit
nit
1.1
nit
nit
nit
nit
nit
1.1 1.1 nit nit nit nit
nit nit nit nit nit nit
nit nit nit nit nit nit
nit nit nit nit nit nit
nit nit nit 74 74 78
nit nit nit 26.6 22.3 21.2

35
2 1 60
i 1
! 1
Q) 50 a. E «J
40 en «J ..... 0 ..... 30
, , , ------------ -------- - -~ ------ - ----------------t----------- -------------+-------------------------, , ,
: i VERY H"GH ------------ -------- -- -------- -------------- -------------------------i-------------------------
0.5
-0
0.. 20 :> ·s 0-
10 w
O~~----_+--------+_------_+------~
o 20 40 60 80
Clay Percentage
Figure 3.11 Potential expansiveness graph of average clay percentage vs. average plasticity index of the tested Red Clay samples (after van der Merwe, 1964)
The liquid limit of the grab samples increases with depth, ranging from 65.1 to
88.4%. The plasticity index and linear shrinkage also increases with depth
ranging from 21.5 to 28.5% and 10.7 toI6.7% respectively. All samples tested
provided an average dry density of 1545kglm3 and a specific gravity of2.7.
During borehole drilling the clay reacted quickly with the drilling fluid (water
and 'Ezee-mix') and broke down rapidly to a highly plastic silty clay. This
reaction with water was also noticed during the excavation of the No.3 Decline
Shaft. The core samples obtained from BH3 (prior to the decline shaft's
excavation) were thus not of in situ moisture content. Although larger intact core
samples less influenced by the drilling fluid were selected, the moisture content
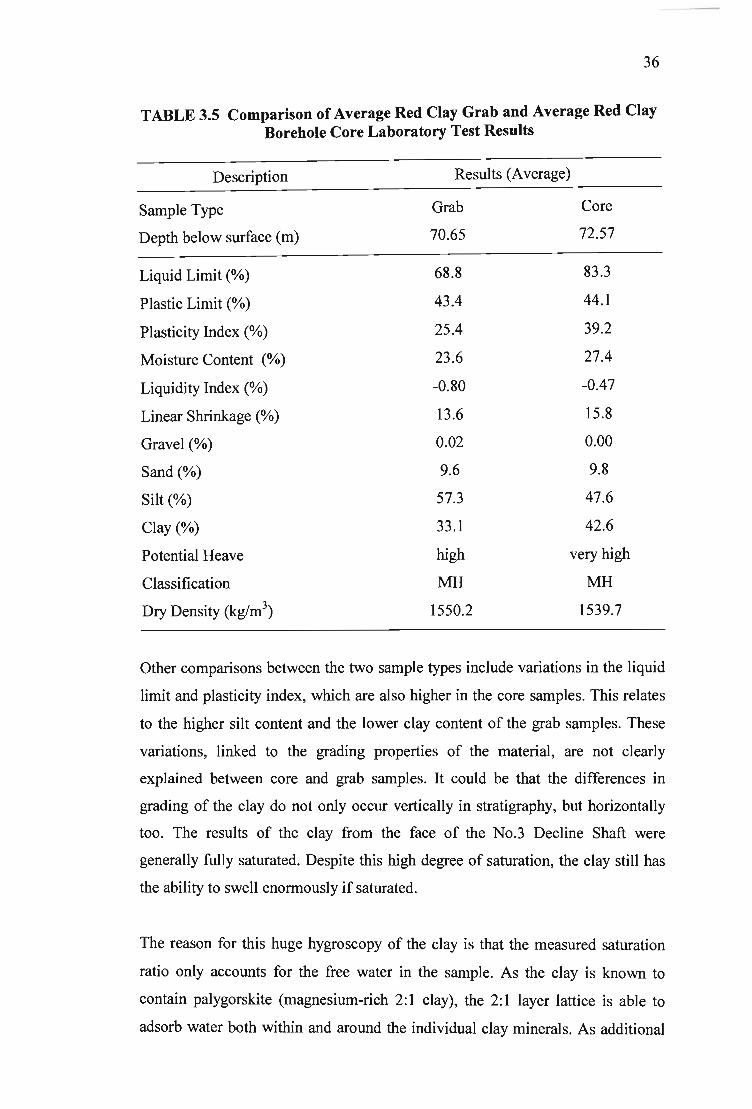
was still affected. This is apparent in Table 3.5, which compares the average
laboratory results of the core samples with the average laboratory results of the
grab samples. It can be seen that the moisture content is slightly higher in the
core samples.
36
TABLE 3.5 Comparison of Average Red Clay Grab and Average Red Clay Borehole Core Laboratory Test Results
Description Results (Average)
Sample Type Grab Core
Depth below surface (m) 70.65 72.57
Liquid Limit (%) 68.8 83.3
Plastic Limit (%) 43.4 44.1
Plasticity Index (%) 25.4 39.2
Moisture Content (%) 23.6 27.4
Liquidity Index (%) -0.80 -0.47
Linear Shrinkage (%) 13.6 15.8
Gravel (%) 0.02 0.00
Sand (%) 9.6 9.8
Silt (%) 57.3 47.6
Clay (%) 33.1 42.6
Potential Heave high very high
Classification MH MH
Dry Density (kg/m3) 1550.2 1539.7
Other comparisons between the two sample types include variations in the liquid
limit and plasticity index, which are also higher in the core samples. This relates
to the higher silt content and the lower clay content of the grab samples. These
variations, linked to the grading properties of the material, are not clearly
explained between core and grab samples. It could be that the differences in
grading of the clay do not only occur vertically in stratigraphy, but horizontally
too. The results of the clay from the face of the No.3 Decline Shaft were
generally fully saturated. Despite this high degree of saturation, the clay still has
the ability to swell enormously if saturated.
The reason for this huge hygroscopy of the clay is that the measured saturation
ratio only accounts for the free water in the sample. As the clay is known to
contain palygorskite (magnesium-rich 2: 1 clay), the 2: 1 layer lattice is able to
adsorb water both within and around the individual clay minerals. As additional
37
water is absorbed into the clay minerals, swelling occurs. Upon full saturation,
the swelling pressure that can be exerted will be in the order of 1200kPa. The
calculated swell percentage is 3 to 4%. The amount of heave will be proportional
to the thickness of clay wet up below the floor panels. Thus it was deemed
imperative that water be kept away from the red clay exposed within the No.3
Decline Shaft. This was however not always possible.
The calculated free swell strains of the clay range from 3 to 15% (Warkwick and
Speers, 1998) and the Atterberg limits clearly reflect this property. The clay
material is over-consolidated (U<O) with a high to very high linear shrinkage.
Due to poor quality samples being recovered from the borehole core, no further
free swell tests were carried out. The shear strength parameters are for remoulded
saturated samples and show an unusually high friction angle. For design
purposes, it was recommended that safe values of C = 75kPa and ~ = 0 degrees
be utilized.
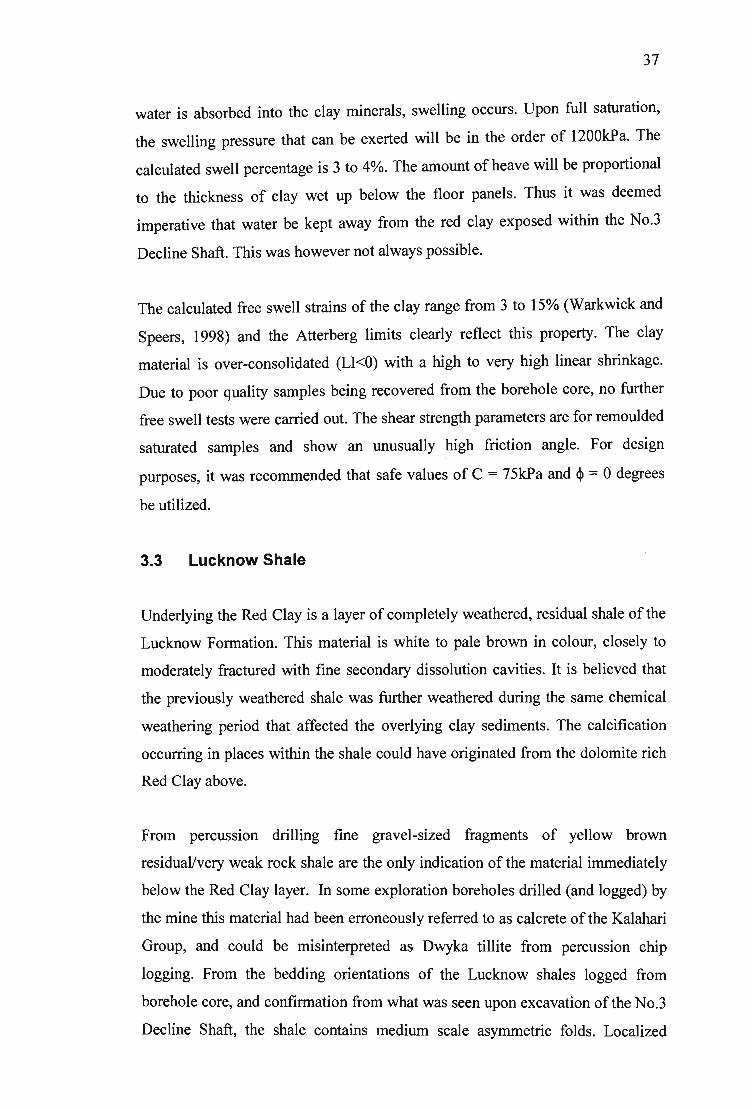
3.3 Lucknow Shale
Underlying the Red Clay is a layer of completely weathered, residual shale of the
Lucknow Formation. This material is white to pale brown in colour, closely to
moderately fractured with fine secondary dissolution cavities. It is believed that
the previously weathered shale was further weathered during the same chemical
weathering period that affected the overlying clay sediments. The calcification
occurring in places within the shale could have originated from the dolomite rich
Red Clay above.
From percussion drilling fine gravel-sized fragments of yellow brown
residuaVvery weak rock shale are the only indication of the material immediately
below the Red Clay layer. In some exploration boreholes drilled (and logged) by
the mine this material had been erroneously referred to as calcrete of the Kalahari
Group, and could be misinterpreted as Dwyka tillite from percussion chip
logging. From the bedding orientations of the Lucknow shales logged from
borehole core, and confirmation from what was seen upon excavation of the No.3
Decline Shaft, the shale contains medium scale asymmetric folds. Localized
38
chevron type folding may be more apparent adjacent to the main dislocations.
The shale layers within the sequence acted as a high strain zone during major
tectonic events.
The limit of the weathering and appearance of unweathered shale is highly
variable, but is not expected to be shallower than 120m below ground level. The
variable depth of weathering appears to be controlled primarily by the major
faulting identified from borehole correlations (Figure 3.1).
3.4 Ongeluk Andesite
The Cenozoic stratigraphy at the Vertical Person' s Shaft is similar to that which
occurs at the No.3 Decline Shaft, but differs in that there is no Red Clay layer.
Andesites of the Ongeluk Group occur immediately below the Kalahari Group
here.
The borehole drilled adjacent to the Vertical Person's Shaft intersected pale
orange to dark orange brown, completely weathered andesite from 68m to 91.5m.
This material has been deeply weathered below the African Erosion Surface to
form slightly to moderately plastic, clayey and fine sandy silt, with relict fine
calcite veining and fractures. This material ranges from very stiff residual soil to
weak rock. Below 91.5m, the less weathered andesite becomes green in colour
and tends to medium strong rock.
3.5 Structural Geology
As discussed previously and confirmed by boreholes drilled in the Black Rock
area, the bedrock layers below the Kalahari Group sediments are intensely thrust
and faulted (Figure 3.1). It is not the intention of this investigation to describe the
engineering geological nature of the pre-Cenozoic bedrock layers or the tectonics
involved in their deformation. However the following important points can be
noted.
39
From the analysis of old mine exploration boreholes and current geotechnical
boreholes, a single plane interpretation of the local structural geology (along the
No.3 Decline Shaft centreline) has been produced (Figure 3.1). The major
structural feature identified in this area, the near horizontal sole thrust fault or
Kheis Thrust, is indeed present to the west (confirmed by the mine). During this
event the basal Ongeluk andesites were thrust over the manganiferous Hotazel
Member and Mapedi Formation. Evidence for this thrust feature was seen during
the sinking of the Vertical Person's Shaft. Brecciated andesite occurred at the
contact with the shale of the Mapedi Formation. This porous brecciated contact
zone also serves as an effective conduit for ground water, which provided
difficulties during the sinking of the shaft below this point.
Eastwards at the toe of this feature are a series of fault-bound wedges, creating a
large graben-type feature. The steep faults continue to the east creating large
stepped blocks, giving the impression of strata dipping to the west. These near
vertical structures would have played a large role in controlling the infiltration
and migration of ground water, and as a result weathering patterns will display
some degree of correlation to the spatial distribution of these major fractures. The
basal weathering front is quite variable over short distances as weathering has
shown to penetrate deeper along these zones of major fracturing.
A cavity was intersected in BH8 and could probably be a result of large tension
gashes that are present close to fault zones. It is also possible that such cavities
have developed as a result of wash-out of residual soil during the intense
weathering event.
3.6 Geohydrology
Groundwater also plays an important role in rock mass stability. Water on joints
decreases the rock mass strength considerably, and thus plays an important role
when excavating through it. The Kalahari region has low rainfall and high rates
of evapotranspiration, with a general lack of surface water. According to
Verhagen (1985) the ground water of the Gordonia region occurs mainly in the
pre-Kalahari rocks. In places where the Kalahari Group is thicker, the rest levels

40
may be shallower (typically along the banks of the Kuruman River to the north),
and the groundwater may occur within the Kalahari sediments. Borehole yields
in the area are generally poor (a few m3 per hour), but are higher and of better
water quality along the Kuruman River bed (Verhagen, 1985). Rest levels range
from a few tens of metres to over lOOm below surface.
It was found by Verhagen (1985) that for the Gordonia regIOn direct ram
recharge does occur to groundwater (usually very slow) away from the river beds
and bedrock outcrops. It was also found that at least part of the salination of the
ground waters occurs during such recharge. This salinity, he states, may be
derived from incompletely leached evaporite horizons in closed surface basins
such as pans and from salt loads which have built up in the unsaturated zones
during periods of low rainfall. To establish if the groundwater was possibly
present in the Kalahari Group piezometers were installed in some of the
boreholes drilled along the No.3 Decline Shaft.
3.6.1 Piezometric Observations
Prior to the geotechnical drilling along the No.3 Decline Shaft centreline,
it was anticipated that there would be a potentially strong perched water
table above the Red Clay. However during the drilling of percussion
boreholes drilled along the centrelim~, there was no evidence of water. An
experienced exploration drilling company of the area (Booysen Bore)
indicated that, the majority of the percussion boreholes drilled above the
clay layer on this mine property were dry. Most water boreholes in this
area are drilled to below the Red Clay and drilled well within the
underlying shale.
The absence of the predicted water above the Red Clay layer may be due
to the fact that the clay layer has a very high water absorption capacity.
Rain water that infiltrates through the Kalahari Group is rapidly soaked
up by the clay layer. The clay is known to have a saturation ratio of
greater than 98%. Only in exceptionally wet periods may the clay
become totally saturated and allow a perched water table to form above.

41
Some water may be held in localized conglomerate lenses (calcified at
their base) just above the clay layer, thereby forming a perched water
table. Another important factor of the climate of the area is that water
evaporates at a greater rate than the recharging rain fall (Meyer et al.,
1985), and thus rain water is not able to efficiently infiltrate and recharge
the Kalahari Group.
Standard piezometers were installed in two boreholes (BR3 and BR5)
near the new decline box-cut. After the installation of the piezometers the
water levels dropped significantly (dispersion of drilling water) and
reached apparent rest levels. The levels were not the same between the
two boreholes, but were still dropping very slowly. It is thus believed that
these levels have resulted from a decreased permeability with depth
within in the boreholes and that the residual water had not fully drained
away. No conclusive water table was found above the clay layer from the
piezometers.
During the excavation of the decline shaft some water ingress was noted.
Initially believed to have been the drilling water of the geotechnical
holes, the persistent ingress suggested that there may indeed be small
localized aquifers above the clay layer, possibly within deeply scoured
Kalahari Group basal conglomerate channels. From observations made
during the advance of the No.3 Decline Shaft, the following has been
noted:
From about 299 m along the decline (59.6m below surface), the first signs
of groundwater were seen. At the time ingress of water consisted of a
trickle from a coverhole drilled ahead of the decline face. At 303m
(60Am below surface), the lower 1.5 m of the face was wet in patches.
No signs of strong infiltration were seen on the face. Overall, the water
. seepage was minimal, not adding much to the already present water from
charge hole drilling, which was ponding at the base of the tunnel. Once
the water was encountered in the tunnel, the water level in piezometer
BR3 begun to drop steadily. The seepage from chainage 303m continued
42
and attempts to seal the area off failed. This water initially caused some
problems on the footwall below the concrete floor panels but steps were
taken by the mining contractor to properly drain this excess water into a
sump and pump it out. Three months later the inflow rate dropped. The
piezometer in BH3 also showed that the water level dropped significantly
since the passing of the tunnel excavation.
Once within the Red Clay layer water seepage had almost ceased on the
face, with minor drips originating from the crown area of the decline
shaft. The Lucknow shales were wet, but only showing signs of slight
water ingress at fault zones. Overall the rock mass stability did not appear
to be adversely affected by the slight ingress of water.
At the position of the Vertical Person's Shaft more water was anticipated.
A piezometer installed in the adjacent borehole (BH6) revealed a constant
water level at 37m below surface. This initial level was suspected to
correspond to either drilling water that remained in the borehole since
flushing and had not drained away fully, or a perched water table could
have been present within the Kalahari Group calc-arenite. Without any
further investigatory work requested, the potential aquifer parameters
could not be established. Only once the Vertical Person's shaft progressed
beyond 37m did it become apparent that large volumes of water were
present within the Kalahari Group basal conglomerates. Later, when the
new Vent Shaft nearby was due for construction, a pumpout test was
carried out.
3.6.2 Pumpout Testing
A single rotary percussion drilled borehole (PVI) was completed down to
a depth of 150m for the purposes of aquifer determination at the position
of the new Vent Shaft. The hole was permanently cased with slotted steel
casing. Chip samples were acquired and logged for each metre drilled.
The geological profile for the borehole is presented in Appendix B. The
chips obtained from this borehole showed a good correlation to the
43
stratigraphy obtained from the rotary cored hole (BH6) drilled at the
Vertical Person's Shaft some 200m to the north west of the Ventilation
Shaft. Upon the completion of the drilling, a well of PVC slotted screen
casing with surrounding gravel pack was installed. The initial water strike
occurred at 60m and the standing water level was recorded at 45m four
days later.
A step test, constant discharge test, and constant discharge recovery test
were conducted to establish the aquifer parameters and to calculate the
potential quantity of groundwater inflow. Step testing, which provides the
drawdown response in the borehole for different pumping rates, allows
for the identification of the correct pumping rate to be used for the
constant discharge test. It also provides an indication of the maximum
safe borehole yield. The constant discharge test indicates the long-term
drawdown response of the borehole and allows for the determination of
the extent of the aquifer. This was conducted at a discharge rate of 0.83
litres/second for 6 hours with the pump at a depth of 66m. The constant
discharge recovery test provides an indication of how quickly the
groundwater level recovers after prolonged pumping.
The aquifer was identified as the basal conglomerate bed of the Kalahari
Group, between 60 and 68m depth. The average hydraulic conductivity
for the aquifer, was calculated as 0.42m1day. The coefficient of
permeability (k) is therefore 4.8 x 10⁻⁶ mlsec. By application of Darcy's
Law, the estimated groundwater inflow into the shaft would be 32m3 per
day or 0.37 litres/second, assuming a shaft diameter of 3m (and thus
exposed aquifer area of approximately 75 m2). The potential for high
groundwater inflow into the Ventilation Shaft is expected to be low.
As mentioned above, during the percussion hole drilling, the first (and
only) water strike occurred at 60m below surface. This confirms the
suspicion that the Kalahari Group basal conglomerate forms an aquifer,
with it being restricted to this unit. The fact that four days later, the
standing water level was recorded to be at 45m indicates that there is a

44
piezometric head of approximately I5m at the position of Vent Shaft. As
the water within the aquifer is under a head of approximately I5m, the
expected water pressure within is around 150kPa. The pressure gradient
developed upon excavation is likely to cause a collapse of the aquifer
material as ingress of water into the excavation takes place.
It is thought that this head of water within the aquifer is possibly from
recharge of water to the basal conglomerate at the prominent outcrop
surface feature of the Black Rock hill. The basal conglomerate (although
not proven) would terminate against this prominent surface feature.
Rainwater, which runs off from the hill, would infiltrate into the
conglomerate thereby directly recharging the aquifer.
3.6 Weathering
From the logging of the rotary cored boreholes drilled during this investigation,
the total depth of weathering was found to range from 130 to 150m below
surface. This range in weathering within the older shale bedrock was dependant
on the degree of fracturing. Given that the base of the Red Clay is at 90m below
current ground level, the original weathering front within the shales (below the
African Erosion Surface) was approximately 50m. Such deep chemical
weathering would have occurred during the humid Late Cretaceous and prior to
the epeirogenic uplift along the Transvaal-Griqualand axis.
The lacustrine sediments of the Red Clay then accumulated on the ancient
African Erosion Surface. This unit, which may not have fully lithified, was then
subsequently weathered with further deterioration of the underlying shales
having occurred. The Kalahari sediments then buried the ancient weathered
regolith that formed on the Late Cretaceous land surface. Carbonate cement of
the Kalahari beds was possibly still derived from chemical weathering of
dolomite from the Campbell Group to the south and south-east and transported
northwards as dissolved salts by rivers and streams. Locally the calcium may
have been derived from the weathering of the Ongeluk lavas. It is evident that
isolated pockets of weak rock have been calcified below the clay layer since the
45
deposition of the Kalahari sediments. Such zones of pedogenesis are probably
related to the permeable near-vertical fault zones present in the area (Figure 3.1).
The unweathered stratigraphy of the Lucknow Formation consists of layered
massive grey shale with intermittent bands of banded carbonaceous shale and
weakly silicified greenish-grey shale. Upon weathering the original colour
becomes dusky red to maroon, grading with depth into yellow and pale brown
rock. The rock strength appears to increase in quality with depth as weathering
effects decrease. Weathering patterns are complex and vary considerably over a
short distance.
The completely weathered Ongeluk Andesite at the Vertical Person's Shaft has
been deeply weathered below the African Erosion Surface. Weathering effects
slowly decrease with depth, creating a range in consistency from very stiff
residual soil to weak rock, and finally to unweathered, medium strong, rock
below 91.5m.
From the mine borehole logs it was noted that remnants of tillite and shale
belonging to the Karoo Supergroup may be present just below the clay layer. The
Karoo sedimentary rocks would have been preserved as erosional remnants in
keels of glacial valleys below the early Tertiary African Erosion Surface. The
anticipated palaeo-Karoo valley was however not present on the decline
centreline. It is likely that some misidentification occurred due to the inherent
difficulty in accurately logging chip and dust samples.

46
4 ROCK PROPERTIES AND EXCAVATION
4.1 Box Cut Excavation
The excavation of the No. 3 Decline Shaft box-cut, was entirely within the sandy
Gordonia Formation. The soft tunnelling section was to begin at a maximum
depth of l8.5m below surface. Figure 3.6 shows the original box cut excavation.
The geotechnical investigation for the box cut included rotary percussion holes
and Dynamic Probe Super Heavy (DPSH) penetration tests. A total of three
rotary percussion boreholes (PDl, PD2 and PD3) were drilled along the
centreline of the decline to a maximum depth of 35m. Percussion chips/sand
were sampled and logged and the penetration rate was recorded. In addition,
sixteen DPSH penetration tests were carried out on either side of the decline
centreline (results shown in Table A2 a-p, Appendix A). Table 4.1 below
provides a summary of the DPSH results. Laboratory testing was carried out at
Soiltech in Johannesburg to determine grading, Atterberg limits, cohesion,
friction angle and natural moisture content of the profile (discussed in
Chapter 3.1)
From the investigation it was found that the Gordonia Formation could be
subdivided into two distinct zones of weakly coarsening upward sand. Clay
content trends were shown to increase gradually with depth. This could be due to
the fines either infiltrating down with rainwater, or having been blown away
during earlier deposition. The upper unit is reddened (or oxidised) to about 6.0m
depth and is generally medium dense to 6.0m to lO.Om. At the base of this unit is
a silty fine sand horizon. This zone was found to be moist.
The lower zone is pale orange yellow in colour becoming orange near the base
with a basal lag. The consistency is dense to very dense with a potentially
collapsible grain structure. Towards the basal contact the sand becomes drier
with a higher clay content (5% to 6%). At the base the material may well be
slightly looser and more friable.
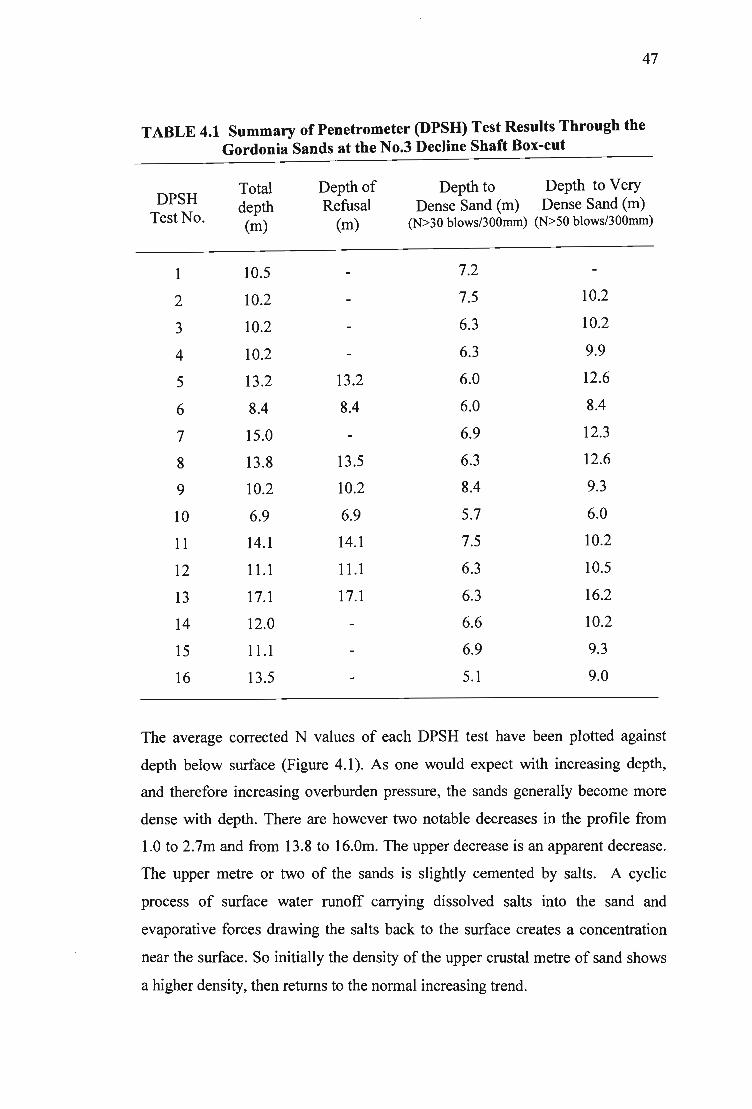
47
TABLE 4.1 Summary ofPenetrometer (DPSH) Test Results Through the Gordonia Sands at the No.3 Decline Shaft Box-cut
DPSH Total Depth of Depth to Depth to Very depth Refusal Dense Sand (m) Dense Sand (m)
Test No. (m) (m) (N) 30 blows/300mm) (N) 50 blows/300mm)
1 10.5 7.2
2 10.2 7.5 10.2
3 10.2 6.3 10.2
4 10.2 6.3 9.9
5 13.2 13.2 6.0 12.6
6 8.4 8.4 6.0 8.4
7 15.0 6.9 12.3
8 13.8 13.5 6.3 12.6
9 10.2 10.2 8.4 9.3
10 6.9 6.9 5.7 6.0
11 14.1 14.1 7.5 10.2
12 11.1 11.1 6.3 10.5
13 17.1 17.1 6.3 16.2
14 12.0 6.6 10.2
15 11.1 6.9 9.3
16 13.5 5.1 9.0
The average corrected N values of each DPSH test have been plotted against
depth below surface (Figure 4.1). As one would expect with increasing depth,
and therefore increasing overburden pressure, the sands generally become more
dense with depth. There are however two notable decreases in the profile from
1.0 to 2.7m and from 13.8 to 16.0m. The upper decrease is an apparent decrease.
The upper metre or two of the sands is slightly cemented by salts. A cyclic
process of surface water runoff carrying dissolved salts into the sand and
evaporative forces drawing the salts back to the surface creates a concentration
near the surface. So initially the density of the upper crustal metre of sand shows
a higher density, then returns to the normal increasing trend.

48
The lower decrease from 13.8 to 16.0m appears to correlate with a dramatic
relative decrease in moisture content from 5.7 to 3.2% (see Table 3.1). Although
the curve of the graph increases again beyond 16m, and the moisture content
remains low, the clay content of the sands increases. These changes in moisture
content and grading properties will all affect the penetration of the DPSH cone
through the material, providing the curve seen in Figure 4.1.
Determination of phi (<1>') from DPSH testing (Tables A2 a-p, Appendix A)
showed that to approximately 8.0m depth, the value increases steadily from
30° to 35° (Figure 4.2). Below 8.0m a wide scatter of results ranged from
33° to 45°. Results of the remoulded shear box tests produced lower values of
30° to 31 ° due to permanent destruction of the interlocking nature of the sand
particles during drilling. The original design slope angle, as specified on the
construction drawing of the box cut, was 37.5°. However the test results
(Table 3.1) indicated that the batter should be revised.
Two changes were recommended according to two main zones. From 0 to 8m
below surface the revised batter was 30° (estimated factor of safety 1.0 to 1.1),
and from 8.0 to 18.5m given as 35° (estimated factor of safety 1.0 to 1.5). For the
subgrade of the proposed decline, it was recommended that the upper 8.0m be
recompacted prior to placement of a matrix fill below the precast floor slabs.
Matrix fill was used over the entire length of the box cut and within the calcrete
and calcified sand. At the maximum depth of the box cut excavation, the head
wall face was locally steepened to present a workable face for soft tunnelling to
commence. The risk of such a steepened slope within the Gordonia sands
collapsing was feared and reported. Shortly afterwards the face collapsed. The
box cut design was re-evaluated and enlarged to facilitate deeper access to the
calcrete below before any tunnelling was to commence directly into the calcrete.
No water was encountered during excavation, but adequate drainage measures
were taken around the excavation to prevent ingress of storm water. Saturation
of the soil profile could have lead to collapse settlement of the precast floor slabs.

0
2
4
6
I 8 or. a. Q) Cl 10
12
14
16
18 0 10 20 30 40 50 60 70
Average Corrected N Value
Figure 4.1 Graph of the average corrected N value of all DPSH tests carried out through the Gordonia Formation sands with depth.
o
2
4
6
:§ 8 or. -c ~ '0
12
14
'8
13 25 'l1 2:}
....... • .. ........ • • • .... • H ... • .. ....... • •• . . _. ._ ... ........ . ...... .. -. • ... ... • • ::.::' • • ._. • _ ... • • • •••••• • __ I
• . .... ... • ••••••• .. -... • •• • • · _. •• • • .. _ ... • ....... •• • • ••• H •• • • • •• ..... • ·i • .-·. i .. ,. • ••••• • • • •• • ••• • • .. .. HH •• • •• • • .••..• J.": . ~ • .. • • ... ..... ... • • • HI • • • H • • H • •• .. H • • • • • • • • •• • H • • HI • • • • • • • • • • • • • . . • • • • .. • •• • •
31 33 J) '§ ~
Friction Angle (phi)
•
• • • •
•• • • • • • • •
• •
41 43 45
Figure 4.2 The relationship between phi (friction angle) and depth below surface throughout the profile of the Gordonia Formation.
+>\0
50
4.2 Shaft Excavation - Rock Strength
Previously there was very little knowledge of the engineering geological nature
of the partly lithified caicretes, sandstones and conglomerates that comprise the
Kalahari Group. From geotechnical borehole drilling ahead of the new decline
shaft it was evident that tunnelling conditions would be poor within the upper
weathered zone. As such the need for high quality permanent tunnel support was
required. In order to establish a basis for understanding the rock mass
characteristics of the weathered ground ahead of the No.3 Decline Shaft a
number of parameters were recorded from the logging of the borehole core and
used to quantify the rock mass characteristics.
One such parameter is the rock strength, which is important when considering
excavations within a rock mass. The qualitative descriptions given while logging
borehole core provide a relative scale of changes in rock strength with depth.
More accurate descriptions of the rock strength are done by quantitative methods
such as point load index testing, which can be done in the field, and ues testing
done in the laboratory. The following sections describe these testing methods as
carried out in this study.
4.2.1 Unconfined Compressive Strength (UCS) Testing
For ues testing carried out on cylindrical rock core samples, the
sample preferably has a height:diameter ratio of 2:1. A total of 32
unconfined compressive strength (UeS) tests were carried out on core
samples obtained from the borehole drilling ahead of the No.3 Decline
Shaft. These samples were tested in a commercial laboratory. Due to
cost constraints only samples from BH2 and BH3 were tested. Although
the few samples tested does not provide a detailed rock strength profile
of the lithology intersected by the boreholes, the ues testing is
primarily used to confirm the point load index test results and the
conversion thereof to inferred or calculated ues values (described in
4.2.2).
51
Due to the broken nature of the core from shale below the Red Clay
layer, no reasonable lengths of core samples could be selected and it
was only possible to carry out field point load index testing on a few
sections. Also worth noting is that strata orientation has a notable
influence on the measured UCS (Hawkins, 1998). All the UCS results
(actual UCS) and PLI test results are shown in Tables A3 a-h,
Appendix A.
4.2.2 Point Load Index (PLI) Testing
The PLI testing equipment was developed when strength became a
normal part of rock core descriptions. Although quite rudimentary, this
testing method provides a rough guide to the intact compressive
strength of the material. Due to its ease of use and low cost, it has
increasingly become the only test undertaken to provide rock strength.
Although the PLI test results are not easily correlatable with laboratory
UCS values, it is important to consider both forms of testing when
evaluating the rock strength profiles of the core drilled.
A number of PLI tests were carried out on core samples obtained from
the highly variable degrees of calcified Kalahari Group sediments, and
a few on the Lucknow shale immediately below the Red Clay layer.
The testing procedure entails a core sample placed between two
spherically truncated conical platens. The one hydraulically driven
platen steadily compresses the core sample against the other fixed
platen until the sample fails (all the PLI and UCS tests in this study
were carried out as diametral tests). For both tests (PLI and UCS)
sample failures which occurred along discontinuities were rejected, as
this does not provide an accurate indication of the intact rock strength.
The gauge reading (in Newtons) is recorded, but needs to be converted
to a value comparable to the UCS values measured in MPa. The
inferred UCS results from the PLI testing is then calculated as Is values
(MP a) using the formulae (ISRM, 1981):
where P = corrected test load (Newtons)
D = core diameter (mm)
52
The Is value (in MPa) is then corrected to the equivalent value for
50mm core by the following factor:
F = (Dact/50)0.45 where Dact = actual core diameter .
Then Is(50) = Is x F (MPa)
This factor (F) is usually derived from the inverse of the gradient of the
trend line plotted on a graph of PLI results (1S(50») versus actual DeS from laboratory testing carried out on the same rock material. A linear
trend should become evident from the plotted graph.
Due to the highly variable degree of calcification with depth, and the
compounded effect of differential weathering between calcified lenses
and silcrete mottles, it was often not possible to select a sample for Des testing immediately adjacent to a PLI test. Hence the data plotted on the
graph of Figure 4.3 shows a large degree of scatter.
The trend line which was plotted on the graph has a gradient of 0.0782
and when inversed gives a factor of 12.8. This factor, which includes
the full range of varying rock strength grades present in the Kalahari
Group rocks, provides a somewhat conservative factor when applied to
the stronger zones. For this study the updated recommended conversion
factors of Hawkins (1998) was considered. For dry sedimentary rocks,
the conversion factors to Des are as follows:
IS(50) - MPa
<2
2-5
>5
Conversion (actor to UCS
15
20
25
53
Most workers would only apply a standard conversion factor of 24 for
all strength categories, however all factors were applied accordingly in
this study. All the PLI test results and calculated ues values are shown
in Tables A3 a-h, Appendix A. For description purposes the strength
categories of the International Society of Rock Mechanics (lSRM,
1981) were adopted (page 25).
Although the inferred ues values of the PLI testing may not be
accurate in this study due to the high variability in rock strength, the
usefulness (and cost effectiveness) of PLI testing down a borehole
profile becomes evident when looking at a graph showing the change in
inferred ues values with depth (Figure 4.3). Due to the increased
number of tests that are carried out per borehole, the graph shows a
higher resolution of the rapidly changing rock strengths with depth. For
comparative purposes the few laboratory ues results were then plotted
against depth and compared to the now converted PLI results, or
inferred ues results, for boreholes BH2 and BH3 (Figure 4.3). The few
ues tests carried out do not clearly show this variation with depth.
When comparing two graphs of laboratory ues results with that of the
inferred ues results from the field PLI tests, it becomes evident that
they do not correlate directly with any accuracy in this study. Once
again this is attributed to the highly variable change in rock strength
with depth and the inability of sourcing two samples of similar rock
strength.
The graphs in Figure 4.4 show the change in rock strength with depth
from all the PLI tests carried out on the Kalahari Group core samples
obtained from the boreholes drilled along the Decline Shaft (BH2 -
BH5), including at the Vertical Person's Shaft (BH6). Again, the higher
resolution of the PLI testing highlights the lateral zones of stronger and
weaker rock. The well-cemented calc-arenites intersected above the
Red elay layer at the No.3 Decline Shaft show a distinct strong to very
strong rock zone from 30 to 40m vertical depth.
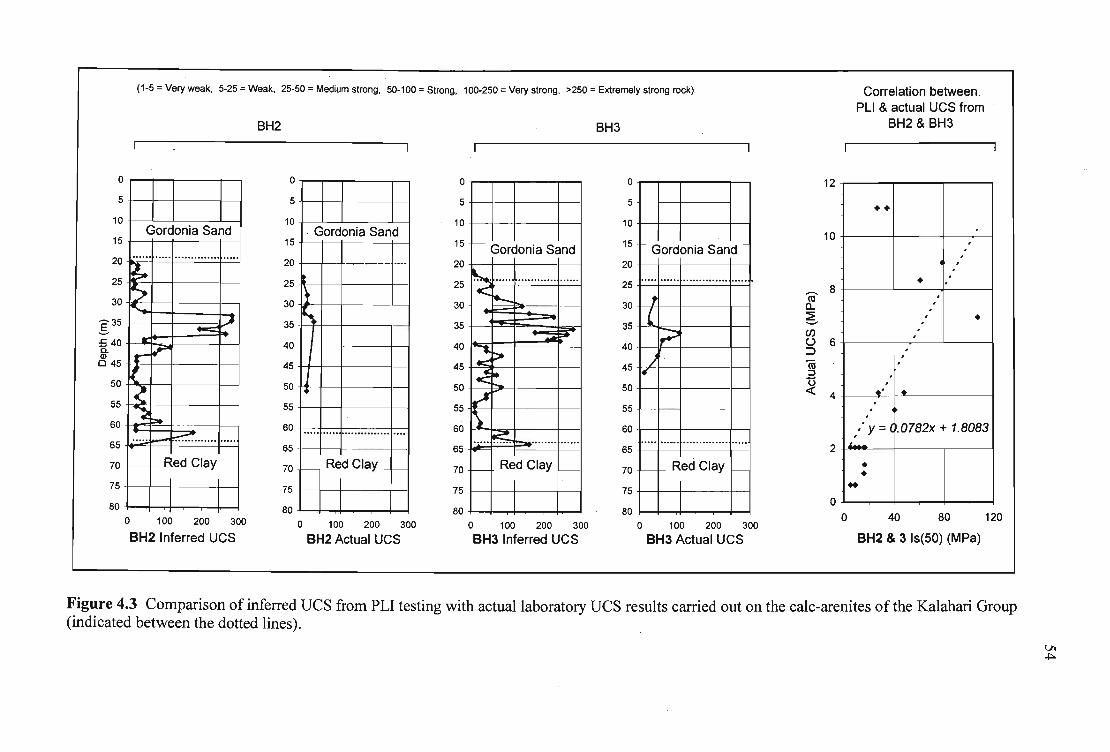
o
5
10
15
20
25
30
~35 .s :5 40 a. Q)
045
50
55
60
65
70
75
80
(1-5 = Very weak, 5-25 = Weak, 25-50 = Medium strong, 50-100 = Strong, 100-250 = Very strong, >250 = Extremely strong rock)
Gordonia Sand
...... ..... .............. .....
~ ~ .....
~ ~ ..
--= Lt: jr"
~. ~ ~ ~ ";';':' ~ ~ ... .. .. .....
~ _ Red Clay _
~ .1
1 o 100 200 300
BH2 Inferred UCS
BH2
o
5
10
15
20
25
30
35
40
45
50
55
60
65
70
75
80
. Gordonia Sand
t . .
....
14
~ ... .. ............... . ...
r--- Red Clay _ r--I
o 100 200 300
BH2 Actual UCS
o
5
10
15
20
25
30
35
40
45
50
55
60
65
70
75
80
I- Gordonia Sand
~ ..... ............ ...... <: ~
--::: r-..: p. -=::
< ~ b...
~ \ . .... ~ ~ ........ ......
- Red Clay -
I
o 100 200 300
BH3 Inferred UCS
BH3
o
5
10
15
20
25
30
35
40
45
50
55
60
65
70
75
80
- ------~
I
r- Gordonia Sand -
..... . ..... ............ .. . .... ~ , ( ~
/ I¥
r-. .... ....... .............. . .....
r--I- Red Clay r---
I
o 100 200 300
BH3 Actual UCS
12
10
<a 8
a.. 6 (J) () 6 ::J ro ;j
u « 4
2
o
Correlation between. PLI & actual UCS from
BH2 & BH3
•• ,
, ,
, ,
• , ,
, ,
, , • , ,
,
, ,
, ,
, .' • , ,
,
:' y=( . o 782x 1.8083 1"-.
• • .. o 40 80 120
BH2 & 3 15(50) (MPa)
Figure 4.3 Comparison of inferred UCS from PLI testing with actual laboratory UCS results carried out on the calc-arenites of the Kalahari Group (indicated between the dotted lines).
VI .j::o.
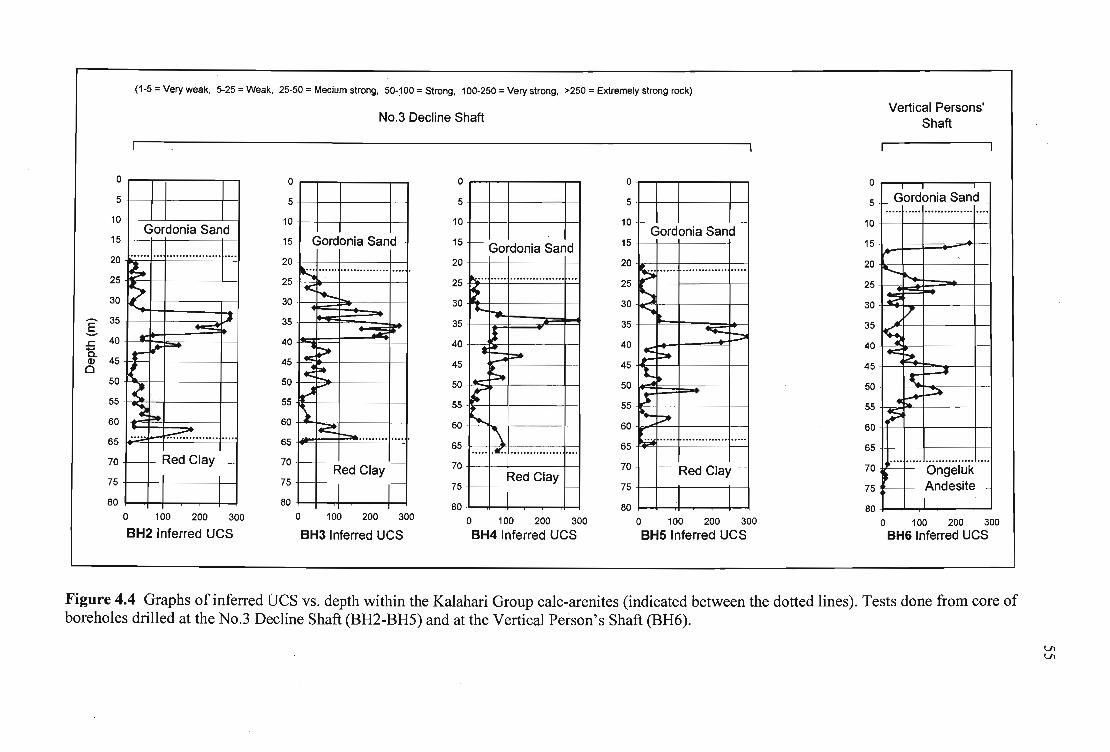
0
5
10
15
20
25
30
I 35
..c: 40 c.. Q) 45 0
50
55
60
65
70
75
80
(1 -5 = Very weak, 5-25 = Weak, 25-50 = Medium strong, 50-JOO = Strong, 100-250 = Very strong, >250 = Extremely strong rock)
Gordonia Sand
...... ... ........... ..... . ....
~ 12 " .A
~
~t= ~ ~
{ ~-~ I;::.. ..... I-k::-::':':":' ........ ....
r- I- Red Clay -I I
o 100 200 300
BH2 Inferred UCS
o
5
10
15
20
25
30
35
40
45
50
55
60
65
70
75
80
NO.3 Decline Shaft
Gordonia Sand .
~ ...... ............... .... '
1< r.-
... ~~ 1 ~ 4c::
~ ~ D p
~ [4i2! - ...... ... .....
I---- - Red Clay -I---- f- I 1-o 100 200 300
BH3 Inferred UCS
o
5
10
15
20
25
30
35
40
45
50
55
69
65
70
75
80
f- Gordonia Sand
~ .. ..... .. ............... ...
~ ..... ha..
~ * ~ ~ P'"'
.,,-~ ~ .......
1\. .. ... 7. . . .... ........... ....
Red Clay - 1- 1 -
o 100 200 300
BH4 Inferred UCS
o
5
10
15
20
25
30
35
40
45
50
55
60
65
70
75
80
f- Gordonia Sand -
~ . .... .. ............ .....
~ ~
-.::: :::;:..
I~ :::. 1... ,.:i" ~ ::::-~
. .... . ............. .....
- - Red Clay -_L_
o 100 200 300 BH5 Inferred UCS
o
5
10
15
20
25
30
35
40
45
50
55
60
65
70
75
80
Vertical Persons' Shaft
I
I-- Gordonia Sand ~ ..... ..... ............... ....
~ ',W
~ ~
I:? 17 ..,
~ 1-= ~
~ ..lI
.1.- p
.~
..... ............... .... '"--I-- Ongeluk -
·r- I-- Andesite -I --
o 100 200 300 BH6 Inferred UCS
Figure 4.4 Graphs of inferred ues vs. depth within the Kalahari Group calc-arenites (indicated between the dotted lines). Tests done from core of boreholes drilled at the No.3 Decline Shaft (BH2-BHS) and at the Vertical Person' s Shaft (BH6).
VI VI
56
Within this zone, pale brown silicification has been identified in core
logging. This material, which has UCS values well in excess of
200MPa required blasting in addition to mechanical excavation.
Below 40m depth, the calculated strength of the calcified sediments
decreases to strong to medium strong rock quality. The reason for this
variation in strength is attributed to the variable degree of calcium
carbonate cementation that has occurred during the lithification and
subsequent pedogenesis of the Kalahari sediments. The effect of later
weathering has served to reduce the quality of cementation.
The calcified sandstones were weathered to depths of approximately 28
to 30m. They thus form a weaker more friable zone. The basal gravel
beds also appear to have been weathered by the perched water table that
periodically overlies the Red Clay layer. These gravel beds are most
certainly friable with potentially loosened areas where the cement has
been completely weathered out.
The percussion borehole drilled near the Vertical Person's Shaft (BHI
SRK) was being used as a guideline to indicate the stratigraphy ahead
of the shaft. However, the limited knowledge obtained from percussion
chips did not indicate a very strong rock zone at ISm. During the
sinking of the Vertical Person's Shaft precast caisson, the excavations
at the toe of the concrete sheath went smoothly through the sands of the
Gordonia Formation and the upper completely weathered Kalahari
Group. However blasting of the silicified zone at ISm below surface
caused delays in the shaft sinking schedule, and it was then decided to
drill a rotary cored borehole immediately adjacent to the vertical shaft
(BH6).
The core obtained from the borehole also indicates a distinct strength
pattern in the calc-arenites of the Kalahari Group (Figure 4.4). Bands of
stronger rock occur where silicification and increased calcification have

57
occurred. Where the strength decreases, the calcium cement has been
removed by weathering effects, and a similar decrease in strength
occurs within the conglomerate. The caisson of the vertical shaft was
sunk to a fmal depth of 25m, where it was anchored into the very strong
rock zone identified by the core drilling as seen in Figure 4.4.
With the extremely poor core recovery (if any at all) of the Red Clay,
no PLI testing was carried out, or was possible due to the crumbling
nature of the core samples. The fact that the few core samples obtained
could be easily peeled by a pocket knife indicated its extremely weak to
very weak strength. This was confirmed by underground exposure with
the No.3 Decline Shaft, where the Red Clay was very easily excavated
with the ITC machine (see Figures 4.8 and 4.9 on page 67).
Below the Red Clay layer the three boreholes which were able to core
the underlying highly weathered and closely jointed shale Lucknow
Shale (BH7 to BH9) provided poor core recovery. The few PLI tests on
core samples from the shale below the clay layer were certainly reduced
due to the laminated nature of the rock. Sliding occurred on the inclined
bedding surfaces. It can be seen from the graph in Figure 4.5 that the
shale strength increases slightly with depth, indicating a reduction in the
weathering effects with depth. Overall the rock mass can be described
as very weak rock to 115m and weak rock below. Medium strong rock
is encountered below 135m depth.
4.3 Shaft Excavation - Rock Mass Assessment
Additional parameters were required from the logging of the borehole core to
further quantify the rock mass quality ahead of the No.3 Decline shaft, and of the
Vertical Person's Shaft. These parameters are required for the tunnelling index of
Barton (1988), known as the Rock Tunnelling Quality Index, or Q-analysis. This
index was proposed by Barton, Lein and Lunde in 1974 (Barton, 1988) for the
determination of rock mass characteristics and tunnel support requirements
(Hoek et al., 1998).
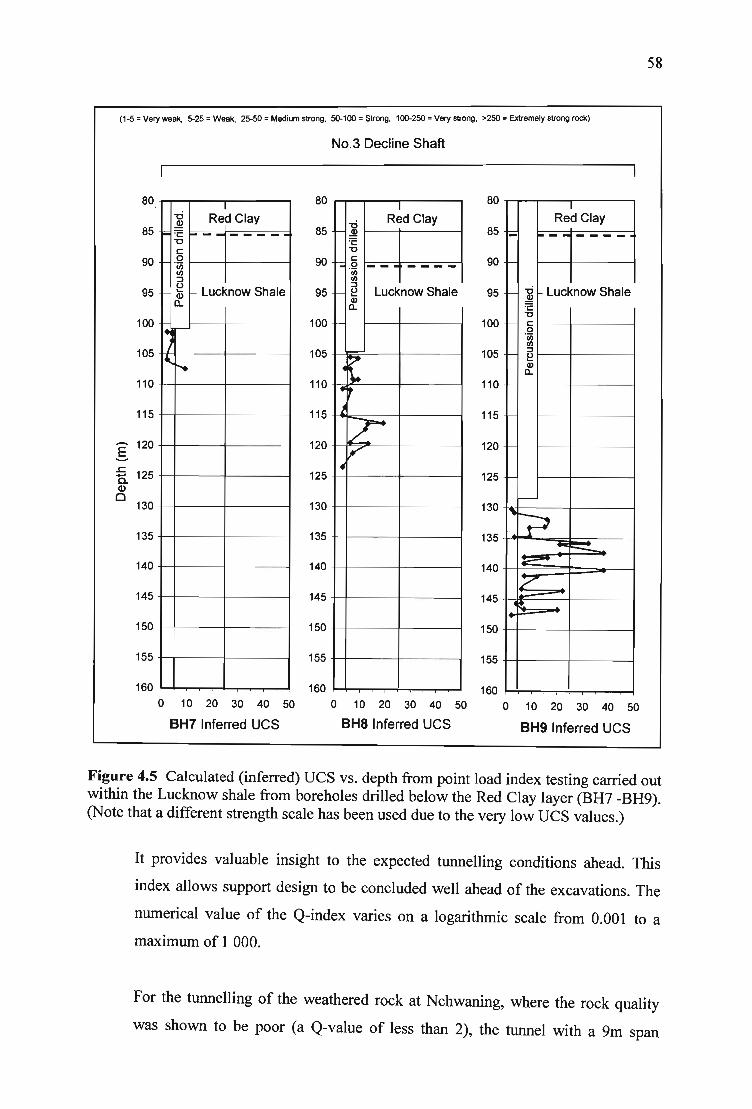
58
(1 -5 = Very weak, 5-25 = Weak, 25-SO = Medium strong, SO-lOO = Strong, l00-2SO = Very strong, >2SO = Extremely strong rock)
NO.3 Decline Shaft
80 I
80 1
80 I
-0 Q) Red Clay
-~ r--- - - --'0
-0 Red Clay 1- ..9!
=c:
Red Clay r.; -- - - --85 85 85
c: '0 0
' (ij I"d~ - - - - -- I-90 90 90 rJ) :::J e I- Lucknow Shale Q)
a..
I/) I/) :::J
Lucknow Shale I- e Q) a..
I- -0 Lucknow Shale ..9!
~ 95 95 95
.- I- I- e 0 'iij
100 100 100
I/)
l'r-. ~t.. . ., :::J
I- e Q) a..
I-
105
110
105
110
105
110
115 115 1 115 I-
[Z: ~
I-- 120 .s 120 120
£ 125 a. 125 I· 125 I-
Q)
-i~?
o 130
135
130
135
130
135 .... s",
140 140 140 ~
17 145 145 145
I" 150 150 150
155 155 155
160 160 160 o 10 20 30 40 50 0 10 20 30 40 50 0 10 20 30 40 50
BH71nferred UCS BH8 Inferred UCS BH9 Inferred UCS
Figure 4.5 Calculated (inferred) UCS vs_ depth from point load index testing carried out within the Lucknow shale from boreholes drilled below the Red Clay layer (BH7 -BH9). (Note that a different strength scale has been used due to the very low UCS values.)
It provides valuable insight to the expected tunnelling conditions ahead. This
index allows support design to be concluded well ahead of the excavations. The
numerical value of the Q-index varies on a logarithmic scale from 0.001 to a
maximum of 1 000.
For the tunnelling of the weathered rock at Nchwaning, where the rock quality
was shown to be poor (a Q-value of less than 2), the tunnel with a 9m span
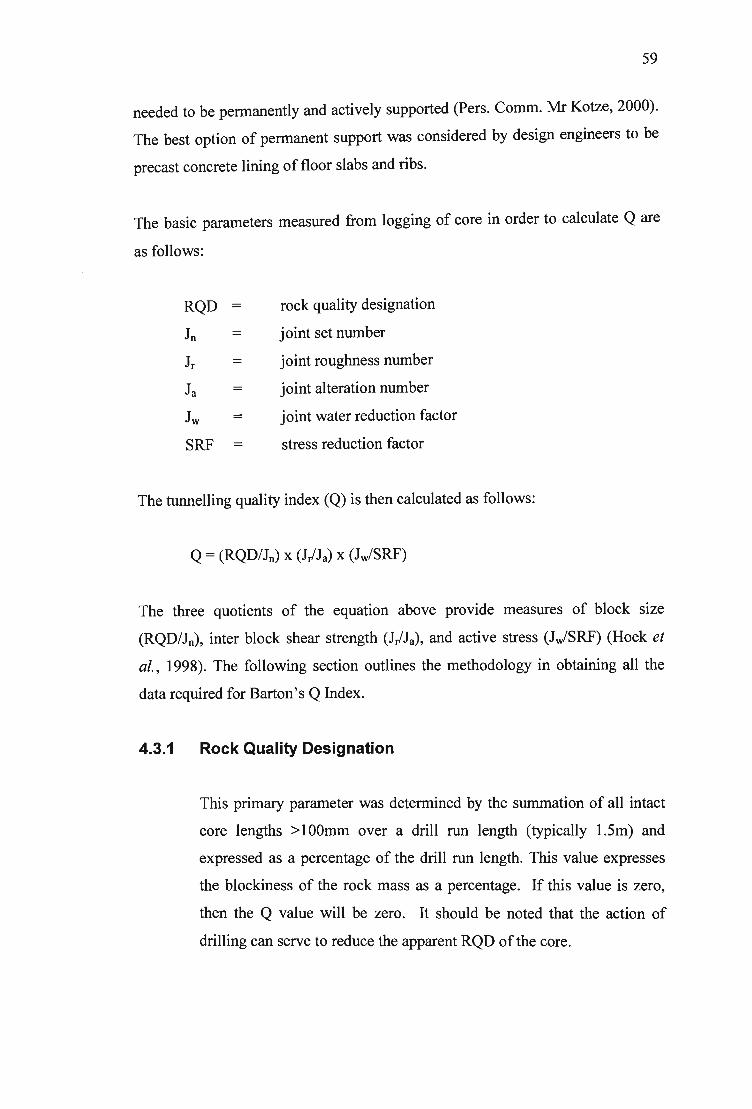
59
needed to be permanently and actively supported (Pers. Comm. Mr Kotze, 2000).
The best option of permanent support was considered by design engineers to be
precast concrete lining of floor slabs and ribs.
The basic parameters measured from logging of core in order to calculate Q are
as follows:
RQD = rock quality designation
I n = joint set number
Jr = joint roughness number
Ja = joint alteration number
Jw = joint water reduction factor
SRF = stress reduction factor
The tunnelling quality index (Q) is then calculated as follows:
Q = (RQD/Jn) x (J/Ja) x (Jw/SRF)
The three quotients of the equation above provide measures of block size
(RQD/Jn), inter block shear strength (Jr/Ja), and active stress (Jw/SRF) (Hoek et
al., 1998). The following section outlines the methodology in obtaining all the
data required for Barton's Q Index.
4.3.1 Rock Quality Designation
This primary parameter was determined by the summation of all intact
core lengths > 1 OOmm over a drill run length (typically 1.5m) and
expressed as a percentage of the drill run length. This value expresses
the blockiness of the rock mass as a percentage. If this value is zero,
then the Q value will be zero. It should be noted that the action of
drilling can serve to reduce the apparent RQD of the core.
60
4.3.2 Joints
The main factors in determining the rock mass quality according to the
Q-method concerns the identification of the number of joint sets, as
well as their overall roughness and filling.
i) Joint Set Number
Within the Kalahari Group sediments the core was generally broken due
to the weathered nature of the rock. Core breaks were generally near
horizontal, with few angled joints (some with slickensided surfaces).
Although the core was not orientated during drilling, joint sets were
evident from similar dip angles within the vertically drilled core. At
least three joint sets were assumed and bedding.
For the weathered shale, because the core was generally very broken, it
was difficult to accurately determine the number of joint sets in the rock
mass. From the core drilled through the shale at least three fracture sets
were identified and bedding. Underground mapping in the No.3 Decline
Shaft confirmed the number of fracture sets as estimated from the core
logging.
ii) Joint Set Roughness
The Kalahari Group showed general rough and non-oriented joint sets.
Fractures within the shale were smooth and planar with some thin clay
filling in places. Underground mapping confirmed the joint roughness
condition.
iii) Joint Set Filling
Most fractures in the Kalahari Group were clean, having no clay filling.
For the shale below the clay layer however, most fractures appeared to
have either a thin silty or clay coating. It is also possible that there has

61
been some loss of material during core recovery on the wide clay filled
fractures noted during tunnelling.
4.3.3 Ground Water
Negligible ground water inflow occurred during the decline excavation
within the Kalahari Group. Slight inflow did occur toward the base of
the Kalahari Group, within the conglomerates. This could have been
from water trapped in a very small localized perched aquifer above the
Red Clay. Some ground water inflow occurred from within the shale
rock mass and generally occurred in areas of fracture and fault zones.
The estimated amount of water was approximated at less than
5 litres per minute. For this analysis, Jw was thus assumed to be 1.0 (dry
to negligible inflow) for the Kalahari Group as well as the weathered
shale.
4.3.4 Stress Reduction Factor
In determining the Q-value for the Kalahari Group, the SRF was
assumed to be 1.3 (low to medium stress, near surface). Within the
shale below the clay layer the SRF was taken to be 2.5 where the rock
mass consists of weak zones (probably single fractures/faults which
contain clay or chemically disintegrated rock) causing loosening during
excavation.
4.4 Q-Value Results and Rock Mass Subdivision
All the above data have been applied to Barton's equation and Q-values have
been obtained for each of the boreholes drilled during the current investigation.
The data tables are presented in Tables A4 a-h, Appendix A. The graphs in
Figure 4.6 show the changing results of the Q-values as a function of depth
within each borehole drilled within the Kalahari Group at the No.3 Decline Shaft
and at the Vertical Person's Shaft. From the graphs, it can be seen that the Q_
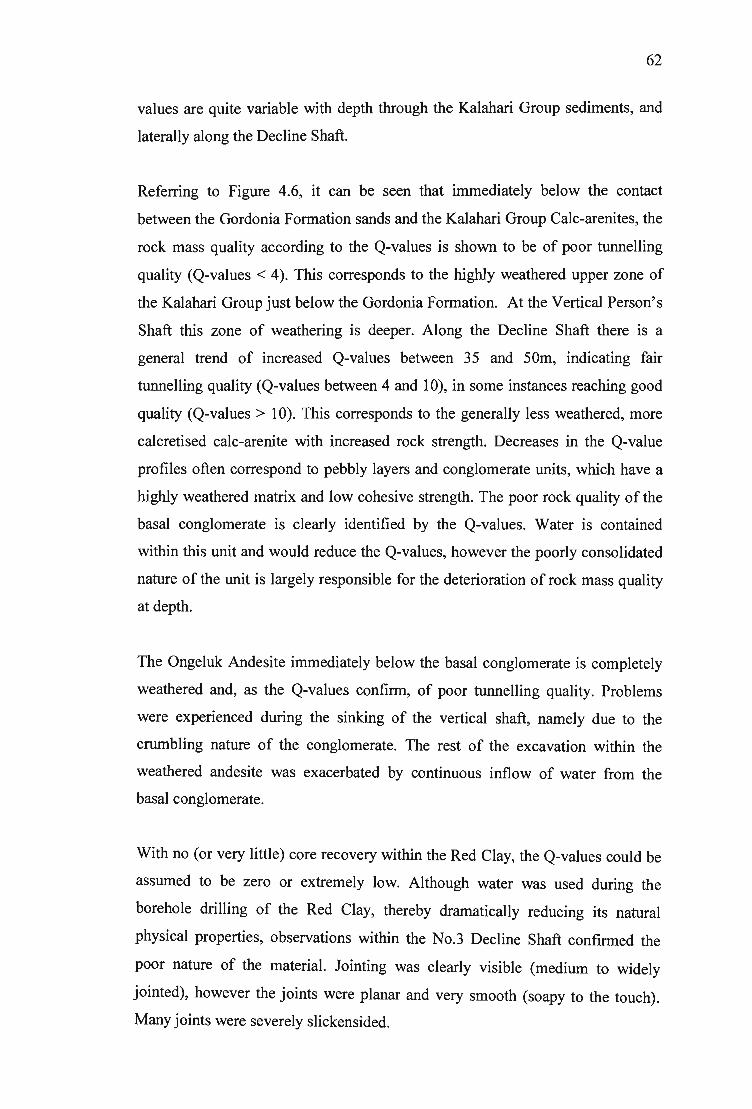
62
values are quite variable with depth through the Kalahari Group sediments, and
laterally along the Decline Shaft.
Referring to Figure 4.6, it can be seen that immediately below the contact
between the Gordonia Formation sands and the Kalahari Group Calc-arenites, the
rock mass quality according to the Q-values is shown to be of poor tunnelling
quality (Q-values < 4). This corresponds to the highly weathered upper zone of
the Kalahari Group just below the Gordonia Formation. At the Vertical Person's
Shaft this zone of weathering is deeper. Along the Decline Shaft there is a
general trend of increased Q-values between 35 and 50m, indicating fair
tunnelling quality (Q-values between 4 and 10), in some instances reaching good
quality (Q-values > 10). This corresponds to the generally less weathered, more
calcretised calc-arenite with increased rock strength. Decreases in the Q-value
profiles often correspond to pebbly layers and conglomerate units, which have a
highly weathered matrix and low cohesive strength. The poor rock quality of the
basal conglomerate is clearly identified by the Q-values. Water is contained
within this unit and would reduce the Q-values, however the poorly consolidated
nature of the unit is largely responsible for the deterioration of rock mass quality
at depth.
The Ongeluk Andesite immediately below the basal conglomerate is completely
weathered and, as the Q-values confirm, of poor tunnelling quality. Problems
were experienced during the sinking of the vertical shaft, namely due to the
crumbling nature of the conglomerate. The rest of the excavation within the
weathered andesite was exacerbated by continuous inflow of water from the
basal conglomerate.
With no (or very little) core recovery within the Red Clay, the Q-values could be
assumed to be zero or extremely low. Although water was used during the
borehole drilling of the Red Clay, thereby dramatically reducing its natural
physical properties, observations within the No.3 Decline Shaft confirmed the
poor nature of the material. lointing was clearly visible (medium to widely
jointed), however the joints were planar and very smooth (soapy to the touch).
Many joints were severely slickensided.
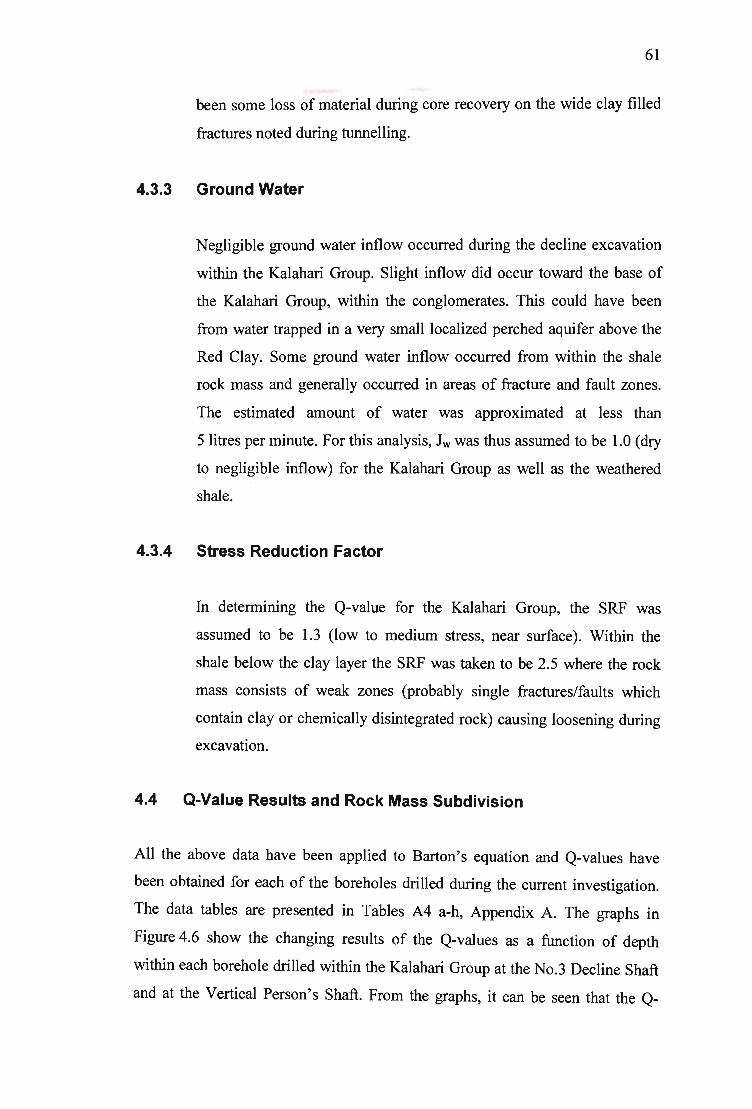
61
been some loss of material during core recovery on the wide clay filled
fractures noted during tunnelling.
4.3.3 Ground Water
Negligible ground water inflow occurred during the decline excavation
within the Kalahari Group. Slight inflow did occur toward the base of
the Kalahari Group, within the conglomerates. This could have been
from water trapped in a very small localized perched aquifer above the
Red Clay. Some ground water inflow occurred from within the shale
rock mass and generally occurred in areas of fracture and fault zones.
The estimated amount of water was approximated at less than
5 litres per minute. For this analysis, Jw was thus assumed to be 1.0 (dry
to negligible inflow) for the Kalahari Group as well as the weathered
shale.
4.3.4 Stress Reduction Factor
In determining the Q-value for the Kalahari Group, the SRF was
assumed to be 1.3 (low to medium stress, near surface). Within the
shale below the clay layer the SRF was taken to be 2.5 where the rock
mass consists of weak zones (probably single fractures/faults which
contain clay or chemically disintegrated rock) causing loosening during
excavation.
4.4 Q-Value Results and Rock Mass Subdivision
All the above data have been applied to Barton's equation and Q-values have
been obtained for each of the boreholes drilled during the current investigation.
The data tables are presented in Tables A4 a-h, Appendix A. The graphs in
Figure 4.6 show the changing results of the Q-values as a function of depth
within each borehole drilled within the Kalahari Group at the No.3 Decline Shaft
and at the Vertical Person's Shaft. From the graphs, it can be seen that the Q_

64
In view of the joint condition alone, the Q-values would be very low. Adding to
the extremely poor tunnelling quality of the Red Clay are its hygroscopic and
swelling properties, aggravated by tunnelling procedures. The three boreholes
which penetrated the Red Clay layer (BH7 to BH9) provided poor core recovery
of the Lucknow Shale. Highly weathered and closely jointed, the shale
immediately below the Red Clay exhibits very poor Q-values (Figure 4.7). A
simple material zonation pattern has been defined for the Lucknow Shale and is
shown below (also refer to Figure 3.2):
• Rock Mass Class 1: totally discoloured, completely weathered and highly
broken shale (RQD ~O) with possible wide clay filled fracture planes.
Possible water in fracture zones and very poor stability.
• Rock Mass Class 2: partially discoloured, highly to moderately weathered,
highly broken to broken shale (RQD <30) with stained smooth fractures and
thin clay filling in places.
• Rock Mass Class 3: generally slightly weathered to unweathered rock, more
intact (RQD >30) with some discoloured fractures. In general weak to
medium strong rock material.
Figures 3.1 and 3.2 shows the weathered rock mass classes that have been
identified below the Red Clay layer. All three classes of rock consist of folded
and faulted shale. The boundaries between each class are diffuse and gradational.
Deeper weathering pockets were also expected along fault/fracture planes. Such a
zone was observed during an inspection of the No.3 Decline Shaft past the
reinforced concrete rib support. Decreased joint spacing and slight water ingress
marked the predicted fault zone near the exploration borehole N91B (Figure 3.1).
Beyond which tunnelling conditions improved (temporarily).
Numerous similar poor rock mass zones were encountered during the rest of the
Decline Shaft excavations, marking the highly fractured fault zones. In order to
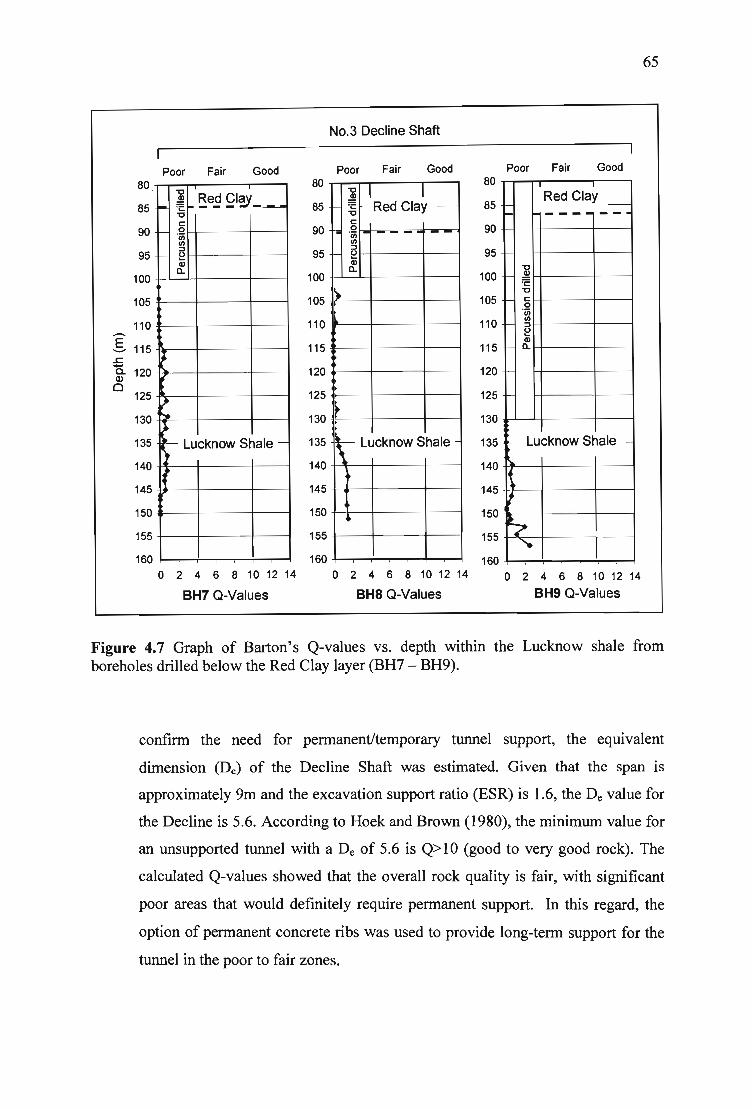
E -.s:::. -a. Q)
0
Poor Fair Good 80
85
"0
BeE gl~ _ -----... I-~ .;:: "0 C
90 - 0 'in !IJ
95 ::I
- ~ Cl)
a.. 100
105
110
115 ~
120
125 ~
130 .... ?
135 f- Lucknow Shale -~
140 , 145
150
155
80
85
90
95
100
105
110
115
120
125
130
135
140
145
150
155
NO.3 Decline Shaft
Poor Fair Good
a: I I 1- '1::
"0 Red Clay -
C I- .0
!IJ - - - -!IJ ::I ~ Cl)
a..
~
• r Lucknow Shale -
160 160 o 2 4 6 8 10 12 14 0 2 4 6 8 10 12 14
BH7 a-Values BH8 a-Values
80
85
90
95
100
105
110
115
120
125
130
135
140
145
150
155
160
Poor Fair Good
I-Red Clay
-- -------
"0 ~
~ c 0 'in !IJ ::I ~ Cl)
a..
~ Lucknow Shale -
~ ~
o 2 4 6 8 10 12 14
BH9 a-Values
65
Figure 4.7 Graph of Barton' s Q-values vs. depth within the Lucknow shale from boreholes drilled below the Red Clay layer (BH7 - BH9).
confirm the need for permanent/temporary tunnel support, the equivalent
dimension (De) of the Decline Shaft was estimated. Given that the span is
approximately 9m and the excavation support ratio (ESR) is 1.6, the De value for
the Decline is 5.6. According to Hoek and Brown (1980), the minimum value for
an unsupported tunnel with a De of 5.6 is Q>10 (good to very good rock). The
calculated Q-values showed that the overall rock quality is fair, with significant
poor areas that would definitely require permanent support. In this regard, the
option of permanent concrete ribs was used to provide long-term support for the
tunnel in the poor to fair zones.

66
4.5 Current Tunnelling Practice
The first section of the tunnel was excavated by an imported r~.'C soft ground
tunnelling machine (Figure 4.8 and 4.9, which show the ITC machine as it started
to excavate in the Kalahari Group calc-arenite). This portion of the tunnel was
lined with continuous, segmented 3-piece, pre-cast reinforced concrete ribs and
floor slabs to a chainage length of approximately 800m (equating to a vertical
depth of 160m). This provided permanent support of the weaker and calcified
sediments of the Kalahari Group, including the Red Clay and broken Lucknow
shale. Beyond the 800m chainage length only shotcrete and patterned rock
bolting was used for roof and sidewall stabilization.
The ITC machine is limited in excavation strength to the very weak rocks of the
Kalahari Group (20 to 30MPa). For excavation of stronger rock, comprising
calcretised weak to very strong calc-arenite and calcrete of the Kalahari Group,
low intensity blasting was required. Below the hard calc-arenite layers, the lower
weak rock conglomerate bands were friable~ with boulder sized clasts falling
from the tunnel roof. The precast ribs had to be placed into position quickly to
minimise this.
During the excavation of the older No.2 Decline Shaft, a 3 month delay occurred
while excavating through the Red Clay layer. Collapse of the face and roof
occurred with very poor traffickability problems arising from wet clay. For the
11.5 degree No.3 Decline Shaft, the total length of tunnelling within clay was
approximately 150m. The method successfully used in penetrating the very
unstable Red Clay layer within the Kalahari Group sediments consisted of,
incremental face excavation (top heading) by no more than a metre at a time and
the careful and prompt placement of the segmented concrete floor slabs and ribs.
Immediately after advancing the decline face by Im, the waste was removed and
the entire exposed area ahead of the precast ribs coated with shotcrete. This
attempted to reduce desiccation as well as wetting of the clay. Despite these
precautionary measures, large blocks would still slip out from the face and fall
from the decline roof.
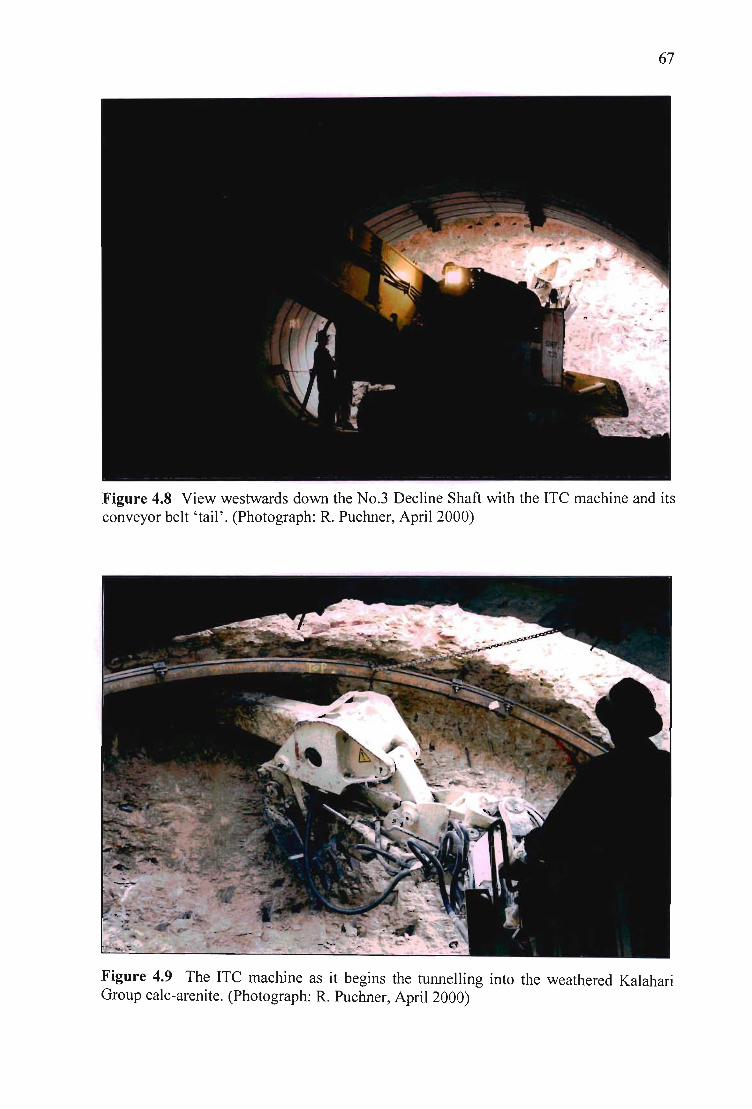
67
Figure 4.8 View westwards down the No.3 Decline Shaft with the ITC machine and its conveyor belt ' tail' . (Photograph: R. Puchner, April 2000)
Figure 4.9 The ITC machine as it begins the tunnelling into the weathered Kalahari Group calc-arenite. (Photograph: R. Puchner, April 2000)
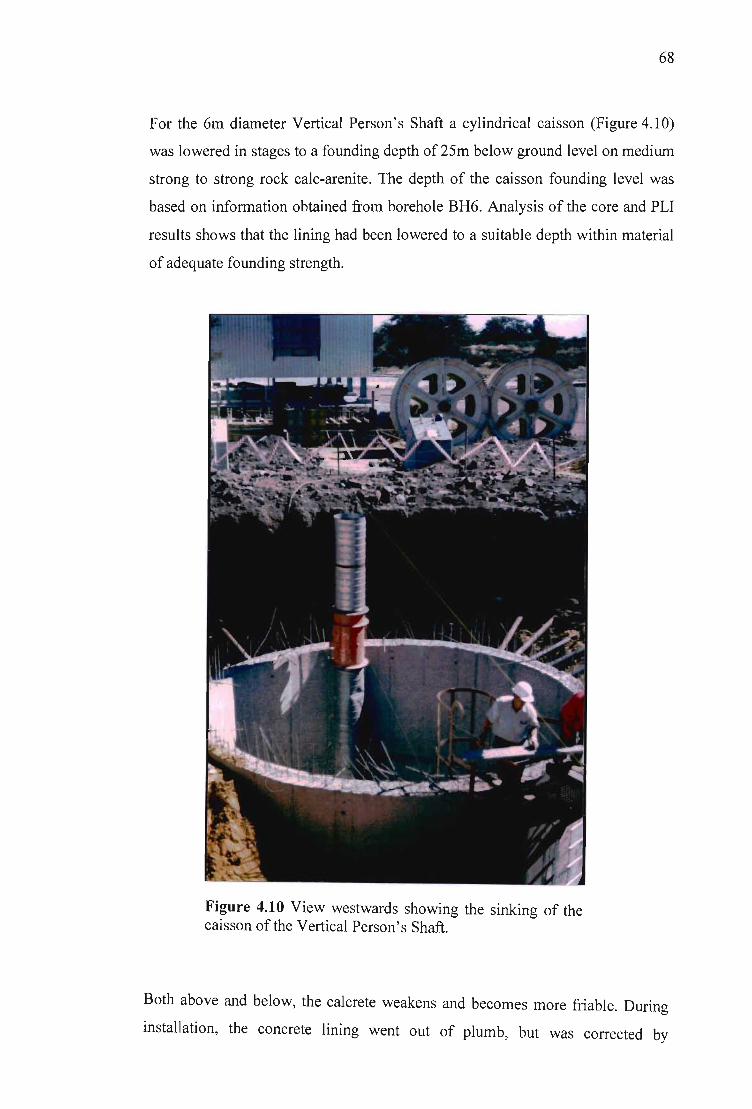
68
For the 6m diameter Vertical Person's Shaft a cylindrical caisson (Figure 4.10)
was lowered in stages to a founding depth of 25m below ground level on medium
strong to strong rock calc-arenite. The depth of the caisson founding level was
based on information obtained from borehole BH6. Analysis of the core and PLI
results shows that the lining had been lowered to a suitable depth within material
of adequate founding strength.
Figure 4.10 View westwards showing the sinking of the caisson of the Vertical Person's Shaft.
Both above and below, the calcrete weakens and becomes more friable. During
installation, the concrete lining went out of plumb, but was corrected by

69
hydraulic jacking. Additional stabilization of the caisson included two rows of
ground anchors which were placed within the very strong silcrete layer at 15.0m
and 15.5m respectively (see inferred ues graph of the Vertical Person's Shaft,
Figure 4.3). The method of support beyond the caisson during shaft sinking to
400m included shotcrete with cable anchors on a I .5m grid spacing.
70
6 CONCLUSIONS
With the extension of the Nchwaning Mine shaft complex, various geological
and geotechnical complications had to be identified to ensure that correct
tunnelling methods and support techniques were used. An understanding of the
geological history of the area and the resulting geotechnical nature was important
in defining rock mass quality to be expected ahead of shaft development.
The Cenozoic cover of the area largely comprises the Kalahari Group aeolian
deposits, calcretised sandstones, conglomerates and the Red Clay layer. The 20m
of aeolian sands are of the Gordonia Formation and are Pleistocene-Holocene in
age. The unit is unconsolidated and changes in colour, moisture and consistency
with depth. A prominent gravel lag defines the base of this unit. For the
development of the No.3 Decline shaft a box cut was excavated to a depth of
25m. From the results of various soil testing, batter slopes of 30 to 35° were
advised. The boxcut was then backfilled over a series of precast segments, which
would continue for a total length of 800m at the decline dip of 11.5°.
Below the Gordonia Formation is a package of calcareous arenites and
conglomerates, which are on average 25m thick at the No.3 Decline shaft and
55m at the new vertical shafts. This package varies from weak and medium
strong weathered zones, to very strong rock calcareous and siliceous zones.
Much of the rock mass is highly weathered and medium to very closely
fractured. The conglomerate bands are usually weak in strength, tending to
residual material. The above mentioned units are thought to have been deposited
as an aggrading fluvial fan which formed as a result of epeirogenic uplift along
the Griqualand-Transvaal axis to the south of Kuruman.
Barton's Q-analysis provided valuable insight to the expected tunnelling
conditions ahead. The highly variable and generally low Q-values from borehole
core analysis highlighted the necessity to continue using the precast tunnel lining.
The precast segments were installed through the entire weathered Cenozoic
sequence and into the weathered shales immediately below the Red Clay.

71
The Red Clay unit below the basal conglomerate is homogeneous, very stiff and
heavily slickensided. Its hygroscopic nature and free swell strains of up to 15%
cause it to be highly unstable while tunnelling through it. This unit is believed to
be completely weathered lacustrinal sediments. XRD and XRF analyses show
high amounts of dolomite, with quartz and palygorskite. This confirms that the
clays and carbonates probably originated from chemically weathered dolomites
in the region.
The underlying Lucknow shale of the Olifantshoek Supergroup has been folded
and faulted, the effects of which are evident in its highly broken nature and low
Q-values. The shales were deeply weathered during the Late Cretaceous to
depths equivalent of 50m below the then ground level. This weathering front has
been preserved and is now 130 to 150m below surface. Deeper weathering
pockets correlate with fault zones. A material zonation pattern of three rock mass
classes for the shale was defined ranging from completely weathered shale to
unweathered shale. Q-values were consistently poor.
The andesites of the Ongeluk Group form the bedrock of the mine some 470 to
700m below surface. Due to thrust faulting and the creation of the Kheis Thrust
Fault during the Proterozoic Kheis orogeny, Ongeluk lavas were found to be
much shallower at the position of new vertical shafts (68m below surface). The
effects of weathering have also had an adverse effect on its rock mass quality.
Only below 91.5m does it becomes less weathered tending to medium strong
rock.
Ground water was not found to be problematic during the excavation of the No.3
Decline shaft through the Cenozoic sequence, or shale immediately below. At the
Vertical Person's shaft ingress of water from the basal conglomerate above the
clayey residual Ongeluk andesite slowed shaft sinking activities. Pump-out
testing at the position of the Vertical Vent shaft indicated a relatively low 32m2
per day could be anticipated from the conglomeratic horizon. A pressure gradient
of 150kPa would be likely cause collapse of the aquifer material while sinking
the shaft.
72
From this study it is clear that the importance of a comprehensive understanding
of the geology prior to the sinking of shafts (vertical and decline) is crucial for
the effective determination of the rock mass quality. The quantification of the
rock mass is important in effective design for tunnelling methods and support
techniques, which can be made well in advance of shaft development. Rotary
core drilling provides the means for this valuable insight into the litholgy and
rock mass quality to be expected. Additional rock testing forms part of
quantifying the rock mass, understanding its mechanics and providing a base to
make recommendations upon.
ACKNOWLEDGEMENTS
The author wishes to thank Prof. M. Watkeys, Prof. C. Jermy and Prof. R. Maud for their
valuable reviews and suggestions, and Mr C. McKnight for facilitating the field work.
The staff of Black Rock Mine are also thanked for their assistance during the
geotechnical borehole drilling investigations, particularly Mr A. Pretorius for valuable
discussions of the mine geology, and permitting the use of the mine exploration borehole
logs. The author is also grateful for Dr. Marco Andreoli' s contribution.
73
REFERENCES
Andreoli, M. A. G., Ashwal, L. D., Hart, R. J., and Huizenga, J. M., 1999. A Ni- and PGE-enriched norite impact melt complex in the Late Jurassic Morokweng impact structure, South Africa. In: DressIer, B.O., and Sharpton, V. L., eds. Large Meteorite Impacts and Planetary Evolution II: Boulder, Colorado, Geological Society of America Special Paper 339.
Barton, N., 1988. Rock mass classification and tunnel reinforcement selection using the Q-System. In: Kirkaldie, L. , ed. Rock Classification Systems For Engineering Purposes. American Society for Testing and Materials. 59-88.
Bieniawski, Z. T., 1984. Rock Mechanics Design in Mining and Tunnelling. A. A. Balkema.272pp.
Bieniawski, Z. T., 1989. Engineering Rock Mass Classifications. Wiley, New York. 251pp.
Beukes, N. J., Smit, C. A., 1987. New Evidence for Thrust Faulting in Griqualand West, South Africa: Implications for Stratigraphy and the Age of the Red Beds. Trans. Geol. Soc. S. Afr. 90,387-394.
Bond, G. and Fernandes, T. RC., 1974. Scanning electron microscopy applied to quartz grains from Kalahari type sands. Trans. Geol. Soc. S. Afr. 77, 191-199.
Cornell, D. H., SchUtte, S. S. and Eglington, B. L., 1996. The Ongeluk basaltic andesite formation in Griqualand West, South Africa: Submarine Alteration in a 2222 Ma Proterozoic sea. Precambrian Research. 79; 101-123.
Du Toit, A. L., 1954. The Geology of South Africa. 3rd ed. Oliver and Boyd, Edinburgh, 611p.
Haddon, I. G., 2000. Kalahari Group sediments. In: Partridge, T. C. and Maud, R R, 2000. The Cenozoic of Southern Africa. Oxford University Press. 173-181.
Hart, R. J., Cloete, M., McDonald, I., Carlson, R. W., and Andreoli, M. A. G., 2002. Siderophile-rich inclusions from the Morokweng impact melt sheet, South Africa: possible fragments of a chondritic meteorite. Earth and Planetary Science Letters, Elsevier. 198, 49-62.
Hawkins, A. B. 1998. Aspects of rock strength. Bull. Eng. Geol. Env., 57, 17-30.
Helgren, D. M. and Brooks, A. S., 1983. Geoarchaeology at GI, a Middle Stone Age and Later Stone Age site in the northwest Kalahari. J Archaeol. Sci. 10, 181-197.
Heine, K., 1990. Some Observations concerning the age of the dunes in the western Kalahari and palaeoclimate implications. Palaeoecol. Afr. 21, 161.
Hoek, E. and Brown, E. T., 1980. Underground excavations in rock. Inst. Min. Metall. London. 527pp.
74
Hoek, E, Kaiser, P. K, and Bawden, W. F., 1998. Support of Underground Excavations in Hard Rock. A. A. Balkema. 215pp.
ISRM, 1981. Brown E. T. (ed). Suggested Methods for Rock Characterisation, Testing and Monitoring. Pergamon Press.
Gutzmer, J., Beukes, N. J. and Yeh, H. W., 1997. Fault-controlled metasomatic alteration of Early Proterozoic sedimentary manganese ore at Mamatwan Mine, Kalahari manganese field, South Africa. S. Afr. J. Geol. 100 (1), 53-71.
Grobbelaar, W. S., Burger, M. A., Pretorius, A. I., Marais, W. and van Niekerk, I. J. M., 1995. Strati graphic and structural setting of the Griqualand West and the Olifantshoek Sequences at Black Rock, Beeshoek and Rooinekke Mines, Griqualand West, South Africa Mineral. Deposita. 30, 152-161.
Jennings, M., 1986. The Middleplaats manganese ore deposit, Griqualand West. In: Anhaeusser, C. R and Maske, S. (Eds). Mineral Deposits of Southern Africa. The Geological Society of South Africa. 979-983.
Key, R M. and Rundle, C. C., 1981. The regional significance of new isotopic ages from Precambrian windows though the "Kalahari Beds" in north-western Botswana. Trans. Geol. Soc. S. Afr., 84, 51-66.
Key, R M., Tidi, J., McGeorge, I., Aitken, G., Cadman, A. and Anscombe, J., 1998. The lower Karoo Supergroup geology of the southeastern part of the Gemsbok sub-basin of the Kalahari basin, Botswana. S. Afr. J Geol. 101,225-236.
King, L. C., 1962. The Morphology of the Earth. Oliver and Boyd, Edinburgh. 699pp.
Kleyenstiiber, A. S. E., 1984. The mineralogy of the manganese-bearing Hotazel Formation, of the Proterozoic Transvaal Sequence in Griqualand West, South Africa. Trans. Geol. Soc. S. Afr. 97,257-272.
Meyer, R , Duvenhage, A. W. A., De Beer, J. H., and Huyssen, R M. J., 1985. A geophysical-geohydrological study along the Kuruman River in the Kuruman and Gordonia districts. Trans. Geol. Soc. S. A.fr., 88, 501-515.
Moore, A. E. and Dingle, RV., 1998. Evidence for fluvial sediment transport of Kalahari sands in central Botswana. S. Afr. J Geol. 101 (2), 143-153.
Nel, C. J. , Beukes, N. J. and De Villiers, J. P. R , 1986. The Mamatwan manganese mine of the Kalahari manganese field. In: Anhaeusser, C. R and Maske, S. (Eds). Mineral Deposits of Southern Africa. The Geological Society of South Africa. 963-978.
Norrish, K and Hutton, J. T., 1969. Accurate X-ray spectrographic method for the analysis for the wide range of geological samples. Geochemica et Cosmochimica Acta. 33, 431-453.
Partridge, T. C. and Maud, R R, 2000. The Cenozoic of Southern Africa. Oxford University Press. New York. 406pp.
75
Partridge, T. C. and Maud, R. R., 1987. The geomorphic evolution of southern Africa since the Mesozoic. S. Afr. J. Geol. 90, 179-208.
South African Committee for Stratigraphy (SACS), 1980. Stratigraphy of South Africa. Part 1 (Comp. L. E. Kent). Government Printer. 611pp.
Standard methods of testing road construction materials, 1986. Technical methods for highways (FMH1). Graphic Arts, CSIR. 232pp.
Tankard, A. J., Jackson, M. P. A., Erikson, K. A., Hobday, D. K., Hunter, D. R. and Minter, W. E. L., 1982. Crustal Evolution of South Africa - 3.8 Billion Years of Earth History. Springer Verlag, Berlin, 523pp.
Thomas, D. S. G., and Shaw, P. A., 1990. The deposition and development of the Kalahari Group sediments, central Southern Africa. Journal of African Earth Sciences. 10 (1/2), 187-197.
Thomas, D. S. G., and Shaw, P. A., 1991. The Kalahari Environment. Cambridge University Press. 284 pp.
Tyson, P. D. and Partridge, T. C., 2000. Evolution ofCenozoic climates. In: Partridge, T. C. and Maud, R. R., 2000. The Cenozoic of Southern Africa. Oxford University Press. 371-387.
Van der Merwe, D. H., 1964. The prediction of heave from the plasticity index and percentage clay fraction ofsoils. SA Inst. Civ. Eng. 6 (6).103-107.
Verhagen, B. Th., 1985. Isotope hydrology of ground waters of the Kalahari, Gordonia. Trans. Geol. S. Afr., 88, 517-522.
Visser, D. J. L., 1984. Geological map of the republics of South Africa, Transkei, Bophuthatswana, Venda, and Ciskei and the kingdoms of Lesotho and Swaziland (1:1 000 000). Department of Minerals and Energy Affairs, South Africa. Gravity edition.
Warkwick, D. W. and Speers, C., 1998. Preliminary geotechnical investigation for portal and decline shaft excavation in "soft" horizons. Steffen, Robertson & Kirsten (SRK) Consulting, Report No. 24971112 (Unpublished)

APPENDIX A
DATA TABLES
NOTE: All appendices are contained on the attached compact disc.
Only example sheets have been printed
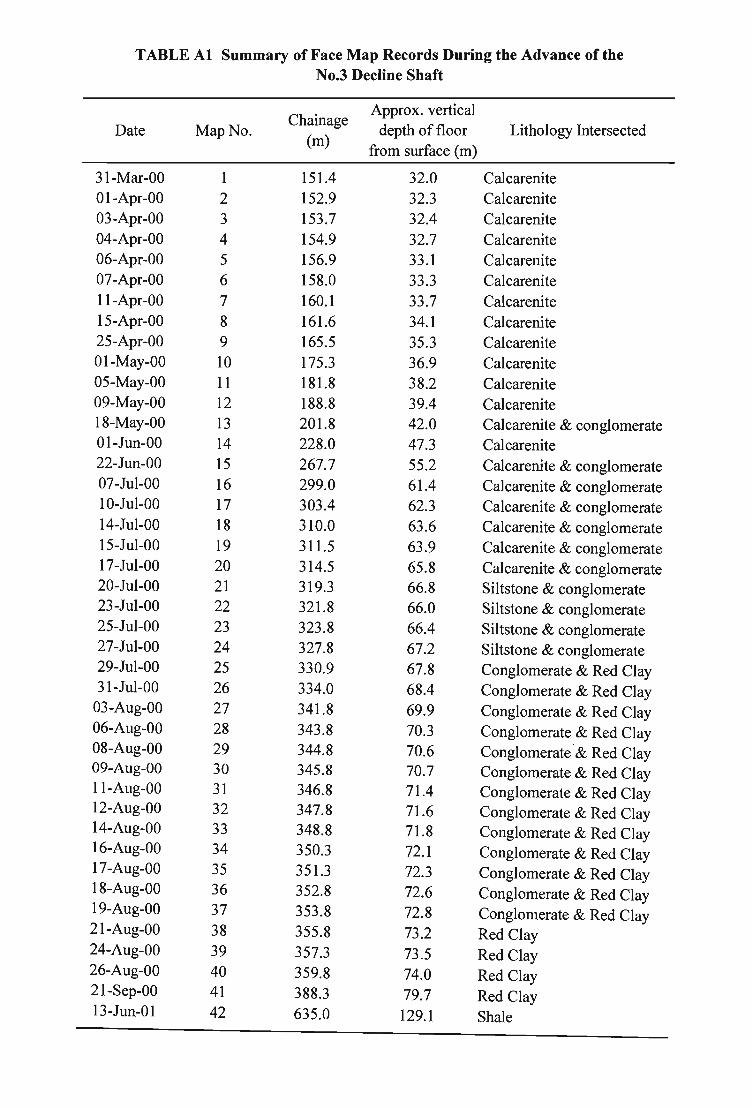
TABLE Al Summary of Face Map Records During the Advance of the No.3 Decline Shaft
Chainage Approx. vertical
Date Map No. depth of floor Lithology Intersected (m)
from surface (m)
31-Mar-00 1 151.4 32.0 Calcarenite 01-Apr-00 2 152.9 32.3 Calcarenite 03-Apr-00 3 153.7 32.4 Calcarenite 04-Apr-00 4 154.9 32.7 Calcarenite 06-Apr-00 5 156.9 33.1 Calcarenite 07-Apr-00 6 158.0 33.3 Calcarenite ll-Apr-OO 7 160.l 33.7 Calcarenite 15-Apr-00 8 161.6 34.1 Calcarenite 25-Apr-00 9 165.5 35.3 Calcarenite 01-May-00 10 175.3 36.9 Calcarenite 05-May-00 11 181.8 38.2 Calcarenite 09-May-00 12 188.8 39.4 Calcarenite 18-May-00 13 201.8 42.0 Calcarenite & conglomerate 01-Jun-00 14 228.0 47.3 Calcarenite 22-Jun-00 15 267.7 55.2 Calcarenite & conglomerate 07-Jul-00 16 299.0 61.4 Calcarenite & conglomerate 10-Jul-00 17 303.4 62.3 Calcarenite & conglomerate 14-Jul-00 18 310.0 63.6 Calcarenite & conglomerate 15-Jul-00 19 311.5 63.9 Calcarenite & conglomerate 17-Jul-00 20 314.5 65.8 Calcarenite & conglomerate 20-Jul-00 21 319.3 66.8 Siltstone & conglomerate 23-Jul-00 22 321.8 66.0 Siltstone & conglomerate 25-Jul-00 23 323.8 66.4 Siltstone & conglomerate 27-Jul-00 24 327.8 67.2 Siltstone & conglomerate 29-Jul-00 25 330.9 67.8 Conglomerate & Red Clay 31-Jul-00 26 334.0 68.4 Conglomerate & Red Clay
03-Aug-00 27 341.8 69.9 Conglomerate & Red Clay 06-Aug-00 28 343.8 70.3 Conglomerate & Red Clay 08-Aug-00 29 344.8 70.6 Conglomerate '& Red Clay 09-Aug-00 30 345.8 70.7 Conglomerate & Red Clay ll-Aug-OO 31 346.8 71.4 Conglomerate & Red Clay 12-Aug-00 32 347.8 71.6 Conglomerate & Red Clay 14-Aug-00 33 348.8 71.8 Conglomerate & Red Clay 16-Aug-00 34 350.3 72.1 Conglomerate & Red Clay 17-Aug-00 35 351.3 72.3 Conglomerate & Red Clay 18-Aug-00 36 352.8 72.6 Conglomerate & Red Clay 19-Aug-00 37 353.8 72.8 Conglomerate & Red Clay 21-Aug-00 38 355.8 73.2 Red Clay 24-Aug-00 39 357.3 73.5 Red Clay 26-Aug-00 40 359.8 74.0 Red Clay 21-Sep-00 41 388.3 79.7 Red Clay 13-Jun-Ol 42 635.0 129.1 Shale
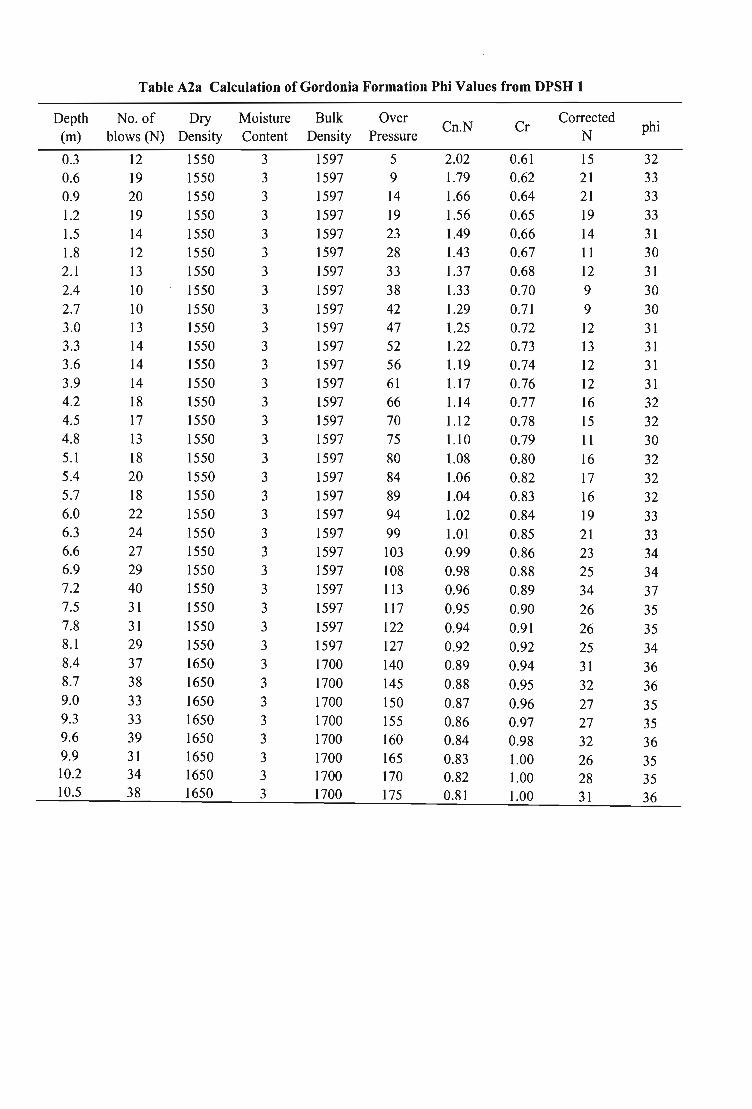
Depth (m)
0.3 0.6 0.9 1.2 1.5 1.8 2.1
2.4 2.7 3.0 3.3 3.6 3.9 4.2 4.5 4.8 5.1 5.4 5.7 6.0 6.3 6.6 6.9 7.2 7.5 7.8 8.1 8.4 8.7 9.0 9.3 9.6 9.9 10.2 10.5
Table A2a Calculation of Gordonia Formation Phi Values from DPSH 1
No. of Dry blows (N) Density
12 1550 19 1550 20 1550 19 1550 14 12 13 10 10 13 14 14 14 18 17 13 18 20 18 22 24 27 29 40 31 31 29 37 38 33 33 39 31 34 38
1550 1550 1550 1550 1550 1550 1550 1550 1550 1550 1550 1550 1550 1550 1550 1550 1550 1550 1550 1550 1550 1550 1550 1650 1650 1650 1650 1650 1650 1650 1650
Moisture Content
3 3 3 3 3 3
3
3 3 3 3 3 3 3 3
3
3 3 3
3 3 3 3 3
3
3 3 3 3
3 3 3 3 3 3
Bulk Density
1597 1597 1597 1597 1597 1597 1597 1597 1597 1597 1597 1597 1597 1597 1597 1597 1597 1597 1597 1597 1597 1597 1597 1597 1597 1597 1597 1700 1700 1700 1700 1700 1700 1700 1700
Over Pressure
5 9 14 19 23 28 33 38 42 47 52 56 61 66 70 75 80 84 89 94 99 103 108 113 117 122 127 140 145 150 155 160 165 170 175
Cn.N
2.02 1.79 1.66 1.56 1.49 1.43 1.37 1.33 1.29 1.25 1.22 l.l9 l.l7 l.l4 1.12 l.l0 1.08 1.06 1.04 1.02 1.01 0.99 0.98 0.96 0.95 0.94 0.92 0.89 0.88 0.87 0.86 0.84 0.83 0.82 0.81
Cr
0.61 0.62 0.64 0.65 0.66 0.67 0.68 0.70 0.71 0.72 0.73 0.74 0.76 0.77
0.78 0.79 0.80 0.82 0.83 0.84 0.85 0.86 0.88 0.89 0.90 0.91 0.92 0.94 0.95 0.96 0.97 0.98 1.00 1.00 1.00
Corrected N
15 21 21 19 14 11 12 9
9 12 13 12 12 16 15 11 16 17 16 19 21 23 25 34 26 26 25 31 32 27 27 32 26 28 31
phi
32 33 33 33 31 30 31 30 30 31 31 31 31 32 32 30 32 32 32 33 33 34 34 37 35 35 34 36 36 35 35 36 35 35 36
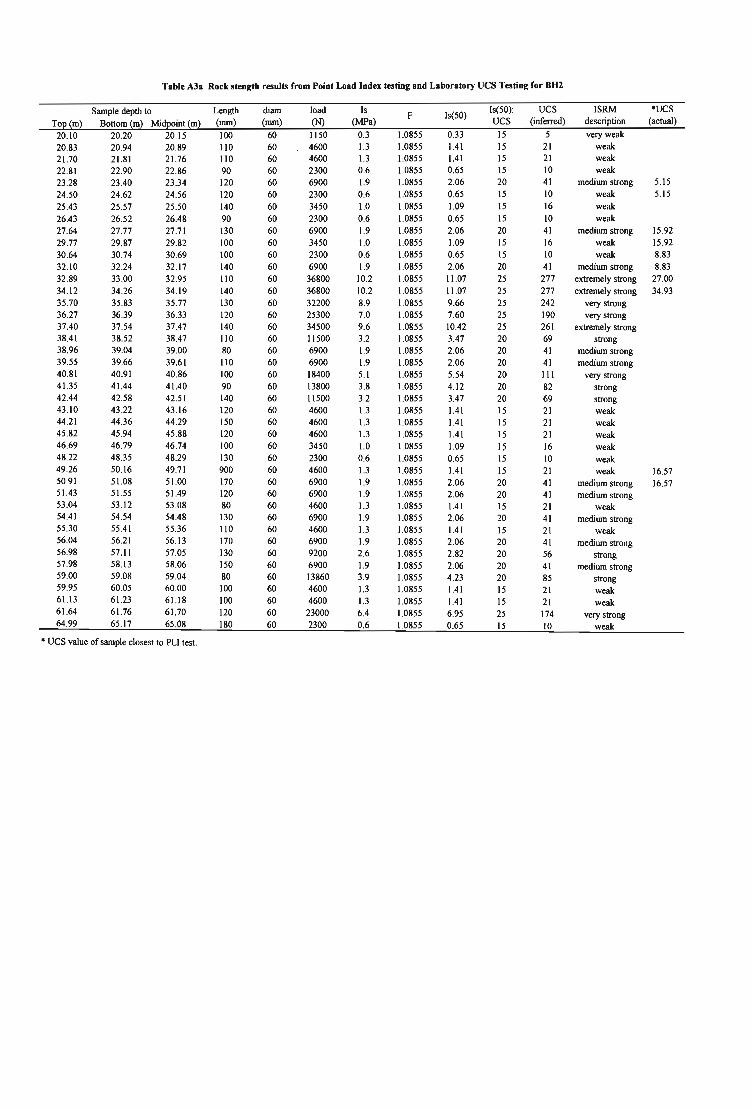
Table A3a Rock stength results from Point Load Index testing and Laboratory ues Testing for BH2
Top (m) 20.10 20.83 21.70 22 .81 23.28 24.50 25.43 26.43 27 .64 29.77 30.64 32.10 32.89 34.12 35.70 36.27 37.40 38.41 38.96 39.55 40.81 41.35 42.44 43 .10 44 .21 45 .82 46.69 48.22 49.26 50.91 51.43 53.04 54.41 55.30 56.04 56.98 57.98 59.00 59.95 61.13 61.64 64 .99
Sample depth to Bottom (m) Midpoint (m)
20.20 20.15 20 .94 20.89 21.81 22.90 23.40 24.62 25.57 26.52 27 .77 29 .87 30.74 32.24 33.00 34.26 35.83 36.39 37.54 38.52 39.04 39.66 40.91 41.44 42.58 43 .22 44.36 45 .94 46.79 48.35 50.16 51.08 51.55 53.12 54.54 55.41 56.21 57.11 58.13 59.08 60.05 61.23 61.76 65 .17
21.76 22 .86 23.34 24 .56 25.50
26.48 27 .71 29.82 30.69 32.17 32.95 34.19 35.77 36.33 37.47 38.47 39.00 39.61 40.86 41.40 42.51 43 .16 44.29 45 .88 46.74 48.29 49.71 51.00 51.49 53.08 54.48 55.36 56.13 57.05 58.06 59.04 60.00 61.18 61.70 65 .08
• ues value of sample closest to PLI test.
Length (mm)
100 110 110 90 120 120 140 90 130 100 100 140 110 140 130 120 140 110 80 110 100 90 140 120 150 120 100 130 900 170 120 80 130 110 170 130 150 80 100 100 120 180
diam (mm)
60 60 60 60 60 60 60 60 60 60 60 60 60 60 60 60 60 60 60 60 60 60 60 60 60 60 60 60 60 60 60 60 60 60 60 60 60 60 60 60 60 60
load (N) 1150 4600 4600 2300 6900 2300 3450 2300 6900 3450 2300 6900
36800 36800 32200 25300 34500 11500 6900 6900 18400 13800 11500 4600 4600 4600 3450 2300 4600 6900 6900 4600 6900 4600 6900 9200 6900 13860 4600 4600
23000 2300
Is (MPa)
0.3 1.3 1.3 0.6 1.9 0.6 1.0 0.6 1.9 1.0 0.6 1.9 10.2 10.2 8.9 7.0 9.6 3.2 1.9 1.9 5.1 3.8 3.2 1.3 1.3 1.3 1.0 0.6 1.3 1.9 1.9 1.3 1.9 1.3 1.9 2.6 1.9 3.9 1.3 1.3 6.4 0.6
F
1.0855 1.0855 1,.0855
1.0855 1.0855 1.0855
1.0855 1.0855 1.0855 1.0855 1.0855 1.0855 1.0855 1.0855 1.0855 1.0855 1.0855 1.0855 1.0855 1.0855 1.0855 1.0855 1.0855 1.0855 1.0855 1.0855 1.0855 1.0855 1.0855 1.0855 1.0855 1.0855 1.0855 1.0855 1.0855 1.0855 1.0855 1.0855 1.0855 1.0855 1.0855 1.0855
Is(50)
0.33 1.41 1.41 0.65 2.06 0.65 1.09 0.65 2.06 1.09 0.65 2.06 11.07 11.07 9.66 7.60 1Q.42
3.47 2.06 2.06 5.54 4.12 3.47 1.41 1.41 1.41 1.09 0.65 1.41 2.06 2.06 1.41 2.06 1.41 2.06 2.82 2.06 4.23 1.41 1.41 6.95 0.65
Is(50): ues
15 15 15 15 20 15 15 15 20 15 15 20 25 25 25 25 25 20 20 20 20 20 20 15 15 15
15 15 15 20 20 15 20 15 20 20 20 20 15 15 25 15
ues (inferred)
5 21 21 10 41 10 16
10 41 16 10 41
277 277 242 190 261 69 41 41 111 82 69 21 21 21 16 10 21 41 41 21 41 21 41 56 41 85 21 21 174 10
ISRM description
very weak weak weak weak
·ues (actual)
mediwn strong 5.15 weak 5.15 weak
weak mediwn strong 15.92
weak 15.92 weak 8.83
mediwn strong 8.83 extremely strong 27 .00 extremely strong 34.93
very strong very strong
extremely strong strong
mediwn strong mediwn strong
very strong strong strong weak weak weak weak weak weak
mediwn strong medium strong
weak mediwn strong
weak medium strong
strong mediwn strong
strong weak weak
very strong weak
16.57 16.57

Table A4a Calculation of Q value per core run of BH2
Depth RQD In Jr Ja Jw SRF Q
(m) (%)
20.10 17 9 3.0 3 1 1.3 1.453 21.60 24 9 3.0 3 1 1.3 2.051 23.10 35 9 3.0 3 1 1.3 2.991 23.70 67 9 3.0 3 1 1.3 5.726 25.20 47 9 3.0 3 1 1.3 4.017 26.00 70 9 2.0 1 1 1.3 11.966 27.75 66 9 2.0 1 1 1.3 11.282 28.39 93 9 2.0 2 1 1.3 7.949 29.89 69 9 3.0 2 1 1.3 8.846 30.74 64 9 3.0 3 1 1.3 5.470 32.24 100 9 3.0 3 1 1.3 8.547 33.00 100 9 3.0 3 1 1.3 8.547 34.50 29 9 2.0 2 1 1.3 2.479 36.02 95 9 2.0 2 1 1.3 8.120 37.54 86 9 3.0 2 1 1.3 11.026 39.04 90 9 3.0 2 1 1.3 11.538 39.94 91 9 1.5 2 1 1.3 5.833 41.44 35 9 1.5 1 1 1.3 4.487 42.94 63 9 1.5 1 1 1.3 8.077 44.44 57 9 1.5 1 1 1.3 7.308 *45.94 17 9 1.5 1 1 1.3 2.179 *47.44 26 9 3.0 1 1 1.3 6.667 *48.94 52 9 3.0 2 1 1.3 6.667 *50.24 16 9 3.0 1 1 1.3 4.103 *51.74 82 9 3.0 3 1 1.3 7.009 53.04 92 9 2.0 3 1 1.3 5.242 54.54 48 9 3.0 3 1 1.3 4.103 56.04 80 9 2.0 3 1 1.3 4.558 57.56 71 9 2.0 3 1 1.3 4.046 59.08 67 9 2.0 3 1 1.3 3.818 60.60 82 9 3.0 3 1 1.3 7.009 62.10 41 9 3.0 3 1 1.3 3.504 63.60 8 9 3.0 3 1 1.3 0.684 64.50 0 9 0.5 3 1 1.3 0.000
RQD = Rock Quality Designation Jn = Joint set number Jr = Joint roughness Ja = Joint alteration Jw = Joint water reduction factor SRF = Stress Reduction Factor
* Intersection depth ofNo.3 Decline Shaft
APPENDIX B
BORE HOLE LOGS

Table of all Boreholes, Nchwaning No.3 Decline Shaft Complex
No. Borehole No. X-Coord Y-Coord
Current Investigation - Percussion Boreholes
1 PDl 52389.000 13734.500 2 PD2 52383.700 13753.100 3 PD3 52375.200 13781.900 4 PI 52299.000 14006.000 5 PVl 51945.000 15505.200
Current Investigation - Percussion and Rotary cored boreholes
6 BH2 52327.000 13910.000 7 BH3 52309.000 13972.000 8 BH4 52289.000 14040.000 9 BH5 52269.000 14106.000 10 BH6 51850.000 15680.000 11 BH7 52263.648 14125.923 12 BH8 52235.795 14221.540 13 BH9 52201.816 14336.535
Previous Investigation - Percussion and Rotary cored boreholes
14 BHl 51799.975 15675.046 15 BH2 51580.944 15708.886 16 BH4 52288.136 14067.999 17 BH4 52163.945 14476.138 18 BH5 51941.981 15207.015
Exploration Boreholes - Percussion and Rotary cored boreholes
19 N55 52333.204 14270.876 20 N61 52329.469 13933.471 21 N61E 52324.794 14100.047 22 N63A 51846.190 15621.496 23 N63B 51828.973 15250.642 24 N63C 51913.941 14934.487 25 N75 52108.072 14101.338 26 N75A 52091.450 14430.668 27 N75B 52075.866 14786.350 28 N75C 52077.876 15099.779 29 N91A 52074.594 14620.507 30 N91B 52325.245 14440.060

CURRENT INVESTIGATION
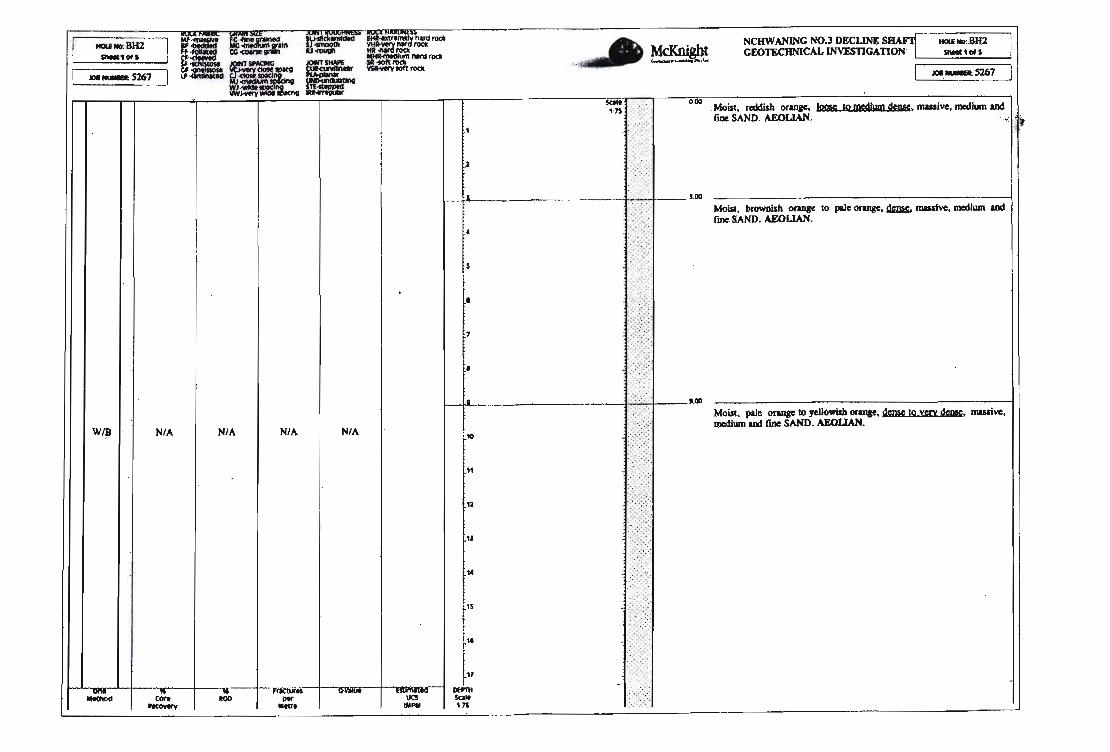
r--~ , IIOI.f No: BW SllM10f1
JelI_S267
:t'1~, """"" ~~, ~'~ 'fH,*-,-" .~har<lnx:ll If MC:~CPln ....- 1IMII-..rtllWdroct<,
i ' CG~ttPI.,ofOIIIII\ ~1\IrcI JOINT tHCINO JOINT_ • 10ft roct< roct<
1I " ~- ~ ~,lOttroct< ' WJ"""'~~ WI~~"""""'"
"", ' ~ Url[niohl ~~~ :.::=~~-
NCHW, ANING NO.J, DECUNE SHArl IIOI.fNo:,BJU i GEOTEClINlCALINVESTIGATION _101$ I
JelI_m7 i
'S::' :: :;:::; -,0-'» Moist. reddish oranae, lOOK Jo mcdjum dense. mwive. medium and
; ) '" 6noSAND. ~" IIJ
L------------J. .• .;.;liil - ~~~ ~ ~ ___ - J ;;~. 'J,;
:' .
~TL-... .... ' ··OO Moist, pale otqe to ycno.rilh 0fU1ie. !Jense to mY deQIe. mwive. medium aDd fine SAND.AEOIJAN.
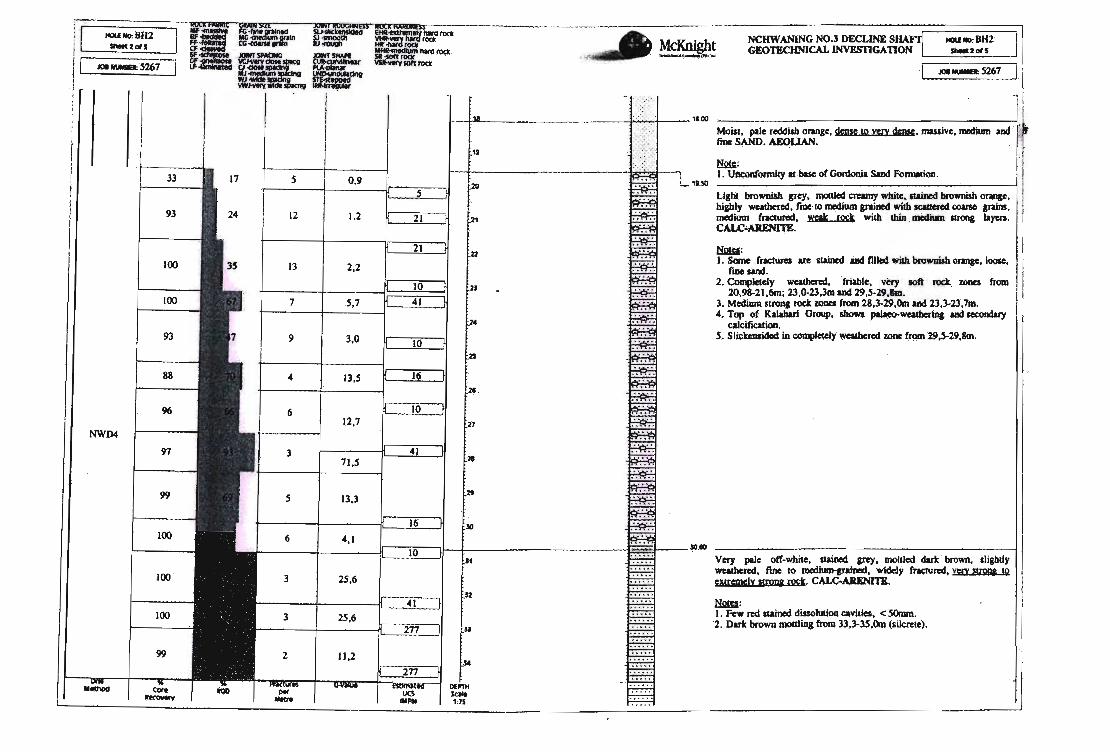
1 HOI.EIIO:BHl _Zots
C!i!"""'-'5267
33
93
100
96
~D4 ~ 97
s
12
13
1
9
4
6
3
S
tl!<I<
~'I
.. MrKnioh ' w;'~ ,,,,;=~:,~ NCHW, ANlNG NO.3 DECLINE SM HOI.E_JH2 ] GEOTECHNlCAL INVESTIGATION _2ots
... _5267
Moiu, pale reddish oranse. c!cnse to yery dense. mwive, modlum ~. ' fine SAND. AEOlJAN.
~: l. QllCOIIfomUty JtbueofGordonia Smd Formation.
Light broWliishgrey, Il)Ottklcl CIQI1I)' white, staint.d br<nvMb oranse. hiably weathered.IUM!IO medium grained with scaaercd eoane grains, medium fnctured. weak rack with Ihln . medium strong layers. CALC .. A1lENl11t,
Ml:!M: 1. Some frac:tun:a we stained andfiJled with broWlli5h orqe. loose.
fine sand. . ,.~ . z. ~Y' wealbeted. ' :triable. very '. IIO~ rock zqnes from
ZO,98-21,6m; Z3.<l"23.lm and 29,S·29,8m. 3. Medium stl'OllJroctrones from 28;J.29.Om and 2J.J..23.7m. 4_ TopofK~ Group. Shows ~weaIbcrin&and secondary
ealdflCalion.'" ' " " S. Slickensjded in c:ompIetely '\IieIlbered ume from 29 .S.Z9,~.
Very pale off-while, iI&inecl grey, moItJed darlcbrown. &UaJttly weathered. rme. to med.ium:-grained. widely fracrured, verv stropr,lg extn;meIy monK rcck. CALC-ARENlTE.
Ml:!M: I. Few red stained dissolutioo Clvities, < SOmm. ,2. Dark bro~ moulina froI)l33,3.3S,Om (si!crete).

. [ :f' ..... '=~E~ ~=a;lIanI rodI ItOUIIOoBHl .-.. . . '. '. lie; ' mQl'lirl. $1_ -.-, rodI. __ SOl S ~ Cl) grjin . 1.I-tOUIjII :..:::.= ! /S!I!IT.....".,~ JOIIfT_ SIt_rodI IlanlI'OC!I
JOI_S267 lF ~~ .~ ~JOft~ I{=-,,~ ~. WVJo'lt!Y_~ ........ _
McKnight '-" ___ t"....._ .w
NCHW A.NING NO,) DECUNE ::r1 I«JUiNo:BH1T
1 GEOTECHN1CAL tNVES'IlGATION 51.-5015
JOI,*-S261
1 100 73, 1
.... ',t '1'
99 " 22.1
99 S 23,1 Ir----=----.I J;T;.I IUO :-:-_-:-____ -,...-__ ...,,-_ ___ __ ---1
Very JI*le bRlWt\iJb grey to off·while. IUJbt)y wcalbmd. medium to very c:oane-p.i.ned. widely f'nIctuNct. I'IIIItriJL supported •. !QCdium IU'OIII!. 10 wonc M . PEBBLY CALO-ARENl'l'E.
97 6 11 .7
~~ 99 624,2
~ tt NWD4
94 17 16 1.3
81 _ 26
9
.~ g 6.1
12 12.3
---l _____ 1 7 21 .0
-- pe< MWe
[ '1
r ' ·!f
• L.
Ha: 1. Ctasu include fiDI.trained vo1c:ank: rock ItId sbaIe . ,ravels,
(2~2Omm). 2O~. dMUlrld80" mattix. JUO. ___________________ -j
h1~ . iTt)' 10 .rute. tnOUkdpale brown. lIIOd.mtely ~. interbedded very fine to COIrSe-pained, widely 10 medium fl'llCCUl'ed •. SllllQC' . rock With promiDa:a wgk rod: ZO!lC ffC!!JI O.o-SO.Om. cu.c.ARENJTE. . l:i!&ia: 1. Vet)'s11gbtly , Iickensided from 39,5-<40,4m.,44.Om and SS,3m. 2. S<:at1ered IraVels from 46,7 .... 7,4m and S4.9-55.1m. 3. lIIlerlayered weak ItId ItronJ 'rock below SOm. 4. Poor ROD from 44,4-SO,25m. .
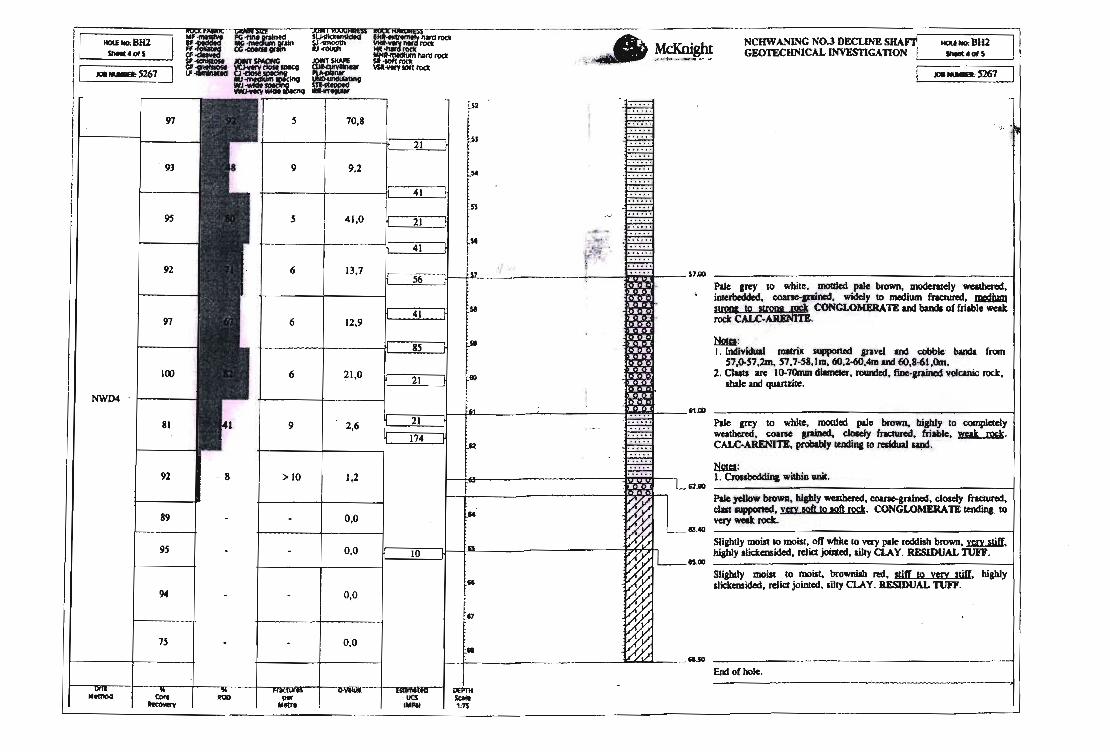
r--~"-S267
97
93
9S
9Z
97
1(X)
NWD4 '~ al 81
92 • ' 8
89
:-i 7S
5
9
5
6
6
6
SU1i~ $I_Ill II,I~
JOMSIW'E
~ ~ -.......
70.3
9,1
41,0
13,7
12.9
21,0
' z,6
1.2
0,0
IT. 0.,0
0.0
'f_nwfOdl YIIII,= nwfOdl
~lIItIIfOdI P_fOdI VMWrY_roa:
_. _ _ ._- NCflWA11lINGNO.3. D.ECLlNE~ __ BH2 \1 GEOTECHNICAL INVESTIGATION _un j
.q-.S261
.<
~ ~ [$7 ~ S7c.) I . 56 : ~. ' Pale pey to while. mouJecl pale ~ moderately wadIcnId. intetbedded.c:oane;~. wicIeIy 10 medium frItnItecI, IDIIiI1hIID IIItlQC to stroD& ."et CONGLOMERA TB and bands of friable weak rock c.u.c·AR.ENITE. . ,. ' I· ··· · .• '
HmI: . I , 'Indivillual Dtril supported &ravel 'lld cobble banda ftotn
S7,O-S7.2m, S7,7~S8,lm. ~.1«60.4m and 6O,UI.0m. 2. CIasu arelO-7<mn diametcr,l'OUIIded, fme-grained volcanic rock,
shaIc and quartz:iIe.
Pale pey to wbite,mouled pale brown, hi&hlY to compIddy weathered. c:oanegrained. cJo.eIy fractured, friable. mk rock· CALC-ARENlTB, .tmJbIli)' taldina to n:siduaI WId.
~: 1. Crcmbeddilll.witbinllllil .
Pale ydIowbrovm. hiJbly walbered, come-gnlMd, closdy fJ'lttUJ'ed. cJast lUppOIUId,ym 10ft to sOft rock. CONGLOMERATE~. to. very weak rocIt.
5liibt1y moist to moist •. off wbitc to VU)' pale Rlddish bl"OWll. Ym..Ui1I. hiably slidteosided. rdic:tjoinled, silly CLAY. RESIDUAL roFF.
Sliablly moist to moist. btowniIh red, Sift' to very d. hiahly s1.iWnsided. relict jOinted. lilly CLAY. IlESIDVAL roFF.
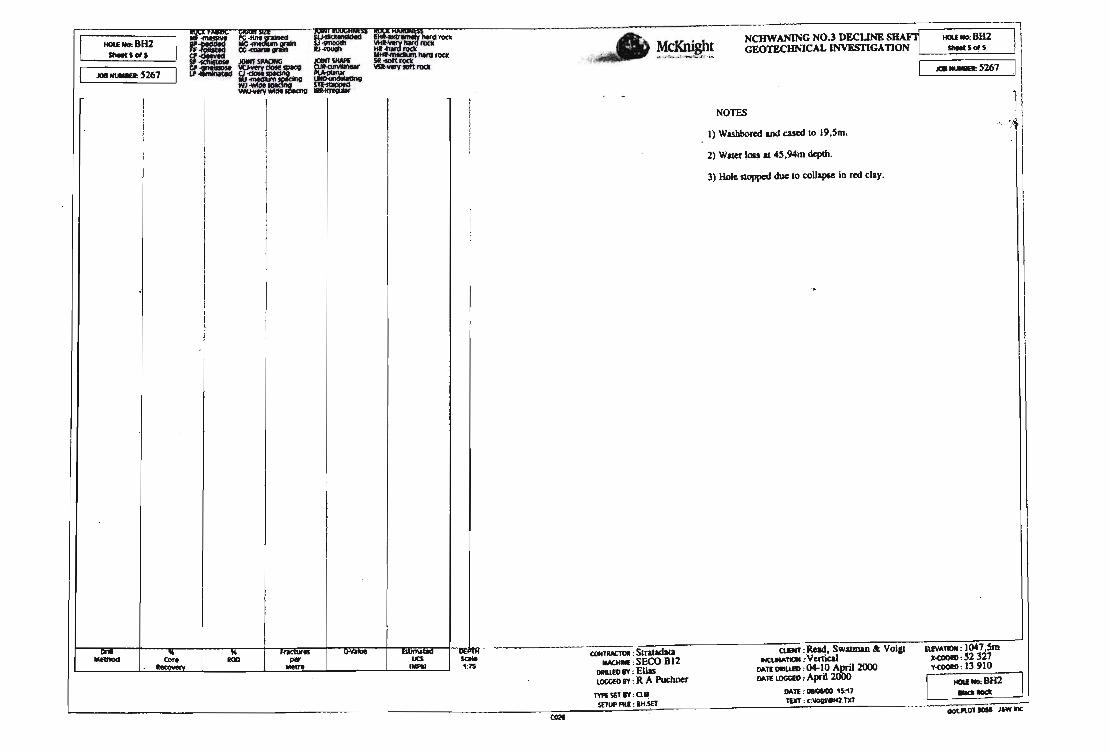
HCUIIO:BH2 __ Sots
__ S267
WtIIod eo..
;~ ~..a-- Fl5l!!P:f'lltt JOIHY'WONG ' JOINTSHAPI ~lI.WIIroca '.1ICJ.Wrt__ ~. vuw.ytOn'lltt fi,-<IOM.-e ~ WJ=,",~ S'll~ · lIWJ-\ItrV-~ ~
IIOD I*' --- ucs - -' :15
CIl2I
McKnight NCHWANING NO.3DECUNE S~ HOl.Ello:BHZ GEOTEClIlI\lCAL INVESTIGATION _SotS
... ,,,,~~ "; I" _''dO,l~~' l..o.
CQN'iIlACTOII : SlratIdata MAaMf : SECO B12
0IIUl0 IT , Elias lOCCEOIT : RA Puchner TYl'f<SfTIT ; ~.
SfTIH'~. : lIt.iu
NOTES
n Wasbbored and cased to 19.5m.
Z) Water ~ at 4S.94m depth.
3) Hole swpped due to collapse in red clay.
CUENf ,Read •. Swaunan &: Voilt ~1'1011 :VertiCal
Oo1\TlDIIIUSI ,04-10 AJ)I'il2O(JO Oo1\TI UlGCIO , ,t.pril ~
""TI : ~'5;11 TIXf : <::1IOOIWI42.m
C}Oa--S267 11
~ . ,;1
ElfVA1'1OII : 1047.Srn x.cooe:$1327 v.cooe : 13910
~~2 J --'
~1 JI)II JP'1n(

MINE DRILLED
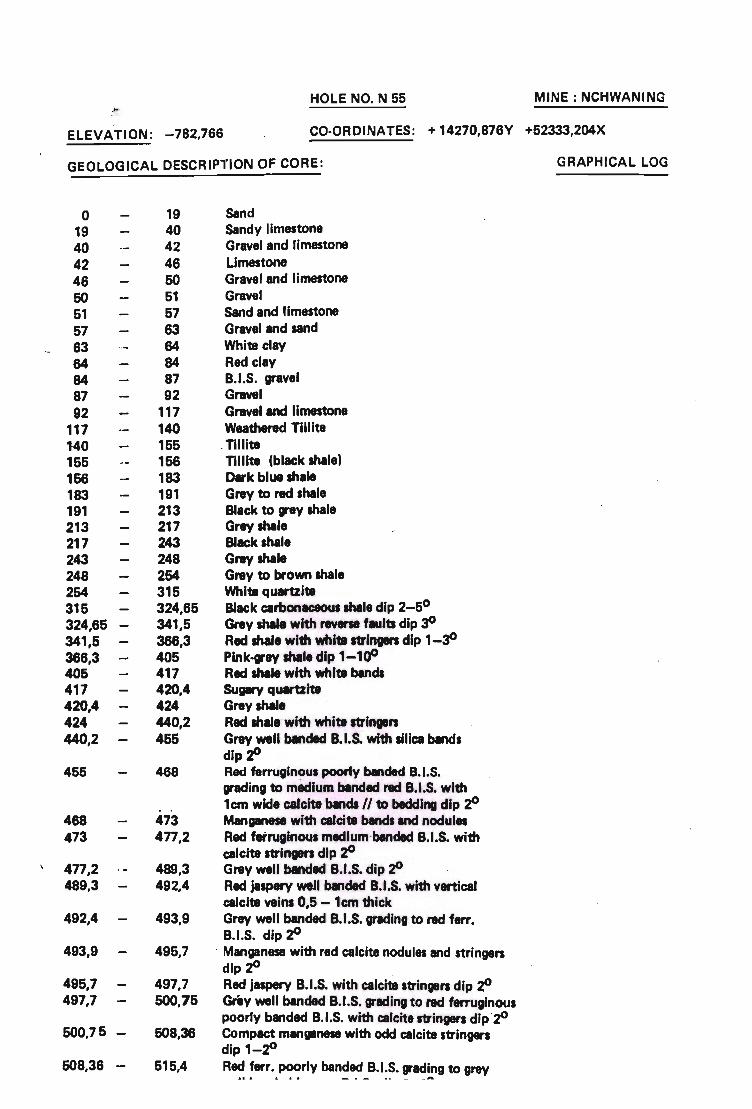
HOLE NO. N 55 MINE: NCHWANING
ELEVATION: -782,766 CO·ORDINATES: + 14270,876Y +52333,204X
GEOLOGICAL DESCRIPTION OF CORE: GRAPHICAL LOG
0 19 Sand 19 40 Sandy limestone
40 42 Gravel and limestone
42 46 Umestone
48 50 Gravel and limestone
60 51 Gravel 51 57 Sand and limestone
57 83 Gravel and sand 63 84 Whi18 clay
84 84 Red clay 84 87 B.I.S. gravel 87 92 Gravel
92 117 Gravel and limestone 117 140 Weathered T1111te 140 155 . nlllte 155 158 nlllte (black shale) 158 183 Dw'k blue shale 183 191 Grey to red shale 191 213 Black to "ay shale 213 217 Grey shale 217 243 Black shale 243 248 Grey shale 248 254 Grey to brown shale 254 315 WhI18 quartzite 315 324,65 Black carbonaceous shale dip 2-SO 324,85 - 341,5 Grey sNIe with rev .. faults dip JO 341,6 368,3 Red "'ale with whi1l stringers dip 1-JO 368,3 405 Plnk-wev shale dip 1-100 405 417 Red shale with white bands 417 420,4 Supry q...aite 420,4 424 GreysNle 424 440,2 Red "'lie with white strlngen 440,2 466 Grey well banded B.I.S. with silica binds
dip tJ 455 468 Red ferruglnou. poorly blnded B.I.S.
grading to rMdlum banded red B.I.S. with 1cm wide calcite bands 1/ to bedding dip 'Z'
488 473 Manganese with calcite '*'et. and nodules 473 477,2 Red fenuginous medium·banded B.I.S. with
calcite stringers dip 'Z' 477,2 489,3 Grey well banded B.I.S. dip tJ 489,3 492,4 Red jupery well banded B.I.S. with vertical
calcite veins 0,5 - 1cm thick 492,4 493,9 Gray well banded B.I.S. grading to red ferr.
B.I.S. dip 'Z' 493,9 495,7 . Manganese with red calcite nodules and stringen
dip 'Z' 495,7 497,7 Red jaspery B.I.S. with calcitlt stringen dip 'J!l 497,7 500,76 Grey well banded B.I.S. grading to red ferruginous
poorly ba1ded B.I.S. with calcite stringer. dlp ·'lfJ 500,75 - 508,36 Compact mangenese with odd calcite stringers
dip 1-'lfJ 608,38 - 515,4 R~ ~err .. ~rly ban~~ _B.I:~. ~a~!!,g to grey

PREVIOUS INVESTIGATION
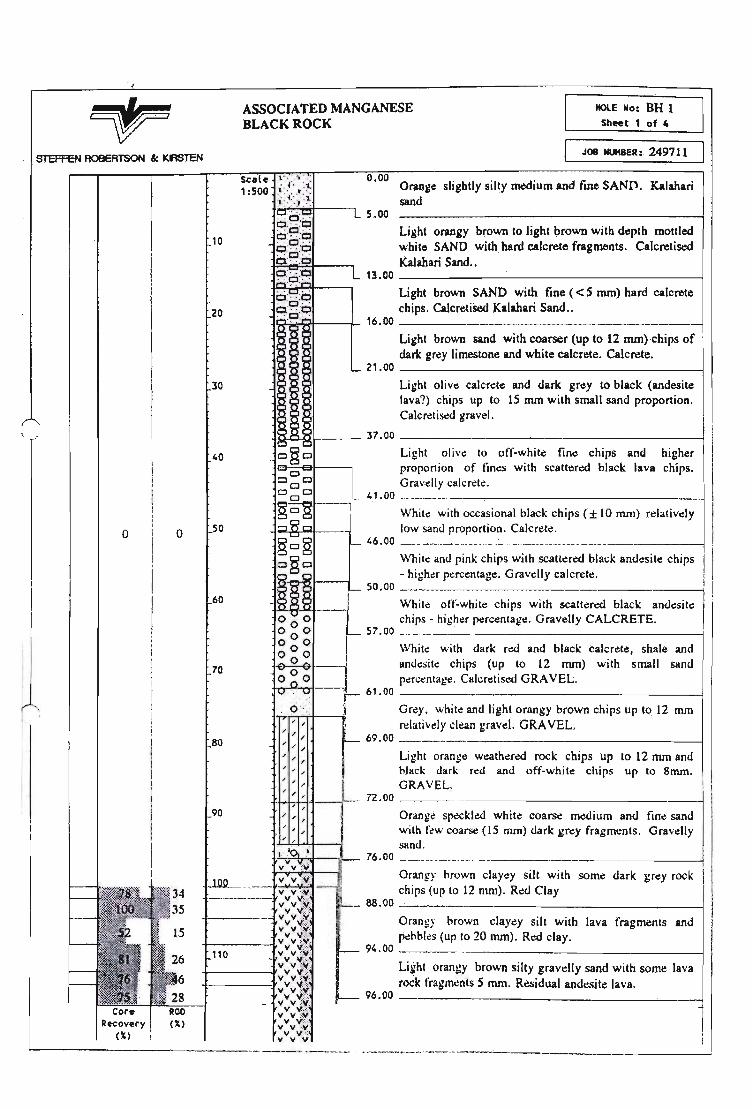
STEFFeN ROBERTSON le KASTEN
10
o o
70
110
ASSOCIATED MANGANESE BLACK ROCK
MOlE No: BH 1
Sheet 1 of 4
J08 tlUMBElh 249711
Orange slightly silty medium and fme SANV. Kalahari sand
Light otangy brown to light brown wit~ depth mottled white SAND with.·hard calcrete fragments. Calcretised Kalahari Sand ..•
13.00 -------------------____1 Light brown SAND with fine ( < 5 mm) hard calcrete chips. CalcretiSed Kalahari Sand ..
lQQ~----jL 16.00 ----~-------------__l Light brown sand with coarser (up to 12 mm)chips of dark grey limestone and white ealcrete. Calcrete.
21.00 ---------------------l Light oliw calcrete and dark grey to black (andesite lava?) chips up to 15 mm with small sand proportion. Calcretis«! gr.lveJ.
i~~W.+---- 31.00 ---------------------j Light olive to off-white fine chips and higher propo.rtion of tineS with scatter~ black lava chips. Grawlly calcrete .
41.00 .- - .-.. --.--... -~~--------------____1
White with occasiomil 'black chips (± 10 mm) relatively low sand proportion. Calcn~te.
46.oa '
While and pink chips with scattered black andesite chips - higher percentage. Gravdly calcrete.
50.00 ___________________ --j
While off-white chips with scatter~ black andesite chips - higher percentage. Gravelly CALCRETE.
57.00 .
Whit~ with dark red and black calcrele,shaie and andtlsite chips (up 10 12 mm) with small sand percentage. Calcretised GRA VEL.
61.00 ------,.---------------____1 Grey. whjt~ and light orangy brown chips up to 12 mm relatively clean gravel. ORA VEL.
69.00 .
Light orange w~tliered rock chips up to 12 mm and black dark ted and off-white chips up to Smm. GRAVEL.
f t-h++1---j-'- 72.00 -------... ------------ - -----j Orange speckled white coarse medium and fine sand with f~w coarse (15 mm) dark grey fragments. Gravelly sand ...
i."",,=,,~--;,.'t...- 76.00 - - ----------.----------- ----1
v v .
Orangy hrown clayey silt with some dark grey rock 1 li
chips (up 10 12 mm); Red Clay
88.00 --' "----- I Ql1lngy brown clayey silt with lava fragmenis and pehbks (up to 20 mm). Red c1ay~
94.00 ___ _
Light orangy brown silt)' gravelly sand with some lava rock fragments S mm. Residual andesite Java.
96.00 -~----------------__i
'------ - - -------_ .. _-_ .. _._--_ ._-.. - . --------... ----.. --~----
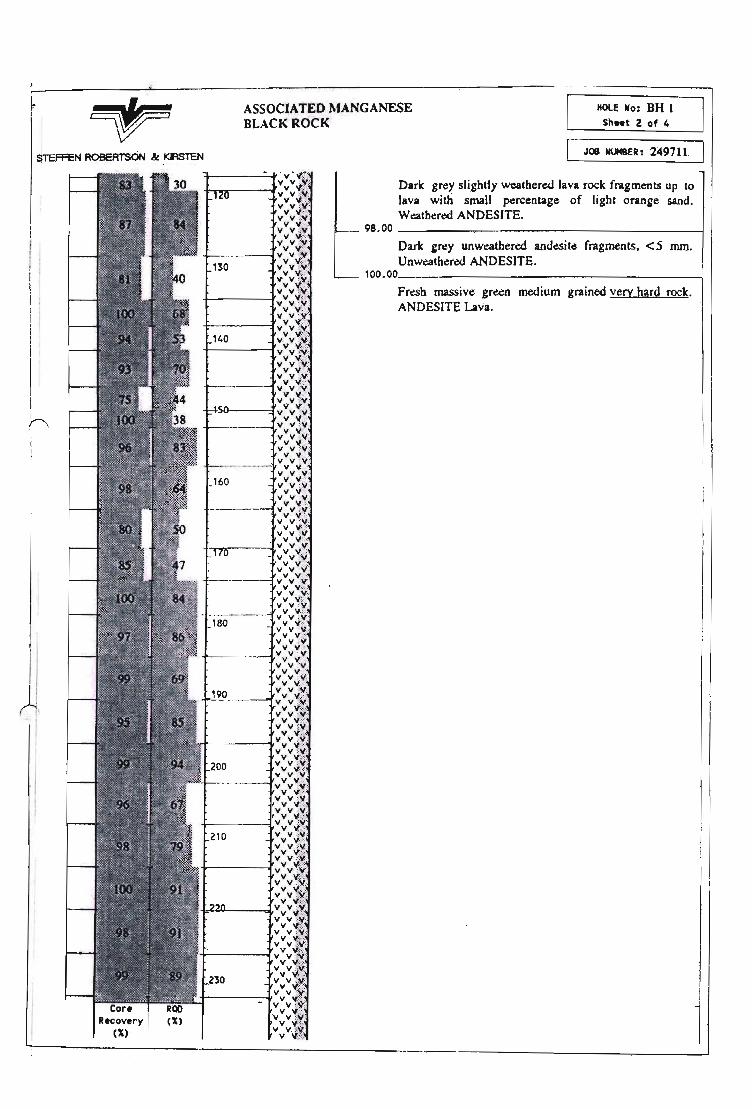
ST'EFFEN ROBEfrrS<.:)N & KmTEN
h
j
I
A
ASSOCIATED MANGANESE BLACK ROCK
HOlE 110: BH 1 Sheet Z of 4
J08· tlUM8ER: 249711
Dark grer slightly weathered lava rock fragments up to lava with small perCentage .of light orange sand. W~thered ANDESITE.
98.00 - ------------- --------1 I?arlcgrey unwea.thered andesite fragments, < 5 mm.
. Unweathered ANDESITE, 100.00 ________ ------- ------1
Fresh massive. gr~ medium grained very hard rock. ANDESITE Lava.
j 't-------- --- ---------. - -----____ ---l
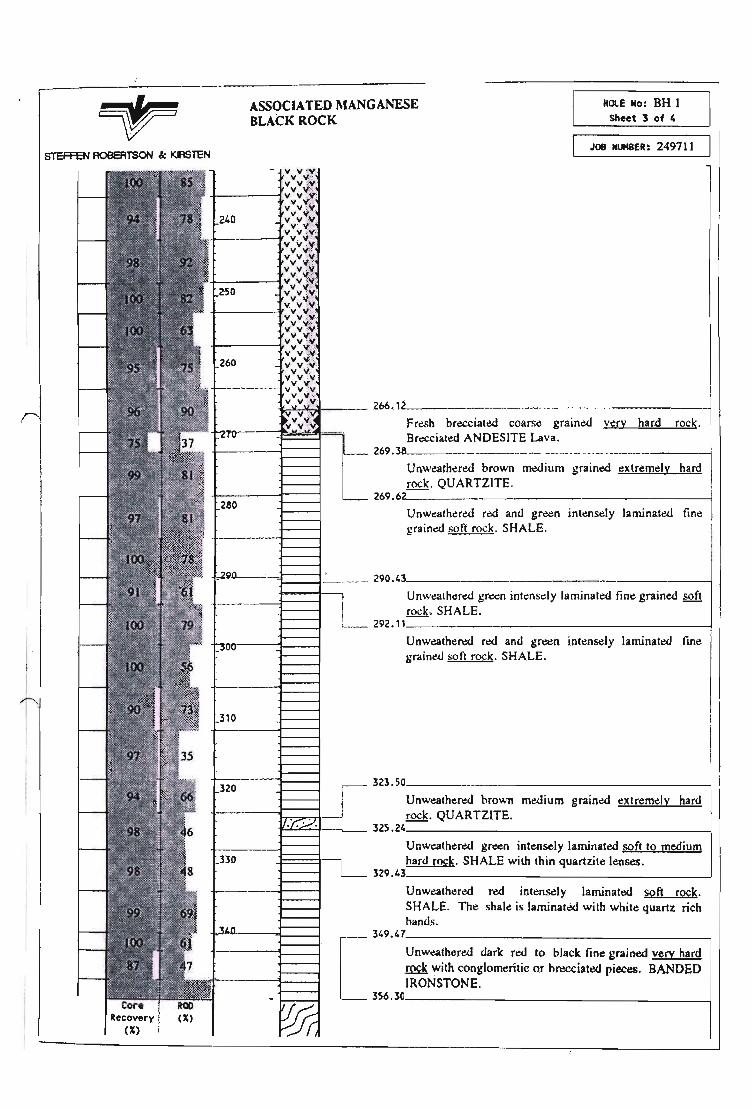
STEFFEN ROBERTSON &: KlFISlEN
ASSOCIATED MANGANESE BLACK ROCK
HOlE No: BH 1 Sheet 3 of 4
JOB MUM8ER: 249711
~~;i.I---~- 266.12-________ .... ____ .. - - --------1 Fr~sh brc:cciat~coarse grain~ v.ery hard rock. Breceiated ANDESITE Lava.
269.38"--__
Unweath.6r~ brown medium grained extremely hard rock. QUARTZITE.
269.6,<:-. _ ___ _ _ _______ _____ ---1
Unweathered red and gr~n intensely laminated fine grain~ soft rock. SHALE.
p~>~-~l==~ . .:...-... --... -. 290.43 _ _ _ _____ _ _ _ ________ --1
292.11
Unweaihe~ gr~n intensdy laminated fine grained sot't rock, SHALE.
Unweather~ r~ and green intensely laminat~ tine gr'.lined soft rock. SHALE.
323.50 _ ____ _ _______ ______ ---l
Unw~the~ brown m~ium grain~ extremely bard rock . QUARTZITE~
f::=::t-~- 325.24 _________________ ---l
Unweathered grec:n intensely laminated soft to medium . hard rock. SHALE Wilhlhin quartz.ite lenses.
329.43 ___________________ -1
Unweathim~d r~ intensely laminated soft rock. SHALE. The shale is laminated with white quartz rich hands .
_ 349.47 ___________ _____ -----1
'[ . unweather~ . dark red to black. tine grained very hard .!2£k with conglomeritic or brecciated pieces. BANDED IRONSTONE.
3S6.30 _ _______ _________ ---l
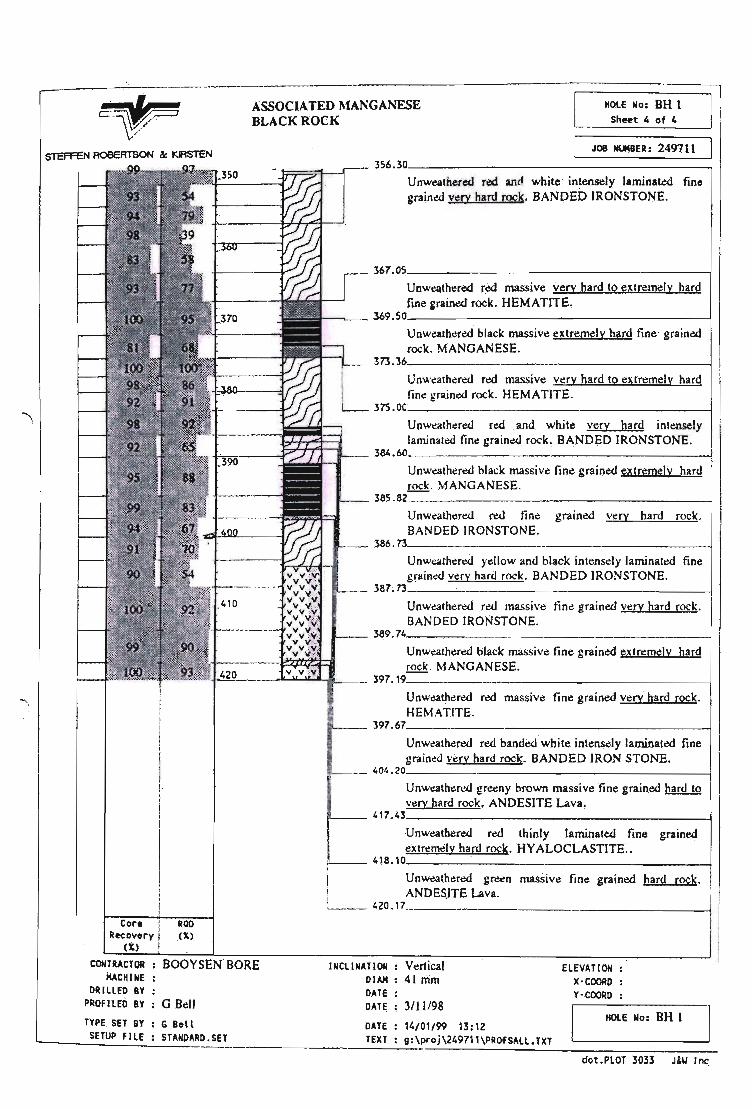
.--_~~..:c.-...~'---------" '---'--------'---------'--'-'
ASSOCIA TED MANGANESE BLACK ROCK
HOl~ No: BH 1 Sheet 4 of 4
JO$ NUMBER: 2491.11 356.~u_~ ______ ~ ______ ~ __________________ -;
Unwc:atheredttd and white intensely laminated fine gtain~ w .ry hard rock. BANDED IRONSTONE.
367.u~ ____________________________ ~ ________ ~
UnweI\theted red massi\'~ very hard ("extremely hard line grained r~k. HEM A TITE. .
--,.....~ 369.::>u ______ ~ ____________________ _i
Un weathered. blad~ massiveext.remely hard fine graiped rock. MANGANESE.
373 • .;)0;..----:-- ----.---------------_1
Unwcathered red massive v~ry hard to extremely hard fine grained rQCk. HEM I\TlTE.
3~.uu _______________________________ ----_1
Unwt!athered red and white very hard intensely laminated fine grained rock. BANDED IRONSTONE.
3S4 ... u ___ ______ _ .-:.. __ ~ ________ _"_ ___ -l
Unwealher:ed black massive fine grained extremely hard rock . MANGANESE. 385 .o, ______________ _ _____________ ~
Unw~athered red tin~ grained very hard rock. BANDED IRONSTONE.
386.,~_~ ___ . _____________ . ________________ .~
Unwt!athcred yellow and black intensely laminated fine grained very hard rQCk. BANDED IRONSTONE.
Unwt!ather:edred massive fiM grained wry hard rock, BANDED IRONSTONE. 389. ~ ___ ~ _________________________________ ~
Unwc:alhered black massive fine grained extremely hard rock. MANGANESE,
·~~-----~~~~---- 397. y ____ _ ___ ------------------------------~
tore Recovery (X)
CQIITRACl'OR : BOOYSEN gORE MACHINE
DafUED av : PIIOFlLeO av :. G Bell
TYPE. SET 8Y : C. 8ell SETUP FllE : STANDARD.SET
Unweathl!red red massive fine grained very hard rock. HEMATITE
I!'-___ 397 .67 ____ _ ____ ___________ ~ ___ _____'__~
Unweathc:red red banded white intensely laminated fine gr.ltned very bard rOCk. BANDED IRON STONE.
~~ __ .- 404.,~------------------------------------~
(Jnwt:athered greeny brown massive fine grained bard to . very hard rock. ANOESITE Lava.
~ __ -417. ~~ __ ----------------~--------------__ --~ Unweathered red thinly laminated fine grained extremely hard rock. HY ALOCLAS!ITE •.
!'-___ 418.1 . .
Unwt!athered grun .ma.sSive fine grained hard rock.
L __ 420.1 ANDES.ITE Lava;
lNC,"lNATIOH : Vertical DIAM ! 41 mm DATE: DATE : 3/11/98
DATE : 14/01/99 13: 12 TEXT: g:\proj\249711\PROfSALl, TXT
--------.------~-
ELEVATION : X-COORO : Y-COORO :
HOlE No: BH I
dot • PLOT 3033 J&1oI1 ~

APPENDIX C
LABORATORY TEST RESULTS
STANDARD TEST METHODS TMH1 (1986)
TECHNICAL METHODS FOR HIGHWAYS
TMH1 STANDARD METHODS O'F TESTING ROAD
CONSTRUCTION MATERIALS
First edition 1979
Second edition published in 1986 by the Nationallnstitule for Transport and Road Research of the Council for Scientific and Industrial Research PO Box 395 Pretoria 0001 South Africa
Printed in the Republic of South Africa by Graphic Arts, CSIR
Second edition
1986
ISBN 0 7988 3653 9
TMH1, pp 1 - 232. Pretoria. South Africa, 1985

Preface
Foreword
CONTENTS
Page iii
iv
A Tests on soils and gravels
Method A 1 (a)
Method A 1 (b)
Method A2
MethodA3
Method A5
Method A6
MethodA7
Method A8
Method A9
Method A 1 O(a)
Method A 1 O(b)
MethodA11T
Method A12T
Method A14
Appendix to Method A14
Method A 15(a)
Method A 15(b)
Method A 15(c)
Method A 15(d)
Method A16T
MethodA19
Appendix to Method A19
Method A20
MethodA21T
MethodA22T
The wet preparation and sieve analysis of gravel. sand and soil samples ... ........ .. ...... ..
The dry preparation and sieve analysis of gravel. sand and soil samples .. ........ ............ 9
The determination of the liquid limit of soils by means of the flow curve method .......... 11
The determination of the plastic limit and plasticity index of soils .. .. ............................. 17
The determination of the percentage of material passing a 0.075 mm sieve in a soil sample ..... .. ... .. ............... ..... .. .. .. ... ... ...................... ........ .. .................. ......... .................. 19
The determination of the grain size distribution in soils by means of a hydrometer ....... 21
The determination of the maximum dry density and optimum moisture content of gravel. soil and sand ........ ................ ...... .. ...................... .. ....................... ............ ........... 27
The determination of the Californ ia Bearing Ratio of untreated soils and gravels ......... 35
The determination of the California Bearing Ratio of lime-stabilized soils and grav-els ..... ... .. .......... ....................... ... ..... .. ... .. ..... ......... ..... ...... .. .... .......... ..................... .. ....... 47
The determination of the In-place dry density of sailor gravel by the sand replace-ment method .............. ............ ........... ... ..... ..... ........... ... ... ....... .... ........ ........ .... ...... .. .. .... 49
The determination of the in-place density and moisture content of soils and gravels by nuclear methods .......... .... .... ........ .. ..... ... ..... .. ..... ............ .. ... ....... ... ..... ......... ...... .. ..... 55
Tentative method for the determination of the maximum dry density and optimum moisture content of graded crushed stone and cohesion less sand by means of vi-bration compaction ... ......... ....... ......... ..... ....... .. ............... .. ...... ........... ..... ........ .. ... ..... .. . 63
Tentative method for the determination of the relative density of soils .. ... .... .. .. ............ 69
The determination of the unconfined compressive strength of stabilized soils. grav-els and sands ..... .. ...... ..... ....... ......................... ... .......... .. ................. ....... ..... ... ....... ...... . 73
Procedure for the making of speCimens for the determination of the un confined compressive strength of stabilized soils. gravels and sands ... .. .. ............. .. .... .... ...... .... 75
The determination of the cement or lime content of stabil ized materials by means of the Ethylene Diamine Tetra Acetate (EDTA) test ................. ...... .. .. ............................ .... 81
The determination of the cement or lime content of cement-stabi lized or lime-stabi-lized materials by means of a flame photometer .... .............. .. ........ .......... ....... .......... .... 85
The determination of the lime content of lime-stabilized material using ammonium chloride .. ........ ... ... ........................... ... ........ ................ .......... ....... .. ........ .. ..... ................ 87
The determination of the cement or lime content of stabilized materials by means of the back titration (acid base) method . ..... .......... ............ ..... ....... .... .... ......... ...... .. ...... ..... . 89
Tentative method for the determination of the indirect tensile strength of stabilized materials ..... ...... ........... .......... .. ... ... .. ... .. .......... .. ..... .. .................. .. ... ...... ...... ...... ............ 93
The wet-dry durability test for cement-treated materials .. .. .. ........................ .............. .. 97
Procedure for the making of specimens of soil-cement for the wet-dry durability test ... ......... ......... ..... ..... ..... ..... ..... ........ ... ..... ......... ....... .... ... ... ..... ................. ................. 98
The electrometric determination ofthe pH value of a soil suspension .................... ...... 103
Tentative method for the determination of the conductivity of a saturated soil paste and water .... ........ ...... .... ... ..... .. ... ........ ..... ....... ... .. ........... .... ..... .. ............. .. .. .... .. .. ....... ... 105
Tentative method for the quantitative determination of acid-soluble sulphates in soi Is and aggregates by means of a nephelometer .. .. .. ..... .. .......... ... ........ ....... ....... ....... 113
v

GORDONIA FORMATION SANDS
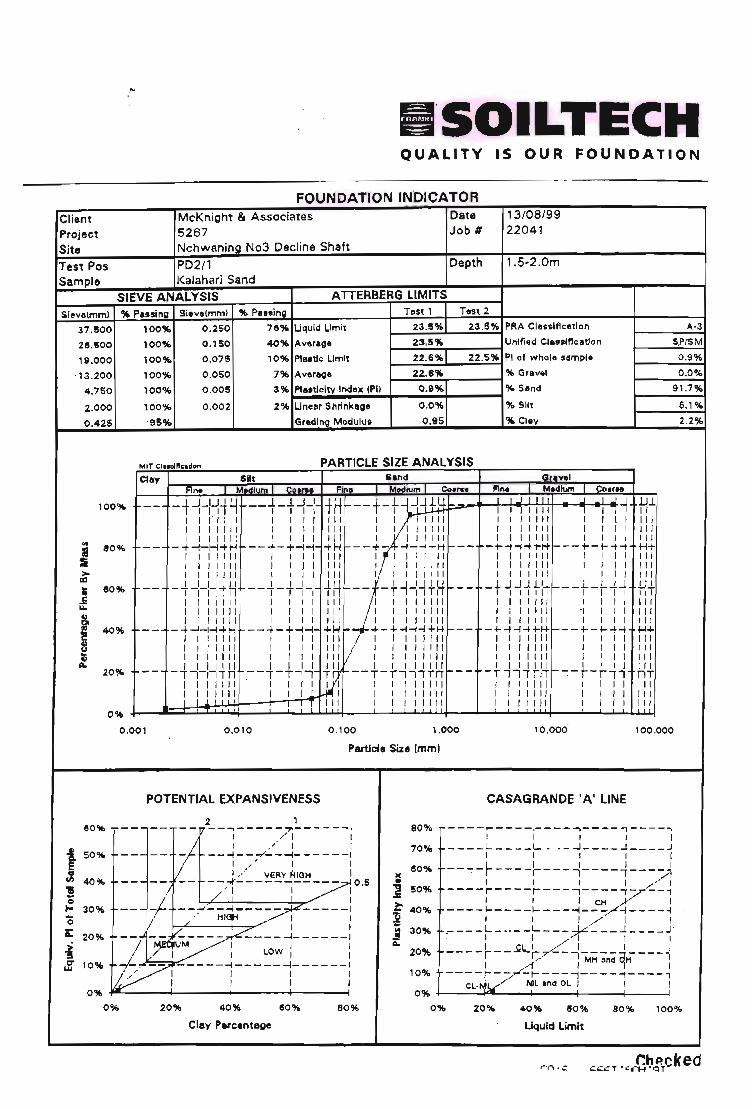
B'SOILTECH QUALITY IS OUR FOUNDATION
FOUNDATION IN'DICATOR Client Project Site
McKnight & Associates 5267 Nchwaning N03 Decline Shaft
Date Job #
13 /08/99 22041
Test Pas Sample
PD2/1 Kalahari Sand
Depth 1.S-2 .0m
SIEVE ANALYSIS A ITERBERG LIMITS Sieva(mml % Passing Si."e(mm) % p ... ing Tost 1 Tast 2
j Jl .. 0 I-
--0
E
·i I:r w
37 .!S00
28 .!i00
19.000
1 00%
lOO""
100%
lOO""
0 .250
0 .150
0.075
0 .050
76% Uquid Limit
40% Average
10% PI •• tlc Umlt
7'lb Averaga
23.S% 23 .5% PRA CI.sslflcetlon
23,5% Uni fied CI ... If'lcatJon
22.6% 22 .5% PI of wnolo Slmpl.
22.6% % Gr.v.1 ' 13 .200
4.750
Z.OOO
0.425
100% 0 .005 3% PI .. tlclty Il'Idox (PI> 0.11% % S.nd
lOO"" 0 .002 2% l.incllr Shrinkage 0.0% % Silt
' 95% Grading Modllh.J8 0.96 % Clay
PARTICLE SIZE ANAL VSIS Clay Silt .. and Gr .... 1
An. Iiltiuru I CQ ,r .. Fi,,, M",lum I eo.,... "'- I Medium eo.,.. 100% -- --t-LU.1 H __ .1_.1.-1_1 tH r--t- t .J.J_HU l Ll! I .1 .J .J lU
I II 1 I I I I I I 11 III i I 1 I II1 I I r I I 11 I I I I I I I I I 1 11 11 I I 11 II I I I I I II I I '" 11 I I I I I II I I I 11 II I I I 1 11 11 I I I I I II .. I 11 I II I I I I I I I 1 I I I 11 11 I I 11 I II I I I I I II
• 80% -- - -t -I-I_i -t H ---t--t-i_i +H --+- -I -"'-1 -r I-t --- -~-I-I-I~I+ ---+--;- +-1 ti+ S I I I I I 11 I I I I I1I I I 11 11 11 I I 11 II I I I I I I II
I I 11 III I I I I I 1I I I I I 11 11 I I I I II I I I I I III > I I I 11 11 I I I I I II I I I 11 I II I I I I II 1 I I I I III ell
at eO% -- - f -H-HH --+-+-H- I II f--- - t -H-HH f--- _ l J .J Jl.I.l 1---l.-LU I 1I I n I I I 11 11 I I I I in c: I I I 11 I I I I I I I II I I I 11 I 11 I I I I '" I I I I I1 I u:: Cl I 11 11 11 I I I I I II I I I Ii I 1I I i I I I " '1 I I I III Cl I I "Il l I I I I I I1 I I " 11 11 I I I I II I I I I I I 1I III 4O~ -- - -+ -I-I-I -+H ---+-+-++ -+-1-1- -+-- + -I+4H-+ --- -+-I_I-iH+ ---+-+- 4-4 1-1-+-! I " I III I I I I II I I I " I I " I I I I " I I I I I II I 41 u I 11 II1I I I I I I II I I
I "" I I I " I II I I I I I1 I
ai I I 1 " " I I I I I II I I I I I I 1I I I I I I " I I I I III Cl. I I I I " I I I I I
W: I I I " II I I I I I I 11 I I I I II1 20% -- -T,-,- l1' n --T-T i -j- f---T-T-'-"TrT f--- -r "''T rlT 1--:-r-rTl TIT
I " I III . I I I I I I I I I "" I I I 11 I 1I I I I I I II : 11: II I I I I I I I I I 11 11 I " " " I I I I I II
I [ III I I I 11 11 I I I I I I " I I I I I II O~
0.001 0 .010 0 .100 1.000 10.000 100.000
Particle Size (mm)
POTENTIAL EXPANSIVENESS CASAGRANDE 'A' LINE
2 1 --- -- --I7'-- .... -----~--- - -- .
I /1 I
--- -- I --~- :7::~_1------ i I ,/ VERY i-HQH I
----- -- --~-----_i----- 0 .5 .I / ' I I I
I . I ---;1- -/~:-'-H,~--X-----i
-/~ ~~-~~:------! ~ ---:-----:------1
0% ~------~------_¥------__4--------I
80'11>
50%
40%
30%
20%
10%
80%
70%
60% • • :2 !i0%
> 40% -~ j 30% Cl.
20%
10%
0%
----~----~---~----,---- , I I I I I ____ L ____ '- _ .. _..J ____ ..l ____ J
I I I I I
--~-~----~--- ~----i---- ~ I I I I /, ----r----,---,----,- ~-,
----~----~---~-:~-- ~ I I I /", I I :- ___ L_ .. __ '- _ __ ..lL ___ ..l ____ j .
. I I ... T I I I ~I...I /' I I I ----r-- r.T--~----9-----.... I MH and H I I A I I ----r-- -r---~----~---- ,
Cl-~!w'/ NIL In<l OL I I I
A-3
SJ>/SM
0 .9%
91 .7%
6.1°4
2.2%
0% 20% 40~ 80," 80% 0'11> 20% 50% 80% 100%
Clay Percentage LiqUid Limit

QUALITY IS OUR FOUNDATION

~'" "
DAlE I , . ~. __ 0\
J08 No
TEST No A • SHEAR BOX TEST
..... .. . .. . .. , • • ', • • • -, . ....... .. .. . ~ ••.• • "'1 *" ... ... ... .. , .. . "'f ~ •••• IO ~ " ••• l' ~·", . " ...... ... . .. I . " t . . .... , ... , .. ~. , ',." • • I . -... _ •• ~ .. . ... . ... .... .. . :. "' , ... .. ... -•• • ~ o f 1'0 .... . ........ -.. . . ... . . .. . . 'O ... ..... ... ... . ... '
1't'P£ OF TEST 1 Qv; c k $£RIAt.. No: 17 "" '1 SNotPL£ Ct$CRJPnON :
, ......... ;, .. ,,, ..... ,.,, .. ,', ...... .............. .. ............... ..................... l~.!fi.~.~ ... p.p. :J.~~.~~: ... '-'.~ .. i ,, :?:~ ....... . ,-'$-1.0 ~ 1·'oc.O
SNtIPL£ DEP1H! ".'S-""o RING CONST",," ! €> ... <CI...... , . 'S.S.',o ~ \ ·I'S."">
" . -.- . .... ... ........... ,;, . ...... .. .. . .. ; •• :. . . .. .. . , ... .... ,., . .. ... , , . ... . .. ... . ... . , , .... .. "' • • 1> ,. j .. ~"t .. ..... . ' I t I ' '* t I .... . ... .. , . .... .. " .• • " 4 ~ ' " .. ~ . .. ~ .. .... ... ,. . _ . .. , ... t . .. . . .......... .. . "¥ ~ .. f · ......... .. ~ ••
WAOIH£ No: (~., S
Conv.rtH Lood kN/ml
NIN '"
4
l '
t 10 11 12 13 14 15
17 1. 19
21 22
25
28
Hor1%OIIt~1
Oi.ICJc-m.nt
.
moxlmum,.
Provino "ricol Ring I)IQI 01<11
R~in9 Reqdll'i9.
L . ~
PnMflO <
Rl"9 DIcII
R~cr"'9
vwtlcal ProYlri9 Dicit , Ring DiGl
R.odlr\9 Rwdlng
"..,
\?s
Y.rtICGI 1)[01
Re'CIdlng
~I
S',Oll TE C H·
Pnwfng
Rln9 Piql
Rwctlno
Ver:ticol 0141
Reo<lin9

1'"' ~
DATE
JOB' No
TEST Ho
•• AR 191 TESl
SAMP!.! 0ESdV110N: . .. .... "' ............ ..... . , ............ "': .... .. , •.• 0' ' .. .. , ~ j • •••• ,. • ••• " .,
t.-::.! ~:.~.:!.,~.'-~.~'.L~ ..... > .. " . , .. .... . . . " . ..
.... 2
RESISTANCE kN/m xl00
SOILTEC·H·
• c •
kN/in2 Oe:~EE
14
12
108 -!le
~
" 8 i
~ 6 ~
~ z
4
o
RED CLAY

IIS0lLTECH QUALITY IS OUR FOUNDATION
Client Project
ite
Test Pas
FOUNDATION INDICATOR Mcl<n ight Geotechnical Consu lt ing Nchwaning No. 3 Dec lin e Sh'Clft Nchwaning M ine
BH 3
Date Job ;;
Depth
Sample Sample No.
SIEVE ANAL VSIS ATTERBERG LIMITS
Sih.(,.nml % Pall In ... Sieve/mml % p ... ing TeSll T .. t 2
37 .500 100% 0.260 99% liquid Un,it 85 .0% 84.6%
26.500 100% 0 . 150 99% .Averblle 84 .8%
19 .000 100% 0 .075 97% Plutlc Limi t 52 . 2% 51.5%
13 .200 100% 0.050 88% Av.,.ge 51.8%
4 .7$0 100% O.OOS 43% PtMti·~ity I"ele" iPIi 33 .0%
2 ."00 lOO .... 0 .002 38% Li'leM S hrink~\I . 14 .0%
20 i04 /2000 22456
6S .2S·6S .Sm
PRA CI ... ificltion
Unified Clu,lIlc'tion
PI of whole temple
~. G r ti v ~1
.... SMd
% S li t
1\ ·7·5 (20:
MH /Of-
9 . 1%
63 .1 %
0 .425 100'11> Gradir,,. Modulup 0 .03 .... Cl;) \, 37 .7%
MIT CI ••• lriclUOr"
Clay Fin.
100 %
, I
PARTICLE SIZE ANAL VS IS
.. : ~.
~"'; l : I : 11 : ! 11: • I ' . .
150,*, . ,--- - ' 1' "r";'ij" f " T -l';:r" j", ' ; :'; ; j . ! :i' ,' ' ll· ;·rn, : : : : I ;.! ·" 1 i I ' : I : I I : i ':
", ' : I ,II ~ IJ I1 I ,; ! I I I : 11 : 11: 111 1: 1 ill i I ; I I l i !: '1 1 ·:' :1' I 1 1! : ld " Ill!! :'
!.I.l L:_ - - L " L.l.J I .!.. U , __ _ J. -.l_l " U-1l.lt- _ 1_ . . _i_.1..L .1.:.J.Ll. ___ t-l....LJ .1 U I ! I 11 : I I: : : I I : I , , I ! I I I! ; ,, : III I I 11'" i ll ll ; I i I : "1 ' 11 1 '1 11 " II !!,I : 1, 1111 11
; i : ; III I I I 11 I I I ,' , I I I I I I j , : I : I I " I ' I I I I i , I l i llll,1 1 1 ' 1 1111 ,1 1!'I:'j 1 : 1 111 "1 ~ I!I!" I
.• . ~ - ~ ~ :.. I ~ !1- .. -.-:- ... '- -+ ~ ~ +' ·1 to. - - .!. - -+-1 !,- ' ',:'-,: ~I' liT -- - - I" .. '- ~ -I- l.. ~ .1..; •• • - - .;.. - ~ .... - I .q J
! " . 1 " . 1 ' 1'" .. :l : ! I ! ' ; " ~ . I III, i I I , : I : : I i i i : ; 1 ! : • ! i I " i : iI ! I I ! 11 I
40%
20% . ; ! . I! ! , . , I . I ! ,' ! I ! . I 11 II I i I !' 11 I")
I I : j, i! : :: ' :: i I 'I ! II : I 1/ 11 O% +---~------~~--------~~----________ ~ __ ~ ______ ~~ __ ~ __ ~~~
0 .001 0.010 0.100 1 .000 10 .000 100.000
Particle Size (mm!
POTENTIAL EXPANSIVENESS
~ !O % . . . " .. ~"- _. f'1 - . -'1'
: I! i 1 : .. I
· · l---~--- .. :rl ' - 1
j , ... ! . +". -fl" :: ... !-.... ~ 50 .... -- . - . - _ ... . 1 " - • • - - .
l 40% v ERy HIGH
~ ... -... .t .
~. - ... .. ~ '0 i " HIGH
a: 20~ . . f' ME~t: .-':~~- ~ ' , : I
LIJ'~ <>L ' I L ' ~ , .." : L.0'l\ ! I 10", + .'t .-",--"".~" .---- - -~---- ---I- - . ---_ i
; I ..- I I I
0% /:~~ ---L. .. ----.l---... J 0% 20% ~O% 150% 80%
CI!!!y Percentllge
" ..
CASAGRANDE 'A' LINE
&0% .,. - - _.- r " - - -,- _ .. ... . .. , - .- - - -( _. - - - 1
i I I I I I 7o, ,j ... . ,---- .• ; .. -_. _ .- :-- . .. , .. ...,_ .. . .. _ .. .. _ .8 _. " .1
60%
~ 50'~
~ 40 % :g CH
0; III ~
30 ..... r I
20% _I' . . ' Cl I ... ~ .. ::. __ .~ . I ._ ... . _ : I ' •. ' , MI4 .~J OH
. ./! , I
10% r --.~~~~~ ~. :; .. -' -~"Z: ;-nd OL~- --- ~ .' - - - i O"~ .-.----. , ~_ I ~
0% 20% 40"/0 150% eo% 100'11>
Liquid Lhnlt

HSOILTECH Q U A L I TV ISO U R F 0 U N OAT ION
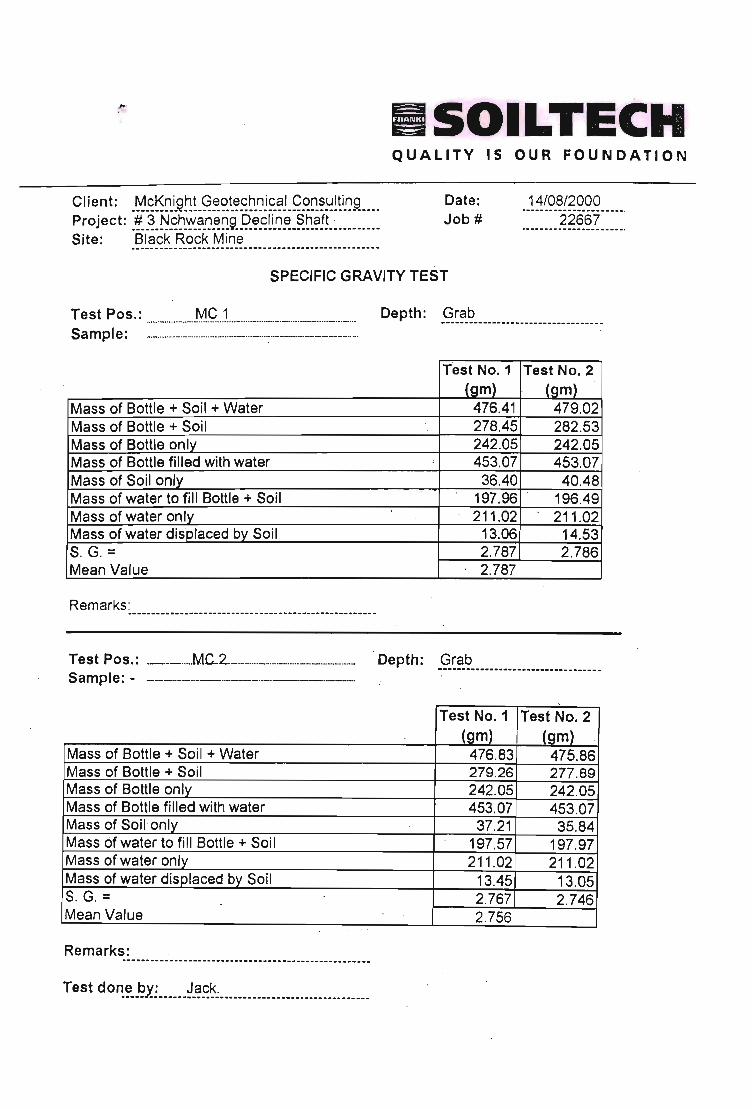
ElSOILTECH QUALITY IS OUR FOUNDATION
Cl i e n t: .~~~~.i.Q~~.~~~.~~~~.~J ~~J.~~~~.~ ~~i..r:~L. .. Date: 14/08/2000 ... --_ ..... --- .. ----_ ............ . Pro j e ct: .~ __ ~_~~~_~~..r:~~~ . .I?~_,?~iD~.~~.~!~.~ ........ . Job # 22667 Site : Black Rock Mine
SPECIFIC GRAVITY TEST
Test Pos.: _._ ............ ___ ... M.g_J .. __ ..... __ ...... _ ....... __ ..... _ .. __ ..... _._._ ... _ Depth: _Ci~~.~ _____ ._ .. ____ ... _. _____ .. _ .. S a m pie : --.----.. -.. - -.. ---.. -.--.-- ... : .... ---.-.. - .----.-........ -..
Test No. 1 Test No. 2 (gm) (om) , .
Mass of Bottle + Soil + Water 476.41 479 .. 02 Mass of Bottle + Soil 278.45 282.53 Mass of Bottle only 242.05 242.05 Mass of Bottle filled with water ; 453.07 453.07 Mass of Soil only 36.40 40.48 -Mass of water to fill Bottle + Soil 197.96 ' . 196.49 Mass of water only 211.02 211 .02 Mass of water dis'placed by Soil 13.06 14.53 S. G. = 2.787 2.786
. Mean Value 2.787
Remarks:
Test Pos.: __ . __ ... _.MG..2 __ __ ..... _ ... _._. ______ ._._. __ .__ . Depth: _Ci~~_~ ______ .... _ .. ____ .. _ .. _____ . Sample: - --------.-----.------.. - -
T~stNo.1 !TestNo. 2 (gm) I (gm) .
Mass of Bottle + Soil + Water 476.83 475.86 Mass of Bottle + Soil 279.26 277.89 Mass of Bottle only 242.05 242.05 Mass of Bottle filled with water 453.07 453.07 Mass of Soil only 37.21 35.84 Mass of water to fill Bottle + Soil 197.57 197.97 Mass of water only 211 .02 211 .02 Mass of water displaced by Soil 13.45 13.05 S. G. = 2.767 2.746 Mean Value 2.756
. .
Remarks:
Test done by': Jack. --_.- .---- .. -._ .. _-- ........ .. .... _ .. ---- .. _-----_ .. --- -----_ ..... ..

·HSOILTECH
Client: .M~!)l~!!t§_~~!!, .. ~~!!.iE.~LC?.9.~'!ttl!)}l._. __ ..•... _, Project: .!_~;...~ffi~~!!_~t'ig!c:!in~.~l1!~ ________ . ___ . __ . ___ . Site: Black Rock ... ------............. -..... __ ..... _ ...... ----.. -.-"!'----... -............ .
VOID RATIO
Remarks:
Test done by: Jack. --... _-... ------------_ ............ --...... -----_ .. .
QUALITY IS OUR FOUNDATION
Date: Job#
14/07/2000 ------22667" -.--_._._-----
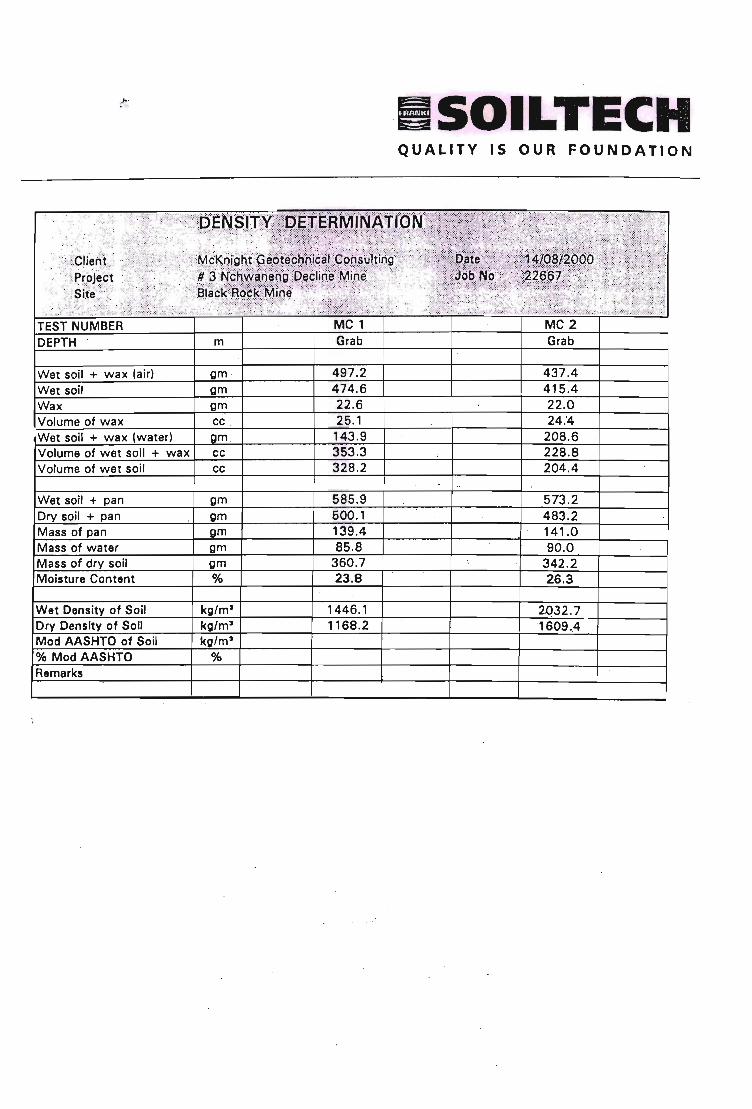
·E!SOILTE'CH QUALITY IS OUR FOUNDATION

CUENT MC ,PROJECT No
Aan,~_nd. Druk Applied Pr.llur.
kNI.m2
'-e 11
I ; 25
eso 125
250
500
'000
2000
1000
600
250
125
eso 25
11
0
11
25 50
125 250
500
1000
:zooo"
DATE ~/ , g-·~ooO
JOB No
TEST No AA
KONSOLIOASIE TOETS - CONSOLIDATioN TEST
Fi",l. Dilct, Mot\It.r M.t«,,,I,,; Veranemln; Hooot" Fl"" Dial Changeln Sampl, RtMl in; Thicknft. , Thickn.ss
mm AH mm H mm
() ~,OOO
-1.(11 'I ?-I. 'HY
-1.~4~ ?.\ . 9'i~ -to,,,,,, :U.141 -I. SIt.. ' "t, 'Slt
-J. ,."4 1.. C. ' 1-(.'1
- .t\~ ,0, "C\ le;; ~ , -.4S~ . '-0. ~S'i
~t5~ It;. ' g~~ :.
_ . O I L.. 2D. 'o t(" : _, !).O~ w. ':O'S _.Lt?-"l. 1-1). Lt 7.1.
-·"&.l ,,0. ''-"L - .qql,. ~, C\ ~(.
-I·"'~ ,,,-\. ,..~c.
-I·~C. "'\. ~':-t.b
To.u Nt. Tlst No.
Rulmll Hoogt. Rulmt. H.lght of VERnocidlng Voids Void Ratio
e· H -HI
HI tMoIs mm
" .'
7 , CC5i 'I ~~q , ) , .. ·ibw( .< ,
,' ·9'0, . '1Q) '1;4
, .. .. 'lSJ ; < , ·11l. "t
, .r..iL.. -, . (.~(
, ' L$O
' '~b~ ·c"R'1 ';0"1 . -1)(
-IS5 ',S5
KONSOllOASIE PARAMETERS - CON~OLIOATlON PARAMETERS .. Ttr,~~n ~nst'l t:o::: ~.:.!: " FI mol, T. I, ' .1-.
VOI.VME ~~~~. eo·
108",.--109,0 't VOLUME 0:;;:" .\.-. , O~I.T~.i:nouaIl'1D Av---
r'_ 'r 0,42.
~!,=.~~lttn .. CI 11.. 1 " ,Itv Mv-- le - ..
eo, t $t.Po 1 + ,L 4-- ;
SOILTECH. , ~ " , i :' •• ~. ~ ~ t· • .
. ,. ;., .
R
,
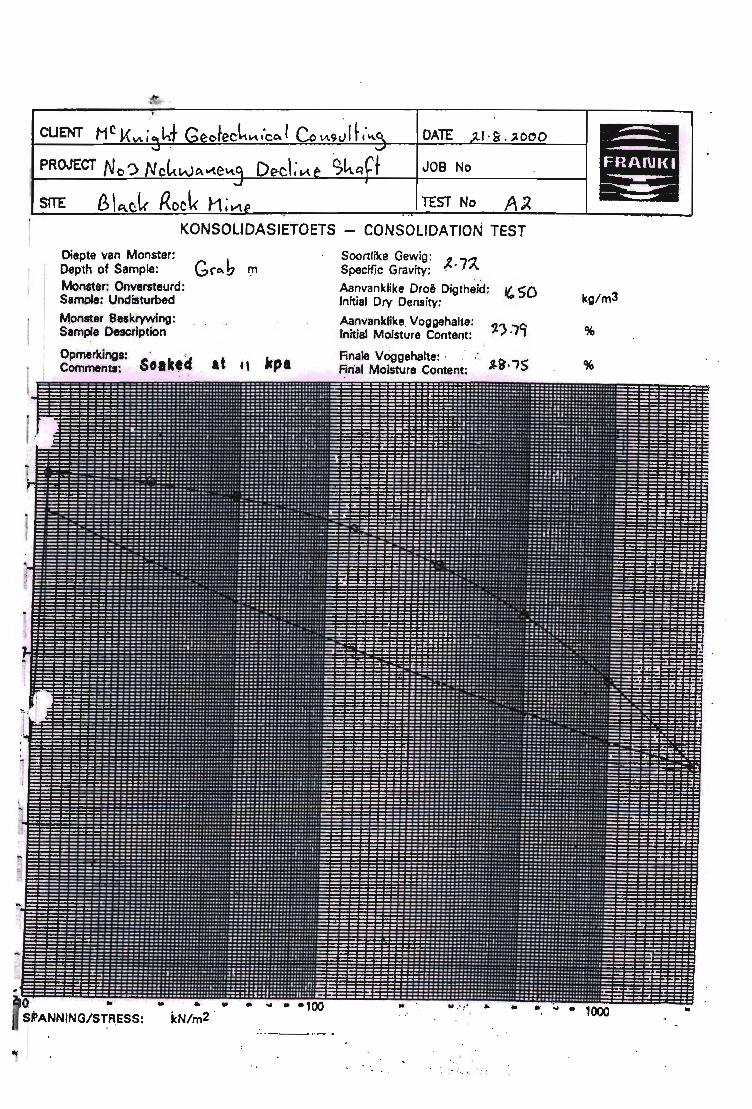
CUENT MC J.{,-,\;qhf G~ofeclt",,'c~f CoIA9~IL',,~ DATE ~f · R . "o"O "'-f ' . ' ..J
! PROJECT N <> ') N ct(l,vA~e"1.q De-ct~ eo ~kQ~t JOB No ! .,J •
SITE 8\~C!k Rock H;V\~ TEST No A~
KONSOLlDASIETOETS - CONSOUDA TlON TEST
Diepte van Monster: Depth of Sample: Monster: Onversteurd: Sample: Undi$turbed
Monster f3eskiywing: Sample Description
~rr!~':~: SOlk,tl
Soo~like Ge",:,ig : 1..71... Specific Gravity: " . Aanvanklike Oroe Digtheid: InitiatOry De~ity:
AanvankUke. Voggehalte: Initial Moisture Content:
Finale VOggehalte: ' Final Moisture Content:
..
(,50
El kg/m3
•

CUENT DATE ;t.l . ~ . ;io"o
~ PROJECT No 'J JOB No
SITE
J
J H
J J
1, , .
1 1 J L
1
TEST No AA -
KONSOLlDASIE rOErs - CONSOLIDATION TEST Oi.pUvO" toIotllhr: G \ C.pth 0' Sample: ' Y" t>-J::}
Opmfrk illlll: ftrmork,:
Soaktd , at ., kpa
Tnu· Nommt, : Tul Humb,r: ,
Vol~l\omm.r: , QC 0 SInai Humber ; q 00
.. ... , 0
~ ;; 0 -» .. ., 0 c :t Go
......, ... \It
..; I
..... ... ..... 0
. ,
w
..... -... c;n "' . 0
.. N ... l'='
.,. 0
'" N '" 0 -0
. ..
V\ ,...
~~ ~ ~ :!l~!9~ ~~:r '" ~ ~~i~~ a~Bf ~b f N §
SOILTECH , . . ' , . . ." . ~ ... ::.' ~ :,.". . . ' ..,
I .
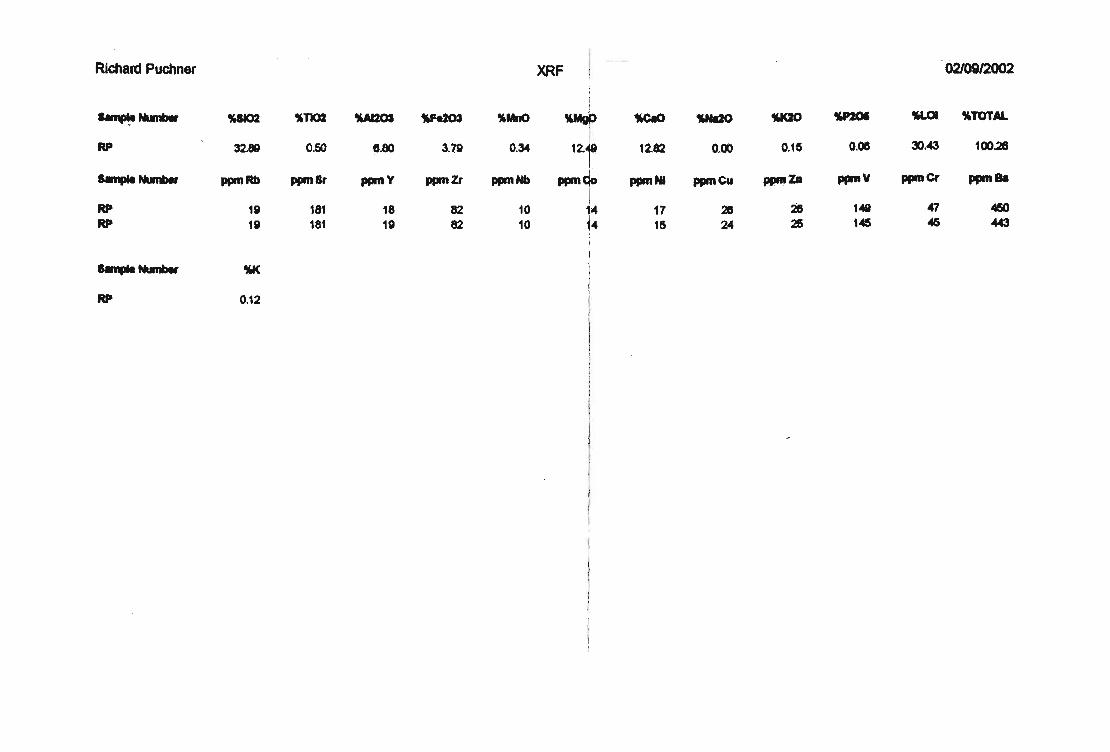
Richard Puchner
~ ........ RP
..... Number
RP RP
IUK)2
32.5 .
ppmRb
18 t8
..... Number t.K
RP 0.12
"TI02 1W2Oa.
O.SO .,.80
ppmSr ppmY
182 18 181 18
XRF
Ve20S "MaO ~ 3.19 0.304 12.f
ppmZl ppmNb ppm~ !
82 10 14 82 10 i4
!
-02J09I2002
-.c.o. VM20 IJWQO tA.PJOI -.01 "TOTAL
12,82 0.00 0;15 0.015 30.<43 100.28
ppmHt ppmCU ppm%D ppmV ppmCt pp .. " ...
11 2e 26 141 47 -450 15 24 25 145 45 <143

File : RP . DI 25-Mar-2003 9 : 27
;~i~i;;=~~~;~i~~~=~:~~;=i~~~=====================;;:i;;~=;i~~;~~~i~~=;~~~:~;;
Angle [029]
5.565 8.435
13 .900 16 . 285 19.845 20 . 835 21. 410 21.965 24.070 26.645 27.780 30.935 33.525 35.290 36.535 37.355 41.125 42 . 445 43.785 44 . 925 49.265 50.525
Sample identification: rp Data measured at: 19-Aug-2002 9:28:00
Diffractometer type: PW1710 BASED Tube anode: Cu
Generator tension [kV] : 40 Generator current [mA]: 20
Wavelength Alpha1 [A]: 1.54056 Wavelength Alpha2 [A]: 1 . 54439
Intensity ratio (alpha2/alpha1): 0.500 Divergence slit: 1 0
Receiving slit: 0.1 Monochromator used: YES
Start angle [029]: End angle [029]: Step size [029]:
Maximum intensity: Time per step [s]:
Type of scan:
Peak positions defined by: Minimum peak tip width: Maximum peak tip width:
Peak base width: Minimum significance :
Number of peaks:
3.000 70.000
0.020 529.0000
0.800 CONTINUOUS
TOp of smoothed peak 0 . 01 1. 00 2.00 0.75
30
d-value d-value Peak width Peak int Back. int ReI. int cd [A] ca [A] [029] [counts] [counts] [t]
15.8675S 15.9069 0.960 14 36 2.6 10.4739~ 10 . 4999 0.320 88 18 16 . 7
6.3658P 6 . 3816 0.400 11 6 2.1 5 . 4385P 5.4520 0.240 9 7 1.7 4.4702p 4.4813 0.200 45 8 8 . 5 4. 2599P+Q 4.2705 0.160 44 8 8.2 4.1468P 4.1571 0.320 20 8 3.8 4.04330 4 . 0533 0.160 14 8 2.7 3 . 6942~.~1l3 .7034 0.120 31 10 5.9 3 . 3428QtP 3.3511 0.120 193 11 36.5 3.2087P 3.2167 0.640 18 12 3.3 2.88830 2.8955 0.120 529 11 100 . 0 2.6708n~1I2.6775 0.160 37 10 7 . 0 2. 5412D~P.tf~. 5475 0.160 59 10 11.2 2.4574~ 2.4635 0.120 17 10 3 . 2 2.40530 2.4113 0.240 34 10 6 . 4 2 .1931Dt~ 2.1986 0.100 108 12 20.4 2.1279~ 2.1332 0.240 10 10 1.9 2.0658D 2.0710 0.200 12 9 2.2 2.0160tl 2 . 0210 0.060 62 8 11.8 1. 84811)tH 1. 8527 0.120 18 6 3.3 1 . 8049G",C1. 8094 0.160 55 6 10.4
Signif.
1. 06 4.42 1. 59 0.83 1. 23 1. 78 0.96 0.84 1. 69 5.10 1. 55 4 . 61 1.33 2.19 1. 26 3.04 1.47 0.76 1. 20 0.89 1.33 1.58
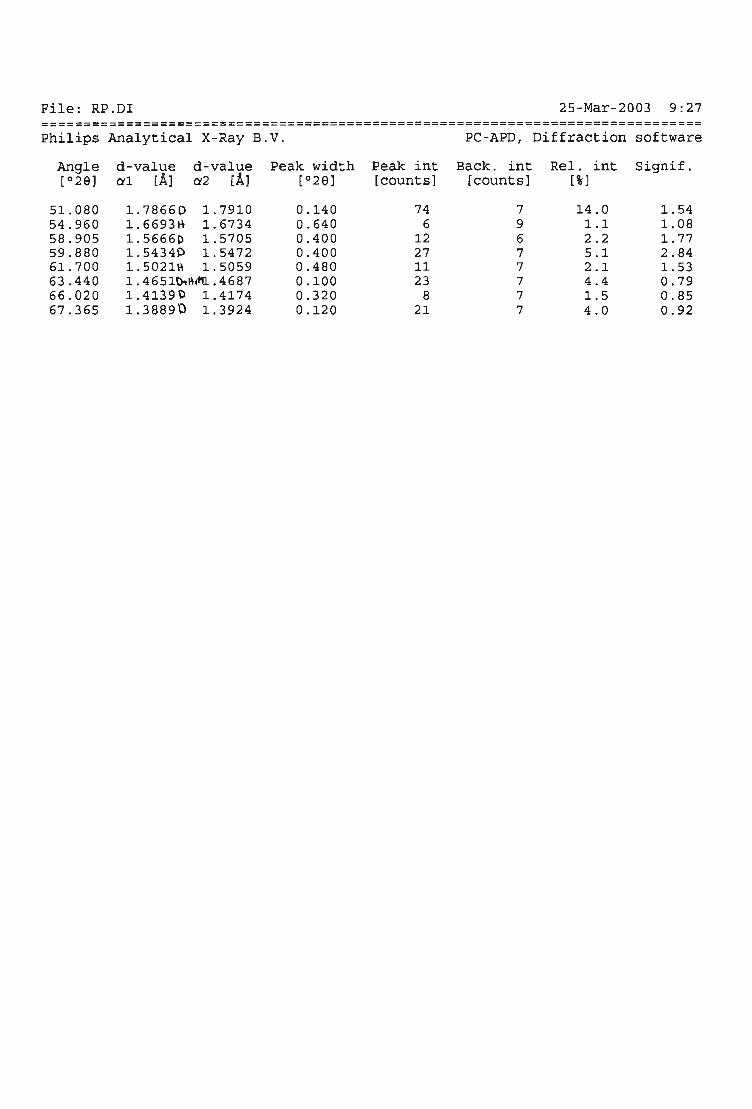
File: RP.DI 25-Mar-2003 9:27 ============================================================================== Philips Analytical X-Ray B.V. PC-APD, Diffraction software
Angle d-value d-value Peak width Peak int Back. int ReI. int Signif. [ 029] a1 [A] a2 [A] [029] [counts] [counts] [\]
51. 080 1.78660 1.7910 0.140 74 7 14.0 1.54 54.960 1.6693~ 1. 6734 0.640 6 9 1.1 1. 08 58.905 1.5666p 1. 5705 0.400 12 6 2.2 1. 77 59.880 1. 5434P 1.5472 0.400 27 7 5 . 1 2.84 61.700 1.5021\0\ 1.5059 0.480 11 7 2.1 1.53 63.440 1. 4651t).I\.fI1 .4687 0.100 23 7 4.4 0.79 66.020 1.4139~ 1. 4174 0.320 8 7 1.5 0.85 67.365 1.38890 1. 3924 0.120 21 7 4.0 0.92
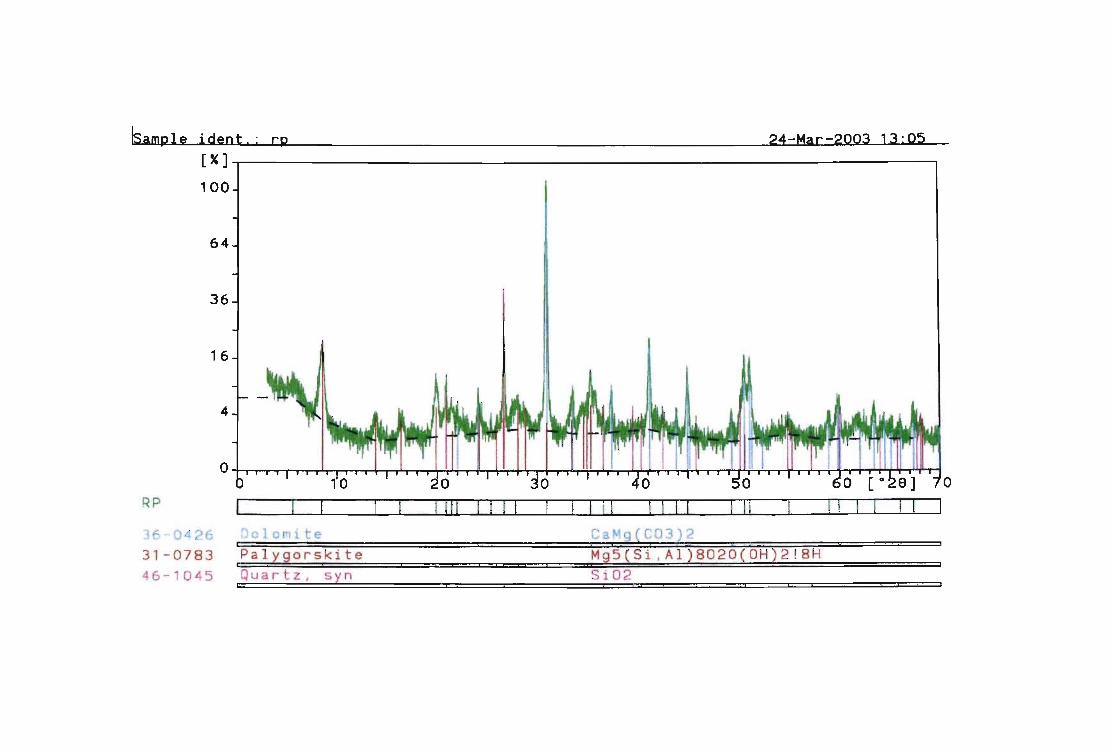
~amgle ideat , ; rg 24-Mar-2003 13'05
[%]T'----------------------------------------------------------, 100
64
36
16
4
0, i l l i' , , ', '.'; , . f, I, I ', ,' , '\' , I/ i",' ( ,' , ', V', l J' jl / , ~ ' iit " , , ' 1'1" ,' ,"1" ,
RP
3f. 0426 31 - 0783 46 -1 045
Dolomite CaMg(C03)2 Pal rro_r 5 kit e . M 9 's CS i , A I } 8020 ( 0 H ) 2 ! 8 H Quartz , syn 5i02
"


