
THE IMPACT OF FEDERAL GOVERNMENT WELFARE EXPENDITURES ON
STATE GOVERNMENT EXPENDITURES AND PHILANTHROPIC GIVING TO
HUMAN SERVICE ORGANIZATIONS (HSOs): 2005-2006
Sung-Ju Kim
Submitted to the faculty of the University Graduate School
in partial fulfillment of the requirements
for the degree
Doctor of Philosophy
in the School of Social Work
Indiana University
May 2013
ii
Accepted by the Faculty of Indiana University, in partial
fulfillment of the requirements for the degree of Doctor of Philosophy
Robert Vernon, PhD., Chair
Doctoral Committee
Margaret E. Adamek, PhD
Marquita Walker, PhD
August 22, 2012
Richard Steinberg, PhD

iii
© 2012
Sung-Ju Kim
ALL RIGHTS RESERVED

iv
DEDICATION
This dissertation is lovingly dedicated to my family who supported, encouraged,
challenged, and inspirited me to be able to finish my PhD program. Specifically, I want to
dedicate this work to my wife, Mi-Ae, who has always been there through the hard times.
Without her support, love and sacrifice, I would not have been able to finish this program.
This work is also dedicated to my father, mother, brother, and sister in Korea, who give
me endless love and support.

v
ACKNOWLEDGMENTS
I want to extend a special thanks to my wife and daughter, Mi-Ae and Chloe.
Without my wife’s sacrifice, my work would not be possible. My daughter was the most
significant cause that made me not give up in the middle of finishing this project. I want
to extend special thanks to the distinguished dissertation committee members: Professor
Robert Vernon (chair), Professor Margaret E Adamek, Professor Marquita Walker, and
Professor Richard Steinberg. As Chair of the committee, Dr. Vernon provided detailed
guidance and encouragement throughout my research. Specifically, it would have been
impossible to develop this dissertation on an untraditional social work topic if he had not
encouraged me to keep studying in my area of interest. His belief that the topic is
worthwhile for social work practice, indeed, made it possible for me to keep going. I have
immense respect for the tireless support and encouragement of Dr. Adamek throughout
my entire program in the Indiana University School of Social Work. Without her endless
concern about my family and me, I definitely could not go through the long and painful
PhD program. Thanks to Dr. Walker for her willingness and hospitality to support my
journey and to provide her time and effort to update this paper. My special thanks go to
Dr. Steinberg who provided knowledge and skills about the joint crowd-out effects. It was
great honor to work with him on this important topic. He taught me about the joint
crowd-out from A to Z from his enormous knowledge about the topic. Whenever I asked
a question, he gave me more than I expected. Without his efforts to teach me about the
topic based on economical wisdom, it would have been impossible to finish.
Also, as always, my special thanks to my family in America and in Korea for
their endless love, belief, and support. I will love all of my wonderful family forever.

vi
ABSTRACT
Sung-Ju Kim
The Impact of Federal Government Welfare Expenditures on State Government
Expenditures and Philanthropic Giving to Human Service Organizations: 2005-2006
A sizeable body of research has attempted to examine the interaction between
government spending and private giving known as the crowd-out effect. Most researchers
reported that increases of government spending cause decreases of philanthropic giving
to different types of nonprofits. However, few studies have attempted to indicate the
interaction between government welfare expenditures and private giving to human
service organizations even though human service organizations are the most sensitive to
the changes of government spending. Additionally, the estimated crowd-out effects with
a simple crowd-out model have been criticized for potential endogeneity bias. This paper
investigates the total effect of federal government welfare spending on state government
expenditures and philanthropic giving to human service organizations (known as joint
crowd-out). I used the 2005 wave of the Center on Philanthropy Panel Study (COPPS) to
estimate the effect of federal human service grants on state government spending on, and
donations to human services. From these reduced-form estimates I infer the levels of
simple and joint crowd-out. I found that indicate federal spending on public welfare
crowds out private giving to human service organizations while holding control variables
constant in the donations equation. However, federal government spending on public
welfare crowds in state government spending on public welfare.
Robert Vernon, PhD., Chair

vii
TABLE OF CONTENTS
List of Tables .................................................................................................................... viii
List of Figures .................................................................................................................... ix
Chapter One: Introduction ...................................................................................................1
Managerial Challenges in HSOs ...................................................................................2
Fiscal challenges in HSOs: welfare retrenchments. ..................................................4
Fiscal challenges in HSOs: other causes. ..................................................................7
The Elements of Financial Resources for HSOs ...........................................................8
The Importance of Understanding Financial Management for HSOs.........................12
Understanding the Interaction of Government spending and Charity .........................14
Theoretical Frameworks ..............................................................................................17
Contingency theory. .................................................................................................18
Resource dependence theory. ..................................................................................21
Political economy theory. ........................................................................................22
Chapter Two: The Impact of Public Welfare Expenditures on Philanthropic Giving .....26
Definition of Simple, Joint Crowd-Out and Significance of Joint Crowd-Out ...........27
Theory of Joint Crowd-Out .........................................................................................30
Simple crowd-out model. ........................................................................................31
Joint crowd-out model. ............................................................................................33
Empirical Results: Crowd-Out/-In or Neither .............................................................34
Empirical Results: Limitations and Suggestions for Further Crowd-Out Study .........44
Chapter Three: Research Methodology .............................................................................49
Data Sources ................................................................................................................49
Conceptual Definitions of Key Variables ....................................................................52
Descriptive Statistics of Government Spending and Charitable Giving .....................57
Econometric Specification ..........................................................................................59
Estimation Technique: Tobit Specification and OLS ..................................................61
Chapter Four: Results ........................................................................................................64
Crowd-Out Estimations ...............................................................................................64
Other Economic and Socio-Demographic Variables ...................................................69
Chapter Five: Conclusions .................................................................................................72
Conclusion ...................................................................................................................72
Limitations and Suggestions .......................................................................................75
Appendix A: Joint crowd-out results .................................................................................77
Appendix B: Federal, state and local government factors in 2005 ....................................78
References ..........................................................................................................................79
Curriculum Vitae

viii
List of Tables
Table 1. Summary of Empirical Studies of the Crowded-Out by Major Finding ............. 36
Table 2. A Description of Public Welfare Program ........................................................... 54
Table 3. Overview of Charitable Giving in 2006 .............................................................. 58
Table 4. Joint Crowd-Out of Donations ............................................................................ 64
Table 5. Joint Crowd-Out of State Spending (Including Fixed Effects Panel Estimator) 66

ix
List of Figures
Figure 1. Financial Resources for Human Service Organizations ...................................... 9 Figure 2. Simple Crowd-Out............................................................................................. 28 Figure 3. Joint Crowd-Out ................................................................................................ 29
1
Chapter One: Introduction
A number of authors have strived to identify the funding resources for human
service organizations and other nonprofits in the United States over the last several
decades (Boris, Leon, Roeger & Nikolova, 2010; McMurtry, Netting, and Kettner, as
cited in Kettner, 2002; Salamon, 1999). According to these studies, human service
organizations have generally developed their funds from some combination of four
sources: 1) government appropriations (e.g., direct government funds, contracts and
grants, and tax benefits); 2) philanthropic contributions from individuals, corporations,
and foundations; 3) service fees from clients; and 4) other resources (e.g., investments
and profit-making subsidiaries). Studies on revenue sources for human service
organizations reported more than half of total revenues for human service organizations
comes from federal, state, or local government contracts and grants (Boris et al., 2010).
The rest of the total budget for human service organizations was accounted for through
private philanthropy, service fees, and other income.
When comparing the percentage of government spending between human
service organizations and all nonprofits, human service organizations heavily rely on
government funding— almost twice as much as for all nonprofits.1 By comparison,
human service organizations are highly vulnerable to impediments in their ability to meet
goals and expectations in times of financial turmoil and low government revenues.
1 Salamon (1999) reported that almost 37 percent of total funding for nonprofit organizations in America
came from service fees, 30 percent came from government, 22 percent came from private contributions
including corporate and foundation giving, and 11 percent came from other income. According to the most
recent study for the source of revenues for nonprofit organizations, the National Council of Nonprofits
(2010) reported 27.4 percent of total revenues for all nonprofits came from government funding in 2008. In
contrast, Boris et al. (2010) reported almost 60% of total budgets for human service organizations came
from government funding, 19% came from private giving, 16% came from service fees, and 5% came from
other incomes.

2
Therefore, it is critical that human service managers understand and direct the
relationship with government funding. Specifically, identifying and managing the
relationship between government spending on public welfare and the private giving to
human service organizations is important for human service managers because more than
three-quarters of the total revenue for human service organizations come from either
government or philanthropy.
Hence, for effectively and efficiently addressing financial challenges to human
service organizations, it is important to investigate the interaction of the two fundamental
fiscal factors—government spending and private giving. This research addresses the gap
in our knowledge about the relationship between government spending and private giving
by answering the following questions: what is the effect of total government welfare
expenditures—both federal and state government welfare spending— on the changes in
charitable giving to human service organizations?; and what is the total effect on both
private giving to human service organizations and state welfare expenditures, when
federal government welfare spending goes up by a dollar?
Before scrutinizing the relationship between government welfare expenditures
and charitable giving, a summary of the literature on fiscal challenges to nonprofit
managers caused by government retrenchment of welfare spending in human service
organizations is addressed, then theoretical frameworks relevant to this discussion is
presented in this chapter.
Managerial Challenges in HSOs
Human service organizations have experienced enormous managerial challenges
over the past 30 years. The challenges that often threaten the delivery of services to
3
clients are changing social policies, unstable economic conditions, shifting demographics,
increasing service demands, rapidly developing technology, increasing expectations
regarding the effectiveness and efficiency of their performance, and greater emphasis on
cost and performance accountability (Austin, Brody, & Packard, 2009; Bergman, Bowen,
& Nygren, 1996; Hecht & Ramsey, 2002; Herman & Renz, 1998; Hopkins & Hyde, 2002;
Salamon, 1996; Salamon, 2005). Salamon (2005) categorized these challenges under
three main headings: fiscal, effectiveness, and competitive challenge.
Among these three challenges, the fiscal challenge is the most formidable that
human service organizations have faced. For example, Hopkins and Hyde (2002) found
that human service managers were seriously concerned about fiscal crisis as their most
crucial challenge. In 2001, a list of challenges to human service organizations was
compiled from 115 managers representing 115 human service agencies. The most
frequently reported challenges included lack of funds to meet agency goals (37.4%) and
competition from other agencies for clients and/or funding (40.0%). Thus, financial
challenges appeared to be a primary concern among human service managers.
Several causes of fiscal crisis to human service organizations can be found such
as government retrenchments on welfare expenditures, economic recessions, and other
fiscal issues. In particular, after the federal government pursued an ongoing effort to
reduce government expenditures on social welfare since the Reagan administration, fiscal
challenges directly impacted human service organizations. Because of the inter-
dependency of their budgets with the government, human service organizations have
been seriously affected on their budget by the changes of the government welfare policy.
That is, in keeping with the keynote policy on welfare reform, federal spending on a

4
broad range of social welfare programs declined. At the same time, the demand for public
assistance increased. For example, the poverty rate climbed to 13.1 percent in 1988— a
rate that was higher than any year since before the War on Poverty programs in the
middle-1960s (Stoesz & Karger, 1992). Since the Reagan administration attempted to
reduce government welfare spending, human service organizations have faced both fiscal
crisis and increases in service demands. A detailed picture of the impact of government
retrenchment on welfare expenditures and other causes of financial challenges are
addressed in the following sections.
Fiscal challenges in HSOs: welfare retrenchments
Before the Reagan presidency, government welfare spending had dramatically
increased. For example, federal, state, and local government welfare spending increased
from $208 million in 1923 to $4.9 billion in 1939. In 1933 welfare programs accounted
for only 6.5 percent of all government expenditures; by 1939 that figure rose to 27.1
percent (Katz, 1995). Federal government expenditure on public service (except military
spending) in 1927 was only 3 percent of gross national product (GNP). By 1936, however,
federal government expenditures (except military spending) grew to 10 percent of GNP
(Fishback, Horrace, & Kantor, 2005).
However, the retrenchment of welfare spending from the government began in
1980 when former President Reagan declared at his first inauguration “government is not
the solution to our problem.” (Levine, 1986, p.196) In fact, total government social
welfare expenditures grew only 21 percent or less than 2 percent per year from 1977 to
1989 (Salamon, 1999), which indicates a much lower rate of growth than that from 1986
to 1977. According to Beck (2000), between 1980 and 1982 government expenditures
5
dropped by 3.9 percent and government spending on welfare programs dropped by 10.1
percent. During the Reagan administration, funding for Aid for Families with Dependent
Children (AFDC) was reduced by11.7 percent, and stiffer eligibility requirements were
enacted. The Food Stamp program was reduced by 18.8 percent, and strikers and students
became ineligible for benefits. The duration of unemployment insurance was reduced by
13 weeks (Stoesz & Karger, 1992).
After the Reagan administrations, efforts to recover from the government
welfare cutbacks were attempted in the late 1980s and early 1990s, but government
welfare expenditures were not reversed to what they were before the Reagan years.
However, major welfare reform was implemented by former President William Clinton.
In his speech during the State of the Union on January 27th
, 1996, President Clinton
proclaimed “The era of big government may be over, but the era of big challenges for our
country is not, and so we need an era of big citizenship.” Several months later, the
President signed the Personal Responsibility and Work Opportunity Reconciliation Act of
1996 (PRWORA) into law. PRWORA was broad in scope and negatively affected
virtually all welfare programs including federal welfare entitlements (Rosenbaum &
Darnel, 1997; Tanner, 1996).
PRWORA contained a number of new measures for personal eligibility for
welfare. First, the individual’s right to cash assistance from the federal government was
abolished and was replaced by a lifetime maximum of five years during which a citizen
can receive welfare benefits. Second, a crucial element of the American welfare state,
AFDC, was eliminated and replaced by Temporary Assistance for Needy Families
(TANF). Third, the use of food stamps was restricted, and finally, people on welfare were
6
required to work within two years of receiving benefits or they would be removed from
the rolls (Patriquin, 2001). Clinton’s alterations to the welfare system were conducted
based on four main themes for welfare reform: 1) make work pay, 2) strengthen the
nation’s system of child support enforcement and collection, 3) provide education and
training to poor people, and 4) place limits on the length of time that recipients are able to
collect welfare benefits (Haveman & Scholz, 1994).
As a result, PRWORA reduced the total amount of spending on welfare by
federal and state governments. The federal contribution also changed from a matching
grant to a block grant. The scope of government cutbacks was substantial. According to
Salamon (1996), approximately $8.5 billion or 12 percent of federal spending on
discretionary programs to nonprofit organizations for the 1996 fiscal year was cut from
the previous fiscal year. Additionally, the cutbacks were even more severe in some fields:
by 17 percent for the Social Service Block Grant; by 24 percent for disadvantaged
housing; by 26 percent for community service; and by 34 percent for low-income energy
assistance (Salamon, 1996).
The retrenchment of government welfare spending was maintained under the G.
W. Bush administration. President G. W. Bush and the Congress suggested that the
federal spending on social welfare programs was reduced from FY 2005 through FY
2010, outside of health and income assistance (Abramson & Salamon, 2005; Salamon,
1996). The fields of education, social services, and community development experienced
additional federal budget cut in the FY1997- FY2002 budget plan. After adjusting for
inflation, the federal outlays fell by 39 percent for community and regional development
programs, and by 10 percent for education, training, and social services (Abramson &

7
Salamon, 2005). In addition, according to the G. W. Bush administration’s budget
proposals that were submitted to Congress, covering fiscal year 2007 through fiscal year
2011, nonprofit organizations expected a cumulative total of $78.6 billion in federal
government spending below FY 2006 levels except for Medicare and Medicaid, after
adjusting for inflation (Abramson, Salamon, & Russell, 2006).
Fiscal challenges in HSOs: other causes
Fiscal challenges for human service organizations are caused not only by the
retrenchment of government welfare expenditures, but also by other financial challenges
(e.g., economic recession). Several studies reported human service organizations had
experienced budget cutbacks because of economic recessions. Boris et al. (2010)
described the impact of economic recession on human service organizations with
government contracts. They reported that almost 61 percent of human service
organizations had experienced the government not paying the full cost of contracted
services in the economic recession which started in late 2007. Twenty-one percent of
human service organizations reported an experience with government funding which was
worse in 2009 than in prior years. And 58 percent reported that the government changed
contracts and grants since this current recession occurred. In addition, the National
Council of Nonprofits (2010) indicated that 45 percent of human service providers
reported that governments failed to pay the full cost of performing the contracts, leading
to job cuts in 2009. As the studies indicated, government spending are vulnerable to
economic conditions.
In addition, government policy on welfare spending has been affected by other
social issues such as liberal, neo-liberal, or conservative social values. For example, the

8
radical critiques of government-oriented social welfare provision have been strongly
driven by liberal, neo-liberal, or conservative approaches, and social work professionals
have been forced to re-identify the process of social work provisions. That is, those social
values have suggested the political trends of providing social welfare were not only too
paternalistic or too domineering, but also too permissive (Art & Gelissen, 2002; Hicks &
Kenworthy, 2007; John & Pierson, 1997; Midgley, Tracy & Livermore, 2000). Therefore,
not only government budget cuts but also economic recession and particular social values
are additional causes of fiscal challenges for human service organizations.
The Elements of Financial Resources for HSOs
Researchers and practitioners have strived to describe the different budget
resources for human service organizations with different approaches. For example,
McMurtry et al. (1991, as cited in Kettner, 2002) reported the funding sources for human
service organizations as government contracts, charitable contributions, client fees, public
grants, private grants, and other sources. Similarly, Lohmann (1980) identified five
categories of funding resources for human service organizations: government funding
from tax-based sources, fees, grants, organized fund drives, and charitable contributions.
In general, the sources of revenue for human service organizations are identified as the
following: 1) government contracts, grants and tax benefits; 2) philanthropic giving; 3)
service fees; and 4) other resources.
Among these identified revenue sources, government spending and
philanthropic contributions are particularly important revenue sources for human service
organizations. Salamon (1999) indicated the portion of the budget for all nonprofit
organizations with the four different financial resources. According to Salamon (1999),
9
almost 30 percent of total revenue for all nonprofit organizations came from government
contracts and grants. The National Council of Nonprofits (2010) provided the most recent
information about the source of revenues for all nonprofit organizations. The Council
reported that almost 26.4 percent of total revenue for nonprofit organizations came from
government spending. However, human service organizations have a different portion of
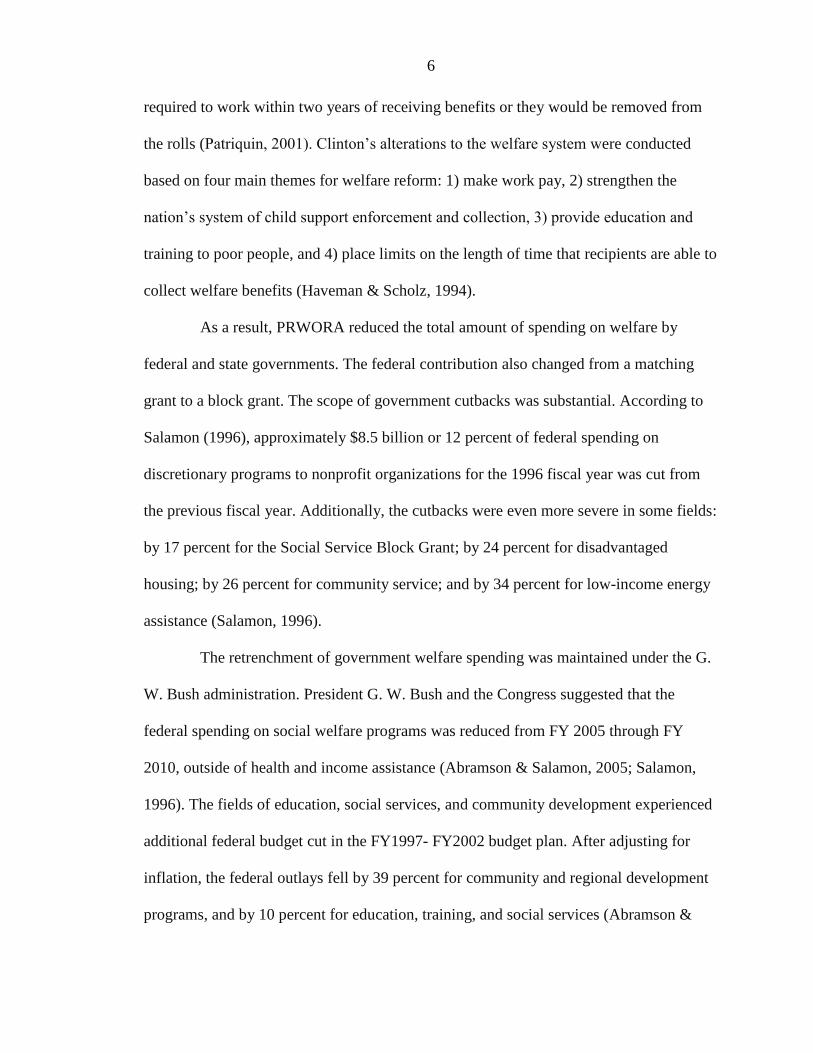
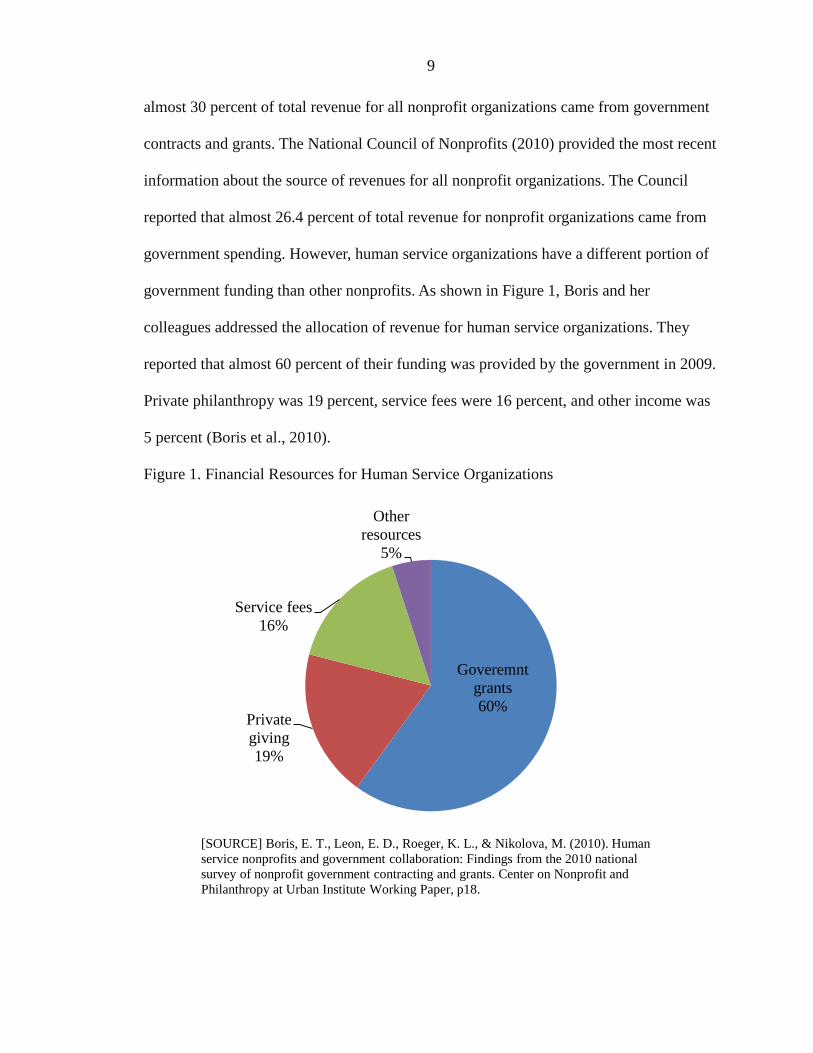
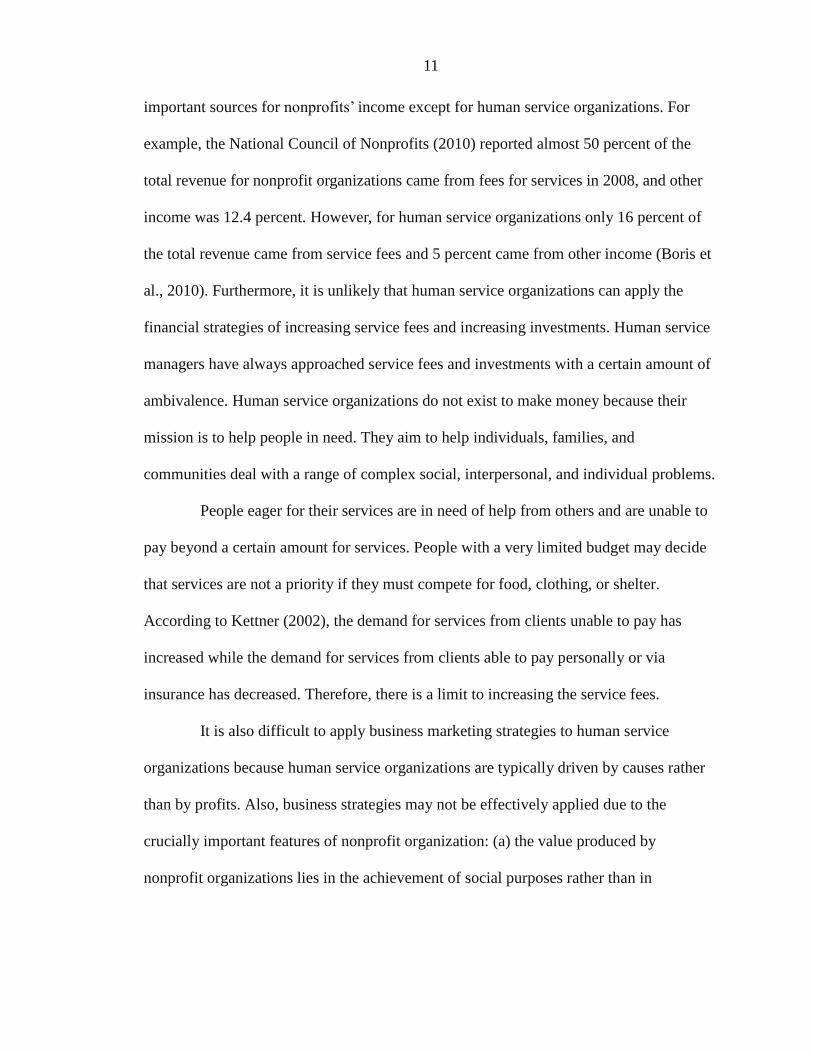
government funding than other nonprofits. As shown in Figure 1, Boris and her
colleagues addressed the allocation of revenue for human service organizations. They
reported that almost 60 percent of their funding was provided by the government in 2009.
Private philanthropy was 19 percent, service fees were 16 percent, and other income was
5 percent (Boris et al., 2010).
Figure 1. Financial Resources for Human Service Organizations
Goveremnt
grants
60% Private
giving
19%
Service fees
16%
Other
resources
5%
[SOURCE] Boris, E. T., Leon, E. D., Roeger, K. L., & Nikolova, M. (2010). Human
service nonprofits and government collaboration: Findings from the 2010 national
survey of nonprofit government contracting and grants. Center on Nonprofit and
Philanthropy at Urban Institute Working Paper, p18.

10
In a detailed picture of government contracts and grants for human service
organizations, Boris et al. (2010) reported that government agencies had approximately
200,000 contracts and grants with about 33,000 human service organizations in 2009.
That is, each human service organization had almost six contracts and grants in 2009.
The second important financial resource for human service organizations is
charitable donations. Due to a limited ability to increase service fees for clients,
charitable donations have become the most important funding resource that human
service managers aim to develop other than government funds. Since the government has
retrenched spending on social welfare, human service managers have increased their
intention to develop private contributions to make up for cutbacks in government support.
According to Goss (1989), the fundraising initiatives for private charity such as hiring
professional fundraisers and increasing fundraising events have increased in human
service organizations since the welfare reforms instituted by the Reagan administration.
Kettner (2002) stressed charitable contributions have become a significant part of many
nonprofit agencies’ annual revenue.
Donations have come from a variety of sources such as individuals, foundations,
corporations, and private charities. According to the Giving USA Foundation (2011),
estimated charitable giving from American individuals, corporations, and foundations
was $290.89 billion in 2010. Among total contributions in 2010, human service
organizations received an estimated $26.9 billion (9% of the total) in contributions, the
third largest amount received among all types of nonprofits.
Additionally, both service fees and other income are other components of
revenue sources for nonprofit organizations. However, service fees and other income are
11
important sources for nonprofits’ income except for human service organizations. For
example, the National Council of Nonprofits (2010) reported almost 50 percent of the
total revenue for nonprofit organizations came from fees for services in 2008, and other
income was 12.4 percent. However, for human service organizations only 16 percent of
the total revenue came from service fees and 5 percent came from other income (Boris et
al., 2010). Furthermore, it is unlikely that human service organizations can apply the
financial strategies of increasing service fees and increasing investments. Human service
managers have always approached service fees and investments with a certain amount of
ambivalence. Human service organizations do not exist to make money because their
mission is to help people in need. They aim to help individuals, families, and
communities deal with a range of complex social, interpersonal, and individual problems.
People eager for their services are in need of help from others and are unable to
pay beyond a certain amount for services. People with a very limited budget may decide
that services are not a priority if they must compete for food, clothing, or shelter.
According to Kettner (2002), the demand for services from clients unable to pay has
increased while the demand for services from clients able to pay personally or via
insurance has decreased. Therefore, there is a limit to increasing the service fees.
It is also difficult to apply business marketing strategies to human service
organizations because human service organizations are typically driven by causes rather
than by profits. Also, business strategies may not be effectively applied due to the
crucially important features of nonprofit organization: (a) the value produced by
nonprofit organizations lies in the achievement of social purposes rather than in

12
generating revenues; and (b) nonprofit organizations receive revenues from sources other
than customer purchases (Moore, 2000).
The Importance of Understanding Financial Management for HSOs
Financial management is a significant managerial function for human service
organizations because all stakeholders in the organization such as clients, staff, boards,
and donors have enormous interest in the effective management of fiscal resources. Ezell
(2009) noted that clients care about effective financial management because they believe
it is associated with better quality and quantity of services. The staff are also interested
because fiscal conditions of their organization are directly associated with their salaries
and benefits, ongoing work conditions, and the amount of resources they can devote to
programs. In addition, donors such as government agencies, foundations, and private
individuals are always concerned about the utilization of funds because they pay attention
to the accomplishment of client service objectives and ongoing provision of funds to the
organization.
Traditionally, financial management has been considered as developing and
managing budgets and monitoring expenditures to secure the purposes of organizational
spending and the efficiency of that spending. For example, Austin et al. (2009) describe
financial management as fund development (e.g., writing proposals for grants or contracts)
and preparing and monitoring budgets. The expected managerial capacity to manage
fiscal factors includes ensuring that revenue streams are stable and adequate, that
expenditures are within budget, and that account procedures are followed. In human
service organizations, the responsibility of developing funds has been considered the
board of directors’ domain. The responsibility to direct the expenditures of budgets has
13
been regarded as a CEO or CFO’s job. For example, Poertner (2006) and Poertner and
Rapp (2007) stated that some authors stress it is not necessary to acknowledge the skills
of financial management for human service managers because the responsibility for
financial management lies with the chief financial officers (e.g., accountant or finance
specialists).
However, it is necessary for managers to know how to interpret various financial
management and monitoring reports because an agency’s strategic plan should influence
annual budgets as agency priorities change and agency leaders navigate opportunities in a
constantly dynamic environment (Ezell, 2009). Furthermore, agency relationships with
external funding resources should be analyzed when an agency has developed a strategic
plan. In order for their organizations to survive and grow, human service managers must
efficiently and effectively manage the human, financial, informational, and physical
resources needed to accomplish fundraising, grant writing, and marketing
Weinbach (2008) stressed that financial management capacity such as writing
grant proposals, negotiating contracts, and finding creative ways to obtain money from
charitable contributions has taken on ever-increasing importance. In addition, human
service managers have been pressured to devote themselves to developing funds in recent
years because of increased competition for funding, decreased government funds, and
other developments (e.g., block grants and privatization of services). The responsibility of
developing funds also falls to the director and other managers when board members are
either unwilling or unable to perform this function. As a result, developing fundraising
skills and knowledge has become increasingly important to human service managers.

14
According to Weinbach (2008), managers in human service organizations openly spend
more time attempting to raise money than they do spending it.
Understanding the Interaction of Government spending and Charity
In addition to understanding the various revenue sources for human service
organizations, human service managers should be able to identify the essential
relationship among the different types of funding resources and the implications of the
relationship for their organization. Due to a higher dependence on government funds,
identifying and managing relationships with government funding is an important
managerial responsibility for human service managers. That is, managers in human
service organizations should be able to identify the domain within which the agency fits
and develop a fundraising strategy to target the appropriate government funds.
Specifically, it is critical for managers to understand how receiving government funding
affects the level of philanthropic contributions to their organizations.
Researchers in public policy, public economics, or nonprofit management have
devoted their energy to identifying the nature of the relationship between government
welfare expenditure and philanthropic giving and its impact on nonprofit organizations,
yet the nature of the relationship remains ill-defined. Theory specification of the
government and private giving relations delineates two main effects on donors: 1)
increased spending reduces the marginal gain to donating, hence reduces donations, 2)
spending targeted at particular organizations acts as a quality signals, hence increasing
donations. Based on the theoretical frameworks, empirical studies have examined which
effect dominates. Some studies find crowd-out effect (e.g., Andreoni & Payne, 2003;
Kingma, 1989; Schiff, 1990; Steinberg, 1985 ), some studies find crowd-in effect (e.g.,

15
Payne, 2001; Schiff, 1985, Smith, 2007), and some find no statistically significant effect
(e.g., Khanna, Posnett, & Sandler, 1995; Lindsey & Steinberg, 1990)
Although the theoretical and empirical studies of government spending and
charitable giving have addressed crowd-out or-in effect to some extent, there have been
limitations to generalizing the findings. For example, most studies on crowd-out effect
have been examined not with human service organizations, but with other types of
nonprofit organizations such as public radio stations, art organizations, religious
organizations, or elite universities. The nature of the relationship between government
spending and private giving likely differs among different types of nonprofit
organizations because of the varied composition of the revenue streams. Horne (2005, as
cited in Tinkelman, 2009) notes that only one percent of the revenues of the religious
sector was provided by government, while 56 percent of revenues of the nonprofits
related to criminal issues was provided through government spending. Nonprofits
associated with international affairs received 58 percent of their revenues from
philanthropic donations; whereas hospitals formulated less than one percent of their
budget from private giving.
Second, even though a few studies examined the interaction between
government welfare expenditures and private giving to human service organizations (e.g.,
Amos, 1982; Schiff, 1990; Payne, 2001), researchers asserted the estimated interaction
between government spending and private giving to human service organizations had
limitations. Horne (2005) and Payne (2009) indicated problems with the quality of
available data. Smith (2006) and Steinberg (1990) noted statistical errors. Therefore,

16
studying the crowd-out effect between government spending and private giving should
use multidimensional approaches.
A better understanding of the nature of the relationship between government
spending and private giving to human service organizations will provide a wide variety of
benefits for human service managers. Obviously, research concerning the interaction of
government spending and charitable giving provides insight on two levels—the
effectiveness of financial management and overall social welfare policy. That is, human
service managers would be able to develop more effective strategic financial plans if they
knew that government spending acted as positive signals for private giving. For example,
if part of the cost is hidden as future crowd-out of private giving, knowing the true cost of
applying for government funding is important to managers in human service
organizations. Tinkelman (2009) asserted that managers in nonprofits need to more
accurately understand the interaction between government spending and charity in order
to best select among funding alternatives and to optimize fundraising campaigns.
In addition, a better understanding of the interaction between government
welfare spending and charitable contributions provides insight into ranking political
positions about the government’s role in providing public goods. For example, when total
philanthropic giving was dramatically increased from $130.89 billion in 1995 to $157.69
billion in 1997 (Beck, 2000), crowd-out theories attributed the increase in private giving
that occurred in 1996 and 1997 to a public response to the Clinton administration’s
welfare reform. Khanna and Sandler (2000) posited that knowing the interaction between
government spending and private giving to nonprofit organizations has crucial public
policy implications during a time in which governments are debating whether the private

17
sector can replace government support to nonprofit organizations for providing public
goods.
Therefore, policy makers are interested in the ultimate level of public service
provisions in order to decide the best funding mix for organizations to provide public
goods. The effective level of public service provisions would be drawn based on a better
understanding of the extent to which private contributions react to changes in government
spending. Additionally, Steinberg (1993) emphasized that understanding the relationship
between government spending and charitable giving is important in the design of tax
code provisions concerning charitable donations.
Clearly, it is necessary for managers and nonprofit researchers to articulate an
accurate relationship between government spending and private giving. Particularly,
managers in human service organizations should strive to create a more intimate
relationship with government by increasing their interaction with policymakers through
lobbying and networking with external resources.
Theoretical Frameworks
A number of theoretical approaches to organization-environment relations have
been developed in recent decades since Katz and Kahn (1996, as cited in Kettner, 2002)
addressed the applicability of systems concepts to social work practice. Each theoretical
framework provides particular perceptions of how organizational structures,
administrative processes, and patterns of management are associated with external
environments.
A number of authors offered theoretical frameworks to explain the interaction
between human service organizations and the environment, known as organizational

18
adaptation theories. The concept of adaptation includes buffering, bridging, sensing, and
understanding the changing conditions of the environment (Evelyn, 2009; Hasenfeld,
2009). The purpose of adaptation is to maximize the effectiveness in adapting
performances to ensure survival and to minimize the dependency on external
organizations in the decision-making process. While interacting with the external
environment, organizations gain knowledge about the impact of changes from the
external environment, their strengths and weaknesses, and strategies for survival in their
environment.
The main theoretical approaches that rely on this active process of adaptation are
contingency theory, resource dependence theory, and political economy theory (Evelyn,
2009; Glisson, 1981; Hasenfeld, 2009; Jaskyte & Lee, 2006; Lecovich, 2001; Schmid,
2004, 2009; Wamsley & Zald, 1973; Zhao, Ren, & Lovrich, 2010). According to
Hasenfeld (2009), these main theories address the most appropriate frameworks for
analyzing the relationships between human service organizations and the fiscal
environment.
Contingency theory
Before examining fiscal relationship theories, contingency theory should be
considered because it provides an important paradigm for analyzing organizational
structure related to the external environment. Glisson (1981) noted that the contingency
approach provides a context for considering the unique characteristics of organizational
systems that deliver services to human beings. In other words, this theory depicts
organizational dynamic relations with both internal and external components of the
organization.

19
This theory considers an organization as a social system that is interconnected
with subsystems or the external environment. Hence, the contingency approach
emphasizes the managers’ responsibility not only to direct the functioning within the
internal environment, but also to ensure desirable relations with the external environment
(Glisson, 1981). According to Zhao, Ren, and Lovrich (2010), contingency theory asserts
that managers should understand the three types of environmental elements that impact
organizational management: 1) adaptation to the task environment, 2) adaptation to new
technology, and 3) adaptation to the scale of production. Adaptation to the task
environment refers to identifying the organizational structure and pattern of management
as either organic or mechanistic. That is, in organizations with mechanistic structures,
managers may focus on directing the internal environment because mechanistic firms
predominated among the firms operating in a relatively stable task environment. Thus,
managers have few chances to interact with the external environment. In contrast, an
organic form of organization which is hierarchically flat in feature in terms of non-
bureaucratic organizational structure tends to have a higher incidence of dynamic
interaction with the external environment. Therefore, managers in organizations with
organic structure should be able to evaluate the construction of their organization with
regard to the external environment.
For human service organizations the organizational mechanisms are more likely
to be an organic type because human service organizations predominantly depend on
external resources to provide services to clients. Since human service organizations
heavily depend on government agencies to provide funding for services, managers must
understand the contingent approach to develop various strategies such as buffering and

20
bridging to adapt to the external environment. In addition, because consistent and
adequate benefits from service fees and investments are not available for human service
organizations, managers should focus on developing managerial strategies based on
contingency theory.
Furthermore, managers using contingency theory are more likely to adopt new
technology because the types of technology used by an organization are often seen as
highly determinative of the structural arrangement (Zhao et al., 2010). Finally, the size of
the organization is an important element in determining organizational structure and
process for managers in human service organizations. Using contingency theory,
managers should be able to indicate the effect of growth on the scale of operation for
their organizations.
In summary, contingency theory provides a theoretical perspective considering
an organization as one element in a social system. It also demonstrates that to effectively
conduct their organization, managers should attempt to understand the relationship
between the external environment (e.g., government welfare policies, pattern of
charitable giving, and community resources) and their organization. Schmid (2009) stated
that an organization which identifies and interacts with environmental components is
more likely to have higher performance levels as well as a better chance of survival than
one which does not. Therefore, contingency theory provides a significant rationale for
understanding the interaction between government welfare spending and private giving to
human service organizations in order to survive and thrive in intensively competitive
environments.

21
Resource dependence theory
A second theoretical perspective for understanding the importance of the
interaction between government welfare expenditures and private giving to human
service organizations is resource dependence theory. Resource dependence theory
explains the distribution of power within an organization by focusing on the
organization’s dependence on the environment (Jun & Armstrong, 1997). Resource
dependence theory emphasizes political and economic dependencies on the environment.
Since Pfeffer and Salancik (1978) proclaimed the importance of understanding the
resource dependence theory, researchers have indicated that organizations would
experience uncertainty of their survival depending on their adaptation to their
environments (Callen, Klein, & Tinkelman, 2010; Evelyn, 2009; Hasenfeld, 2009; Hatch,
1997; Lecovich, 2001; Schmid, 2004).
Organizational dependency is defined as “The product of importance of a given
input or output to the organization and the extent to which it is controlled by relatively
few organizations” (Pfeffer & Salancik, as cited in Lecovich, 2001, p. 23). That is,
“dependence” is the organization’s need to construct internal mechanisms in order to
manage or adapt to its external environments. The degree of organizational dependency,
then, can be measured as the potency of the external organizations in the given
organization’s environment—particularly, in the process of the organization’s decision-
making.
Based on these conceptual frames, Evelyn (2009) and Schmid (2004) predicted
that an organization must exchange resources in order to survive and that, in exchanges,
power differences must arise. Particularly, the power-dependence issue matters for human

22
service organizations because human service organizations are heavily dependent on a
variety of external financial resources (Smith, as cited in Lecovich, 2001). Smith (as cited
in Lecovich, 2001) examined three types of human service organizations in Israel and
found that the organizations were particularly affected when they developed their
strategies and structures under pressure of external resources. Therefore, it would
behoove managers in human service organizations to change their power-dependence
relations with the environment and direct their activities toward maximizing their ability
to acquire resources and minimizing the control by the external environment over their
internal operations.
In summary, resource dependence theory provides a theoretical rationale for
managers in human service organizations to manage their power and resource
dependency on the external environment. First, they should reduce dependence on the
external environments as much as possible by controlling necessary resources. They also
should increase dependence of agents in the environment on the distinctive service and/or
products of the organizations.
Political economy theory
Political economy theory is another significant theory which provides theoretical
rationale to understand the interaction between government spending and private giving
to human service organizations. Political economy theory focuses on organizational
dependence on two fundamental resources: 1) legitimacy and power (political resources)
and 2) production (economic) resources. The essential perspective of political economy
theory is that organizations depend on the resources controlled by agents and interest
groups in the external environment (Hasenfeld, 2009; Schmid, 2009). That is, in order to
23
survive and produce services, organizations must amass both political resources and
economic resources.
Political resources refer to matters of legitimacy and distribution of power as
they affect the propriety of an agency’s existence (Hasenfeld, 2009). Economic resources
refer to the maximization of efficiency and the combination of factors affecting the cost
of producing and delivering a given level of services (Wamsley & Zald, 1973). According
to Hasenfeld (2009), the core activities of an organization are determined by the rules and
agreements of how resources are mainly assigned in the organization. Wamsley and Zald
(1973) noted that the rules emerge through the process of negotiation and bargaining
between political resources and economic resources which provide input to establish and
maintain the organization.
The key theoretical concept of the political economy approach is that
organizational activities are directed by interrelationships between political and economic
resources. In particular, the interrelationship between the structure of legitimacy and
power (political resources) and the system for producing and exchanging goods and
services (economic resources) is an important element in determining organizational
regulations and rules. Furthermore, through modification of the resource-allocation rules,
significant organizational changes could arise such as establishment, termination, or
alteration of services. This approach is important for human service managers because the
activities of their organizations heavily rely on government welfare policy. Because of
insufficient resources, human service organizations must be efficient and effective in
producing and providing services. Therefore, based on the political economy approach,

24
human service managers should acknowledge the interrelationship of political and
economic factors.
In summary, contingency theory indicates the importance of understanding an
organization’s interaction with the external environment. As part of the interaction with
the external environment, contingency theory supports the necessity of understanding the
relationship between government funding and private giving to human service
organizations. According to contingency theory, managers in human service organizations
should devote their efforts to interacting with their external environment to respond to
exogenous increases in demands for their services. This is an important managerial
responsibility because managing the interaction with the external environment is
significantly associated with an organization surviving and thriving.
Resource dependence theory provides a theoretical rationale to understand the
interaction between government funding for welfare provisions and private giving to
human service organizations. According to resource dependence theory, managers are
more likely to respond to cutbacks in preferred sources of revenues by pursuing less-
preferred areas because directors should aim to change their power and resource
dependence on the external environment. Managers should increase their efforts to obtain
all available funding based on the most effective budget plans in order to change their
power-dependence relations with the environment. In order to maximize autonomy of the
organization in relations with the external environment, particularly government relations,
human service managers should understand the impact of government funding and
private giving to human service organizations because these two funding sources are their
most important financial resources.

25
In addition, political economy theory supports the importance of the relationship
between government welfare provisions and human service organizations. Political
economy theory emphasizes organizational dependence on political and economic
resources. Specifically, the surviving or thriving (even the existence) of human service
organizations heavily depends on political legitimacy for welfare provisions. That is,
based on government rhetoric of welfare policy, human service organizations may or may
not face crucial financial challenges. According to political economy theory,
organizational activities are affected by interactions between political and economic
resources. Therefore, knowing the interaction between government welfare spending and
private giving to human service organizations helps managers in human service
organizations drive the political legitimacy for welfare toward affordability of the
organization.

26
Chapter Two:
The Impact of Public Welfare Expenditures on Philanthropic Giving
The first research question is how changes in one source of income will interact
with other income streams of human service organizations. That is, if the government
increases funding for children in poverty, will private donations for children in poverty
fall? Similarly, if a social work agency working for children in poverty receives or
acquires new government spending (e.g., grants from the Child Poverty Act, 2010), will
overall philanthropic giving to the agency, not only for child aid programs, but for all of
its programs, fall? This question is associated with the ‘simple’ crowding effect between
government spending and philanthropic giving to charity.
The main research question is what is the total effect of government welfare
expenditures on private giving while considering the three components: federal spending,
state spending, and private contributions, known as the ‘joint’ crowding effect. In order to
identify the impact of the changes of government spending on welfare on private giving
to human service organizations, two level of government spending were identified-
federal and state government spending. Thus, the measurement of crowd-out becomes
more complicated. Federal expenditures changes directly cause changes in both state
government spending and donations. In turn, the induced change in state government
spending causes a further change in donations. The combined effect of both causal paths
is called “joint” crowd-out.
Describing the interaction is complex: directions of revenue interaction vary
depending on types of nonprofits and a number of identified factors; a wide range of
interaction effects were estimated based on addressed data resources for study; and a
27
various arguments about statistical analysis to exam crowd-out effects. Due to the
complexities initiating interaction between government spending and private giving,
these relationships need to be studied from various angles. Even though a large number of
studies have attempted to measure the interactions between government spending and
private giving, the job is far from finished. In particular, the existing empirical studies
ignore the interaction between federal, state, and nonprofit revenue streams when
estimating the crowd-out effect (Steinberg, 1993). The extent of the joint crowd-out is
crucial for evaluating the efficacy of federal grants for social services. The study of joint
crowd-out can provide detailed insight into the interaction between federal government
spending for the public good and private giving to charity.
Before examining the relationship between government spending and
philanthropic giving to human service organizations, empirical background of the crowd-
out is presented in this chapter, including a conceptual definition of crowd-out or-in and
the joint crowd-out; empirical results from prior studies on crowd-out; data resources,
econometric specification, and data analysis for this study.
Definition of Simple, Joint Crowd-Out and Significance of Joint Crowd-Out
As briefly indicated above, the term “crowding effect” refers to the concurrent
changes in private giving to a public good when government funding for the same good is
changed either negatively or positively. In responding to an increase in government
expenditures (either in the form of direct service provision or through grants and
contracts with nonprofit organizations), philanthropic individuals may decrease their
donations. Economists refer to this phenomenon as crowd-out. The same effect can occur
in the opposite direction. Government spending may escalate private giving to charity

28
because the government spending signals the quality of a public good. This phenomenon
is identified as crowd-in.
Steinberg (1993) posited the estimated negative coefficient of the interaction
between government spending and private giving to charity as the ‘simple’ crowd-out: the
effect of aggregate government spending on aggregate donations. As illustrated in Figure
2, simple crowd-out estimates the relationship between government spending and charity,
all else held constant. The simple crowd-out has been much studied both theoretically and
empirically. Tinkelman (2009) found 46 empirical studies were associated with the
simple crowd-out including Garrett and Rhine (2007), the most recent study in his
research.
Figure 2. Simple Crowd-Out
Source: Steinberg, R. (1989). The theory of crowding out: Donations, local government spending, and the
“New federalism”, p.12.
However, the simple crowd-out model has been criticized by researchers. For
example, the estimation approach with simple crowd-out model has been criticized as
suffering from endogeneity bias (Kingma, 1989; Smith, 2006; Steinberg, 1987). While
indicating the limitation of the simple crowd- out model, researchers suggested some
alternatives to indicate the relationship between government spending and private giving
such as 2SLS (Two-Stage Least Square), instrumental variable techniques, or indect least
Federal & Local Government welfare spending
Externally determined Variables (control)
(tax price, income, needs, tastes, etc.)
Total
Donations

29
squares estimation of joint crowd-out (Payne, 1998; Smith, 2006; Steinberg, 1990).
Specifically, Steinberg (1987, 1990, 1993) asserted the joint crowd-out can be an
alternative to estimate the interaction between government spending and private giving to
charity without endogeneity.
As indicated in Figure 3, joint crowd-out estimates the relationship between
government expenditures and private giving while considering exogenous changes when
the federal government transfers grants to state governments. That is, the joint crowd-out
model estimates the total effect of federal government spending on both state government
spending and private giving.
The basic assumption for joint crowd-out is that federal government spending
has a wide variety of intertwining links because federal spending affects both state
spending and private donations. Because state government spending and private
donations both react to federal spending, the interaction between the changes in federal
spending and the changes in state spending should be estimated in order to indicate the
total effect of government spending on private giving. That is, joint crowd-out estimates
the sum of direct and feedback effects.
Figure 3. Joint Crowd-Out
Source: Steinberg, R. (1989). The theory of crowding out: Donations, local government spending, and the
“New federalism”, p.12.
Externally determined
control variables
Federal governmental grants
Local Donations
Local (tax generated)
government spending
Direct effects Feedback
effects

30
In addition, another advantage of examining joint crowd-out to estimate the
interaction between government spending and private giving is that joint crowd-out
estimation can provide political insight about federal government centered welfare
provision, which is federalism. According to Steinberg (1990), if the estimated coefficient
indicates total joint crowd-out—which is dollar-for-dollar crowd-out, the federal
government should not provide public services because voluntary donations would
completely replace government spending.2 If there is joint crowd-in, the federal
government expenditures are significantly efficient. This finding can provide political
perspective about welfare provision. Therefore, joint crowd-out estimation is important to
estimate an accurate crowd-out relationship between government welfare spending and
private giving to human service organizations.
Theory of Joint Crowd-Out
Insofar as examination of crowd-out is important for indicating the government’s
ability to provide public services, along with individuals’ motivation for giving, a large
body of studies has been examined for crowd-out effects. Previous empirical and
theoretical studies have generally concluded that government expenditures partially
crowd out private donations. The previous scholarship on the crowd-out hypothesis has
examined several models based on the crowd-out theory, such as the simple crowd-out
model and the joint crowd-out model.
2 Steinberg(1990)’s conclusion holds whenever positive donations occur at the desired level of total
spending. Because donations cannot be negative, a sufficiently large amount expenditure would increase
total spending.

31
Simple crowd-out model
Early theories of donations for public goods, such as Warr (1982), Roberts
(1984), and Bernheim (1986), were developed based on the assumption that individuals
have complete information on the menu of charities available and express their demands
for the public goods through their donations (Andreoni & Payne, 2003; Rose-
Ackerman,1986). At one extreme, if donors derive utility solely from the provision of the
charitable expenditures regardless of the source of funding, Warr (1982), Roberts (1984),
and Bernheim (1986) proved that government spending on the public good crowds out
donations to the same kind of public goods on a dollar-for- dollar basis (“completes
crowd-out”): that is, one dollar of government subsidies will displace one dollar of
philanthropy. This is because the increases in government expenditures, financed by
taxing the donors, acts just like a redistribution of income.
However, a dollar-for-dollar crowd-out model was consistently rejected with
statistical confidence by most empirical studies of simple crowd-out including Andreoni
(2006), Heutel (2009), and Payne (1989). The studies asserted that a dollar-for-dollar
replacement is only guaranteed under strong assumptions: that donors are purely altruistic
in their giving and care only about the total provision of a charitable good ; that donors
are indifferent between giving directly or giving indirectly by being taxed (Andreoni,
2006; Heutel, 2009; Payne, 1998, 1989).
The empirical studies with crowd- out effect following studies by Warr (1982)
and Roberts (1984) have typically produced results based on the simple crowd-out model
in which either fixed-sum government spending or government production reduce private
giving. For example, Cuellar (2004) estimated the impact of government expenditures to

32
social welfare on total level of contributions to the poor based on Roberts (1984, cited in
Cuellar, 2004)’s general methodology, which examined the simple crowd-out hypothesis.
Horne (2006) examined the relationship between the change in government subsidy from
1998 to 1999 and the change in charitable giving from 1999 to 2000 using Form 990 data.
Although the simple crowd-out studies estimated a certain degree of crowd-out
coefficients between government spending and private giving to charity, researchers
indicated limitations of the results from the simple crowd-out studies. Steinberg (1987),
Kingma (1989), and Smith (2006) asserted that if the interaction between government
spending and private giving to charity is performed with OLS (Ordinal Least Squares),
then the estimated coefficient with the simple crowd-out is biased and inconsistent
because the government spending variable is endogenous.3 For example, when people
increased their demand for welfare services when Hurricane Katrina hit New Orleans in
2005, we would expect demands for both government and private contributions to be
high. Undoubtedly, in response to high demand, private giving and public spending to
provide public services should be increased. Thus, the estimated coefficient between
government spending and private giving has more chance to be biased if we do not
consider the situation, which is one of endogeneity.
Rose-Ackerman (1986) stated two limitations of the assumption for the simple
crowd-out model (failure to consider various features of nonprofits and ignoring
regulation of government funds) and demonstrated that government spending need not
crowd out private donations. She probed the possibility that fixed-sum grants can
3 Endogeneity arises if there is a correlation between the parameter and the error term in the estimated
regression equation. If the estimated coefficient β is associated with ε, the estimated coefficient is biased
and inconsistent. Endogeneity exists when the model includes an endogenous explanatory variable
(Chenhall & Moers, 2007).

33
increase private giving if they are accompanied by regulatory policies that raise the
marginal benefits of private contributions.
Joint crowd-out model
Local governments receive grants from federal government in the forms of
categorical assistance and general assistance such as revenue sharing. Thus, local
government expenditures are precisely sensitive to changes in federal government funds.
Simultaneously, local government is sensitive to change in individual donations.
Therefore, Steinberg (1989) stated that federal government expenditures may be expected
to alter both private donations and local government spending. In turn, induced changes
in donations in local government expenditures have feedback effects on donations and
vice versa (Steinberg, 1987). The total effect of the change of federal government
spending on the changes of state government spending and private spending is denoted as
joint crowd-out.
Steinberg (1987) developed a theoretical treatment of the joint crowd-out model
that depends on a decisive voter model in which the voters are cognizant of private
donors and of simple crowd-out, and vote accordingly (Lindsey & Steinberg, 1990). The
fundamental assumption for the joint crowd-out model is that federal government
transfers to state governments are exogenous. According to the joint crowd-out model,
the exogenous changes in federal government spending affect both the changes in private
donations and the changes in state and local government expenditures. The ultimate total
effect should be regarded in order to estimate the interaction between government
expenditures and private donations because each individual regards the donations of

34
others, state spending and federal spending as perfect substitutes for one another or vice
versa.
Steinberg (1987, 1989) stated that joint crowd-out can be partial, zero, or
negative in political-economic equilibrium. Joint crowd-out is generally partial, i.e., total
expenditures will rise and donations will fall, but to a smaller degree than the total grants.
This result is guaranteed if the simple crowding out of donations is partial. When there is
simple crowd-in of donations, joint crowd-out is also likely to be partial, but zero or joint
crowd-in is also possible. If there is a total simple crowd-out, which is a dollar-for-dollar
crowd-out, then either state spending or total donations must be zero. In this case, joint
crowd-out is not well defined. The joint crowd-out model is quite complicated. Some of
these conclusions can be changed when federal grants are of the matching variety. For
example, matching grants reduce the marginal costs of induced local government
spending. Thus a matching grant will be able to purchase a larger service increment. With
matching grants, the tendency toward partial joint crowd-out is reduced or reversed and
total spending may go up by an amount that exceeds the grants (Steinberg, 1989).
Empirical Results: Crowd-Out/-In or Neither
Since the late 1970s, researchers have measured the effect of a change in
government funding for nonprofit organizations on private donations. The studies were
attempted with a variety of processes using various datasets such as organizational level
data, surveys of giving, and aggregates of individual income tax return data. Horne (2005)
summarized the previous research on the crowd effect at two different levels: 1) at the
aggregate level, examining government spending on public services or the interaction
between overall government spending and total giving to charity (e.g., Abrams &

35
Schmitz, 1984; Jones, 1983; Steinberg, 1985, as cited in Horne, 2005); and, 2) at the
organizational level, examining the interaction between government expenditures for
specific charitable organizations (e.g., Andreoni & Payne, 2003; Borgonovi, 2006; Dokko,
2009; Gruber & Hungerman, 2007; Hughes & Luksetich, 1999). Tinkelman (2009)
summarized empirical studies of interaction between government funding and donations
by the aggregated level of data such as Form 990s data, surveys of giving to different
types of charity, and individual income tax data for charitable giving.
Table 1 is a summary of 45 published or unpublished empirical studies
indicating the interaction between government spending and private giving to nonprofit
organizations in this study. The writer counted 21 studies which probed some degree of
crowd-out coefficients; 5 studies which reported crowd-in coefficients; 11 studies which
found both crowd-out and –in depending on the different types of nonprofit organizations
or different levels of the government funds; and 8 studies which found no statistically
significant relationship between government spending and private giving. Fifteen studies
indicated crowd effects between government welfare expenditures and private giving to
human service organizations as part of their results.
Among the 21 empirical studies reporting crowd-out, eight studies used data
aggregated at the charity level such as the data on nonprofit revenues and expenses from
federal tax returns filed by IRS Section 501(c)(3) organizations, known as Form 990.
Four studies provided crowd-out effects using individual income tax return data, and nine
reported crowd-out coefficients using surveys of charitable giving. For example, Kingma
(1989), Andreoni and Payne (2008), and Dokko (2009) aggregated government funds and

36
private giving data from 990s. Andreoni and Payne (2008) found that total crowd-out of
private giving is approximately 56 percent.
Table 1. Summary of Empirical Studies of the Crowded-Out by Major Finding
Data level Partial/Full
crowd-out
Partial/full
crowd-in
Both crowd-in
and out
No statistically
significant
relationship
Using
organizational-
level data (e.g.,
Form 990s,
charity
information
from the
organization)
Andreoni & Payne
(2008),
Brown &
Finkelstein (2008),
Dokko (2009),
Gordon (2004),
Gruber &
Hungerman (2007),
Hungerman (2009),
Kingma (1989),
Payne (1998)*
Arulampalam,
Backus, &
Micklewright
(2009, NUS),
Borgonovi &
O’Hare
(2004),
Heutel
(2009)*
Khanna &
Sandler
(2000, NUS),
Smith (2007)
Andreoni &
Payne (2003)*,
Borgonovi
(2006)^,
Brooks (2000b),
Hersey (2010),
Horne (2005)*,
Okten &
Weisbrod
(2000),
Smith (2006),
Steinberg (1987)
Brooks (1999,
2003)
Hughes &
Luksetich
(1999),
Khanna,
Posnett, &
Sandler
(1995,
NUS)*,
Payne (2001)
Using
aggregates of
individual
income tax
return data
Abrams & Schmitz
(1978, 1984*)
Amos (1982)*
Steinberg (1990)
Schiff (1990*) Day & Devlin
(1996, NUS),
Lindsey &
Steinberg
(1990)*
Using survey of
giving data
(e.g., charitable
giving from
individual
donors)
Cuellar (2004)*,
Duncan (1999),
Garrett and Rhine
(2007)
Hungerman (2005),
Kingma &
McClelland (1995),
Ribar & Wilhelm
(2002),
Simmons &
Emanuele (2004),
Straub (2002),
Steinberg (1985,
NUS)*
Brooks
(2000a)*^,
Schiff (1985)*
Reece
(1979)*
Note: - Studies are listed in alphabetical order within each type of data used.
- Studies were categorized in both crowd-out and - in, if the study reports both crowd-out and –
in effects for different types of nonprofits or different levels of government funding.
- NUS indicates non-US data.
- * indicates that the study attempted to estimate crowd-out with human service organizations.
- ^ indicates that the study reported a curvilinear relationship between government spending and
donations
- Andereoni and Payne (2003) examined the relationship between government spending and
giving of fundraising for nonprofit organizations, not about donations.

37
Kingma (1989) found that a dollar of government funding increase crowded out
53 cents of private giving to public radio stations. Dokko (2009) reported 50 to 60 cents
crowd-out for art organizations. In addition, the following studies reported crowd-out
interaction between government spending and private giving using organizational level
data to aggregate charitable giving and government spending including Brown and
Finkelstein (2008); Dokko (2009); Gordon (2004); Gruber and Hungerman (2007);
Hungerman (2009); Kingma (1989); and Payne (1998). Consequently, the studies
indicating crowd-out effect using an organizational level of data reported that a dollar of
government funding to nonprofit organizations tends to result in the displacement of
private giving between 14 and 60 cents.
Researchers also provided crowd-out coefficients using different data sources
(Abrams & Schmitz, 1978, 1894; Amos, 1982; Steinberg, 1990). Instead of using 990s,
the studies used individual income tax return information through the National Bureau of
Economic Research TAXSIM program which contained itemized deductions by income
class. Those studies using individual income tax return data reported that a dollar of
government funding to nonprofit organizations tends to crowd out private giving of
between 4.6 and 46 cents.
Furthermore, some studies used surveys of individual giving to obtain data on
charitable giving and also noted crowd-out interaction of between government funds and
private giving. For example, Simmons and Emanuele (2004) used a national sample of
the activities of donors collected by the Gallup Organization and the Independent Sector,
called Giving and Volunteering 1996 (Independent Sector 1996, as cited in Simmons &

38
Emanuele, 2004). They found minimal crowd out between government expenditures and
the donation of time and money. Cuellar (2004) estimated crowd-out coefficient using the
American Association of Fund-raising Counsel’s annual, Giving USA, and the various
issues of the Statistical Abstracts of the United States for government expenditures. The
following studies investigated crowd-out interaction using survey data at the
organizational level: Duncan, 1999; Hungerman, 2005; Kingma & McClelland, 1995;
Ribar & Wilhelm, 2002; Steinberg, 1985. The studies measuring individual philanthropic
giving by surveys of recipient organizations found that a dollar increase in government
expenditure tends to crowd out private giving to nonprofit organizations from a minimum
of 2 cents to a maximum of 24 cents.
In contrast, a few studies determined that government funding to nonprofit
organizations tends to stimulate private giving. As indicated in Table 1, five studies
reported a crowd-in pattern (Arulampalam et al., 2009; Borgonovi & O’Hare, 2004;
Heutel, 2009; Khanna & Sandler, 2000; Smith, 2007). All five of these studies
investigated the interaction using organizational level data. For example, Borgonovi and
O’Hare (2004) addressed crowd-in of government spending for art organizations such as
art museums, theaters, and art institutions using the National Endowment for the Arts
(NET) and Form 990 data from the art organizations. Heutel (2009) reported a
statistically significant crowd-in effect of government spending to six types of nonprofit
organizations (e.g., food, agriculture, nutrition, and human service charities) using 990s.
Khanna and Sandler (2000) found government spending crowded in voluntary donations
using U.K. Charity Trends and U. K. Charity Statistics data, which contained detailed
accounts of income and expenditures of charities in the U.K. In another U.K study,

39
Arulampalam, Backus, and Micklewright (2009) found a crowd-in effect with U.K.
Charity Trends data, in which a dollar in government spending crowded in 15 cents in
private donations.
Other crowd-out studies have had mixed results. Eleven studies found mixed
results based on the different types of nonprofit organizations (e.g., religious, health, and
human service organizations) or different levels of government funds (e.g., federal funds
vs. state funds, long-run government funds vs. short-run government funds). Among the
11 studies, seven addressed the mixed coefficient using organizational level data
(Borgonovi, 2006; Brooks, 2000b; Hersey, 2010; Horne, 2005; Okten & Weisbrod, 2000;
Smith, 2006; Steinberg, 1987). Two studies using individual income tax return data found
both crowd-out and –in effects (Andreoni & Payne, 2001; Schiff, 1990). Using a survey
of private giving data, two studies reported government spending either crowded out or in
private giving depending on the type of nonprofit organizations (Brooks, 2000a; Schiff,
1985).
Using 990s, Horne (2005) estimated the crowd-out effect between government
spending and private donations to 15 different types of nonprofit organizations (such as
art/culture/ humanities, education, universities, environment, human service, youth
development, animal-related). He reported that in the nonprofit sector as a whole, a dollar
of government sources crowded in five cents in charitable giving. However, the crowd-in
did not uniformly predict the interaction. Nine subsectors demonstrated a crowd-in effect
of government funds on charity (e.g., arts and culture, education, college/ university,
environment, medical research, housing/shelter, public safety/disaster, youth
development, and human service organizations); whereas five subsectors demonstrated a

40
crowd-out effect (e.g., animal-related, recreation/sport, international/ civil rights/ social
action, community improvement organizations). Using 990s, Smith (2006) estimated the
interaction between the NEA grants and non- NEA grants (e.g., private donations and
state level government spending to art organizations). He reported that NEA grants
crowded out private donations, but NEA grants crowded in state-level government
spending.
Some empirical studies found mixed effects using individual income tax return
data. For example, Using the National Survey of Philanthropy 1974, a survey of some
2,500 households, Schiff (1985) reported that charitable contributions fell as local
governments’ funding increased. Specifically, he found that increases in certain types of
government spending (e.g., cash transfers to the needy) crowded out donations, but
increases in other types (e.g., spending on social services) stimulated charitable giving.
Brooks (2000a) also studied the interaction using Giving USA data for charitable giving
and U.S. Census data for government funds. He estimated the crowd-out effect for four
different types of nonprofits (social and human service, health, arts and culture, and
education organizations). He reported that a dollar in state government spending crowded
out two cents in donations to social and human service organizations, while federal
spending did not have a significant impact on private giving. Private giving to health
organizations is crowded out by state spending, but is not statistically significantly
affected by federal spending (Brooks, 2000a).
Furthermore, some studies indicated a curvilinear pattern, with crowd-in at low
levels of government support and crowd-out at a high level. For example, Brooks (2000b)
reported that some orchestras will tend to experience a leveraging effect up to about

41
$8,200 in government support per concert; after this point, private support will begin to
be crowded out. That is, Brooks (2000b) indicated a curvilinear relationship in which that
lower level of government funding for symphony orchestra stimulated private giving, but
higher government funding led to crowd-out. In another study using 990s, Hersey (2010)
identified a curvilinear association between government spending and private giving.
Finally, some studies reported no statistically significant relationship between
government spending and private giving including Brooks (1999), Day and Devlin (1996),
Hughes and Luksetich (1999), Khanna et al. (1995), Lindsey and Steinberg (1999), Okten
and Weisbrod (2000), Payne (2001), and Reece (1979). For example, Brooks (1999)
found no significant relationship for symphony orchestras. Hughes and Luksetich (1999)
found federal government spending did not have a significant interaction with
government spending and private giving to art museums.
Several studies investigated the association between government welfare
expenditures and private giving to human service organizations. Among 45 empirical
studies, 15 addressed the interaction between government welfare expenditures and
private giving to human service organizations as part of the analysis. The studies focusing
specifically on human service organizations occasionally reported that state and local
government spending crowded in private giving to human service organizations; and the
studies found no significant association with the federal government spending. For
example, Brooks (2000a) discovered one dollar in state government welfare expenditures
crowded out two cents in private giving to human service organizations; while federal
government welfare spending did not have a statistically significant association with
private giving. In contrast, Schiff (1985, as cited in Steinberg, 1999) reported charitable

42
giving to social welfare charities increases when state and local government spending
increases. Another study by Schiff (1985) reported that charitable giving to social welfare
organizations fell as government cash transfers increased, but rose as other government
welfare expenditures increased. Heutel (2009) found a crowd-in coefficient interaction
between government spending and donations to human service organizations even though
the size of the coefficient was the lowest statistically significant crowd-in rate. Andreoni
and Payne (2001) also reported a significant positive relationship between government
spending and fundraising efforts from human service organizations. Finally, Horne (2005)
indicated a positive interaction between government spending and private giving to the
human service sector by almost two cents.
On the other hand, consistent negative coefficients were reported for the
interaction between government welfare expenditures and charitable giving to human
service organizations. Garrett and Rhine (2007) discovered a crowd-out coefficient
between giving to welfare agencies and state and local welfare spending, though it was
not statistically significant. Cuellar (2004) discovered a dollar increase in government
welfare expenditures crowded out private contributions to human service organizations
by almost five cents. Payne (1998) found government contributions to human service
organizations crowded out about 53 cents of private giving to human service
organizations. Finally, Steinberg (1985) reported a very small crowd-out effect, with only
five cents displaced.
For the last empirical study review, a few studies estimated the interaction
between government spending and private giving using the joint crowd-out specification
(Smith, 2006; Steinberg, 1987, 1990, 1993). Steinberg (1990) indicated that using

43
aggregate government spending would result in biased crowding-out estimates, because
state and local grants are endogenous and may change in response to a change in federal
spending on nonprofits. Measuring the joint crowd-out model, Steinberg (1993)
discovered that federal welfare spending had a statistically significantly positive effect on
state spending on welfare, but partially crowded out charitable donations. That is, when
state government spending remained constant, federal government spending crowded out
4.6 cents of private giving, but if state government spending had not been allowed to
respond to the change in federal grants, donations would have fallen by only 1.4 cents
(Steinberg, 1993). Joint crowd-out has a much larger coefficient than simple crowd-out
because state spending moves in the same direction as federal grants.
As summarized, the empirical evidence concerning crowd-out between
government spending and private giving is somewhat mixed: some were with crowd-out,
some were with crowd-in, some were neither, and some were both crowd-out and –in.
However, a majority of the studies indicated that government funding to nonprofit
organizations crowds out private donations (e.g., Amos, 1982; Hughes & Luksetich, 1997;
Khanna et al., 1995; Kingma, 1989; Payne, 1998; Schiff, 1990; Steinberg, 1985).4
Nevertheless, some papers still supported a crowd-in effect (Borgonovi & O’Hare, 2004;
Garrett & Rhine, 2007; Heutel, 2009; Khanna & Sandler, 2000). Furthermore, some
studies stated a curvilinear relationship, which crowd-in at low levels of government
support and crowd-out at high levels (Borgonovi, 2006; Brooks, 2000b; Hersey, 2010).
4 Brooks (2003) stated these seven economic studies were the major studies which conducted crowd-out
effects from 1982 to 1998.

44
Even some studies estimated contradictory results measuring the same dataset.5
Generally, empirical studies have reported partial crowd-out effect. However, certain
studies examining the relationship with human service organizations were more likely to
report crowd-in interaction between government welfare expenditures and private giving
to human service organizations.
Empirical Results: Limitations and Suggestions for Further Crowd-Out Study
Empirical results about the interaction between government spending and
private giving, researchers addressed the interaction in almost any way possible.
Although a large number of studies of the government spending and private giving
relationship do provide a strong foundation for this research, the analysis is far from
finished because previous studies demonstrate important shortcomings. The main
limitations are associated with the various data sources for the study, failure to estimate
interactions, and sample size.
First of all, researchers criticized crowd-out studies using aggregated data at the
charity level (Horne, 2005; Payne, 2009; Tinkelman, 2009). Using organizational level
data (e.g., tax return data, Form 990s) are not granular enough to allow comparison of
government spending with private giving (Horne, Johnson, & Van Slyke, 2005;
Tinkelman, 2009). According to Payne (2009), charity-level data cannot demonstrate the
entire reaction by a donor to a change in government funding. For example,
organizational level data cannot prove whether donors stopped giving to a charity
5 Borgonovi and O’Hare (2004), Dokko (2009), and Hughes & Luksetich (1999) estimated the interaction
with the NEA data. Borgonovi and O’Hare (2004) reported crowd-in relationship; whereas, Dokko (2005)
and Hughes and Luksetich (1999) indicated crowd-in effect.

45
because the charity received more government spending or they just stopped giving to
that particular charity.
The quality of charity level data also matters for two reasons: nonprofit
organizations have different intentions when filling out the forms that reflect the charity’s
revenue and expenditures; and the quality of charitable giving and government spending
information is likely to be inaccurate because many nonprofits are run by volunteers. In
addition, some types of government spending (e.g., tuition grants and Medicare) would
likely be recorded in the organizational Form 990 as program service revenue rather than
as federal or state government subsidies. In addition, Tinkelman (2009) stated that studies
using tax return data on individual itemized charitable deductions cannot measure
charitable giving from individual to particular causes such as giving to human service
organizations. Furthermore, composite government spending using charity level data
cannot be precise because public spending covers many different types of programs
(Tinkelman, 2009). Therefore, the findings from the previous studies using organizational
level data (e.g., Andreoni & Payne, 2008; Borgonovi & O’Hare, 2004; Brown &
Finkelstein, 2008; Dokko, 2009; Heutel, 2009; Kingma, 1989; Okten & Weisbrod, 2000;
Smith, 2006; Steinberg, 1987) are difficult to generalize to indicate the interaction
between government spending and private giving.
In contrast, a few studies used individual philanthropy data to address the
relationship between government spending and private giving because of the inaccuracy
of charitable giving information from organizational level data. For example, Schiff
(1985) used 1974 data from the National Survey of Philanthropy, Day and Devlin (1996)
used a Canadian survey from 1986 and 1987, Brooks (2003) and Garrett and Rhine (2007)

46
used charitable giving data from Giving USA. However, none of these empirical studies
examined the interaction between government welfare expenditures and charitable giving
to human service organizations using individual philanthropic data without endogeneity
issues. Steinberg (1990) estimated the full set of interactions for social welfare charities.
However, he used a proxy for individual donations (United Way allocations), whereas I
used direct data on giving to people in need.
In addition, the estimated individual charitable contributions had reliability and
validity issues even though a few studies used individual philanthropic giving datasets.
That is, the survey methodology of charitable giving studies had been an issue for
researchers. For example, in November 2000, the Center on Philanthropy at Indiana
University assembled a group of leading researchers in philanthropy studies. Six
scholarly papers—Havens and Schervish (2001), Hall (2001), Kennedy and Vargus
(2001), Kirsch, McCormack, and Saxon-Harrold (2001), O’Neil (2001), Rooney,
Steinberg, and Schervish (2001) — were prepared for a conference and addressed
methodological issues in surveying giving and volunteering behavior. In the results,
researchers emphasized the limitations of existing individual giving data such as response
rates, oversamples, questionnaire design, respondent selection, and unit of analysis. In
regard to improving surveys of charitable giving, researchers recommended these points:
interviewers should sample households across the complete spectrum of income;
interviewees should be the household member who knows the most about the household’s
giving; interviewers should be well-trained; interviewers must use a variety of prompts to
aid respondents’ recall; and interviewers should inquire about a broad range of
information about voluntary giving (Havens & Schervish, 2001; O’Neil, 2001).

47
Another downside of previous studies is associated with the estimated results
with simple OLS estimation (Payne, 2009; Smith, 2006; Steinberg, 1987, 1993;
Tinkelman, 2009). Simple OLS estimation has been employed in many studies. However,
some researchers stated that estimated coefficients of government spending and private
giving with simple OLS equation are biased and inconsistent (Kingma, 1989; Smith,
2006; Steinberg, 1987). For example, Seaman (1980, as cited in Tinkelman, 2009) found
simple OLS tended to overestimate the crowd-out effects while comparing simultaneous
equations model to OLS models.
Similarly, Payne (1998) found significantly different results with 2SLS, which is
an alternative to OLS designed to estimate endogeneity bias. After Payne (1998) raised
the endogeneity and omitted-variable issues about the results from previous studies with
simple OLS models, some researchers examined crowd out using 2SLS specification (e.g.,
Brooks, 1999; Dokko, 2009; Gruber & Hungerman, 2007; Hungerman, 2005; Payne,
1998) or lagged variables (Horne, 2005).
Other researchers argued that the possibility that the interaction between
government spending and private giving changes by different levels or types of
government funding. The vast majority of empirical studies posited either a simple linear
or a log-linear relationship between government spending and private giving. However,
researchers asserted both the level of government spending (e.g., federal or state
government spending) and the length of government spending (e.g., long term or short
term) should be considered to estimate the interaction (Borgonovi, 2006; Brooks, 2000b;
Steinberg, 1990, 1993; Tinkelman, 2009). For example, Borgonovi (2006) and Brooks
(2000b) stated that crowd-out effect should be estimated by distinguishing lower or

48
higher level of government spending. Steinberg (1990) asserted federal government
spending and state government spending should be distinguished to estimate the crowd-
out effect. Also, he estimated the total effect of the relationship between government
spending and private giving because both state or local government and individual donors
would react if federal government expenditures to a state or local government were
changed.
In summary, prior studies have had insufficient data to compare the interaction
between government spending and private giving. That is, using organizational level data
is not granular enough to estimate the interaction because of incompleteness and
inaccuracy of the reported data about government spending and private giving. For data
analysis with aggregated data, the estimated coefficient with the sophisticated technique
(simple OLS) was biased and inconsistent. Also, the relation between government
spending and private giving is not a linear relationship.
Thus, researchers recommended some alternative methods to avoid the biased
coefficient problem. For example, in order to deflect endogeneity and omitted-variable
bias, some researchers addressed crowd-out effects with different statistical analysis (e.g.,
2SLS) specification instead of using OLS or considering instrument variable techniques
including, Payne (1998), Hungerman (2005), Gruber and Hungerman (2007), and Dokko
(2009). Other researchers used joint crowd-out to avoid those problems (Kingma, 1989,
Smith, 2006, Steinberg, 1987, 1990, 1993).
49
Chapter Three: Research Methodology
In this chapter, conceptual definitions of key variables are given such as the
definition of charitable giving to human service organizations and other control variables.
Data resources, research equations, and data analysis are addressed.
Data Sources
The data used in this study to analyze the interaction between government
welfare expenditures and private giving to human service organizations came from two
separate sources: the Center on Philanthropy Panel Study (COPPS) and the U.S. Census
datasets. The data on individual philanthropic giving to human service organizations were
taken from the COPPS dataset. COPPS is a module of the Panel Study on Income
Dynamics (PSID), the nation’s first and only ongoing longitudinal study about charitable
giving over time.6
Steinberg and Wilhelm (2003) highlighted the advantages of using the COPPS
dataset. Particularly, they accent that the COPPS dataset contains high-quality contextual
data including income, wealth, work hours, wages, health, family structure, and other
demographic data. While considering the recommendations from the conference for the
survey methodology of charitable giving study hosted by the Center on Philanthropy at
Indiana University in 2000, Steinberg and Wilhelm (2003) and Wilhelm (2002) stated
that among the existing philanthropy datasets in the U.S., the COPPS dataset most
accurately estimates individual charitable giving. As follow up studies, the two papers by
6 PSID is fielded by the Institute for Social Research at the University of Michigan and has surveyed the
dynamic and interactive aspects of family economic, demographic, health, and philanthropy from the
nationally representative same households since 1968. In 2001, Indiana University added the philanthropic
component in the PSID survey and has been accumulating data on philanthropic giving behavior every two
years. The COPPS contains not only comprehensive, nationally representative data on charitable giving, but
also solely encloses panel data on giving in the United States.

50
Wilhelm (2006, 2007) speak to the quality of the COPPS data, showing that COPPS has a
far lower item-nonresponse rate than other giving surveys and that reported levels of
giving track those in the “gold standard” cross-sectional study (the 1974 National Survey
of Philanthropy) very well up to the 90th percentile of the income distribution.
For this study, the 2007 wave of COPPS dataset was used to aggregate the
charitable giving to human service organizations.7 The philanthropic questions were
asked in 2007 about giving in 2006. Finally, a total of 8,289 households participated in
the 2007 wave of the PSID and 8,110 households answered the philanthropy section. The
family weights that are provided by the PSID research team at the University of Michigan
to yield nationally representative results is used to estimate the charitable giving to
human service organizations. The PSID research team provides the family weight
variable because of the oversampling issue. In this study, the family weight variable is
applied in the regression.8
For estimating philanthropic giving information, the COPPS survey covered
philanthropic giving to charity with eleven different types of nonprofit organizations
including the following: religious, arts and culture, combined purposes, education,
environment and animal-related, helping people in need, health, international,
neighborhood and community, youth and family, and other organizations.
For estimating total amount of charitable giving to human service organizations,
the estimated dollar amount of philanthropic giving to human service organizations was
7 The COPPS 2007 data is available at http://www.philanthropy.iupui.edu/Research/copps/
#dataSets. This data set was generated from the raw data with some cleaning explained in the user’s manual
at the same site. 8 The oversampling issue does not discussed in this paper and weights get at additional things, like attrition
bias, as well as the initial oversample in the SEO portion of the data.

51
transferred as dollar per capita in order to examine the joint crowd-out effects. In order to
estimate the per capita dollar amount of charitable giving to human service organizations,
the estimated total amount of charitable giving to human service organizations was
divided by the total number of family members per household.9 In addition, the
estimated per capita dollar amount of charitable donations to human service organizations
was adjusted for inflation in order to estimate the size of the coefficient of joint crowd-
out effect in constant dollars, using the CPI to adjust for inflation.
Individual levels of socio-economic demographic variables were taken from the
COPPS 2007, including household’s age, gender, education level, ethnicity, marital status,
religion, employment status, heath condition, number of kids, wealth, and income. In
addition, the price of giving data was generated using COPPS 2007 by Wilhelm and Han
(2012).
The data on federal and state government welfare expenditures in FY 2005 were
taken from various sources of the U.S. Census datasets. First of all, the federal
expenditures on public welfare in 2005 were taken from the U.S. Department of
Commerce, Bureau of the Census. The data were released in February 2007.10
The state
and local government expenditures on public welfare were taken from the U.S. Census
database that was generated by the Public Policy Institute (PPI). The PPI provided state
and local per-capita public welfare spending in 2005 that was generated based on Census
9 The total number of family size was generated as follows: One person was added to the total number of
children who are living with a household who is single, widowed, or separated. Two persons were added to
the total number of children when a household was married in COPPS 2007. 10
The federal government expenditures to state government for public welfare were retrieved from the
Knowledge Center at the Council of States Governments
(http://knowledgecenter.csg.org/drupal/system/files/2.3.pdf)

52
Bureau State and Local Government Finances.11
Both federal government funds for
public welfare programs to state and the state and local government expenditures for
public welfare were estimated by a dollar per capita. The detailed federal and state
government spending on public welfare in 2005 listed in Appendix A. Additionally, state
levels of socio-economic characteristics were taken from the U.S. Census database as
well.
Conceptual Definitions of Key Variables
In this study, charitable giving to human service organizations was identified as
giving to people in need and giving to youth and family organizations. The Panel Study
Income Dynamic (PSID, 2010) defines philanthropic giving to people in needs as
charitable giving to organizations that help people in need of food, shelter or other basic
necessities. The conceptual definition of giving to youth and family organizations is the
donation to organizations that provide youth or family services, such as to scouting, boy’s
and girls’ clubs, Big Brothers and Sisters, foster care, or family counseling. Based on
these conceptual definitions of charitable giving to human service organizations, the total
amount of giving to human service organizations was estimated by the sum of these two
types of giving. Although, the Center on Philanthropy Panel Study (COPPS) estimates
twelve different types of charitable giving—particularly, the COPPS estimates the giving
to organizations for combined purposes— the giving for combined purposes did not
include the estimate of total contributions to human service organizations in this study.12
Because the organizations for people in need and the organizations for youth and family
11
The State welfare government expenditures were retrieved from the Public Policy Institute of New York
State, Inc. (http://www.ppinys.org/reports/jtf/welfarespending.htm) 12
Charities that provide for combined purposes include the United Way, the Catholic Charities, the United
Jewish Appeal, community foundations, and private foundations (PSID, 2010).

53
are on the front line these organizations provide direct benefits and services to people in
need.
For data analysis, the estimated charitable giving to human service organizations
was transformed as dollar per capita in this study in order to put government spending
and donations on the same scale. Originally the COPPS data does report each household’s
giving as current dollar amount. In order to generate the dollar per-capita donations to
human service organizations, the estimated total household giving was divided by the
family members in each household in the 2007 COPPS.
The conceptual definition of government welfare expenditures was identified as
the federal or state/ local government expenditures for public welfare, including federal
assistance programs, cash assistance programs, and other public aid programs. According
to the Government Finance and Employment Classification Manual (U.S. Census,
1/12/2012), public welfare expenditures include the following: Supplemental Security
Income (SSI), Temporary Assistance for Needy Families (TANF), Medical Assistance
Program (Medicaid), food stamps, and other public aid expenditures. Table 2 provides a
detailed description of the welfare expenditures of the public welfare section. The
government spending on public welfare measure is the sum of all the expenditures listed
in Table 2.

54
Table 2. A Description of Public Welfare Program
Category Definition
Federal
Categorical
Assistance
Programs
The expenditures associated with three federal programs
- Supplemental Security Income (SSI).
- Temporary Assistance for Needy Families (TANF).
- Medical Assistance Program (Medicaid).
Other Cash
Assistance
Programs
Cash payments made directly to individuals contingent upon their
need, other than those under federal categorical assistance
programs (e.g., poor relief; general relief; home relief; emergency
relief; general assistance; refugee assistance; medical assistance,
housing expense relief, energy assistance; Home Energy
Assistance Program, or LIHEAP, emergency assistance).
Vendor
Payments
for Medical
Care
Public welfare payments made directly to private vendors for
medical assistance and hospital or health care, including Medicaid
(Title XIX), plus mandatory state payments to the federal
government to offset costs of prescription drugs under Medicare
Part D. Payments to vendors or the federal government must be
made on behalf of low-income or means-tested beneficiaries, or
other medically qualified persons.
Vendor
payments
for other
purposes
Payments under public welfare programs made directly to private
vendors (i.e., individuals or nongovernmental organizations
furnishing goods and services) for services and commodities,
other than medical, hospital, and health care, on behalf of low-
income or other means-tested beneficiaries.
Institutions
Provision, construction, and maintenance of nursing homes and
welfare institutions owned and operated by a government for the
benefit of needy persons (contingent upon their financial or
medical need), and veterans.
Other
welfare
expenditures
All expenditures for welfare activities not classified elsewhere
(e.g., regulation of private welfare activities; children’s services,
such as foster care, adoption, day care, nonresidential shelters,
and the like; social services for the physically disabled, such as
transportation; low-income energy assistance and weatherization
intergovernmental payments; temporary shelters and other
services for the homeless; welfare-related community action
programs). Source: U.S. Bureau of the Census (n.d.). Government Finance and Employment Classification
Manual: Covering the activities of the Federal, state, and local governments.
In addition, the other control variables, measured at the state level, were taken
from the U.S. Census database, including poverty rate, state median household income,
percentage of population who are 65 years or over in the state, and the percentage of state
level owner occupied houses. As for exogenous variables that significantly affect the

55
determinants of charitable donation, Andreoni and Payne (2008), Cuellar (2004), Schiff
(1985), and Straub (2002) stated that the changes in charitable donations were
significantly associated with those three state-level control variables.
First of all, the percentage of poverty level is included because previous studies
(e.g., Andreoni & Payne, 2008; Cuellar, 2005) have found the poverty level to be
significant determinants of donations. The state income is a significant factor in
estimating the relationship between federal government spending and private giving to
human service organizations. Cuellar (2004) and Straub (2002) stated that family income
has a significant and positive effect on charitable contribution.
In this study, the measure of state income was estimated as per-capita median
family income by state. The percent of population over 65 years old and the percent of
housing units in a state that are owner occupied were important variables that have a
significant impact on the relationship between government spending and private giving.
According to Steinberg (1988), the percent of population over 65 years old has positive
effects on charitable giving. That is, the higher the percentage of population who are 65
years or more, the more likely they are to donate more to charity. The positive association
between age and giving has been repeatedly reported in philanthropic studies (Andreoni,
2006; White, 1989).
In contrast, the percentage of occupied housing units that are owner-occupied is
anticipated to have a negative effect. Steinberg (1988) noted that a higher percentage of
occupied housing rate affects the needs for charitable donations; thus, charitable giving
would not be necessary. Therefore, the percentage of occupied housing units would
negatively affect charitable giving. However, the effect is possible in the other direction.

56
Based on the empirical suggestion from previous studies, the writer included those four
state level variables as independent variables in this study to estimate the crowd-out
coefficient.
In addition, a variety of socio-economic variables were included in the long
version of the reduced-form equation in order to estimate an accurate coefficient without
bias. The differences in household demographics included price of giving, gender,
education level, ethnicity, marital status, number of children, health condition, religion,
employment status, wealth without house, and income.
In particular, the price of giving was examined in the regression equation
because the price of giving generally affects charitable donation. In general, higher
marginal tax rates reduce the cost of giving (price of giving), then the lower price of
giving induces more charitable giving. That is, the price of giving has a negative
association with charitable giving. The impact of the price of giving on charitable giving
has been explained in several studies. For example, Clotfelter (1985, as cited in Cuellar,
2004) noted that donors were generally sensitive to variations in tax rates. Thus, the price
of the giving is exogenous to the decision of how much to contribute. The price of the
giving variable was included to estimate the crowd-out effect in Schiff (1985) and has
been indicated in crowd-out studies ( Cuellar, 2004; Kingma, 1989; Straub, 2002).
The conceptual understanding about price of giving is that the estimated
charitable giving amount is the amount of after-tax income which must be dedicated to
transfer a dollar to charity. For example, the price is one dollar for non-itemizers and
dollars (from 1$ 1 to $m), where m is the donor’s marginal tax rate. Cash donations that
made by living individuals not subject to the alternative minimum tax to eligible charities,

57
amounting less than 50 percent of adjusted gross income computed without any net
operating loss carrybacks. PSID data which is original sour of COPPS data, does not
report tax information in detail, especially the PSID does not survey the actual marginal
tax rate. Wilhelm and Han (2012) were able to generate the price of giving from a set of
input variables tailored to tax-return data using the NBER’s TAXSIM program. Wilhelm
and Han (2012) addressed that the generated price of giving variable is appropriate to use
in PSID data, even though PSID data does not fit the bill precisely.
For the simple state crowd-out equation, the independent variables were
included as follows: federal government public welfare expenditures in 2005, the state
poverty rate, the state median income, the percentage of total population who are 65 and
over, and the percentage of occupied housing units in the state.
Descriptive Statistics of Government Spending and Charitable Giving
As shown in Table 3, COPPS 2007 shows that 65.5 percent of all U.S.
households donated to charity in 2006. Specifically, 35.2 percent of donor households
contributed to human service organizations in 2006. For charitable donor households only,
the median total amount of giving to charity was $870 (average $2,213). The median gift
to human service organizations was $200 (average $500). For charitable giving including
non-donor households, the median total amount of giving to charity was $301(average
$1,449). The median gift to human service organizations including non-donors was $0
(average $164) . Other charitable donors’ socio-demographic characteristics such as
gender, education level, ethnicity, marital status, religiosity, and income are shown in
detail in Table 3.

58
Table 3. Overview of Charitable Giving in 2006
Category Giving
Rate
Average amount
per household
Median amount
per household
Overall Giving 65.5% $2,213(*$1,449 ) $870 (*$301)
Human Services
Giving 35.2% $500(*$164) $200(*$0)
Category Percentage Category Percentage
Probability of
overall giving 65.5% Catholic 30.0%
Probability of
human service giving 35.2% Jewish 4.1%
Female 28.95% Protestant 64.0%
Male 71.05% Other non-Christian 1.5%
High school or less 42.2% Orthodox 0.4%
College attendees 30.2% Others 2.1%
Bachelor degree 20.2% Itemizer 58.9%
Master/PhD degree 7.4% Non-itemizer 41.1%
White 74.0% Working now 63.4%
Black 13.6% Unemployed 4.1%
Asian or
pacific islander 1.75% Retired 19.0%
Hispanic or Latino 7.9% Disabled 4.7%
Other race 2.8% Other 8.8%
Health
condition
Excellent 20.6% Category Average (Median)
SD
Very good 34.3% Number of Children 0.6 (0) 1.02
Good 28.7%
Fair 11.6% Income in 2004
$70,951
($49,770) 93546.7
Poor 4.8%
Married 49.7% Wealth (exclude house values)
$267,742
($24,200) 1455517
Never married 22.4% Total giving amount $2,213
($870) 4238.8
Widowed 9.1% Human services giving
amount
$500
($200) 963.2
Divorced 15.7% State & local
expenditure in 2005 $1,237
Separated 3.1% Federal expenditure
in 2005 $173.7
Average state income
in 2005 $34.484
Poverty level in 2005 12.9%
Note: -Percentage of each socio-demographic variable was estimated after weighted with family
weight 2007 variable. Also, the responding households who did not respond on philanthropic section
were excluded to estimate the socio-demographic characteristics and philanthropic behavior.
-Private giving to HSOs and total giving amount were estimated with $ per year in 2006 dollar.
-Federal, state, and local government spending on public welfare in 2005 were estimated with $ per capita.
* The estimated dollar amounts including both donor and non-donors.

59
According to the U.S. Department of Commerce, the federal government
provided overall $173.7 per capita for public welfare in 2005. The federal government
paid out approximately $622.6 per capita to California state and local governments for
public welfare which was the largest amount of grants in 2005, followed by New York
state ($518.1 per capita), Michigan ($221.0 per capita), and Colorado ($216.1). In
addition, the state and local government expenditures on public welfare were an average
of $1,237 per capita in 2006. In 2005, New York state paid out for public welfare almost
$2,236 per capita in 2005, which was the largest amount of grants among the 50 states,
followed by Alaska ($2,085), and Rhode Island ($2,014). In contrast, the Nevada state
government paid out $718 per capita for public welfare in 2005, which was the smallest
amount among the 50 states, following by Colorado ($738) and Texas ($866). The
detailed information is stated in the Appendix D.
Results of the crowd-out effect of federal government expenditures on charitable
donations to human service organizations were mixed. The detailed results from all
regression analyses are summarized in Appendix A.
Econometric Specification
The joint crowd-out estimation was outlined by Steinberg (1987) and has been
presented recently in Cuellar (2004) and Smith (2006). In the Steinberg model (1987), the
joint crowd-out model was developed based on the assumption that federal government
transfers to state governments are exogenous. The exogenous change in federal
government spending would lead to the changes in state government expenditures
(simple government crowd-out). The exogenous change in federal government spending
also leads to changes in donations in the state (simple donation crowd-out). In turn, state

60
government spending responds to induced changes in donations, and the combined effect
of these two factors on state government spending is called joint government crowd-out.
That is:
Donations respond both to the original federal grant and the induced change in state
government spending, and the combined effect is called joint crowd-out of donation. The
correct structural form equations are as follows:
ε
ε
Where:
is per person giving in household i in state s,
denotes the per capita federal government welfare spending
in state s in 2005
indicates the per capita state government welfare spending
in state s in 2005,
is all the state level control variables and is a vector as
denotes individual i’s socio-demographic characteristics as individual
specific control variables
The reduced form of this structural model is:
=
=
The key identifying restrictions are that the donor cares only about total government
spending, and the state government cares only about donations plus federal grants.
entifies joint crowd-out of donations and identifies joint crowd-out of stage

61
government spending on public welfare. The simple crowd-out coefficient is estimated by
the joint crowd-out of donations parameter ( and the joint crowd-out of state
government expenditures ( ). The implied parameter for simple crowd-out of donations
is . In this study, the reduced forms were examined in order to estimate the
coefficient of joint crowd-out.
Estimation Technique: Tobit Specification and OLS
To identify the total effects of federal spending changes on state spending and
private donations, three relationships were examined. First, this paper examined the joint
crowd-out of donations while controlled without interruption. Second, the joint crowd-out
of state spending was tested. Third, the simple crowd-out of donations is estimated based
on the coefficients of the joint crowd-out of donation and the joint crowd-out of
government spending while holding other variables constants.
In detail, first of all, the Tobit model is used to estimate the joint crowd-out
coefficient between charitable giving to human service organizations and federal
spending. The estimated coefficient with the Ordinary Least Squares (OLS) is
inconsistent if a dependent variable has a number of its values clustered at a limiting
value, usually zero. Greene (1999) stated that censoring issue can be leaded when a data
is incompletely observed. That is, when data on the dependent variable is limited but not
data on the repressors, censoring issue are occurred. COPPS data contains censoring issue
because many households reported giving no money to charity in 2006. The Tobit model
is an applicable analysis method to eliminate the censoring error, even though the Tobit
model does not diminish the problem. However, the Tobit estimator’s consistency rests
only if conditional moment test of the homoscedasticity and normality assumptions are

62
conducted. According to Wilhelm (2006), although PSID data does not fulfill the
homoscedasticity and normality assumption, the Tobit estimates are numerically similar
to the estimates by more advanced and statistically consistent methods such as
symmetrically censored least squares (SCLS) or censored least absolute deviations
(CLAD). Thus, I examined the total effect of federal government welfare spending on
state government welfare spending and charitable giving to human service organizations
in this study (joint crowd-out of donations) with the Tobit model.
In addition, the Tobit regression results were interpreted with a margin which
was predicted Y* is greater than zero with calculated numeric derivatives and integrals
(dydx) because the raw Tobit coefficients are not directly useful, as they indicate the
effect of an increase in the covariate on a fictional donations variable that can take
negative values. Instead, I report the average unconditional marginal effect of each
continuous covariate on actual donations in Table 4 blow. This unconditional marginal
effect incorporates expected contributions from those who do not donate prior to the
increase in the covariate as well as increases in contributions from those who donate
regardless. For dichotomous variables, I report the expected unconditional effect on
donations when the covariate changes from 0 to 1.
Second, the joint crowd-out coefficient between state spending and federal
spending was employed with OLS with robust error. The Tobit model was not attempted
for this regression because state and federal government expenditures did not have a
censoring problem. Robust standard error is used because standard error estimates of
commonly applied covariance matrix estimation techniques are biased. Robust standard
error improves the statistical efficiency of the coefficient estimates. King and Robert
63
(2012) reported more than 50,600 articles using robust standard error across all academic
fields. Thus, robust standard error can estimate the joint crowd-out of government
spending on public welfare actuality.
Finally, the simple crowd-out of donations was estimated using a simple
function of the reduced-form coefficients. Steinberg (1993) noted that the coefficient of
simple crowd-out of donations is able to be estimated by the parameter, the estimated
coefficient of joint crowd-out of donations divided by the coefficient of joint crowd-out
of government spending plus 1. This approach was used by Lindsey and Steinberg (1990),
Schiff and Steinberg (1988), and Steinberg (1985, 1993).

64
Chapter Four: Results
Crowd-Out Estimations
The joint crowd-out of donations was directly revealed by the coefficient on
federal spending in the reduced-form estimation. As shown in Table 4, the result on the
joint crowd-out effect of donations suggests that the federal government expenditure on
public welfare crowds out $0.051 per capita in private contributions to human service
organizations while holding state spending constant in the donations but the estimate is
not statistically significant. That is, the result indicates that when a dollar per capita of
federal government spending on public welfare is increased, 5.1 cents per capita of
charitable donations to human service organizations would be decreased. The full results
are stated in Appendix A.
Table 4. Joint Crowd-Out of Donations
Independent Variables Tobit Analysis Tobit analysis
(with a new philanthropy giving)
Federal spending -0.051(0.041) -0.0313(0.0228) ^
State income 0.0009(0.001) -0.0013(0.010) ^
State poverty rate -1.372(1.784) -13.103(13.091) ^
Price of giving -1.849(0.318)*** -25.150(3.620)*** ^
State age 65 or more -2.570(1.641) -27.862(11.545) ^
State owner occupied house -0.521(0.260) 1.410(7.028) ^
Total sample 6,629 6,629
-Dollar amount was estimated in a dollar per-capita.
- Dollar amount was adjusted for inflation in 2005 dollar value.
- Delta method standard errors are in parenthesis.
- The estimated coefficients are the estimated average marginal effect with respect to observable
donations.
- The reported coefficients are the average incremental effect on observable giving relative to the
excluded category.
- The reported coefficient for price of giving is an elasticity form.
- The estimated coefficients for the control variables are not displayed in this table.
- ^ additional joint crowd out coefficients with extended charitable giving to HSOs, including religious
giving, combination giving, needy giving, youth and family giving
***P<0.001, **P<0.05, * P<0.10

65
Although crowd-out is not statistically significantly different from zero, it is
very significantly different from negative 1. Thus, we can confidently reject the
hypothesis that joint crowd-out of donations is dollar for dollar. A 99% confidence
interval has an upper limit of around 17 cents. Thus, the crowd-in effect cannot be
rejected, but whether crowd-out or crowd-in, the magnitude is small. This result of the
joint crowd-out is similar to those obtained by other empirical studies. For example,
Schiff and Steinberg (1988) reported approximately 3.3 cents of joint crowd-out in social
welfare donations. Lindsey and Steinberg (1990) found 4.6 cents of joint crowd-out in
donations to social services.
Furthermore, as shown in Table 4, additional estimations for the joint crowd-out
of donations was attempted to explore the robustness of the conclusion to alternative
measures of donations. The joint crowd-out effect was tested with a new philanthropic
giving variable.13
The results with extended charitable giving information indicates that a
dollar per capita of federal grants to public welfare crowds out 3.13 cents per capita of
private donations, but statistically insignificant (p-value = 0.171).
The joint crowd-out effects of federal government expenditures on state and
local level spending on public welfare (joint crowd-out of government spending) is
revealed by the coefficient on federal spending in the reduced-form state spending
equation. The coefficient of joint crowd-out of government spending is estimated while
subtracting 1 from the coefficient in the state spending equation to avoid double counting.
The results are presented in Table 5. The estimated coefficient of joint crowd-out of
13
A new philanthropic giving to human service organizations for the stacked regression was generated
with the charitable giving not only to people in need and youth and family giving, but also to religious
organization (the organizations for religious and combination giving (the organizations for multi-functional
purposes such as Catholic Charities and the United Way).

66
government spending is 0.409, which is the coefficient with total state government
spending. In order to avoid double counting, the coefficient of joint crowd-out of
government spending was subtracted 1 from the coefficient— the former is 0.409 – 1,
which is (-0.591). Therefore, the result of the OLS regression suggests that federal
government expenditure on public welfare crowds out 59.1 cents per capita in total state
government spending on public welfare. However, as is true for the joint crowd-out of
government spending, the estimate is not statistically significant. That is, when federal
government spending on public welfare is increased by a dollar capital, approximately
59.1 cents per capita of state government expenditures on public welfare would be
decreased but statistically insignificant.14
Table 5. Joint Crowd-Out of State Spending (Including Fixed Effects Panel Estimator)
Independent Variables OLS Analysis Fixed-Effects
Federal spending 0.409(0.553) 0.083(0.772)
State income 0.0186(0.013) 0.059(0.013)
State poverty rate 7.184(20.223) 14.065(33.010)
State age 65 or more 32.403(51.667) -1.126(231.83)
State owner occupied house -3.749(2.610) -21.141(31.647)
Total sample 50 100 - Dollar amount was estimated in a dollar per-capita.
- Standard errors are in parenthesis.
- The state government spending is total state government spending on public welfare.
***P<0.001, **P<0.05, * P<0.10
The joint crowd-out of government spending results was not statistically
significant because of few observations. With only 50 observations for this dependent
variable, it is not surprising that the covariates are generally insignificant. To see the
14
The estimated coefficient of joint crowd-out of government spending was inconsistent with flypaper
effect which reports that own-financed state spending goes up when federal grant goes up. However, the
result was not significant because the estimated joint crowd-out of government spending was statistically
insignificant.

67
effect of sample size on estimates, the information of government expenditures on public
welfare in 2003 was added and tried variants. First, the stacked regression was examined
while adding more government spending observations to the data because it is more
robust to measurement error bias with more samples. Then a fixed-effect panel estimator
was attempted to estimate the joint crowd-out of government spending. The fixed-effect
panel estimator is usually more persuasive than OLS for panel data because it is more
robust to exclude “omitted variable bias.” As shown in Table 5, the result of fixed-effects
estimator indicates a smaller coefficient of crowd-out effect, but was statistically
insignificant (59.1 cents with OLS vs. 91.7 cents with fixed-effects).15
The simple crowd-out of donations was estimated in this study after inferring the
parameters from the reduced-form estimates for the joint crowd-out of donations and the
joint crowd-out of government spending. According to Steinberg (1993), under the
identifying assumption that simple crowding out of donations by federal grants is equal to
simple crowding out of donations by state government expenditures, the parameter of
simple crowd-out can be identified as quotients of reduced-form parameters.16
The result of simple donations crowd-out suggested that government
expenditures on public welfare crowded out approximately 3.56 cents per capita of
private charity to human service organizations. That is, if state spending had not been
allowed to respond to the change in federal grants, private donations to human service
organizations would have fallen by only 3.56 cents per capita. In addition, the
approximate 95% confidence interval for simple crowd-out ranges from 44.68 cents to
crowd-in 9.99 cent. While this is a wide range and so simple crowd-out cannot be
15
The former with fixed-effect panel estimator was 0.083 – 1 = -0.917. 16
In particular, the implied simple crowd-out of donations parameter is

68
confidential signed. The results can confidentially reject the hypothesis of Warr (1982)
and Roberts (1984) that simple crowd-out is 100 percent.17
The negative simple crowd-out effects between government spending and
private giving have been probed in previous studies. Amos (1985), Schiff (1990),
Steinberg (1985), and Payne (1998) reported the crowd-out coefficient with the federal
level of expenditures to social welfare. In detail, Amos (1982) found a crowd-out of 46
cents in private donations. Payne (1998) discovered crowd-out of 53 cents, while Schiff
(1990) found crowd-out of 40 cents. Steinberg (1985) found very small crowd-out effects
(only 5 cents). The estimates from Amos, Payne, Schiff, and Steinberg’s study were
statistically significant. Other studies, such as Lindsey and Steinberg (1990) and Reece
(1979), discovered the crowd-out effect with federal spending on social welfare, but the
estimations were statistically insignificant. Overall, Brooks (2005) summarized that
empirical crowd-out studies reported an average of $0.36 crowd-out in donations to
social welfare organizations. Compared to empirical studies, in this study, a much smaller
joint crowd-out effect was observed, with only 4.9 cents displaced, similar to the result
by Steinberg (1985).
In addition, compared to the size of simple crowd-out and the joint crowd-out,
the size of the simple crowd-out of donations was smaller than the joint crowd-out (3.6
cents per capita vs. 5.1 cents per capita). The joint crowd-out is larger than simple crowd-
out because state spending moves in simple direction as federal grants. That is, when
federal spending increases, state spending increases because the state receives more
17
Because the simple crowd-out parameter is the ratio of two estimated asymptotically normal coefficient.
It is Cauchy-distributed, and the t-distribution gives the wrong significance levels. Rather than report the
exact significance level, which required approximation, I construct an empirical confidence interval from
the bounds of the 95% confidence intervals for the joint crowd-out of donations and state spending

69
grants from the federal government. Lindsey and Steinberg (1990) found simple crowd-
out of 1.4 cents and joint crowd-out of 4.6 cents. Based on both studies, it is clear that the
estimated coefficient of joint crowd-out is larger than the estimated coefficient of simple
crowd-out.
Other Economic and Socio-Demographic Variables
The estimated coefficient between charitable giving to human service
organizations and other independent variables are shown in detail in Appendix A. Higher
state per capita income has a very small positive impact on charitable donations to human
service organizations, but the estimate is not significant. That is, as per capita income is
increased by a dollar, an approximately 0.09 cent per capita of donations to human
service organizations is increased. A higher percentage of state level poverty has a
negative but insignificant impact on private donations.
The price of giving has a negative impact on private giving to human service
organizations. The estimate is statistically significant (p<0.001). That is, the result of the
price of giving indicates that the price elasticity is -2.15, implying that a one percent
increase in the price of giving causes a 2.15 percent decrease in the amount donated
p<0.001). The negative impact of the price of giving on charitable donations has been
reported in previous studies. For example, Smith (2006) reported a negative but
insignificant impact of the price variable on donation. Schiff (1985) discovered a higher
coefficient of the price of giving on charitable donations than those of most previous
studies, which generally ranged from 1.2 to 1.5—the coefficient was -4.97 in the Schiff
(1985) study. However, the estimate was statistically insignificant. Compared to the
general range of the price elasticity, the estimated price elasticity in this study was a little
70
higher than the general range of the coefficient. The range of the price elasticity can be
varied because Bakija and Heim (2011) concluded different time-path of tax incentives
across states imply an elasticity of charitable giving in response to a persistent change in
price that is in excess of one in absolute value. The estimated price elasticity is not
strictly comparable to most published studies because this study estimated a constant
slope, rather than a constant elasticity functional form and because the estimates are for
per capita giving whereas most others are for household giving.
The percentage of state level populations who are 65 years or over has a
negative impact on private giving but the estimate is not statistically significant. The
percentage of state level owner occupied houses has a negative but insignificant impact
on private giving to human service organizations.
The results for the socio-demographic variables to estimate the coefficient on
philanthropic giving to human service organizations are presented in Appendix A. Age,
gender, education level, ethnicity, marital status, employment status, health condition,
wealth, and income statistically significantly affect the amount of donations to human
service organizations. For example, when a donor is a year older, donors are statistically
significantly more likely to donate 93.2 cents in per capita giving to human service
organizations than younger donors (p<0.001). Donors who have a master’s or PhD
degrees are statistically significantly more likely to donate 52.4 cents per capita to human
service organizations than donors with a high school education or less (p<0.001). Married
donors are statistically significantly more likely to donate 48.8 cent per capita to human
service organizations than never married donors (p<0.001). When the income is increased

71
a dollar, donors are statistically significantly more likely to donate 0.02 cents per capita
to human service organizations (p<0.05).
The OLS results of the joint crowd out of government expenditures with other
independent variables are reported in Appendix A in detail. The results indicate that
higher state per capita income has a positive impact on state spending on public welfare
and the estimate is not statistically significant. That is, when a dollar per capita of state
level income increased, state expenditures on public welfare is increased approximately
$1.86 per capita. A higher percentage of state level poverty has a positive and statistically
insignificant impact on state spending on public welfare. The percentage of state level
populations who are 65 or over has a positive impact on state spending on public welfare,
but is statistically insignificant. The percentage of state –level owner-occupied houses has
a negative impact on state spending on public welfare but it is statistically insignificant.
That is, when one percent of state level owner occupied house increased, state
governments would decreased $374.90 per capita of their expenditures on public welfare,
but the estimate is not statistically significant.

72
Chapter Five: Conclusions
Conclusion
Crowd-out estimates tell us how effective government expenditures on public
welfare are in raising total expenditures on public services. Specifically, the joint crowd-
out results address the more detailed impact of government spending on public welfare
on state and private donations to human service organizations. Empirically, crowd-out
effects have been probed to address the relationship between government involvements
and private participations to provide social services under the classic crowding-out
hypothesis. Under the classic crowd-out hypothesis, the government believes that
government participation in providing public services crowds out private participation.
That is, when a charitable organization receives government spending, philanthropic
donations to the organizations could fall because donors let the given tax moneys
substitute for the organizations that donate. This hypothesis has been supported by
empirical studies. Although the crowd-out effects are empirically proven as a statistical
truth, the relationship has been generally examined with philanthropic giving to different
types of nonprofit organizations rather than human service organizations. In addition, the
estimated coefficients from empirical studies have been repeatedly criticized by
researchers, such as biased coefficients and limited information about philanthropic
giving to nonprofit organizations. A few studies have probed the crowd-out hypothesis
focused on human service organizations without the identified limitations. This study
provided unique insight about the crowd-out effect for human service organizations using
a superior date set for individual giving (COPPS) and to identify both simple and joint
crowd-out effects.

73
Combining information from COPPS 2007 with the data on federal and state
government expenditures on public welfare that was sourced by Census data bases, this
study was able to provide information on charitable giving to human service
organizations and federal and state government expenditures on public welfare. A
reduced form was estimated in which contributions and state spending each depends on
federal grants, income, price, poverty rate, the percentage of age 65 or over, the
percentage of house ownership, and socio-demographic variables.
As addressed in the results, three conclusions seem apparent. First, the joint
crowd-out of donations, if it exists, is small in magnitude, with a point estimate of 5.1
cents per capita in donations to human service organizations. The estimated simple
crowd-out effect was even smaller than the estimated joint crowd-out effect.
In addition, federal government spending on public welfare crowds out state
government spending on public welfare. The negative impact of federal government
spending on state and local government spending was inconsistent result than other
empirical studies. Researchers have reported the positive impact of federal government
spending on state government spending is called ‘flypaper effect’—noting that money
sticks where it hits (Chernick, 1099; Knight, 2002; Inman, 2008; Schiff &
Steinberg ,1988; Steinberg (1990), Thornton, 2012).18
Although, the results from this
18 According to Inman (2008), in the late 1960/s James Henderson and Edward Gramlich (1969) studied
the direction of empirical research on how local government tax and spend. They reported an extra dollar of
personal income increased government spending on the order of $0.02 to $0.05 but an equivalent extra
dollar of grant-in-aid increased government spending by $0.30 to often as much as full dollar. When they
reported this effect, Arthur Okun call this larger effect of lump-sum aid on government spending a ‘flypaper
effect’ which indicates money seems to stick where it hits. The flypaper effect appears to be a real
phenomenon and has been repeatedly probed in previous studies which have consistently explained the
crowd-in effects between federal spending and state spending. Chernick (1979) and Knight (2002) provided
specification of a political contract between a central government and local governments as a way to

74
study found crowd-in effect of federal spending on state spending, it is unable to support
or reject the flypaper effect because of large standard errors.
In summary, several implications follow from the results. The findings relating
to the joint crowd-out effect lend support to the joint crowd-out theory (Lindsey &
Steinberg, 1990; Schiff & Steinberg, 1988; Steinberg, 1983). Steinberg (1988) and
Lindsey and Steinberg (1990) indicated that the estimated coefficients with the simple
crowd-out could be smaller than the coefficients with the joint crowd-out. The results in
this study lend support to the theory of joint crowd-out effects. Thus, the joint crowd-out
could more accurately estimate the relationship between government spending and
private giving. Based on the overall effects of federal government spending on private
giving to provide social welfare services, the positive effects of government involvements
to provide public services may be supported by the results from this study. Rose-
Ackerman (1984) asserted that government spending to charity need not reduce total
expenditures for providing public services and may even lead to increased private giving.
The results in this study demonstrate that overall government efforts to fund public
services do not have a serious negative impact on providing social services to people in
need, even if the crowd-out effect does occur. This finding is extremely useful to social
welfare policymakers or social work administrators charged with designing public
welfare programs or enforcing public policies for people in need.
Furthermore, fixed-sum grants can increase private giving because the grants
can increase marginal benefits of private donations. In addition, if public policy makers
understand the ‘flypaper effect’. According to Inman (2008), over 3,500 research papers have supported the
flypaper effect, including Henderson and Gramlich (1968, as cited in Inman, 2008), Gramlich (1969, as
cited in Inman, 2008), Thornton (2012), Schiff and Steinberg (1988), and Steinberg (1990).

75
provide better information about the charities that received their donations, the charitable
donors are more likely to donate to their charities.
Limitations and Suggestions
In examining the interaction between government expenditures on social welfare
and private contributions to human service organizations, there are certain problems
arising from data limitations. Although, the philanthropic giving to human service
organizations was conceptually identified as the charitable giving to organizations for
people in need and giving to youth and family charities, the human services segment
includes not only increasing the well-being of the poor, but also providing services for
programs like disaster prevention and relief, recreation, environments, and athletics,
many of which may benefit the non-poor. In this study, charitable giving to nonprofit
organizations was not included to estimate the philanthropic giving to human service
organizations. Thus, this study may have underestimated charitable giving.
Similar to the limitation of the conceptual definition for private giving to human
service organizations, the conceptual definition of government expenditures of public
welfare in this study may be limited to denoting government spending for social welfare.
It is true that human service organizations have received government spending not only
from the identified sources in this study, but also from other government resources. Some
of the federal grants to human service organizations is passed on by the state government
contracting out welfare expenditures or making grants to welfare organizations. The
government data that used in this study is not allows recognizing this identification. Also,
donors many not react to direct state provision of welfare services or provision through
contracting out, or relatively untied grants. In this study, the different sources of
76
government grants were treated as the same government grants. That is, as Cuellar (2004)
noted, the most difficult problem to overcome is to accurately match private and public
expenditures. Consequently, the data on private charity and government spending to
social welfare may not only understate private charity to human service organizations,
but may also dampen the response of charitable giving to changes in government
spending because of the identified conceptual definitions for private giving and
government spending on social welfare in this study.
In addition, crowd-out effects may likely be more sensitive to large gift donors
who have donated a large amount of money such as millionaire donors. According to
GivingUSA Foundation (2011), approximately 20 percent of donors donated almost 80
percent of the total donations in 2010. Generally, large donors would be affected more by
crowd-out than donors who give a small amount of money. For future empirical work, the
joint crowd-out effect may be more precisely examined with charitable giving from
millionaire donors.
Motivations of charitable giving studies have been examined by researchers such
as Andreoni (2006) and Riber & Wilhelm (2002). However, we know very little about
how donors respond either to changing ideological cues or to better information about the
quality of charitable activity. In order to accurately understand the relationship between
the change of government welfare spending and the change of private giving to human
service organizations, the motivations of charitable giving in relation to political
relationship should be clearly addressed.

77
Appendix A: Joint crowd-out results
Independent Variables Per Capita
Donations
Per Capita
State Spending
Per Capita Donations
(w/ a new giving)
Federal spending -0.0515(0.0418) 0.409(0.553) -0.313(0.0228) State income 0.001(0.001) 0.019(0.013) -0.0013(0.010) State poverty rate -1.372(1.784) 7.184(20.223) -13.103(13.091) State age 65 or more -2.570(1.641) 32.403(51.667) -27.862(11.545) State owner occupied house -0.521(0.942) -3.749(2.609) 1.410(7.028) ^Price of giving -2.152(0.325)*** - -25.150(3.620)***
Age 0.932(0.260)*** - 0.932(0.260)***
Gender Male -16.250(9.439)* -16.250(9.439)*
Education
level
Some college 21.359(6.538)*** - 21.359(6.538)***
College graduate 37.238(7.713)*** - 37.238(7.713)***
Graduate 52.346(13.367)*** - 52.346(13.367)***
Ethnicity Black -12.175(9.015) - -12.175(9.015)
Native American 30.006(29.317) - 30.006(29.317)
Asian -82.219(22.471)*** - -82.219(22.471)***
Hispanic -50.888(12.156)*** - -50.888(12.156)***
Others 9.176(19.446) - 9.176(19.446)
Marital
Status
Never married -48.835(9.914)*** - -48.835(9.914)***
Widowed -20.615(16.234) - -20.615(16.234)
Divorced -18.628(10.001)* - -18.628(10.001)*
Separated -41.047(19.576)** - -41.047(19.576)**
Religion Catholic 9.585(15.562) - 9.585(15.562)
Jewish 34.173(23.850) - 34.173(23.850)
Protestant 8.680(14.729) - 8.680(14.729)
Non-Christian 33.494(25.099) - 33.494(25.099)
Orthodox -3.502(39.287) - -3.502(39.287)
Employment
status Unemployed -12.021(15.309) - -12.021(15.309)
Retired 0.724(9.700) - 0.724(9.700)
Disabled -28.455(16.108)* - -28.455(16.108)*
Others 9.852(9.698) - 9.852(9.698)
Health
condition
Good -3.187(6.349) - -3.187(6.349)
Fair -28.717(10.995)** - -28.717(10.995)**
Poor -8.401(13.069) - -8.401(13.069)
Number of Kids 2.372(3.086) - 2.372(3.086)
Wealth with no house 6.162(3.504)* - 6.162(3.504)*
Income 0.0002(0.000)** - 0.0002(0.000)**
Total sample 6,629 50 6,629
- Marginal effect with numeric derivatives and integrals (dydx) were estimated, except the price of
giving. The coefficient for the price of giving is elasticity form.
- Delta method standard errors are in parenthesis.
- The coefficients of per capita donations are estimated by Tobit, the coefficients of per capita state
spending are estimated by OLS. The estimated coefficients are the estimated average marginal effect
with respect to observable donations.
- The reported coefficients are the average incremental effect on observable giving relative to the
excluded category.
- Stacked regression was estimated with extended giving variable to HSOs, including needy giving,
youth and family giving, religious giving, and combination giving.
-Percentage of each socio-demographic variable was estimated after weighted with family weight
2007 variable. Also, the responding households who did not respond on philanthropic section were
excluded to estimate the socio-demographic characteristics and philanthropic behavior.
***P<0.001, **P<0.05, * P<0.10

78
Appendix B: Federal, state and local government factors in 2005
STATE
Federal
expenditure
(per capita)
State & local
expenditure
(per capita)
Median
Income
(per capita)
Poverty
Rate
% of the
total
population
over 65
% of
housing
units in
a state
Alabama $0.0 $1,120.0 $29,685 16.9% 12.9% 70.5%
Alaska $74.5 $2,085.0 $35,456 10.8% 6.6% 63.0%
Arizona $142.3 $983.0 $30,088 14.4% 12.6% 68.2%
Arkansas $0.0 $1,225.0 $26,674 17.2% 13.5% 67.8%
California $622.6 $1,225.0 $36,868 13.3% 10.5% 58.4%
Colorado $216.1 $738.0 $37,474 10.9% 9.7% 67.8%
Connecticut $105.3 $1,323.0 $47,650 8.3% 13.0% 69.5%
Delaware $2.2 $1,455.0 $37,162 10.3% 13.0% 72.4%
Florida $0.0 $992.0 $34,140 12.8% 16.6% 69.6%
Georgia $74.6 $907.0 $30,986 14.5% 9.2% 66.8%
Hawaii $0.0 $1,124.0 $34,520 9.9% 13.6% 59.7%
Idaho $0.0 $999.0 $28,393 13.4% 11.2% 71.4%
Illinois $146.6 $1,048.0 $36,259 12.0% 11.5% 69.9%
Indiana $50.7 $1,023.0 $31,180 12.2% 11.9% 72.0%
Iowa $58.9 $1,184.0 $31,804 10.8% 14.0% 73.1%
Kansas $5.0 $1,030.0 $32,907 11.7% 12.4% 69.5%
Kentucky $12.0 $1,351.0 $28,323 16.9% 12.2% 70.6%
Louisiana $20.1 $1,064.0 $24,671 20.2% 11.4% 67.8%
Maine $13.9 $1,889.0 $30,886 12.3% 14.1% 71.8%
Maryland $0.0 $1,159.0 $42,077 8.3% 11.2% 69.0%
Massachusetts $52.1 $1,779.0 $43,466 10.3% 12.9% 64.0%
Michigan $221.0 $980.0 $32,800 13.1% 12.1% 74.7%
Minnesota $113.1 $1,776.0 $37,366 9.2% 11.6% 75.8%
Mississippi $79.1 $1,289.0 $25,033 21.0% 11.9% 69.9%
Missouri $17.3 $1,027.0 $31,313 13.6% 12.8% 70.6%
Montana $20.8 $911.0 $28,934 14.6% 13.3% 69.1%
Nebraska $12.8 $1,132.0 $33,000 11.0% 12.8% 68.2%
Nevada $26.5 $718.0 $35,818 11.1% 11.2% 60.7%
New Hampshire $74.0 $1,119.0 $37,925 7.6% 11.9% 73.0%
New Jersey $156.8 $1,426.0 $43,897 8.7% 12.5% 67.3%
New Mexico $0.0 $1,466.0 $27,947 18.4% 12.1% 69.3%
New York $518.1 $2,236.0 $39,945 13.9% 12.7% 55.3%
North Carolina $155.3 $1,111.0 $31,068 14.9% 11.7% 68.2%
North Dakota $20.3 $1,146.0 $31,331 11.6% 14.2% 67.5%
Ohio $143.4 $1,450.0 $31,848 13.0% 12.8% 69.9%
Oklahoma $13.1 $1,137.0 $29,946 16.4% 12.9% 67.9%
Oregon $82.6 $1,048.0 $32,194 14.1% 12.6% 63.8%
Pennsylvania $180.6 $1,628.0 $34,916 11.9% 14.6% 71.5%
Rhode Island $25.4 $2,014.0 $35,305 11.9% 13.6% 62.7%
South Carolina $13.8 $1,105.0 $28,266 15.6% 12.3% 70.1%
South Dakota $3.7 $957.0 $32,686 13.6% 13.6% 69.0%
Tennessee $134.8 $1,257.0 $30,990 15.6% 12.2% 69.3%
Texas $29.3 $866.0 $32,507 17.5% 9.6% 64.7%
Utah $11.4 $924.0 $27,268 10.5% 8.5% 70.6%
Vermont $1.0 $1,799.0 $32,766 10.4% 12.8% 71.1%
Virginia $83.3 $951.0 $37,568 10.0% 11.2% 69.6%
Washington $8.0 $1,048.0 $35,210 12.0% 11.1% 64.7%
West Virginia $19.5 $1,291.0 $26,068 18.0% 15.0% 75.4%
Wisconsin $100.9 $1,296.0 $33,303 10.2% 12.5% 70.1%
Wyoming $2.2 $1,137.0 $37,308 10.6% 12.0% 71.5%
Source: The Public Policy Institute of New York State, Inc. (http://www.ppinys.org/reports/jtf/
welfarespending.htm) and U.S. Department of Commerce, Bureau of the Census, Released February 2007.
79
References
Abrams, B. A., & Schmitz, M. D. (1978). The crowding-out effect of governmental
transfers on private charitable contributions: Cross-sectional evidence. Public
Choice, 33(1), 29-39.
Abrams, B. A., & Schmitz, M. D. (1984). The crowding-out effect of government
transfers on private charitable contributions. In S. Rose-Ackerman (ed.), The
economics of nonprofit institutions: Studies in structure and policy. New
York: Oxford University Press.
Abramson, A. J., Salamon, L. M., & Russell, J. (2006). The nonprofit sector and the
federal budget: Analysis of President Bush’s FY 2007 budget. (The Aspen
Institute Nonprofit Sector Research Fund Working Paper Series). Retrieved
from http://www.nonprofitresearch.org.
Abramson, A. J., & Salamon, L. M. (2005). The nonprofit sector and the federal budge:
Fiscal year 2006 and beyond. (NSRF Working Paper Series). Retrieved from
http://www.nonprofitresearch.org.
Amos, O. M. (1982). Empirical analysis of motives underlying individual contributions
to charity. Atlantic Economic Journal, 10(4), 45-52.
Andreoni, J. (2006). Philanthropy. In S. C. Kolm & J. M. Mercier (Eds.), Handbook of
the economics of giving, altruism, and reciprocity (pp.1201-1209).
Amsterdam: Elsevier/ North-Holland.
Andreoni, J. (1990). Impure altruism and donations to public goods: A theory of warm
glow giving. Economic Journal, 100, 45-52.
Andreoni, J., & Payne, A. A. (2003). Do government spending to private charities crowd
out giving of fund-raising?. The American Economic Review, 93(3), 792-812.
Andreoni, J., & Payne, A. A. (2008). Crowding out both sides of the philanthropy market:
Evidence from a panel of charity (UCLA Department of Economics Working
Paper Number. 122247000000001769). Retrieved from
http://ideas.repec.org/p/cla/levrem/122247000000001769.html.
Art, W., & Gelissen, J. (2002). Three worlds of welfare capitalism or more? A state-of-
the-art report. Journal of European Social Policy, 12, 137-158.

80
Arulampalam, W., Backus, P. G., & Micklewright, J. (2009). Donations for overseas
department: Evidence from a panel of UK charities (Southampton Statistical
Sciences Research Institution Working Paper No. A09/02). Retrieved from
http://www2.warwick.ac.uk/fac/soc/economics/staff/phd_students/backus/
modelling_paper_25_mar.pdf
Austin, M. J., Brody, R. P., & Packard, T. (2009). Managing the challenges in human
service organizations. Los Angeles: SAGE.
Bakija, J., & Heim, B. T. (2011). How does charitable giving respond to incentives and
income? New estimates from panel data. National Tax Journal, 64(2), 615-
650.
Beck, A. B. (2000). Active government, active communities: How government social
programs affect volunteerism and philanthropy in helping the poor. (Doctoral
dissertation, City University of New York, United Stats). Retrieved from
Dissertations & Theses: (Publication No. AAT 99863023).
Bergman, J. I., Bowen, W. G., & Nygren, T. I. (1996). Managing change in the nonprofit
section: Lesson from the evolution of five independent research libraries. San
Francisco: Jossey-Bass Publishers.
Bernheim, B. D. (1986). On the voluntary and involuntary provision of public goods.
American Economic Review, 76, 789-793.
Borgonovi, F. (2006). Do public grants to American theatres crowd-out private
donations?, Public choice, 126, 429-451
Borgonovi, F., & O’Hare, M. (2004). The impact of the national endowment for the arts
in the United States: Institutional and sectoral effects on private funding.
Journal of cultural Economics, 28(1), 21-36.
Boris, E. T., Leon, E. D., Roeger, K. L., & Nikolova, M. (2010). Human service
nonprofits and government collaboration: Findings from the 2010 national
survey of nonprofit government contracting and grants. (Center on Nonprofit
and Philanthropy at Urban Institute Working Paper). Retrieved from
http://www.urban.org/UploadedPDF/412228-Nonprofit-Government
-Contracting.pdf.

81
Brooks, A. C. (1999). Do public subsidies leverage private philanthropy for the arts?:
Empirical evidence on Symphony Orchestras. Nonprofit and Voluntary
Sector Quarterly, 28(1), 32-45.
Brooks, A. C. (2000a). Is there a dark side to government support for nonprofits? Public
Administration Review, 60(3), 211-218.
Brooks, A. C. (2000b). Public subsidies and charitable giving: Crowding out, crowding in
or both?. Journal of Policy Analysis and Management, 19(3), 451-464.
Brooks, A. C. (2003). Do government subsidies to nonprofits crowd out donations or
donors?. Public Finance Review, 31, 166-179.
Brown, J. & Finkelstein, A. (2008). The interaction of public and private insurance:
Medicaid and the long- term care insurance market. American Economic
Review, 98(3), 1083-1102.
Callen, J. L., Klein, A., & Tinkelman, D. (2010). The contextual impact of nonprofit
board composition and structure on organizational performance: Agency and
resource dependence perspective. Voluntas, 21, 101-125.
Center on Philanthropy at Indiana University (n.d). Center on Philanthropy Panel Study.
Website manuscript. Retrieved from
http://www.philanthropy.iupui.edu/Research/copps/#about.
Chenhall, R. H., & Moers, F. (2007). The issue of endogeneity within theory-based,
quantitative management accounting research. European Accounting Review,
16(1), 173-195.
Cuellar, S. S. (2004). Private and public sector expenditures on social welfare: An
empirical Analysis of simple crowed-out (Preliminary Version of Working
Paper). Retrieved from http://www.sonoma,edu/users/c/cuellar/
home.shtml.
Day, K. M., & Devlin, R. A. (1996). Volunteerism and crowding out: Canadian
econometric evidence. Canadian Journal of Economics, 29(1), 37-53.
Dokko, J. K. (2009). Does the NEA crowd out private charitable contributions to the arts.
National Tax Journal, LXII (1), 57-75.

82
Duncan, B. (1999). Modeling charitable contributions of time and money. Journal of
Public Economics, 82(2), 213-242.
Evelyn, D. (2009). Organization theories. In M. J. Bates & M. N. Maack (3rd
ed.),
Encyclopedia of library and information sciences (pp. 4063-4072). New York:
Taylor & Francis.
Ezell, M. (2009). Managing financial resources. In R. J. Patti (2nd
eds.), The handbook of
human services management (pp. 387-408). Los Angeles: SAGE.
Fishback, P. V., Horrace, W. C., & Kantor, S. (2005). Did New Deal grant programs
stimulate local economies? A study of federal grants and retail sales during
the Great Depression, The Journal of Economic History, 65(1), 36-71.
Garrett, T. A., & Rhine, R. M. (2007). Does government spending really crowd out
charitable contributions? New time series evidence. (Federal Reserve Bank of
St. Louise Working Paper No.2007-012A). Retrieved from
http://papers.ssrn.com/sol3/papers.cfm?abstract_id=970535.
Giving USA Foundation (2011). Giving USA 2010. Indianapolis; IN: Giving USA
Foundation.
Glisson, C. (1981). A contingency model of social welfare administration. Administration
in Social Work, 5(1), 15-39.
Gordon, N. (2004). Do federal grants boost school spending? Evidence from Tile I.
Journal of Public Economics, 88, 1771-1792.
Goss, K. A. (1989, October 3). More nonprofit groups are turning to headhunters to fill
top posts. Chronicle Philanthropy, 1(1), 15-17.
Greene, W. (1999). Marginal effects in the censored regression model. Economic Letters,
64(1), 43-49.
Gruber, J., & Hungerman, D. M. (2007). Faith-based charity and crowd-out during the
Great Depression. Journal of Public Economics, 91, 1043-1069.
Hall, M. H. (2001). Measurement issues in surveys of giving and volunteering and
strategies applied in the design of Canada’s National Survey of Giving,
Volunteering and Participating. Nonprofit and Voluntary Sector Quarterly, 30,
515-526.

83
Hasenfeld, Y. (2009). Social welfare administration and organization theory. In R. J. Patti
(Eds.), The handbook of human services management (2nd
) (pp. 53-100). Los
Angeles: SAGE.
Hatch, M. J. (1997). Organization theory. London: Oxford University Press.
Haveman, R. H., & Scholz, J. K. (1994). The Clinton welfare reform plan: Will it end
poverty as we know it? (Institute for Research on Poverty Discussion Paper
No. 1037-94). Retrieved from http://www.irp.wisc.edu/publications
/dps/pdfs/dp103794.pdf.
Havens, J. J., & Schervish, P. G. (2001). The methods and metrics of the Boston Area
Diary Study. Nonprofit and Voluntary Sector Quarterly, 30(3), 524-550.
Hecht, B., & Ramsey, R. (2002). Managingnonprofits.org: Dynamic management for the
digital age. New York: John Wiley.
Herman, R. D., & Renz, D. O. (1998). Nonprofit organizational effectiveness: Contrasts
between especially effective and less effective organizations, Nonprofit
Management &Leadership, 9(1), 23-38.
Hersey, L. N. (2010). Does government funding drive out private giving? A look at
second-tier cities. Paper presented at the annual conference of the ARNOVA,
Washington D.C.
Heutel, G. (2009). Crowding out and crowding in of private donations and government
spending (NBER Working Paper 15004). Retrieved from
http://www.nber.org/papers/w15004.
Hicks, A., & Kenworthy, L. (2007). Varieties of welfare capitalism. Socio-Economic
Review, 1(1), 27- 61.
Horne, C. S. (2005). Toward an understanding of the revenue of nonprofit organizations.
(Public management and policy dissertation). Retrieved from
http://digitalarchive.gsu.edu/pmap_diss/10.
Horne, C. S., Johnson, J. L., & Van Slyke, D. M. (2005). Do charitable donors know
enough—and care enough—about government subsidies to affect private
giving to nonprofit organizations. Nonprofit and Voluntary Sector Quarterly,
34, 136- 149.

84
Hopkins, K. M., & Hyde, C. (2002). The humans service managerial dilemma.
Administration in Social Work, 26(3), 1-15.
Hughes, P. N., & Luksetich, W. A. (1999). The relationship among funding sources for
art and history museums. Nonprofit Management and Leadership, 10 (1), 21-
37.
Hungerman, D. M. (2005). Are church and state substitutes? Evidence from the 1996
welfare reform. Journal of Public Economics, 89 (11/12), 2245-2267.
Hungerman, D. M. (2009). Crowd-out and diversity. Journal of Public Economics, 93,
729-740.
Inman, R. P. (2008). The flypaper effect. (NBER Working Paper. No. 14579). Retrieved
from http://www.nber.org/papers/w14579.
Jaskyte, K. & Lee, M. (2006). Interorganizational relationships. Administration in Social
Work, 30(3), 43-54.
John, M., & Pierson, P. (1997). Friedman’s revenge: The reform of “liberal” welfare
states in Canada and the United States, Politics & Society, 25(4), 443- 471.
Jones, P. R. (1983). Aid to charities. International Journal of Social Economics, 10(2), 3-
11.
Jun, S. P., & Armstrong, G. M. (1997). The bases of power in churches: An analysis from
a resource dependence perspective. The Social Science Journal, 34(2), 105-
130.
Katz, M. B. (1995). Improving poor people: The welfare state, the “Underclass”, and
urban schools as history. New Jersey: Princeton University Press.
Kennedy, J. M., & Vargus, B. (2001). Challenges in survey research and their
implications for philanthropic studies research. Nonprofit and Voluntary
Sector Quarterly, 30, 483-494.
Kettner, P. M. (2002). Achievement excellence in the management of human service
organizations. Boston, MA: Allyn & Bacon.
Khanna, J., Posnett, J., & Sandler, T. (1995). Charity donations in the UK: New evidence
based on panel data, Journal of Public Economics, 56, 257-272.

85
Khanna, J., & Sandler, T. (2000). Partners in giving: The crowding-in effects of UK
government spending. European Economic Review, 44, 1543-1556.
King, G., & Roberts, M. (2012). How robust standard errors expose methodological
problems they do not fix. Retrieved from http://gking.harvard.edu/files/
robust.pdf.
Kingma, B. R. (1989). An accurate measurement of the crowd-out effect, income effect,
and price effect for charitable contributions, The Journal of Political
Economy, 97(5);197-1207.
Kingma, B. R., & McClelland, R. (1995). Public radio stations are really, really not
public goods: Charitable contributions and impure altruism, Annals of Public
and Cooperative Economics, 66(1), 65-76.
Kirsch, A. D., McCormackw, M. T., & Saxon-Harrold, S. K. E. (2001). Evaluation of
differences in giving and volunteering data collected by in-home and
telephone interviewing. Nonprofit and Voluntary Sector Quarterly, 30, 495-
504.
Lecovich, E. (2001). Resource dependencies of old age homes. Administration in Social
Work, 25(2), 21-37.
Levine, C. H. (1986). The federal government in the year 2000: Administrative legacies
of the Reagan years. Public Administration Review, 46(3), 195-206.
Lindsey, L., & Steinberg, R. (1990). Joint crowd-out: An empirical study of the impact of
federal grants on state government expenditures and charitable donations.
(NBER Working Paper, No.3226). Retrieved from
http://ideas.repec.org/p/nbr/nberwo/3226.html.
Lohmann, R. A. (1980). Breaking even: Financial management in human service
organizations. Philadelphia, PA: Temple University Press.
McDonald, J. F., & Moffitt, R. A. (1980). The uses of Tobit analysis. The Review of
Economics and Statistics, 62(2), 318-321.
Mesch, D. J., Rooney, P. M., Steinberg, K. S., & Benton, B. (2006). The effects of race,
gender, and marital status on giving and volunteering in Indiana, Nonprofit
and Volunteer Sector Quarterly, 35, 565-587.

86
Midgley, J., Tracy, M. B., & Livermore, M. (2000). The handbook of social policy.
Thousand Oaks: SAGE.
Moore, M. H. (2000). Organizational strategy in for-profit, nonprofit, and governmental
organizations. Nonprofit and Voluntary Sector Quarterly, 29, 183- 204.
National Council of Nonprofits. (2010). Costs, complexification, and crisis:
Government’s human services contracting “System” hurts everyone.
(National Council of Nonprofits Special report). Retrieved from
http://www.councilofnonprofits.org.
Okten, C., & Weisbrod, B. A. (2000). Determinants of donations in private nonprofit
markets, Journal of Public Economics, 75(2), 255-272.
O’Neil, M. (2001). Research on giving and volunteering: Methodological considerations.
Nonprofit and Voluntary Sector Quarterly, 30(3), 505-514.
Panel Study of Income Dynamic (2010). Panel Study of Income Dynamics 2010
generosity questionnaire. Retrieved from http://psidonline.isr.umich.edu/
Guide/default.aspx.
Patriquin, L. (2001). The historical uniqueness of the Clinton welfare reforms: A new
level of social misery?, Journal of Sociology and Social Welfare, XXVIII (3);
71-90.
Payne, A. A. (1998). Does the government crowd-out private donations? New evidence
from a sample of non-profit firms. Journal of Public Economics, 69, 323-345.
Payne, A. A. (2001). Measuring the effect of federal research funding on private
donations at research universities: Is federal research funding more than a
substitute for private donations. International Tax and Public Finance, 8(5/6),
731-751.
Payne, A. A (2009). Does government funding change behavior? An empirical analysis
of crowd-out. Tax Policy and the Economy, 23, 159-184.
Pfeffer, J., & Salancik, G. R. (1978). The external control of organizations: A resource
dependence perspective. New York: Harper & Row.
Poertner, J. (2006). Social administration and outcomes for consumers: What do we
know? Administration in Social Work, 30(2), 11-24.

87
Poertner, J., & Rapp, C. A. (2007). Textbook of social administration: The consumer-
centered approach, (2nd
Ed.). New York: Haworth Press.
Public Policy Institute (n.d). State and local per-capita welfare spending, FY 2005-2006.
Retrieved from http://www.ppinys.org/reports/jtf/
welfarespending.htm.
Reece, W. S. (1979). Charitable contribution: New evidence on household behavior. The
American Economic Review, 69(1), 142-151.
Ribar, D. C., & Wilhelm, M. O. (2002). Altruistic and joy-of giving motivations in
charitable behavior, Journal of Political Economy, 110(2), 425-457.
Roberts, R. D. (1984). A positive model of private charity and public transfers. Journal of
Political Economy, 91(1), 136-148.
Rooney, P. M., Steinberg, K. S., & Schervish, P. G. (2001). A methodological
comparison of giving surveys: Indiana as a test case. Nonprofit and Voluntary
Sector Quarterly, 30, 551-568.
Rose-Ackerman, S. (1986). The economics of nonprofit institutions: Studies in structure
and policy. New York: Oxford University Press.
Rosenbaum, S. & Darnell, J. (1997). An analysis of the Medicaid and health-related
provisions of the Personal Responsibility and Work Opportunity
reconciliation Act of 1996 (Kaiser Commission on the Future of Medicaid
Working Paper). Retrieved from http://www.kff.org/medicaid/
loader.cfm?url=/commonspot/security/getfile.cfm&PageID=14775.
Salamon, L. M. (1996). The crisis of the nonprofit sector and the challenge of renewal.
National Civic Review, 85(4), 3-15.
Salamon, L. M. (1999). America’s nonprofit sector.(2nd
Ed.). New York: Foundation
Center.
Salamon, L. M. (2005). The changing context of American nonprofit management. In R.
D. Herman & Associates (2nd
Ed.), The Jossey-Bass handbook of nonprofit
leadership & management, San Francisco: John Wiley.
Schiff, J. (1985). Does government spending crowd out charitable contributions, National
Tax Journal, 38(4), 534-546.

88
Schiff, J. (1990). Charitable giving and government policy: An economic analysis.
Westport, CT: Greenwood Press.
Schiff, J., & Steinberg, R. (1988). The effect of federal government expenditure cutbacks
on service provision by states and nonprofit organization (Virginia
Polytechnic Institute and State University Working Paper No.E89-05-12).
Schmid, H. (2004). Organization-environment relationships: Theory for management
practice in human service organizations. Administration in Social Work, 28(1),
97-113.
Schmid, H. (2009) Agency-environment relations: Understand external and natural
environments. In R. J. Patti (Ed.), The handbook of human services
management (2nd
), Los Angeles: SAGE.
Simmons, W. O., & Emanuele, R. (2004). Does government spending crowd out
donations of time and money. Public Finance Review, 32, 498-511.
Smith, T. M. (2006). More than a simple “crowd-out”: The case for NEA grants and US
dance companies. Retrieved from http://www. Focus.or.at.
Smith, T. M. (2007). The impact of government funding on private donations to nonprofit
performing arts organizations, Annals Public and Cooperative Economics,
78(1), 137-160.
Steinberg, R. (1985). Empirical relations between government spending and charitable
donations, Journal of Voluntary Action Research, 14(2), 54-64.
Steinberg. R. (1987). Voluntary donations and public expenditures in a federalist system,
The American Economic Review, 77(1), 24-36.
Steinberg. R. (1989). The theory of crowding out: Donations, local government spending,
and the “New federalism.” In R. Magat (ed.), Philanthropic giving: Studies in
varieties and goals, New York: Oxford University Press.
Steinberg, R. (1990). Joint crowd-out: An empirical study of the impact of federal grants
on state government expenditures and charitable donations (NBER Working
Paper Series No. 3226). Retrieved from http://www.nber.org/
papers/w3226.pdf.

89
Stenberg, R. (1993). Does government spending crowd out donation? Interpreting the
evidence. In A. Ben-Ner & G. Benedetto (Eds), The nonprofit sector in the
mixed economy. Ann Arbor, MI: University of Michigan Press.
Steinberg, R., & Wilhelm, M. (2003). Tracking giving across generations. New
Directions for Philanthropic Fundraising, 42, 71-82.
Stoesz, D., & Karger, H. J. (1992). Reconstructing the American welfare state. Lanham,
MD: Rowman & Littlefield.
Straub, J. D. (2002, May 29). Essays on fundraising and crowd-out of charitable
contributions. (dissertation defense, University of Wisconsin-Madison).
Retrieved from http://www.worldcat.org/title/essays-on-fundraising-and-
crowd-out-of-charitable-contributions/oclc/52296808.
Tanner, M. (1996). The end of welfare: Fighting poverty in the civil society. Washington,
D.C: Cato Institute.
Thornton. J. P. (2012). Flypaper nonprofits: The impact of federal grant structure on
nonprofit expenditure decisions. Public Finance Review, 00(0),1-23.
Tinkelman, D. (2009). Revenue interactions: Crowding out, crowding in, or neither?. In
B. A., Seaman & D. R., Young, Handbook of research on nonprofit
economics and management, Northampton, MA: Edward Elgar.
U.S. Bureau of the Census (n.d.). Government Finance and Employment Classification
Manual: Covering the activities of the Federal, state, and local governments.
Retrieved from http://www2.census.gov/govs
/class/classfull.pdf.
U.S. Bureau of the Census (n.d). 2005 American Fact Finder. Retrieved from
http://factfinder2.census.gov/faces/nav/jsf/pages/index.xhtml.
U. S Bureau of the Census (n.d). 2006 the Government Finance and Employment
Classification manual. Retrieved from http://www.census.gov/govs
/www/class06.html.
U.S. Department of Commerce (2006). Per capita state intergovernmental expenditures,
by function and by state: 2003. Retrieved from
http://knowledgecenter.csg.org/drupal/system/files/2.4_0.pdf

90
Wamsley, G. L., & Zald, M. N. (1973). The political economy of public organizations.
Public Administration Review, 33(1), 62-73.
Warr, P. G. (1982). Pareto optimal redistribution and private charity. Journal of Public
Economics, 19(1), 131-138.
Weinbach, R. W. (2008). The social worker as manager: A practical guide to success
(2nd ed.). Boston, MA: Pearson.
White, A. H. (1989). Patterns of giving. In R. Magat (ed.), Philanthropic giving: Studies
in varieties and goals, New York: Oxford University Press.
Wilhelm, M. (2002). The distribution of giving in six surveys, (The Center on
Philanthropy at Indiana University Working Paper).Retrieved from
http://scholar.google.com/scholar?q=the+distribution+of+giving
+in+six+surveys&hl=en&as_sdt=800001&as_sdtp=on.
Wilhelm, M. (2006). New date on charitable giving in the PSID. Economics Letters 92(1),
26-31.
Wilhelm, M. (2007). The quality and comparability of survey data on charitable giving.
Nonprofit and Voluntary Sector Quarterly, 36, 65-84.
Wilhelm, M. (2008). Practice considerations for choosing between Tobit and SCLS or
CLAD estimators for censored regression models with an application to
charitable giving. Oxford Bulletin of Economics and Statistics, 79(4), 559-582.
Wilhelm, M., & Han, X. (2012). Preparing PSID Data for TAXSIM. Mimeo. Indianapolis,
IN: IUPUI.
Zhao, J., Ren, L., & Lovrich, N. (2010). Police organizational structures during the 1990s:
An application of contingency theory. Police Quarterly, 13(2), 209-232.

Curriculum Vitae
SUNG-JU KIM
EDUCATION
Doctor of Philosophy, 2013
School of Social Work at Indiana University, Indianapolis, Indiana, USA.
Doctoral Dissertation: “The impact of Federal government welfare expenditures on
state government welfare expenditures and philanthropic giving to human service
organizations: 2003-2004.”
Dissertation Chair: Professor Robert Vernon.
Master of Science in Social Administration, 2005
Case Western Reserve University, Mandel School of Applied Social Science,
Cleveland, Ohio, USA.
Certification of Nonprofit Management, 2005
Case Western Reserve University, Mandel Center for Nonprofit Organizations,
Cleveland, Ohio, USA.
Master of Art in Social Welfare, 2002
Catholic University of Korea, Puchon, Korea.
Master Thesis: “The Differences of Conceptual Definition of Family Between
Clients and Social Worker.”
Thesis Chair: In-Suk, Kim, Ph.D.
Bachelor of Art in Social Welfare, 1999
Dong-Guk University, GyeongJu, Korea.
FELLOWSHIPS, AWARDS & HONORS
Recognition of Excellence in Teaching Award, Indiana University School of Social
Work, April 22, 2010.
Nominated for the Best Paper Award from Association for Research on Nonprofit
Organizations and Voluntary Action (ARNOVA) Conference 2010, Spring 2010 (12
out of near 580 papers).
Research Assistantship, Indiana University School of Social Work, 2007- 2008.
University Fellowship, Indiana University, 2006-2007.
Corporate Philanthropy Fellowship ($10,000 USD), SK Telecom, Seoul, Korea, 2004-
2005.
Academic Scholarship, Catholic University of Korea, 2000- 2001
Academic Scholarship, Dong-Guk University, Geyongju, Korea, 1997-1999
TEACHING INTERESTS
Mezzo practice courses: social work management and leadership, nonprofit public
policy and advocacy, philanthropy and fundraising for nonprofit organizations,
program developing and evaluation.
Research courses: quantitative research method I & II, basic and advanced statistics,
practice evaluation (single-system design).

TEACHING POSITIONS
Fall 2012 - present Assistant Professor, Monmouth University School of Social
Work
Fall 2009 - Summer 2012 Adjunct Faculty
Indiana University School of Social Work, Indianapolis, IN
Practice Research Integrative Seminar (S623) for MSW
(Two S623 classes per semester).
Statistics topics for social work (S300) for BSW
Fall 2008 - Summer 2009 Instructor
Indiana University School of Social Work, Indianapolis, IN
Practice Research Integrative Seminar (S623) for MSW
(One S623 class per semester).
2/20/10 & 2/18/09 Guest Speaker
Indiana University School of Social Work, Indianapolis, IN
S516 Organization, Community and Society (Master level)
Topic: The trend of corporate social responsibility in the
United States.
9/15/04 & 9/20/05 Guest Speaker
Indiana University School of Social Work, Indianapolis, IN
S303 Social Work Practice II (Bachelor level)
Topic: The Culture of Korean-American Family.
RESEARCH EXPERIENCES
4/ 11 - 8/11 Indianapolis, IN
Part-time research assistant, Indiana University School of Social Work
4/07 - 4/11 Indianapolis, IN
Part-time statistician, the Center on Philanthropy at Indiana University
8/04 - 8/06 Cleveland, OH
Graduate Intern, Center on Urban Poverty and Social Change at Case Western
Reserve University
8/03 - 8/04 Cleveland, OH
Graduate Intern, Golden Age Center in Greater Cleveland
8/00 - 8/02 Seoul, Korea
Full-time program coordinator & research assistant, The Center for Social Welfare at
Catholic University of Korea

PROFESSIONAL SOCIAL WORK EXPERIENCES
1/05 - 4/06 Cleveland, OH
Part time community Organizer, Asian Service in Action, Inc.
Grassroots policy outreach and advocacy project for minority community in
Cleveland, Ohio, USA.
4/02 - 8/03 Seoul, Korea
Full time consultant, SK Telecom
Corporate social responsibility: Organizing, providing, and developing corporate
philanthropic activities for public good.
4/99 - 8/00 Seoul, Korea
Full-time social worker, Banghwa 6 Community Welfare Center
Provided case management for independent living seniors and conducted home
delivery meal program. Managed the donors and fundraising.
2/97 - 3/99 Seoul, Korea
Full time counselor, Korea Support Center for the Homeless and Drop-in-Center
Managed team that created and staffed first job training and placement programs for
homeless.
PUBLICATIONS
Manuscripts under review or in progress
Kim, S, J., & Fredrick, H. (In progress). Giving patterns by type of community:
Comparing patterns of charitable giving between rural and urban donors.
Manuscript under review for Nonprofit Voluntary Sector Quarterly.
Working Papers
Kim, S. J., Kou, X., & Kramarek, M. (2011). Religious Distance and Charitable Giving
(Center on Philanthropy at Indiana University working paper).
Kim, S. J. (2010). Pattern of charitable giving in COPPS 2007: Descriptive analysis for
total giving, religious giving, secular giving and other subsector giving by
socio-demographic characteristics (Center on Philanthropy at Indiana
University research paper).
Kim, S. J. (2010). Pattern of charitable giving change in COPPS: Comparing pattern
changes between COPPS 2003 and 2005.
Kim, S. J., & Fredrick, H. (2009). 2009 congregational economic impact study (Center
on Philanthropy at Indiana University research project). Funded by Alban
Institute and lake institute on faith & giving at Center on Philanthropy at
Indiana University.
Fredrick, H., McDorment, M., Kim, S. J. & Kou, X. (2009). Motivation and
impediments to charitable giving (Center on Philanthropy at Indiana
University research project). Funded by CCS for William B. Hanrahan
CCS Fellowship.

Kim. S. J. (2009). Pattern of charitable giving in COPPS 2005: Total giving, religious
giving, secular giving by socio-demographic characteristics (Center on
Philanthropy research project).
Kim, S. J. (2008). Indiana gives 2008: Statewide individual giving (Center on
Philanthropy research project).
Kim, S. J. (2008). Indiana gives 2008: Corporate giving (Center on Philanthropy
research project).
Kim, S. J. (2008). Giving in Kansas City: Foundation giving (Center on Philanthropy
research project).
PAPER PRESENTED AT PROFESSIONAL CONFERENCE
National Conferences
Kim, S. J., Kou, X., & Kramarek, M. (2011). Religious similarity between donor and
recipient is matter for philanthropic giving. Paper presented at Association
of Research on Nonprofit Organizations and Voluntary Action (ARNOVA)
40th Annual Conference, Toronto, Canada.
Kim, S. J. (2010). The impact of economic recession on congregational organizations in
2009. Paper presented at Association of Research on Nonprofit
Organizations and Voluntary Action (ARNOVA) 39th Annual Conference,
Alexandria, VA, USA.
Kou, X., Brown, E., Mesch, D., Moore, Z., & Kim, S. J. (2010). Who decides revisited:
Household decision making and charitable giving. Paper presented at
Association of Research on Nonprofit Organizations and Voluntary Action
(ARNOVA) 39th Annual Conference, Alexandria, VA, USA.
Kim, S. J., & Frederic, H. (2009). The charitable giving difference between rural and
urban donors. Paper presented at Association of Research on Nonprofit
Organizations and Voluntary Action (ARNOVA) 38th Annual Conference,
Cleveland OH, USA.
University Presentations
Kim, S. J., & Una, O., (2010). Patterns of charitable giving in the Center on
Philanthropy Panel Study 2007. Paper presented at the 2010 IUPUI
Research Day. Indianapolis, IN.
Kim, S. J., McDermott, M., & Frederick, H. (2009). Understanding donor’s motivation.
Paper presented at the 14th Annual PhD Symposium, Indiana University
School of Social Work, Indianapolis, IN.
Kim, S. J. (2009, April). Giving patterns by type of community: Comparing different
patterns of Charitable Giving Between Rural and Non-Rural Donors.
Paper presented at The 13th Annual PhD Spring Symposium, Indiana
University School of Social Work, Indianapolis, IN.
Kim, S. J. (2008, April). Different patterns of charitable religious giving between
Catholics and Protestants. Paper presented at The 12th Annual PhD Spring
Research Symposium, Indiana University School of Social Work,
Indianapolis, IN.

PROFESSIONAL DEVELOPMENT: CONFERENCES AND WORKSHOPS
ATTENDED
Preparing Future Faculty (Certification program), Indiana University-Purdue University
(September, 2011 – April, 2012).
2010 - 2011 Workshop in Method, Consortium for Education and Social Science
Research, Indiana University (September, 2011 – April, 2012).
Association of Research on Nonprofit Organizations and Voluntary Action (ARNOVA)
Annual Conference (November, 2006 – November, 2012).
Korean Academy of Social Welfare Spring conference, Dea-Jun, Korea (October, 2002).
Attended conferences related to social work practice in Korea.
Korea Academy of Social Welfare Autumn conference, Chun-Chun, Korea. (April, 2002).
Attended conferences related to community development.
Center for Solution Focus Approach, Seoul, Korea. (September, 2001). Attended
workshop for advanced level of solution focus therapist.
Center for Solution Focus Approach, Seoul, Korea. (October, 2000). Attended workshop
for middle level of solution focus therapist.
VOLUNTEER EXPERIENCES 8/11- 8/12 Indianapolis, IN
PhD representative : Serving for IUSW PhD committee as PhD student representative
during 2011-2012 academic year
9/03- 4/05 Cleveland, OH
Translator: Translated for the Resident Representative Council meetings and papers
for the tenants such as contracts, the rights of tenants and other printed information
about all kinds of tenants’ activities.
6/97- 8/97 Vladivostok, Russia
Community developer: Volunteered for community development by rebuilding
elementary school and kindergarten and repairing public facilities such as roads,
parks, and playgrounds
9/96- 12/97 Sydney, Australia
Home helper: Helped handicapped teenagers with daily activities.
4/94- 4/99 Geyungju, Korea
Volunteer staff at YMCA Geyungju, Korea: volunteer staff for children’s outdoor
programs such as summer camps, swimming programs for children, and so on.
2/92- 4/95 Pusan, Korea
Teacher: Taught factory workers and adults who had not completed regular education,
in middle level Korean and English. Participated in fundraising for operational needs
PROFESSIONAL SERVICES
2010 - 2011 Academic advisor: Developing Korean philanthropic index project,
Statistical Research Institute at the National Statistics of Korea.
2005 - 2007 Advisory committee member: Corporate philanthropy activity, SK
Telecom, Korea.

PROFESSIONAL AFFILIATIONS
2010- Present Society for Social Work Research (SSWR)
2008- Present Association for Research on Nonprofit Organization and Voluntary Action
(ANOVA)
OTHER EXPERIENCES
8/00- 8/01 President, Graduate Student Council at School of Social Work at
Catholic University of Korea
3/95- 3/96 Chairman, National Social Welfare Student Alliance
02/95- 03/96 President, Social Welfare Student Council, Dong-Guk University
02/92- 02/93 Chairman, Pusan High School Students Alliance, SiNaBeRo


