The Inflamed Gut: An Integrative Approach to Understanding the Impact of Inflammation
on Bacteriophage-Host Dynamics.
by
Keah Veronica Chambers Higgins
A dissertation submitted to the Graduate Faculty of Auburn University
in partial fulfillment of the requirements for the Degree of
Doctor of Philosophy
Auburn, Alabama May 2, 2020
Keywords: Intestinal microbiota, intestinal phageome, intestinal inflammation, bacteriophage dynamics, obesity
Copyright 2020 by Keah Veronica Chambers Higgins
Approved by
Elizabeth Hiltbold Schwartz, Chair, Associate Professor of Biology Laurie Stevison, Assistant Professor of Biology
Mark Liles, Professor of Biology Stuart Price, Professor of Pathobiology

2
Abstract
The intestinal microbiome is a diverse and dynamic microbial ecosystem residing within
the gastrointestinal tract. The mammalian intestine is home to both commensal and opportunistic
pathogenic microorganisms. The immune system within the intestine has a unique challenge in
maintaining homeostasis while providing protection from invading pathogens. The intestinal
microbiome consists primarily of organisms from the domain Bacteria, with smaller populations
of Archaea, Eukaryota, and Viruses. The healthy bacteriome profile is dominated by the phylum
Bacteroidetes. Members of the Firmicutes, Proteobacteria and Actinobacteria phyla are also
major components of the bacteriome. This intestinal microbiota in the ‘healthy state’ contributes
to the healthy functionality of metabolic, digestive, endocrine, immune, and neurological
function of the host. Inversely, the microbiota can negatively impact the host when the relative
abundance of these consortia becomes altered, a condition generally known as dysbiosis. For
example, the dysbiotic profile of intestinal microbiota in obesity consistently reflects an
increased abundance of Firmicutes, altering the Bacteroidetes:Firmicutes ratio. Dysbiotic
bacteriome profiles have also been linked to increased susceptibility of development of intestinal
inflammation, colitis. Within the last 10 years, researchers have grown a respect for the intestinal
bacteriome, but there are other components within the intestinal microbiome that could
contribute, directly or indirectly, to the homeostasis of the intestinal microbiome. Namely, the
bacteriophage within the intestinal microbiome, phageome, have recently been shown to display
modulation in response to both environmental influences (diet) and internal influences (immune
system induced stress). The phageome has been described as more diverse in people who have
Inflammatory Bowel Disease (IBD). While the field has made progress towards understanding
bacteriophage role in microecosystems, it is not well understood how these changes occur in an

3
established microbiome or how the abundance dynamics of the phageome progress overtime
following external or internal influence. The goal of this study was to understand the
longitudinal impact of dietary intervention and intestinal inflammation and how these influences
affect bacteriophage abundance and functionality in the microbiome. To do this, intestinal
bacteria and bacteriophage abundance changes were monitored following high-fat western diet
(WD) feeding using shotgun metagenomic sequencing. Additionally, an in vitro study was
conducted using a fecal bacterial and bacteriophage isolate to understand the role the mammalian
host plays on bacteriophage infectivity rates. These isolates were used in modified adsorption
constant kinetic assays and one-step growth curves both in the presence and absence of
inflammatory derived products. Overall, components of the phageome are affected by the diet in
various ways. The phageome of WD-fed mice display rapid shifts in abundance profiles of
bacteriophage genera which appeared to proceed apparent abundance changes of the host. We
found that most bacteriophage display abundance patterns that coincide with predicted
bacteriophage behavior. For example, temperate bacteriophage displayed a rise in abundance
alongside their putative host which is likely explained by replication of host genome containing
prophage. Interestingly, the abundance dynamics of bacteriophage do not always follow the
abundance dynamics of their host. The in vitro experiments conducted showed that reactive
oxygen and chlorine species led to delayed adsorption, delays in time to burst and reduction of
progeny produced. At the conclusion of this work, we have shown that bacteriophage are
affected in a similar manner to bacteria to external and internal influences on the intestinal
microbiome. The abundance dynamics experienced by the phageome could play a role in
development of dysbiosis and perpetuation of disease.

4
Acknowledgments
Over the course of my program, I have had the opportunity to interact and work with
many amazing people. To these people, thank you will never encompass the true gratitude I have
in my heart for all you have done to help me get to the finish line. Thank you all for being a part
of this chapter of my story.
I first want to thank my major advisor Dr. Elizabeth Schwartz for always providing heart-
felt advice, support, patience, and guidance throughout my graduate career. I want to take the
time to thank all the other members of my graduate advisory committee. Dr. Mark Liles, thank
you for all of your advice and helping me get my start in metagenomics. I want to express my
gratitude to Dr. Stuart Price for providing me with training in bacteriophage isolation and
culturing techniques. I want to express my appreciation to Dr. Laurie Stevison for giving me the
tools that enabled me to skillfully utilize bioinformatics in my study. I am so grateful to have
been mentored by all individuals on my committee and these few sentences do not speak to the
magnitude of impact they had on my overall journey here at Auburn.
Of all the things I have experienced over the last 5 years, the vast majority of the most
memorable moments included the closest people to me here at Auburn, my lab mates. These
people were not just the 4 other people who shared the same small office in our lab. These are
friends who have become family. Peter Rogers is one of the most creative and intelligent people
I know, but he often would use this to challenge our thinking and keep us on our toes. Adesola
Olatunda, my BFF number 1, was always there for me with her calm voice of reassurance but
was never afraid to tell me when I was wrong. Robert Johnson was always looking to help me
even if it was getting coffee or just to agree on colors of appliances. Haley Hallowell, my
collaborator for life, I honestly could have not gotten here without you and you will forever have

5
a special place in my heart. The friendships that have developed with these individuals who I
have had the pleasure of working with over the last 5 years have made all the hardships worth it.
I am also indebted to countless undergraduate students who, either voluntarily or for
credit, participated in various aspects of my research. Thank you to all the students who helped
with the husbandry of the Mangalica pigs. I especially want to thank all the undergraduate
students involved with the work on PF-2, namely Tillie Drost, Chad Hamm, Ben Nelson, Faith
Anderson, Karin Chapelle, Sydney Bergstresser, Jack Landrum, Baker Smith, Madeliene
Bruderer and Archie Landrum, for troubleshooting and conducting phage experiments over and
over again until I was finally happy. I have enjoyed every minute of our unique experiment
environment.
Not only was I blessed with a wonderful lab environment, but also with a whole support
network of people here at Auburn. Thank you, Dr. Michael Greene, for allowing me to
collaborate with you and Lauren Woodie. To Dr. Richard Sorrentino, thank you so much for
everything you taught me regarding teaching and for encouraging me to go for it to the fullest in
everything I do. My gratitude also goes to Dr. Michael Miller for his assistance in helping me
obtain the image on PF2. Thank you to numerous other faculty members for all the support,
reagents, advice, insight and laughs, namely Dr. Paul Cobine, Dr. Jason Upton, Dr. Scott Santos,
Dr. Kate Buckley, Dr. Carla Shoemaker, Dr. Mary Mendonca. I am also so grateful to my
department, faculty and staff, for numerous travel awards and being extremely supportive of
their graduate students. Of note, thank you to Paula Norrell, Joann Broach and Michele Smith for
rapidly addressing every request and concern I had with kindness and a smile. Kirby Norrell,
thank you for always being there for me and for showing genuine care that is so hard to come by
these days. Finally, to countless friends thank you for the comradery, laughs and support: Alinne

6
Perra, Alexandra Colombara, Abby Beaty, Sarah Martin, Megan Powers, Pricilla Barger, Kaitlyn
Murphy and Kate Stillion just to name a few.
Thank you to every member of my family both immediate and extended for your undying
support, love, encouragement, and prayers. I especially want to acknowledge my parents, Kai
and Kecia Chambers, for all the sacrifices, love and support they have provided me over the
course of my studies and entire life. To my siblings, Rhett and Kayli Chambers, and their
families (Ashley, Merritt, Reid and Rhodes Chambers), thank you for always believing in me
more than I believed in myself. To my husband, Christopher, thank you for the insurmountable
things you have done (and put up with) over the course of our relationship and time during
graduate school. Through the chaos of this life, I am thankful you are by my side no matter what.
To my ever-present heavenly father, thank you for being my refuge and peace in the storm of
mental chaos. I would not have been able to complete this journey without your unfailing love.
7
Table of Contents
Abstract ......................................................................................................................................... 2
Acknowledgments......................................................................................................................... 4
List of Tables ................................................................................................................................ 9
List of Figures ............................................................................................................................. 10
List of Abbreviations .................................................................................................................. 12
Chapter 1. Literature Review ...................................................................................................... 13
Introduction to the Intestinal Microbiome ...................................................................... 13
Bacteriophage – Silent Modulators of the Microbiome .................................................. 16
Dietary Impact on the Intestinal Microbiome ................................................................. 18
Intestinal Inflammation and its Effect on the Intestinal Microbiome ............................. 21
Brief History of Project Development ............................................................................ 24
Hypothesis and Goals ..................................................................................................... 25
References ....................................................................................................................... 26
Chapter 2. Integrative longitudinal Analysis of Metabolic Phenotype and Microbiota Changes
During the Development of Obesity. .......................................................................................... 31
Abstract ........................................................................................................................... 31
Introduction ..................................................................................................................... 33
Materials and Methods .................................................................................................... 35
Results ............................................................................................................................. 40
Discussion ....................................................................................................................... 63
References ....................................................................................................................... 71
Chapter 3. Longitudinal Bacteriophage:Host Dynamics Following Diet-Induced Disruption of
the Intestinal Microbiome ........................................................................................................... 76

8
Abstract ........................................................................................................................... 76
Introduction ..................................................................................................................... 78
Materials and Methods .................................................................................................... 81
Results ............................................................................................................................. 83
Discussion ....................................................................................................................... 97
References ..................................................................................................................... 105
Chapter 4. In vitro Analysis of Intestinal Inflammations Effect on Bacteriophage Infectivity
Rates. ......................................................................................................................................... 110
Abstract ......................................................................................................................... 110
Introduction ................................................................................................................... 112
Materials and Methods .................................................................................................. 118
Results ........................................................................................................................... 124
Discussion ..................................................................................................................... 138
References ..................................................................................................................... 142
Chapter 5. Discussion and Conclusion. .................................................................................... 146
Summary of Work ......................................................................................................... 146
Implications of These Findings ..................................................................................... 153
Short-comings, Limitations, and Future Work ............................................................. 157
Conclusion .................................................................................................................... 160
References ..................................................................................................................... 161
Appendix 1. Bacteriophage Genera Characteristics Database .................................................. 167
Appendix 2. Supplemental Figures and Tables for Chapter 2 .................................................. 180
Appendix 3. Description of modified one-step growth curve protocol for HOCl treatment .... 186
9
List of Tables
Table 2.1. Final body weight, tissue weights normalized to body weight and serum measures for
the dietary groups. ....................................................................................................................... 43
Table 3.1 Log2 Fold Change and K-mean Clusters comparisons .............................................. 89
Table 4.1 Adsorption Efficiency following Hydrogen Peroxide Treatment ............................. 128
Table 4.2 Adsorption Efficiency following Hypochlorous Acid Treatment ............................ 133

10
List of Figures
Figure 2.1. Percent body weight change ..................................................................................... 42
Figure 2.2. Energy expenditure at 2-, 4- and 12-weeks .............................................................. 45
Figure 2.3. Respiratory equivalent ratio at 2-, 4- and 12-weeks ................................................. 47
Figure 2.4. An nMDS ordination of the microbiota samples by diet and over time. .................. 49
Figure 2.5. Changes in relative abundance of microbial composition after administration of the
Western Diet ............................................................................................................................... 51
Figure 2.6. Changes in relative abundance of bacteriophage composition after administration of
the Western diet .......................................................................................................................... 55
Figure 2.7. Diet Induced Bacteria-Bacteriophage Correlation Patterns in Obesity .................... 58
Figure 2.8. Diet Induced Correlations of Bacteria/Bacteriophage and Metabolic Patterns in
Obesity ........................................................................................................................................ 62
Figure 3.1. Co-occurrence network analysis of the gut microbiota from (A) Chow or (B) WD-
treated mice ................................................................................................................................. 85
Figure 3.2. K-mean clustering of bacteria and bacteriophage differential abundance patterns
following WD exposure .............................................................................................................. 87
Figure 3.3. Temporal bacteriophage genus dynamics in perspective of putative host family’s
abundance following WD exposure ............................................................................................ 92
Figure 3.4. Differential log2-fold change patterns of bacteriophage species and their putative host
following WD feeding ................................................................................................................ 95
Figure 4.1. Bacteriophage Life Cycles and Morphology. ........................................................ 115
Figure 4.2. Diagram of Bacteriophage Replication Timeline ................................................... 117
Figure 4.3. Characterization of PF-2. ....................................................................................... 119

11
Figure 4.4. Diagram of Adsorption Constant Methods and Description of Analysis. .............. 121
Figure 4.5. Diagram of modified one-step growth curve protocol ........................................... 123
Figure 4.6. Effect of hydrogen peroxide on microbial growth over time. ................................ 125
Figure 4.7. Dose-dependent effect of hydrogen peroxide on adsorption kinetics over time .... 127
Figure 4.8. Effects of hydrogen peroxide on PF-2 infectivity rates over time. ........................ 130
Figure 4.9. Dose-dependent effect of hypochlorous acid on adsorption kinetics over time. .... 132
Figure 4.10. Effects of 0.6mg/L hypochlorous acid treatment on PF-2 infectivity rates over time
................................................................................................................................................... 135
Figure 4.11. Effects of 1mg/L hypochlorous acid treatment on PF-2 infectivity rates over time
................................................................................................................................................... 137

12
List of Abbreviations
IBD Inflammatory Bowel Disease
WD Western Diet
GI Gastrointestinal
H2O2 hydrogen peroxide
HOCl hypochlorous acid

13
Chapter 1
Literature Review
Introduction to the Intestinal Microbiome
All complex metazoans are colonized by a ubiquitous layer of microbial organisms that
are present at all external surfaces of the host, specifically mucosal surfaces and skin 1. This
collection of microbial symbionts, known as the microbiota, and the environment they inhabit
collectively make up the microbiome 2. Within the last twenty years, there has been an
exponential expansion in our understanding of the symbiotic nature of the microbiota via high-
throughput DNA sequencing technologies coupled with advances in bioinformatics. These
strategies were developed following completion of the Human Genome Project 3 and subsequent
initiation of the Human Microbiome Project 4 in the early 2000s. This allowed for the emergence
of an investigative field seeking to identify the organisms of the microbiome, characterize
interactions between the microbiome and host, and determine influence of the microbiome on the
pathophysiology of disease. New approaches in the field of microbiome research have allowed
us to resolve our understanding of its role in human biology and disease 4. Although many sites
on a given host harbor a resident microbial community, no site has been more intriguing or
puzzling than that of the intestinal microbiome.
The gastrointestinal tract of organisms, ranging from insects to humans, is inhabited by
many symbiotic bacteria, archaea, eukaryotes, and viruses that compose the intestinal microbiota
5. These approximately 100 trillion microbial constituents are representative of 5000 distinct
species belonging to 6-10 major phyla 1. The collective gene pool of the intestinal microbiota is

14
comprised of over 3 million microbial genes, which is 150 times more than genes identified
within the human genome 6. The assortment of microbial genes in the intestinal microbiome has
substantial potential for metabolic functions comparable to the magnitude observed in the liver 1.
Many members of the intestinal microbiota obtain nutrients from substances ingested by the host,
and in turn, the host benefits from the metabolites produced by the microbiota. The intestinal
microbiota also contributes to the host by providing essential nutrients such as biotin and vitamin
K, facilitating the digestion of complex dietary fiber by fermentation, and generation of butyric
acid, which is a major source of fuel for the gut epithelia 1,7,8. Beyond its metabolic
contributions, the microbiota has also displayed the ability to interact with and influence
components of the immune, endocrine, and neurological systems. Metabolites and cellular
components of the microbiota are recognized by host cells, facilitating crosstalk between the
microbiome and host. When in homeostasis, this crosstalk provides positive regulation of various
organ systems 9. Mice void of microorganisms (germ-free) have displayed reduction in intestinal
secretory IgA, developmental defects in gut-associated lymphoid tissue and smaller Peyer’s
patches and mesenteric lymph nodes 10,11. For example, the presence of the microbiota in the
intestine has been linked to maintenance of the epithelial barrier integrity and regulation of gut
motility 1,12. This crosstalk first became evident in studies of germ-free animals. Investigators
determined that stimuli derived from the intestinal microbiota acts to regulate secretion of bone
morphogenetic protein 2 (BMP2) secreted by muscularis macrophages. BMP2 activates a
receptor on enteric neurons that in turn induces secretion of colony stimulatory factor 1. This
perpetuates a positive feedback loop to both induce peristalsis and maintain healthy macrophage
development 5. Although most cellular components of the intestinal system have developed by
the time of birth, the intestinal neural networks and immune system do not reach functional

15
maturation until the host is exposed to the intestinal microbiome 13. In this way, the intestinal
microbiota is an active participant in host physiology.
The composition of the microbiota is regulated by a variety of stimuli such as diet, route
of birth delivery, nutrient availability, antibiotic usage, age, and stress 14–16. Organisms of the
same species and lifestyle typically have a common core group of microbial symbionts. The
defined core group of the healthy human and mouse intestinal microbiota includes large
populations of Phylum Bacteroidetes and Firmicutes and smaller populations of Actinobacteria
and Proteobacteria 17,18. Members of two most abundant Phyla, Bacteroidetes and Firmicutes,
have been directly linked to production of metabolites that contribute to the healthy colonic
environment. For example, Bacteroides thetaiotaomicron has the capacity to metabolize plant
polysaccharides and members of the genus Clostridium are one of many microorganisms that
generate butyrate 18,19. The relative proportion of these bacteria within the whole is crucial to
maintaining the production of beneficial products. Furthermore, increasing evidence has linked
the composition of the intestinal microbiota and the development of disease, such as obesity 20.
In obese individuals, the balance of the top two phyla is reversed, with Firmicutes comprising a
larger proportion than Bacteroidetes 14,21. Diets high in lipids and carbohydrates, such as the
Western diet, can induce compositional changes in the intestinal microbiota that correlate to
those characterized in obesity 2,20,21. There is also evidence that defined microbial communities
can induce increased energy harvest and induce the obese phenotype in the mammalian host 20–
22. However, it has not been determined if the intestinal microbiota or diet has more influence on
the development of obesity in the mammalian host over other contributing factors. Most of the
work evaluating the intestinal microbiota and obesity has focused on bacterial constituents as
16
they comprise the majority of the intestinal microbiome. Yet, other microbial populations, such
as bacteriophage, also have the potential to impact host physiology.
Bacteriophage – silent modulators of the microbiome
Nonbacterial members of the intestinal microbiome have been neglected until recently,
mainly due to the lack of diagnostic tools for the assessment of nonbacterial genomes 12.
However, these communities have displayed evidence that they too are contributing members of
the healthy gut microbiome. One such community is the virome, or the viral components of the
microbiome 12. The virome is comprised of both eukaryotic and prokaryotic viruses. The
dominant member of the intestinal virome are viruses belonging to the order Caudovirales,
otherwise known as bacteriophages 12. Caudovirales are tailed bacteriophages with double-
stranded DNA genomes. Caudovirales is divided into Podoviridae, Siphoviridae, and Myoviridae
families 12. Originally, bacteriophage were utilized as anti-bacterial agents following
identification by Twort and d’Herelle, independently 23. Bacteriophage are viruses that target
bacteria as a host and require host cellular machinery to reproduce. Bacteriophage can also be
classified as either virulent or temperate.
Virulent bacteriophage operate through a purely lytic infection cycle, killing their host as
new virions burst from the cell. Temperate bacteriophage however, have evolved mechanisms
that allow them to undergo either a lytic infection cycle or undergo lysogeny 23. Lysogeny is a
life cycle in which phage integrate their genome into the host’s or form an episome and enter a
phase of latency 23. During the latent phase of lysogeny, both host and bacteriophage genomes
are replicated, but little phage gene expression is detected. Under stress or other external stimuli,
latent bacteriophage can become activated, resulting in a shift to the lytic cycle 23.

17
Infection begins with adsorption of the phage particle or virion to its host cell through
specific receptor recognition. This is followed by delivery of the phage nucleic acid into the
infected cell. At the conclusion of infection, all bacteriophage undergo lytic infection cycle
where progeny phage particles are released from the host cell in a process that most often
involves host cell lysis via bacteriophage-derived proteins 23. New insights into bacteriophage
dynamics have shown that the choice of infection cycle is not as predictable as previously
thought, especially in the setting of microbial ecosystem 24–26.
Bacteriophage were featured in early genetic experiments that facilitated the birth of
molecular biology during the mid-twentieth century. They were utilized in the ground-breaking
Hershey and Chase experiment that identified DNA as the genetic material which is now
considered basic knowledge of the nature of life at the molecular level 23. It seems fitting that
there is a resurgence of investigations into bacteriophage in the new age of genetic exploration
facilitated by next generation DNA sequencing. The advent of high-throughput sequencing and
bioinformatics has allowed researchers access to a multitude of data regarding genetic
relatedness, identification of genetic mutations in disease, and allowed for meaningful
characterization of microbial communities. Early work on characterization of microbial
communities focused on bacterial constituents, as 16S ribosomal classification techniques made
it easier to isolate and classify them. Recently, the virome, specifically the bacteriophage
communities or phageome, has gained attention from those studying the intestinal microbiota.
Although an exhaustive classification is still lacking, researchers have evidence that the
phageome can maintain stability over time in healthy conditions and it is responsive to
environmental stimuli 16,23,26,27. Recent studies have described a common set of virus-like
particles that are shared among more than one-half of all people tested, called the core

18
phageome. Yet, the phageome has displayed unique signatures between individuals regardless of
genetic relatedness 23,24. Bacteriophage represent the most abundant member of the intestinal
virome and some suggest the highly abundant bacteriophage could be involved in shaping the
healthy gut microbiome as well as having a role in pathogenic conditions 23.
Researchers now postulate that bacteriophage have the potential to directly shape
bacterial communities. This could be accomplished by 1) killing the bacterial host or 2) rewiring
bacterial metabolism and pathogenicity through horizontal transfer of genetic information 23.
Traditionally, bacteriophages are thought to infect bacteria purely out of the need to reproduce
and kill host populations upon induction. In fact, virulent bacteriophages often display “kill the
winner” dynamics: targeting the most prevalent or fastest growing bacterial population.
However, new discoveries have provided more insight into bacteriophage biology which expands
our knowledge of the possibilities of bacteriophage behavior. For example, prophage integration
could enable the host to resist super-infection, encode toxins that foster bacterial pathogenesis or
alter bacterial metabolism though phage-encoded genes 23. Additionally, recent studies have
described the quorum sensing-like mechanism of Bacillus phage phi3T that coordinates lysogeny
decisions. It is thought that this form of communication allows bacteriophage to coordinate lysis
in order to successfully undergo reproduction through replication of the host and lysogenize the
host after so many replication cycles to ensure viable host remain for the next infection cycle 23.
These mechanisms point to the ability of bacteriophage to regulate bacterial populations in the
microbiome which could consequently influence human health and disease.
Dietary Impact on the Intestinal Microbiome
19
Among the major environmental stimuli, nutrient availability appears to be one of the
most relevant, not only in the composition of the intestinal microbiome, but also microbial
ecosystems as a whole. For example, healthy diets, such as those high in plant products, are
associated with a colonic bacteriome profile dominated by the phylum Bacteroidetes with
Firmicutes being close in relative abundance 28. Microbial balance and composition are
important factors to maintaining optimal metabolic functionality and efficiency in the intestinal
microbiome. For example, the intestinal microbiome associated with diets high in plant
polysaccharides shows a high abundance of Bacteroides thetaiotaomicron 18. Additionally, B.
thetaiotaomicron’s polyfructose-containing glycan degradation is enhanced in the presence of
the methanogen Methanobrevibacter smithii which is also shown to be prevalent in these
conditions 29. Recently, the intestinal microbiome’s role in metabolism has been shown to extend
beyond food digestion and nutrient adsorption to include regulatory influences of the central
nervous and endocrine systems 1. In contrast to homeostatic conditions, deviations from the
healthy state of the intestinal microbiome, termed dysbiosis, can greatly contribute to the
development of metabolic disorders and disease.
Alterations in the intestinal microbiota can influence metabolic diseases by potentially 1)
increasing caloric extraction from intestinal contents resulting in increased adiposity, 2) inducing
low grade chronic inflammation either directly or via Leaky Gut syndrome, 3) generating toxic
metabolites from dietary components or 4) via indirect regulation of host metabolic functionality
1,30. The mechanisms by which the microbiome influences metabolic disease is said to be a direct
consequence of altered microbial metabolism and interactions with the intestinal immune system.
For example, diets rich in saturated fat are correlated with elevated levels of Gram-negative
bacteria, which leads to elevated luminal LPS levels 1,21,31. This can lead to increases in systemic
20
circulating LPS originating from translocation across the gut, a condition termed “leaky gut
syndrome”. Leaky gut syndrome can contribute to the development of metabolic endotoxemia,
characterized by low-grade chronic inflammation, metabolic disease and insulin resistance 1.
High fat diets have not only been linked to higher abundance of Gram-negative
organisms, but also to display a shift from Bacteroidetes-dominant to a more even abundance of
Bacteroidetes and Firmicutes in the intestinal bacteriome profiles. The proportional shifts
displayed in Phylum profiles in these individuals is related to a bloom in the class Bacilli and
reduction in Bacteroidia and Clostridia in relative abundance 32. Dysregulation or dysbiosis of
microorganisms can lead to alteration to the metabolic profile and could result in generation or
overaccumulation of toxic metabolites from the host diet. For instance, amino acid deamination
and decarboxylation in bacteria produces ammonia and amines 33, respectively. High ammonia
concentrations have been correlated with tumorigenesis 33. Additionally, bacterial degradation of
cysteine and methionine leads to the formation of hydrogen sulfide which has been linked to
inhibition of butyrate oxidation in colonocytes 33. Finally, the intestinal microbiota induces
indirect regulation of host metabolic functionality, such as in the case of suppressed Fiaf
expression. Under conditions of over consumption, the microbiota induces suppression of Fiaf
expression which ultimately induces fat deposition in the host 1,30. This is one mechanism by
which the intestinal microbiota influences host physiology and promotes obesity.
There is an ever-growing concern of obesity rates in developed countries. Obesity is
associated with increased adiposity, metabolic dysregulation, development of low-grade chronic
inflammation, and dysbiosis of the intestinal microbiome 9,34. Obese individuals are also more
likely to develop other conditions such as diabetes, IBD, and congestive heart failure 14,21,35.
While diet has been shown to be a major modulator of intestinal microbial composition and of

21
obesity, the intestinal microbiota has been shown to have their own role in the development of
obesity. Riduara, et al. supported this idea by demonstrating that the obese phenotype can be
conferred via fecal microbiota transfer from an obese donor to a germ-free organism 20. Dietary
patterns have also been associated with a change in the virome community to a new state. Recent
studies in dietary influences on viral community structure reported that individuals on the same
diet had similar intestinal viral consortia 36. The role of bacteriophage and of the host immune
response on the composition of the microbiota requires further study to be better understood.
Intestinal inflammation and its Effect on the Intestinal Microbiome
Correct interplay between the intestinal microbiome and the host has been demonstrated
to be essential to human health 12. Maintaining homeostasis of this complex system has resulted
in the development of a specialized immune system. The mucosal immune system is responsible
for rapidly detecting and clearing transient pathogens while also ensuring tolerance of beneficial
microorganisms. The mucosal immune system has intricate systems of recognition facilitated
through toll-like and nod-like pattern recognition receptors that allow for detection and
monitoring of the microbiota 1. Studies in germ-free mice have illustrated the necessity of
microbial interactions during the development of both the innate and adaptive immune systems.
Yet, multiple mouse models of inflammatory disease have also demonstrated the necessity of the
presence of the intestinal microbiota in the development of various inflammatory diseases
ranging from colitis to arthritis 1.
Inflammatory diseases share the common symptom of inflammation. Inflammation is a
mechanism of the immune system that provides defense against pathogenic threats and
contributes to the repair of damaged tissue. The intestinal immune system has the additional

22
challenge of warding off invaders while minimizing harm to beneficial microorganisms and host
tissues 1. Intestinal inflammation can occur on a variety of levels. Acute inflammation is usually
short term and involves signaling of proinflammatory cytokines to recruit granulocytes 37.
Chronic inflammation denotes a persistent immune response as seen in conditions including
inflammatory bowel disease (IBD) and obesity 37. Chronic inflammation is denoted by a shift in
immune effector cells from granulocytes to mononuclear cell types due to a shift in the cytokine
profiles 37. Low-grade chronic inflammation, like that of obesity, rarely results in overt
symptoms or damage to the tissue 37,38. On the other hand, chronic intestinal inflammation seen
in IBD can result in overall topological distortion of the gastrointestinal tract 37. Many
commensal bacteria are unable to maintain residency in the presence of constant immune
pressures and intestinal damage 39,40. Microorganisms that are adapted to surviving these
pressures, namely opportunistic or true pathogens will bloom and express virulence factors upon
detection of host tissue infiltration 41. Ultimately, the host immune response to pathogenic threats
can perpetuate the clinical presentation of these disorders.
Bacteria have evolved global regulatory systems for adaptation to both environmental
and inflammatory stress. These regulatory systems aid in detecting and initiating responses to
stressors-including pH, nutrient depletion, and oxidation that could destroy necessary proteins
and nucleic acids 42. Global regulatory systems of bacteria usually autoregulate and increase or
decrease necessary gene expression based on the level of the stress applied to the system 42–44. A
well-documented example of a global regulatory system responsive to stressors is that of heat
shock. Unfolded proteins and oxidative damage resulting from exposure to inflammatory
products can induce transcription of a large set of heat shock proteins in bacteria that act to
mediate potential damage, also referred to as the SOS response 43,44. After production of pro-
23
inflammatory cytokines, such as IFNγ, TNF-α, and IL-1, the brain induces fever, lethargy, and a
decrease in appetite 43. A rapid increase in environmental temperature can leave bacteria
vulnerable to protein denaturation. The pro-inflammatory cytokines also stimulate immune cells
to migrate to the affected area. Consequently, biproducts of the immune system can act to clear
infection as well as disrupt resident microorganisms. For example, neutrophils are among the
first immune cells to arrive at inflammatory sites. These are potent immune cells that, in addition
to being phagocytic, contain machinery and enzymes to produce oxygen and chlorine radicles.
These conditions can aid in controlling infection but can cause oxidative damage to symbiotic
commensals. It has been established that induction of bacterial SOS functions result in phage
repressor inactivation in temperate bacteriophage 45. It is possible that similar reactions may
contribute to bacteriophage composition changes during intestinal microbiome dysbiosis.
Where interactions between the bacteriome and immune system have been explored, it is
still unclear which mechanisms of the immune system contribute to the alteration of
bacteriophage diversity and abundance. Intestinal inflammation does impact bacteriophage
populations within the intestinal microbiome 24,25. Members of the defined core phageome were
significantly depleted or absent in IBD patients as compared to healthy counterparts 24.
Additionally, Norman, et al. reported that during times of intestinal inflammation, such as IBD,
bacteriophage richness increased as bacterial diversity decreased 25. Elevated abundance of
bacteriophages could be connected with bacterial dysbiosis and perpetuation of inflammation via
lysis of host organisms and subsequent release of pathogen-associated molecular patterns or
triggering the immune response directly 25,46. Unlike bacteria, bacteriophage share a purely
mutualistic relationship to the mammalian host. Bacteriophage not only provide microbial
regulation but have also been reported to confer a type of innate resistance to bacterial infection

24
by populating the mucin layer over mucosal surfaces 47. Early studies in bacteriophage therapy
have defined the immunogenic nature of bacteriophage and how the immune system responds to
systemic bacteriophage prevalence. For example, bacteriophage are rapidly detectable in
multiple organ systems, including the central nervous system, following treatment and are
cleared within 30 minutes by the liver if their host is not located 48. The bacteriophage particles
are immunogenic enough to elicit immunoglobulin production in infants which has now been
linked to a TLR9-dependent mechanism 25,46. Yet, knowledge of how the immune system affects
bacteriophage infectivity during intestinal inflammation is lacking in the literature.
Brief History of Project Development
This work was inspired by experiments investigating the intestinal microbiota in a natural
model of obesity, the Mangalica pig. We found that the intestinal microbiota of obese Mangalica
pigs had a slightly larger representation of viral sequences, primarily bacteriophage, than their
lean counterparts. Upon discussing these finding with Dr. Stuart Price, I was afforded the
opportunities to learn ‘the ways of the phage’. After numerous rounds of tears and bacteriophage
isolation, these techniques allowed for the isolation of the Escherichia coli bacteriophage, PF-
2, from Mangalica pig samples. Bacteriophage culturing techniques were crucial to the years of
work spent on the development of the in vitro protocols discussed in Chapter 4. The preliminary
study with Mangalica pigs led to a secondary study seeking to characterize the timeline of the
development of obesity. Around the same time, Dr. Michael Greene was conducting a study with
similar experimental methods in a mouse model. The mouse system allowed us to answer the
same scientific questions with better accuracy and resolution due to the numerous reagents
available to study both the microbiome and immune response.

25
Hypothesis and Goals
The overall hypothesis of this project is the phageome has the capacity to respond to
environmental influences independent of their bacterial host. This hypothesis was addressed with
three major goals: First, we determined the kinetics of microbiome response to high-fat diet by
monitoring the intestinal bacteriome and phageome in relation to the metabolic features of
obesity; Second, we described the variety of detailed phage:host interactions following exposure
to the high-fat diet; Finally, we determined the impact of inflammatory products on the
infectivity and replication of bacteriophage and its enteric host in vitro.

26
References
1. Chassaing, B., Aitken, J. D., Gewirtz, A. T. & Vijay-Kumar, M. Gut Microbiota Drives
Metabolic Disease in Immunologically Altered Mice. in Advances in Immunology vol.
116 93–112 (Academic Press Inc., 2012).
2. Turnbaugh, P. J. et al. The effect of diet on the human gut microbiome: a metagenomic
analysis in humanized gnotobiotic mice. Sci. Transl. Med. 1, 6ra14 (2009).
3. Lander, E. S. et al. Initial sequencing and analysis of the human genome. Nature 409,
860–921 (2001).
4. A review of 10 years of human microbiome research activities at the US National
Institutes of Health, Fiscal Years 2007-2016. Microbiome vol. 7 31 (2019).
5. Muller, P. A. et al. Crosstalk between muscularis macrophages and enteric neurons
regulates gastrointestinal motility. Cell 158, 300–313 (2014).
6. Weinstock, G. M. Genomic approaches to studying the human microbiota. Nature vol.
489 250–256 (2012).
7. Wagatsuma, K. et al. Diversity of Gut Microbiota Affecting Serum Level of
Undercarboxylated Osteocalcin in Patients with Crohn’s Disease. Nutrients 11, (2019).
8. HAMER, H. M. et al. Review article: the role of butyrate on colonic function. Aliment.
Pharmacol. Ther. 27, 104–119 (2007).
9. Cani, P. D. Human gut microbiome: hopes, threats and promises. Gut gutjnl-2018-
316723 (2018) doi:10.1136/gutjnl-2018-316723.

27
10. HOSHI, H. et al. Lymph Follicles and Germinal Centers in Popliteal lymph Nodes and
Other Lymphoid Tissues of Germ-Free and Conventional Rats. Tohoku J. Exp. Med. 166,
297–307 (1992).
11. Hapfelmeier, S. et al. Reversible microbial colonization of germ-free mice reveals the
dynamics of IgA immune responses. Science (80-. ). 328, 1705–1709 (2010).
12. Lopetuso, L. R., Ianiro, G., Scaldaferri, F., Cammarota, G. & Gasbarrini, A. Gut Virome
and Inflammatory Bowel Disease. Inflamm. Bowel Dis. 22, 1708–1712 (2016).
13. Obata, Y. & Pachnis, V. The Effect of Microbiota and the Immune System on the
Development and Organization of the Enteric Nervous System. Gastroenterology vol.
151 836–844 (2016).
14. Trosvik, P., Stenseth, N. C. & Rudi, K. Convergent temporal dynamics of the human
infant gut microbiota. ISME J. 4, 151–158 (2010).
15. Hepworth, M. R. et al. Group 3 innate lymphoid cells mediate intestinal selection of
commensal bacteria-specific CD4+ T cells. Science (80-. ). 348, 1031–1035 (2015).
16. Virgin, H. W. The virome in mammalian physiology and disease. Cell vol. 157 142–150
(2014).
17. Human Microbiome Project Consortium. Structure, function and diversity of the healthy
human microbiome. Nature 486, 207–214 (2012).
18. Edwards, L. A. et al. Aberrant response to commensal Bacteroides thetaiotaomicron in
Crohn’s disease: An ex vivo human organ culture study. Inflamm. Bowel Dis. 17, 1201–
1208 (2011).
28
19. Duncan, S. H. et al. Reduced dietary intake of carbohydrates by obese subjects results in
decreased concentrations of butyrate and butyrate-producing bacteria in feces. Appl.
Environ. Microbiol. 73, 1073–8 (2007).
20. Ridaura, V. K. et al. Gut microbiota from twins discordant for obesity modulate
metabolism in mice. Science 341, 1241214 (2013).
21. Ley, R. E., Turnbaugh, P. J., Klein, S. & Gordon, J. I. Microbial ecology: Human gut
microbes associated with obesity. Nature 444, 1022–1023 (2006).
22. Turnbaugh, P. J. et al. An obesity-associated gut microbiome with increased capacity for
energy harvest. Nature 444, 1027–1031 (2006).
23. Ofir, G. & Sorek, R. Contemporary Phage Biology: From Classic Models to New
Insights. Cell (2018) doi:10.1016/j.cell.2017.10.045.
24. Manrique, P. et al. Healthy human gut phageome. Proc. Natl. Acad. Sci. U. S. A. 113,
10400–10405 (2016).
25. Norman, J. M. et al. Disease-specific alterations in the enteric virome in inflammatory
bowel disease. Cell 160, 447–60 (2015).
26. Minot, S. et al. The human gut virome: inter-individual variation and dynamic response
to diet. Genome Res. 21, 1616–25 (2011).
27. Reyes, A. et al. Viruses in the faecal microbiota of monozygotic twins and their mothers.
Nature 466, 334–338 (2010).
28. Huttenhower, C. et al. Structure, function and diversity of the healthy human
microbiome. Nature 486, 207–214 (2012).
29
29. Kobyliak, N., Virchenko, O. & Falalyeyeva, T. Pathophysiological role of host
microbiota in the development of obesity. Nutr. J. 15, 43 (2016).
30. Parekh, P. J., Arusi, E., Vinik, A. I. & Johnson, D. A. The role and influence of gut
microbiota in pathogenesis and management of obesity and metabolic syndrome.
Frontiers in Endocrinology vol. 5 (2014).
31. Thaiss, C. A. et al. Hyperglycemia drives intestinal barrier dysfunction and risk for
enteric infection. Science (80-. ). 359, (2018).
32. Howe, A. et al. Divergent responses of viral and bacterial communities in the gut
microbiome to dietary disturbances in mice. ISME J. 10, 1217–1227 (2016).
33. Vernocchi, P., Del Chierico, F. & Putignani, L. Gut microbiota profiling: Metabolomics
based approach to unravel compounds affecting human health. Frontiers in Microbiology
vol. 7 (2016).
34. Sun, L. et al. Insights into the role of gut microbiota in obesity: pathogenesis,
mechanisms, and therapeutic perspectives. Protein Cell 9, 397 (2018).
35. Duncan, S. H. et al. Human colonic microbiota associated with diet, obesity and weight
loss. Int. J. Obes. 32, 1720–1724 (2008).
36. Minot, S. et al. The human gut virome: inter-individual variation and dynamic response
to diet. Genome Res. 21, 1616–1625 (2011).
37. Ryan, G. B. & Majno, G. Acute inflammation. A review. Am. J. Pathol. 86, 183–276
(1977).
38. Goldman, H. Acute versus chronic colitis: How and when to distinguish by biopsy.
Gastroenterology vol. 86 (1984).

30
39. Samanta, A. K., Torok, V. A., Percy, N. J., Abimosleh, S. M. & Howarth, G. S. Microbial
fingerprinting detects unique bacterial communities in the faecal microbiota of rats with
experimentally-induced colitis. J. Microbiol. 50, 218–225 (2012).
40. Wen, Z. & Fiocchi, C. Inflammatory bowel disease: Autoimmune or immune-mediated
pathogenesis? in Clinical and Developmental Immunology vol. 11 195–204 (2004).
41. Skaar, E. P. The Battle for Iron between Bacterial Pathogens and Their Vertebrate Hosts.
PLoS Pathog. 6, e1000949 (2010).
42. Ron, E. Z. Bacterial Stress Response. in The Prokaryotes 1012–1027 (Springer New
York, 2006). doi:10.1007/0-387-30742-7_32.
43. Wilson, B. A., Salyers, A. A., Whitt, D. D. & Winkler, M. E. Bacterial Pathogenesis.
Bacterial Pathogenesis (American Society of Microbiology, 2011).
doi:10.1128/9781555816162.
44. Bacterial Stress Responses, Second Edition. Bacterial Stress Responses, Second Edition
(American Society of Microbiology, 2011). doi:10.1128/9781555816841.
45. Smith, C. L. & Oishi, M. Early events and mechanisms in the induction of bacterial SOS
functions: Analysis of the phage repressor inactivation process in vivo. Proc. Natl. Acad.
Sci. U. S. A. 75, 1657–1661 (1978).
46. Gogokhia, L. et al. Expansion of Bacteriophages Is Linked to Aggravated Intestinal
Inflammation and Colitis. Cell Host Microbe 25, 285-299.e8 (2019).
47. Barr, J. J. et al. Bacteriophage adhering to mucus provide a non–host-derived immunity.
Proc. Natl. Acad. Sci. 110, 10771–10776 (2013).
48. Appelmans, R. Le dosage du bactériophage. Compt Rend Soc Biol 85, 701 (1921).
31
Chapter 2
Integrative Longitudinal Analysis of Metabolic Phenotype and Microbiota Changes During
the Development of Obesity
Abstract
In the United States, obesity has increased at an alarming rate over the past two decades. The
prevalence of obesity has increased from 30.5% in 2000 to 40.4% in 2018. Although increased
body mass is the main association with diet-induced obesity, it is not the only component that
makes an obese individual unhealthy. Diet-induced comorbidities, such as Type II Diabetes
Mellitus (T2DM) and non-alcoholic fatty liver disease (NAFLD), are commonly seen in obese
individuals. While the bacterial consortia present at the endpoint of obesity are known to be
distinct from lean individuals, we do not know at what point the change in the microbial
populations occurs. Also, we know little about how other domains of the microbiota, namely
viral populations, are affected during the progression of obesity. Thus, our goal in this study was
to monitor changes in the microbiome and metabolic profile following western diet feeding. We
accomplished this goal by taking metabolic data collected from Promethion Metabolic cages and
metagenomic shotgun sequencing of fecal samples from a mouse model of diet-induced obesity
over the course of 12 weeks. We found that after just 2 weeks on a western diet, the animals
weighed significantly more and were less metabolically stable than their chow fed counterparts.
This phenotype persisted at 8 and 12 weeks and was accompanied by significant insulin
resistance at the time of sacrifice. Additionally, temporal shifts in not only the bacterial
communities, but in bacteriophage communities were seen starting at the 2 weeks post WD-

32
feeding. Changes in the bacteriophage genera were observed as well as shifts in the microbiota
over the course of our study in individuals fed a WD compared to a normal chow diet. Our study
highlights the dynamic nature of the microbiota in response to dietary changes and correlated
these events with the metabolic status of the mammalian host following WD feeding.

33
Introduction
The worldwide obesity rate has almost tripled since 1975 in the United States. Nearly
40% of the adult population was considered obese as recently as 2016 as compared to 15%
between 1976-1980 1,2. A main cause for this rapid rise is the prevalence and popularity of food
high in saturated fats and added sugars 3,4. Individuals consuming a high-fat western diet (WD)
are prone to developing diseases comorbid with obesity such as Type-II Diabetes Mellitus
(T2DM), non-alcoholic fatty liver disease and cardiovascular disease, as well as gastrointestinal
(GI) maladies such as irritable bowel disease and colon cancer 5–7. The comorbidity of GI disease
and obesity prompted investigations into potential links between the two disorders. Among the
potential connections that have received a lot of attention are diet-induced alterations within the
intestinal microbiota.
The intestinal microbiome is a diverse and dynamic microbial ecosystem residing within
the GI tract. It consists primarily of organisms from the domain Bacteria, with smaller
populations of Archaea, Eukaryota, and Viruses. Healthy diets, such as those high in plant
polysaccharides, drive a colonic bacteriome profile dominated by the phylum Bacteroidetes 8.
Members of the Firmicutes, Proteobacteria and Actinobacteria phyla are also common
components of the bacteriome 9. The resident commensal bacteria carry out important functions
for the host such as synthesis of vitamins and short chain fatty acids (SCFA), degradation of host
dietary oxalates, and transformation of host derived bile acids, amongst many other metabolic
functions 10,11. However, the microbiota can negatively impact the host when the relative
abundance of microbial populations becomes altered, a condition generally known as dysbiosis
10. For example, the dysbiotic profile of the intestinal microbiota in obesity consistently reflects
an increased abundance of Firmicutes, altering the Bacteroidetes:Firmicutes ratio 8,12. However,

34
this has been mainly described at the endpoint of obesity. Thus, the kinetics with which
microbial dysbiosis progresses during the development of obesity remains poorly defined.
Additionally, many of these studies focus on phylum-level community profiles. Observing the
more detailed dynamics of organisms at lower classification levels might better inform how
shifts in the intestinal bacteriome relate to metabolic disease.
While much is known about the bacterial constituents within the microbiome, there is a
substantial gap in our understanding of how other microbiome constituents, such as
bacteriophage populations, change in abundance or composition during the development of
obesity 8,13. Bacteriophages are viruses that target bacteria and enter one of two lifestyles:
lysogenic or lytic. Temperate bacteriophages may reside within the bacteria as a lysogen, or
quickly replicate and lyse the host in a lytic cycle 14. Virulent phages, however, do not possess
the genes necessary to carry out lysogeny and are purely lytic 15. Given the predator/prey
relationship of phages and their host bacteria, diet-induced changes in intestinal environment are
likely to drastically alter bacteriophage populations, and vice versa. One study utilizing
gnotobiotic mice demonstrated that introduction of specific bacteriophage by oral gavage can
induce compositional changes, in both bacteria and bacteriophage populations, shaping the
intestinal bacteriome and microbiome 16. Bacteriophage populations, collectively known as the
phageome, have also displayed diet-induced disturbances 12,17. However, our understanding of
diet-induced longitudinal changes in bacteria/bacteriophage dynamics remains incomplete.
Bacteriophages represent an attractive target for tailoring the gut bacteriome by targeting and
culling populations of specific bacteria while leaving other commensal bacteria unaffected.
Therefore, it is critical to understand their role in the development and progression of metabolic
disease.

35
In the current study, we explore microbial population dynamics in a mouse model of diet-
induced obesity. We collected fecal samples from animals at five time points on a chow or high
fat Western Diet (WD) to determine how these populations changed as obesity and metabolic
disease developed. Metabolic disruptions were apparent in animals after two weeks of high-fat
feeding, yet microbial population shifts began after just two days. Additionally, we found that
after twelve weeks on WD, bacteriophage populations separated into groups that
correlated either with an obese metabolic profile or a lean metabolic profile. Interestingly, most
bacteriophage genera correlated to metabolic data similar to their putative bacterial host family,
but this was not always the case. Our study highlights a novel connection between diet-induced
metabolic functionality and the intestinal microbiome.
Materials and Methods
Experimental Approach
Animals and Diets
Male C57BL/6J mice from Jackson Laboratories (Bar Harbor, ME) were singly housed in
standard microisolator cages at the Veterinary Research Building, College of Veterinary
Medicine, Auburn University. The room was maintained at an ambient temperature of 22°C ±
2°C on a 12:12 light:dark cycle with zeitgeber time (ZT) 0 representing lights on and ZT12
representing lights off. All experimental procedures were approved by the Auburn University
Animal Care and Use Committee. Animals were fed standard rodent chow for 1-week during
acclimation to the facility. After which, animals were split into groups receiving either
the standard chow diet with tap water (Chow) or a High-Fat Western Diet with tap water
(WD). The chow diet (Teklad Global Rodent Diet 2018) contained 24% of calories from protein,
36
18% from fat, and 58% from carbohydrate. The WD diet was based on the AIN-93G diet and
consisted of 44% carbohydrate, 16% protein, and 40% fat, 30% of which was provided from
lard, 30% from butterfat, 30% from Crisco, 7% from soybean oil and 3% from corn oil. All
dietary groups were given food and water ad libitum.
Metabolic Cages
Promethion Mouse Cages (Sable Systems, Las Vegas, NV) were utilized to house
animals for metabolic screening and phenotyping. Animals were transferred from
their home cages and singly housed in the metabolic cages at three time points (2-, 4- and 12-
weeks after diets began). The animals were kept in the cages for 3 consecutive days with the
1st day committed to environment acclimatization and the 2nd and 3rd days for data collection. All
animals were returned to their home cage after completion of metabolic phenotyping. Animal
activity was measured by the Promethion XYZ Beambreak Activity Monitor. Food, water, and
body weight were measured by Promethion precision MM-1 Load Cell sensors. The amount food
and water withdrawn from the hoppers was measured and analyzed. The body mass
monitors were plastic tubes that also functioned as in-cage enrichment and nesting devices.
Water vapor, CO2, and O2 were analyzed by the Promethion GA-3 gas-analyzer to provide
detailed respirometry data. Energy expenditure (EE) was calculated in kilocalories (kcal) by
utilizing the Weir equation: 60*(0.003941*VO2 (n) +0.001106*VCO2 (n)) in which VO2 is the
oxygen uptake and VCO2 is the carbon dioxide output, both of which are measured in ml/min.
Respiratory exchange ratio (RER) was determined by measuring gas exchange within the
metabolic cages to identify the substrate being primarily utilized for energy within the body.
Specifically, RER is the ratio of CO2 produced to the volume of O2 consumed (RER = VCO2 /
37
VO2) where a RER ~ 0.7 indicates lipid utilization and a RER ~ 1.0 indicates carbohydrate
utilization. All metabolic phenotyping data were analyzed using ExpeData software
(version 1.8.2; Sable Systems) with Universal Macro Collection (version 10.1.3; Sable
Systems).
Fecal Sample Collection
Collection of fecal matter was performed at the initiation of diet change (Day 0) as well
at four other time points following WD feeding: 2 days, 2-, 8-, and 12-weeks. Animals were
removed from their home cages and placed in sterile microisolator cages without bedding for 3
hours. Food and water were provided to the animals during this time. Mice were then returned to
resident cages and feces were collected from the sterile cages for DNA extraction and shotgun
metagenomic sequencing.
Tissue Collection and Analysis
Upon completion of the study, all animals were fasted and then sacrificed
via CO2 asphyxiation and quickly decapitated by guillotine to allow trunk blood collection.
Tissues including the liver and visceral (epididymal and retroperitoneal) and subcutaneous
(inguinal) white adipose depots were excised and weighed. Final blood glucose was measured by
an Accu-Chek blood glucose meter. Serum insulin levels were determined by an insulin ELISA
assay (Crystal Chem, Inc., Downers Grove, IL) and data were analyzed for insulin resistance
using the HOMA-IR score (HOMA-IR = (26 * fasting serum insulin * fasting blood
glucose)/405).

38
Shotgun metagenomic sequencing-based Microbiome Profiling
Immediately following collection, DNA was extracted from fecal samples using the
Omega E.N.Z.A. Stool DNA kit. Extracted DNA samples were pooled (2/sample) and shotgun
metagenomic sequencing was performed by Hudson Alpha (Huntsville, AL). Whole genome
sequencing was performed using an Illumina HiSeq v4 with a 2 x 125 paired-end sequencing 200
million reads. Metagenomic sequences were evaluated for quality using FastX toolkit 18. Low
quality sequences (Q-score less than 30) and sequencing adapters were removed using
Trimmomatic 19. Sequences were then uploaded to the Metagenomic Rapid Annotation Server
(MG-RAST) version 4.0.3 for taxonomic and functional annotation 20. Briefly, sequences were
paired, filtered for quality, dereplicated, filtered for host-specific sequences (Mus musculus,
UMD v3.0), and annotated. Annotated profiles of each sample are publicly available at the MG-
RAST repository (https://www.mg-rast.org/mgmain.html?mgpage=project&project=mgp81921).
Taxonomic classifications were annotated using the GenBank repository with the minimum
cutoff parameters of 1x10⁻⁵ e-value and alignment length of 15. Density plots, calculated by total
annotated hits, were used to set stringent uniform percent identity thresholds while maintaining
an accurate measurement of the microbial populations. The percent identity was set to a
minimum of 80% identity for bacterial and functional annotations and 70% identity for
bacteriophage (Order Caudovirales) annotations. At these parameters, we were able to provide a
conservative estimate of taxa while excluding ambiguous sequences. Current databases are not
complete for viral genera classification due to variations in taxonomic classification strategies.
Therefore, species within the order Caudovirales, as annotated by MG-RAST, were cross-
referenced with the International Committee on Taxonomy of Viruses taxonomic database or
other documentation detailing classification of the bacteriophage 21 (See Appendix 1 for
39
annotation reference database). From this, we were able to update viral species into current
taxonomic genera in order to describe the types of bacteriophage present and how they fluctuate
following dietary change. Descriptions of genera present in our samples are outlined in Appendix
1. Taxonomic classification hits were then normalized based on the total hit count. Rarefaction
curves depicting alpha diversity were generated using the MG-RAST server.
Statistics
Statistical analysis
Final body and tissue weights along with serum measures were analyzed using a one-
way ANOVA with a Newman-Keuls post-hoc test. The percent body weight change and 24-hour
cycle data were assessed by a repeated measures two-way ANOVA so that animals in one diet
group could be compared with animals in another diet group across dietary weeks or circadian
time points. The above statistical analyses were performed using SigmaPlot with significance
determined at p < 0.05. Multiple linear regression analysis (ANCOVA) was employed to assess
the impact of body mass on metabolic cage parameters and energy expenditure was adjusted
accordingly. Utilization of the National Mouse Metabolic Phenotyping Centers (MMPC) Energy
Expenditure analysis page (https://www.mmpc.org/shared/regression.aspx) allowed for the
assessment of body weight as a covariate on energy expenditure with significance determined at
p < 0.05. Significance for all measures was determined at p < 0.05 and all data are presented as
Mean ± SE.

40
Microbiome statistical analysis
Three pooled samples for each diet group at each collection point were used to calculate
changes of relative abundance in the microbiome. Relative abundance was used to calculate
means and standard deviations of each treatment groups at each time point using the statistical
program GraphPad Prism v4. Using the R studio statistical platform 22, t-tests were performed to
identify significant difference in relative abundance of microbial taxa. Non-metric
multidimensional scaling (nMDS) ordination was generated in R studio using the vegan package
23. To generate the nMDS, raw bacterial hits were used to compute a sample dissimilarity matrix
using the Bray-Curtis dissimilarity index. This matrix was then used to compute an ordination of
the samples in two dimensions. The vegan package was also used to calculate Shannon’s
Diversity Index scores. Then, the Pielou's Evenness Index was calculated by dividing the
Shannon’s Diversity Index score by the log of unique species amount. Mann-Kendall Trend tests
were performed on diversity and evenness scores separately using the randtest package 24.
Pearson correlation coefficients were calculated using relative abundance and metabolic readouts
at 12 weeks following dietary exposure in R studio using the package psych 25. Pearson
correlation plots were generated in R studio using the package ggcorplot 26 using a correlation
coefficient threshold of an absolute value of 0.6.
Results
Obesity pathophysiology
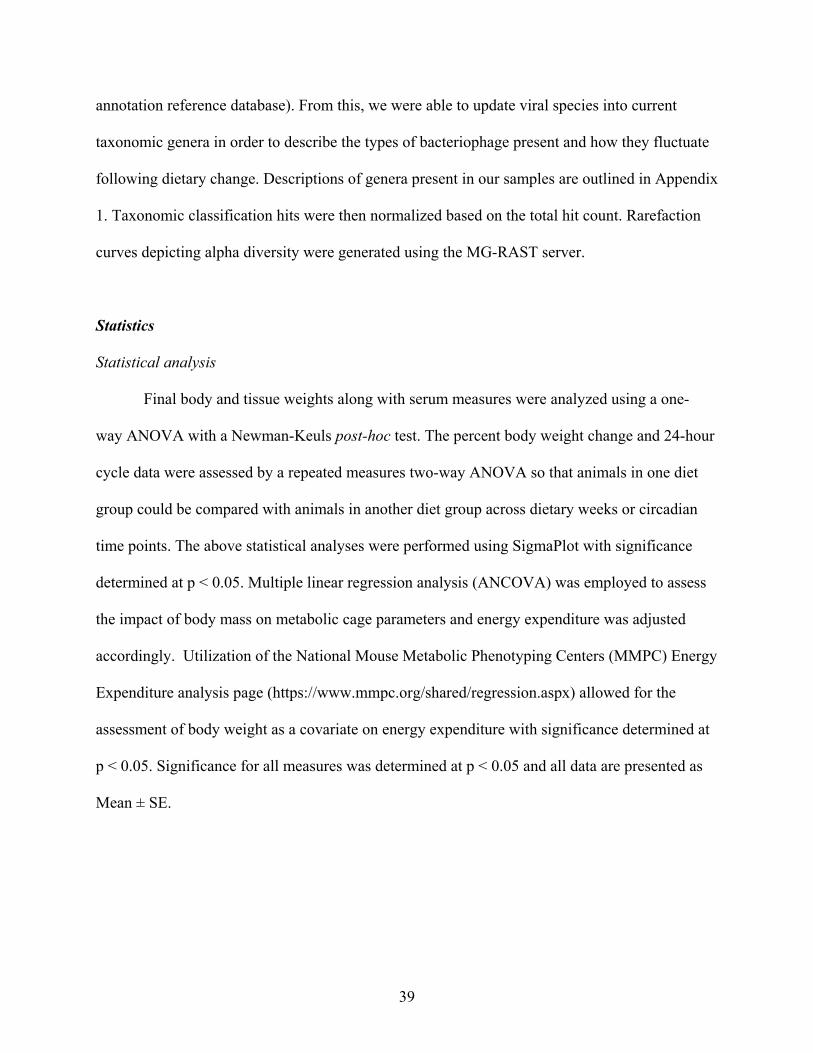
Body weight was tracked over the course of the 12-week experiment (Fig 2.1). Animals
fed the WD had a significantly higher percent body weight change compared to chow starting at
week 2 (p < 0.01) and persisting throughout the duration of the 12-week experiment (p < 0.001).

41
The change in body weight was mainly due to an increase in body fat as the WD-fed group had
significantly heavier visceral and subcutaneous (Sub-Q) fat pad weights (Table 2.1, visceral: p <
0.001; Sub-Q: p < 0.01). Although weights were significantly increased by WD feeding, there
was no effect of WD on fasting blood glucose. Serum insulin levels, however, were significantly
elevated in the WD-fed group after 12 weeks (Table 2.1, p < 0.01). Insulin resistance was
determined using the HOMA-IR equation and revealed that the WD-fed animals were insulin
resistant compared to the Chow-fed animals (Table 2.1, p < 0.01).
Metabolic rhythm and flexibility
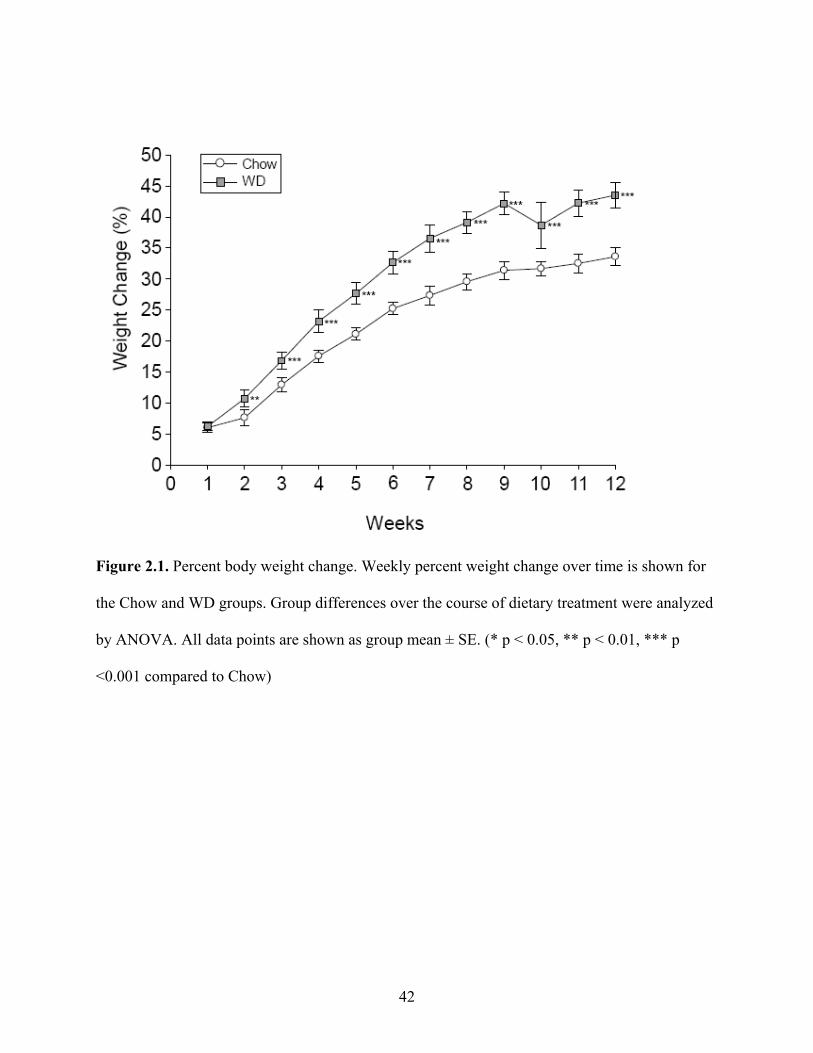
To examine the changes in average EE within the light and dark phases, we measured EE
at each ZT over a 24-hour cycle. Although diurnal rhythmicity was observed in both dietary
groups, the WD induced significant disruptions as early as 2 weeks. The WD-fed group exhibited
elevated average EE when compared to Chow during the inactive (day) period from ZT4-
ZT11 (Fig 2.2A, p < 0.01). At 4 weeks, the WD-fed group continued to demonstrate elevated
average EE during the day, specifically at ZT3, ZT6 and ZT8-11 (Fig 2.2B, p < 0.05). By
12 weeks, the WD-fed group exhibited significantly elevated average EE for the entirety of the
day cycle (Fig 2.2C, p < 0.01). Additionally, we observed a dip in the average EE in from ZT18-
22, which was not as pronounced in the WD-fed group. Consequently, the EE of the WD-
fed group was significantly elevated during that time (Fig 2.2C, p < 0.05).
42
Figure 2.1. Percent body weight change. Weekly percent weight change over time is shown for
the Chow and WD groups. Group differences over the course of dietary treatment were analyzed
by ANOVA. All data points are shown as group mean ± SE. (* p < 0.05, ** p < 0.01, *** p
<0.001 compared to Chow)

43
TABLE 2.1. Final body weight, tissue weights normalized to body weight and serum measures for the three dietary groups.
Chow WD Final Body (g) 27.4 ± 0.426a 39.8 ± 1.58b Normalized eWAT (g) 0.024 ± 0.002a 0.060 ± 0.004b Normalized rWAT (g) 0.006 ± 0.001a 0.017 ± 0.003b Normalized iWAT (g) 0.009 ± 0.0004a 0.026 ± 0.004b Normalized Liver (g) 0.046 ± 0.003 0.048 ± 0.002 Insulin (ng/mL) 0.814 ± 0.246a 2.27 ± 0.367a Glucose (mg/dL) 164 ± 11.4 171 ± 14.7 HOMA-IR 8.84 ± 2.71a 26.2 ± 4.82a
Data are presented as mean ± SE. Differing superscript letters indicate differences between dietary conditions P<0.05.

44
Across all three experimental time points, a diurnal rhythm was observed in the RER
of Chow-fed mice: greater metabolism of lipids during the inactive, day phase
and more carbohydrate utilization during the active, night phase (Fig 2.3A-C). At week 2 and
persisting through week 12, this rhythm was significantly dampened in the WD fed group with
near constant lipid utilization across the time points. At 2 weeks, WD-fed animals demonstrated
a significantly elevated RER from ZT4-ZT7 and a significantly decreased RER from ZT13-17
and ZT22-ZT24 (Fig 2.3A, p < 0.05). Four-weeks after diets began, RER in the WD-fed group
was significantly decreased from Chow-fed animals starting at ZT12 and continuing to
ZT24 (Fig 2.3B, p < 0.05). Lastly, after 12 weeks of dietary exposure, we observed results
similar to week 4 during ZT13-ZT18 with the WD-fed animals exhibiting a significantly
decreased RER (Fig 2.3C, p <0.05). These data suggest that the WD significantly impacted
metabolic diurnal rhythms as well as metabolic flexibility. These effects were observed as early
as 2 weeks and persisted through 4 and 12 weeks of WD feeding.
Diurnal activity and feeding behavior
We observed a typical murine diurnal rhythm in our animals with elevated activity during
the night phase and decreased activity during the day (Supplementary Figure 1A-C). Diet did not
appear to have an effect on activity at the 2-week time point (Supplementary Fig 1A). Similarly,
4-weeks of WD consumption did not induce large-scale changes in diurnal activity
(Supplementary Fig 1B). However, at the 12-week experimental time point, we observed a
significant drop in activity in the WD-fed group from ZT13-ZT15 (Supplementary Fig 1C, p <
0.05). However, this did not cause a significant decrease in activity when averaged across the
entire night cycle.
45
Figure 2.2. Energy expenditure at 2-, 4- and 12-weeks. A. Mean circadian analysis of energy
expenditure at each hour in the 24-hour cycle in the Chow and WD groups after 2-weeks of
dietary exposure. B. Mean circadian analysis of energy expenditure at each hour in the 24-hour
cycle in the Chow and WD groups after 4-weeks of dietary exposure. C. Mean circadian analysis
of energy expenditure at each hour in the 24-hour cycle in the Chow and WD groups after 12-
weeks of dietary exposure. All data points are shown as group mean ± SE. (* p < 0.05, ** p <
0.01, *** p <0.001 compared to Chow)

46
After 2-weeks on the diets, the WD-fed group consumed significantly more food and
water by weight than the Chow-fed group during the day (Supplementary Fig 2A, left and
middle panels, p < 0.05). Kilocalorie consumption was found to be significantly greater in the
WD-fed group during all three time points (Supplementary Fig 2A, right panel, p < 0.05). At the
4-week time point, the WD-fed group consumed more grams of food during the day, but less
food during the night than the Chow-fed groups (Supplementary Fig 2B, left panel, p < 0.01).
This translated into greater kilocalorie consumption in the WD-fed animals during the day and
total (Supplementary Fig 2B, right panel, p < 0.01). Twelve weeks after diets began, the WD-fed
group did not consume more food by weight than the Chow-fed animals. However, kcal
consumption was significantly elevated in the WD-fed group compared to Chow-fed
group for the day, night and 24-hour total data points due to caloric density of the food
(Supplementary Fig 2C, right panel, p < 0.05). There was not a significant difference in water
consumption between the Chow-fed and WD-fed groups at 4 or 12 weeks.
Diet-Induced Changes in the Enteric Microbiota
To identify WD-induced changes in the enteric microbiota, we used shotgun
metagenomic sequencing of fecal material at each indicated timepoint. First, to ensure that we
had adequate depth of sequencing, estimates of alpha diversity and depth of sampling were
assessed using rarefaction curves (Supplementary figure 3A-E). Each sample at each time point
reached a plateau, (indicating more sequences than OTUs) signifying adequate depth of sampling
and alpha diversity.
We next assessed global changes in the enteric microbiome in the WD-fed vs. Chow-fed
mice. To achieve this, we analyzed the composition of the enteric microbiota over time by means

47
Figure 2.3. Respiratory equivalent ratio at 2-, 4- and 12-weeks. A. Mean circadian analysis of
respiratory equivalent ratio at each hour in the 24-hour cycle in the Chow and WD groups after
2-weeks of dietary exposure. B. Mean circadian analysis of respiratory equivalent ratio at each
hour in the 24-hour cycle in the Chow and WD groups after 4-weeks of dietary exposure. C.
Mean circadian analysis of respiratory equivalent ratio at each hour in the 24-hour cycle in the
Chow and WD groups after 12-weeks of dietary exposure. All data points are shown as group
mean ± SE. (* p < 0.05, ** p < 0.01, *** p <0.001 compared to Chow)
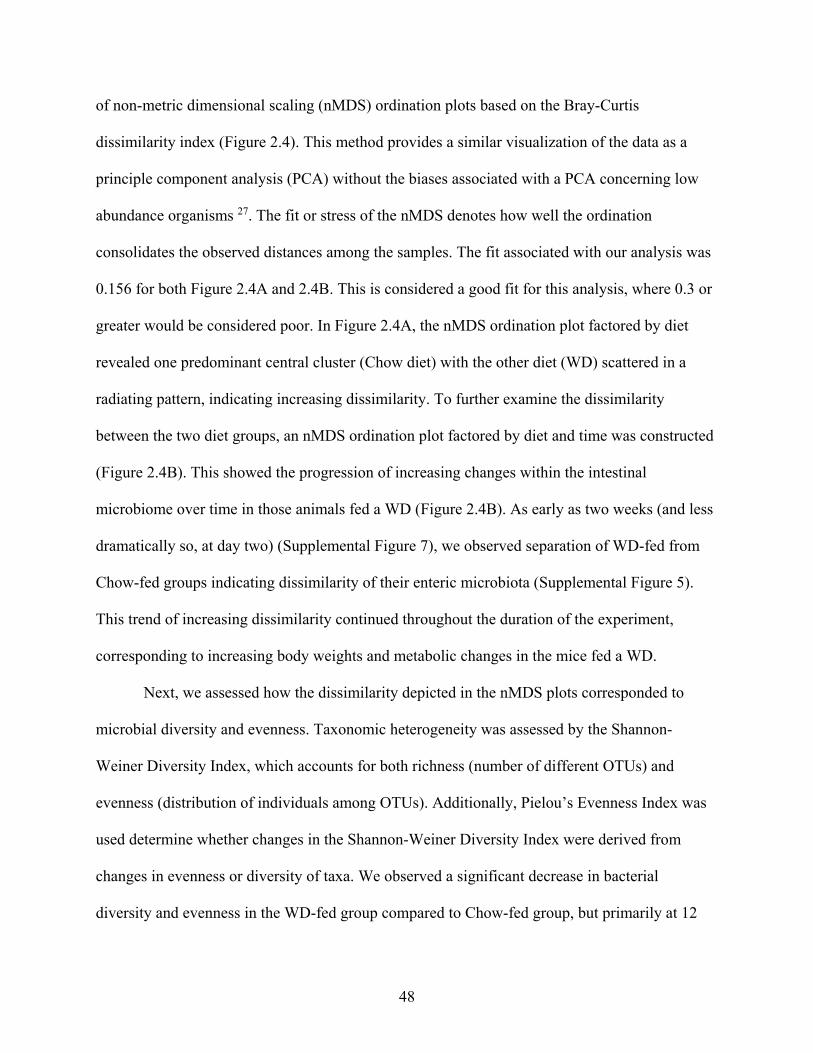
48
of non-metric dimensional scaling (nMDS) ordination plots based on the Bray-Curtis
dissimilarity index (Figure 2.4). This method provides a similar visualization of the data as a
principle component analysis (PCA) without the biases associated with a PCA concerning low
abundance organisms 27. The fit or stress of the nMDS denotes how well the ordination
consolidates the observed distances among the samples. The fit associated with our analysis was
0.156 for both Figure 2.4A and 2.4B. This is considered a good fit for this analysis, where 0.3 or
greater would be considered poor. In Figure 2.4A, the nMDS ordination plot factored by diet
revealed one predominant central cluster (Chow diet) with the other diet (WD) scattered in a
radiating pattern, indicating increasing dissimilarity. To further examine the dissimilarity
between the two diet groups, an nMDS ordination plot factored by diet and time was constructed
(Figure 2.4B). This showed the progression of increasing changes within the intestinal
microbiome over time in those animals fed a WD (Figure 2.4B). As early as two weeks (and less
dramatically so, at day two) (Supplemental Figure 7), we observed separation of WD-fed from
Chow-fed groups indicating dissimilarity of their enteric microbiota (Supplemental Figure 5).
This trend of increasing dissimilarity continued throughout the duration of the experiment,
corresponding to increasing body weights and metabolic changes in the mice fed a WD.
Next, we assessed how the dissimilarity depicted in the nMDS plots corresponded to
microbial diversity and evenness. Taxonomic heterogeneity was assessed by the Shannon-
Weiner Diversity Index, which accounts for both richness (number of different OTUs) and
evenness (distribution of individuals among OTUs). Additionally, Pielou’s Evenness Index was
used determine whether changes in the Shannon-Weiner Diversity Index were derived from
changes in evenness or diversity of taxa. We observed a significant decrease in bacterial
diversity and evenness in the WD-fed group compared to Chow-fed group, but primarily at 12

49
Figure 2.4. An nMDS ordination of the microbiota samples A) by diet and B) over time. The
taxonomic profiles of the samples were used to compute the sample dissimilarity matrix using
Bray-Curtis dissimilarity index. The matrix was used to compute an ordination of the samples in
two dimensions (MDS1 and MDS2). The stress associated with this ordination is 0.156. The
shapes in plot B denote the diet (Chow and WD), where the color denotes the time point (0 days,
2 days and 2, 8 and 12 weeks on the diets).
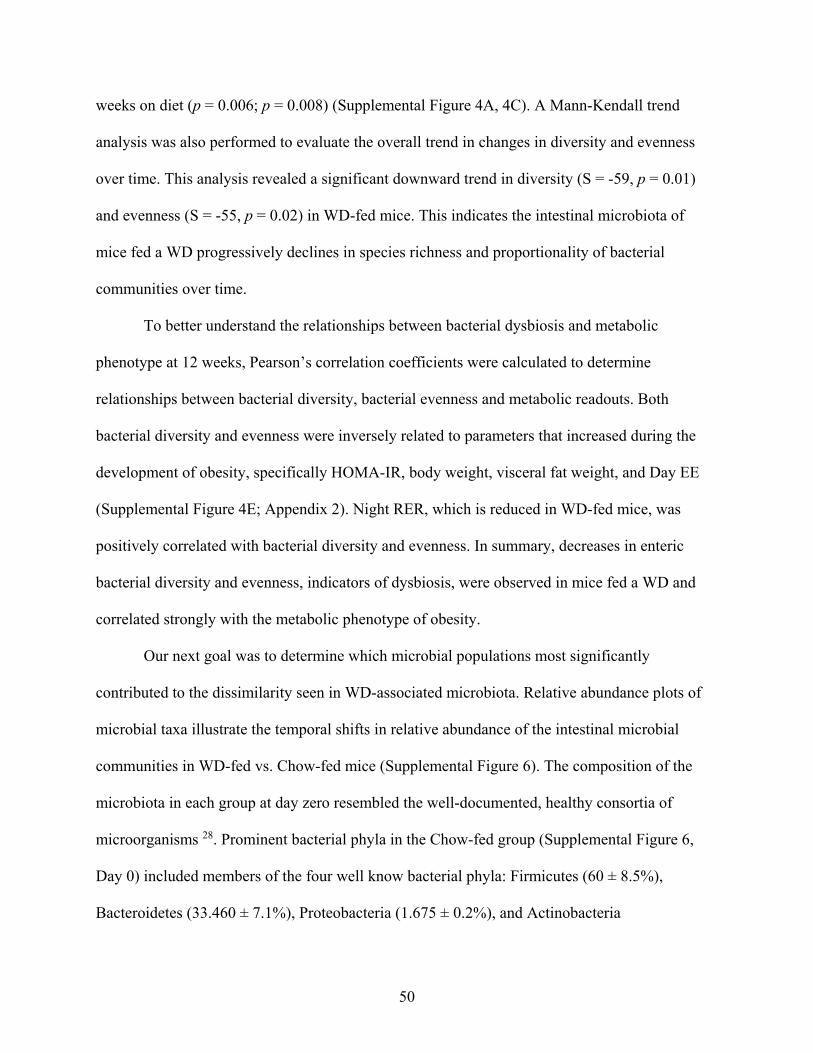
50
weeks on diet (p = 0.006; p = 0.008) (Supplemental Figure 4A, 4C). A Mann-Kendall trend
analysis was also performed to evaluate the overall trend in changes in diversity and evenness
over time. This analysis revealed a significant downward trend in diversity (S = -59, p = 0.01)
and evenness (S = -55, p = 0.02) in WD-fed mice. This indicates the intestinal microbiota of
mice fed a WD progressively declines in species richness and proportionality of bacterial
communities over time.
To better understand the relationships between bacterial dysbiosis and metabolic
phenotype at 12 weeks, Pearson’s correlation coefficients were calculated to determine
relationships between bacterial diversity, bacterial evenness and metabolic readouts. Both
bacterial diversity and evenness were inversely related to parameters that increased during the
development of obesity, specifically HOMA-IR, body weight, visceral fat weight, and Day EE
(Supplemental Figure 4E; Appendix 2). Night RER, which is reduced in WD-fed mice, was
positively correlated with bacterial diversity and evenness. In summary, decreases in enteric
bacterial diversity and evenness, indicators of dysbiosis, were observed in mice fed a WD and
correlated strongly with the metabolic phenotype of obesity.
Our next goal was to determine which microbial populations most significantly
contributed to the dissimilarity seen in WD-associated microbiota. Relative abundance plots of
microbial taxa illustrate the temporal shifts in relative abundance of the intestinal microbial
communities in WD-fed vs. Chow-fed mice (Supplemental Figure 6). The composition of the
microbiota in each group at day zero resembled the well-documented, healthy consortia of
microorganisms 28. Prominent bacterial phyla in the Chow-fed group (Supplemental Figure 6,
Day 0) included members of the four well know bacterial phyla: Firmicutes (60 ± 8.5%),
Bacteroidetes (33.460 ± 7.1%), Proteobacteria (1.675 ± 0.2%), and Actinobacteria

51
Figure 2.5. Changes in relative abundance of microbial composition after administration of the
Western diet. A) Class and B) Family level bacterial composition in mice fed Chow or WD after
2 days, 2, 8 and 12 weeks of dietary exposure. The mean relative abundance (%) of bacterial
phyla are shown.

52
(1.012 ± 0.2%), which are consistent with previous reports29,30. The microbial composition
remained relatively stable throughout the 12-week experiment for mice fed a Chow diet. On the
other hand, shifts in relative abundance profiles of WD-fed mice samples were detected as early
as day 2. For example, Proteobacteria showed a significant reduction in abundance in the WD-
fed group vs. Chow-fed group (p = 0.02). Proteobacteria continued to be significantly decreased
in WD-fed group at 2 weeks (p = 0.0005) and 12 weeks (p = 0.002). Conversely, the phylum
Verrucomicrobia began to increase after 2 days from 1.467 ± 2.4% to 9.182 ± 4.6% in the WD-
fed group. The increase in Verrucomicrobia abundance was transient and began to decrease
around 8 weeks. Verrucomicrobia returned to pre-diet abundance levels by 12 weeks. Notably,
significant increases were observed in in Firmicutes (p = 0.04) at 12 weeks.
To more precisely resolve shifts in bacterial communities, we next evaluated class-level
community profiles. The composition of the bacterial classes in the Chow-fed group were
relatively stable throughout the experiment (Figure 2.5A). In contrast, starting as early as 2 days,
we observed an increase in the class Verrucomicrobiae in the WD-fed group that peaked at 2
weeks and returned to roughly baseline levels by 12 weeks (Figure 2.5A). Other significant
changes in the WD group included decreases in Clostridia at 2 weeks and most dramatically by
12 weeks (p = 0.01) (Figure 2.5A). The most notable change in the WD-fed group was a
dramatic increase in Bacilli at 12 weeks (p = 0.04). Bacilli have been previously shown to be
elevated in the intestinal microbiota in obese individuals 29. Thus, even though no significant
differences were noted between WD-fed and Chow-fed groups in the Firmicutes phyla, there
were underlying changes in these constituents at the class level between the two groups. In
addition to these changes, a significant decrease in Bacteroidia was observed in the WD-fed
group at 2 weeks (p = 0.04) and 12 weeks (p = 0.0007). Additionally, Alphaproteobacteria,

53
Betaproteobacteria, Deltaproteobacteria, Epsilonproteobacteria and Gammaproteobacteria were
significantly decreased at various time-points throughout the experiment in WD-fed groups.
Thus, many subpopulations within the phylum Proteobacteria were reduced in abundance in
WD-fed vs. Chow-fed mice.
Family level community profiles were assessed to obtain a more detailed view of the
bacterial population dynamics on different diets. This revealed that the increase in the phylum
Verrucomicrobia in WD-fed mice was predominantly due to an increase in the family
Verrucomicrobiaceae (Figure 2.5B), primarily from the genera Akkermansia (data not shown).
While Verrucomicrobiaceae relative abundance correlated well with the abundance pattern of
Verrucomicrobiae, Bacillaceae did not follow the same trend as their class, Bacilli. Instead, there
was a significant decrease of Bacillaceae in the WD-fed group compared to the Chow-fed mice
(0.517 ± 0.02%) at 2 days (0.362 ± 0.009%, p = 0.006) and 2 weeks (0.338 ± 0.07%, p = 0.01).
Enterococcaceae, specifically the Genera Enterococcus, appeared to be the major contributor to
the increase in the class Bacilli at 12 weeks in this group (p = 0.04). Additionally, the increase
seen in the class Bacilli could be attributed to a bloom in Streptococcaceae abundance at 2 weeks
(p = 0.005), 8 weeks (p =0.01) and 12 weeks (p =0.02). Lactobacillaceae, another member of the
class Bacilli, displayed an increase in relative abundance at day 2, but returned to baseline by 8
and 12 weeks. Members of the class Clostridia also displayed population divergence between
WD-fed vs. Chow-fed mice which included a reduction in Clostridiaceae beginning at 2 days on
WD (p = 0.008). Though not significant, we observed a decreasing trend in Clostridiaceae in the
WD-fed group at 2, 8, and 12 weeks as compared to Chow-fed groups. Other families within the
class Clostridia that were also significantly reduced included Clostridiales Family XI at 2 days (p
= 0.003) and 2 weeks (p = 0.03) and Clostriales Family XVII at 2 weeks (p = 0.05) and 12 weeks
54
(p = 0.009). Taken together, we observed reductions in many bacterial components,
corresponding to the reduction of overall diversity and evenness within the intestinal microbiota,
which could indicate initiation of dysbiosis as some organisms bloom as others decrease in
abundance.
Diet-Induced Changes in the Enteric Phageome
We next wanted to determine how other constituents of the microbiome, namely
bacteriophage populations, were impacted by WD vs. Chow diets. First, we assessed the degree
of the dissimilarity by analyzing bacteriophage diversity and evenness (Supplementary Figure
4B and 4D). Similar to the trends observed in bacterial populations in WD-fed mice, we
observed a reduction in the diversity and evenness of the enteric phageome over the course of the
experiment. At 2 weeks, there was a significant reduction in bacteriophage OTU diversity (p =
0.0001) and evenness (p = 0.0002) in the WD-fed group (Supplementary figure 4B, 4D). The
Mann-Kendall trend analysis revealed a downward trend over the course of the experiment in
both diversity (S = -65, p = 0.008) and evenness (S = -75, p = 0.003) in WD-fed groups.
Moreover, the reduction in the diversity and evenness of the enteric phageome preceded similar
changes in bacteria following dietary exposure. Similar to our bacterial diversity and evenness
correlations with metabolic readouts, bacteriophage diversity and evenness were inversely
related to parameters seen to increase during obesity and at the end of our experiment,
specifically HOMA-IR, body weight, visceral fat weight, and Day EE (Supplemental Figure 4E).
Thus, changes in bacteriophage populations happened in tandem with changes in bacterial
composition and changes in metabolic phenotype.

55
Figure 2.6. Changes in relative abundance of bacteriophage composition after administration of
the Western diet. A) Family and B) Genus level viral composition derived from the order
Caudovirales in mice fed Chow or WD at 2 days, 2, 8 and 12 weeks. Data shown are based on
those families belonging to the order Caudovirales. The mean relative abundances (%) of viral
families are shown.
56
The enteric phageome of Chow-fed mice remained relatively consistent throughout the
experiment at the family level (Figure 2.6A). Mice fed a WD demonstrated a reduction of
Myoviridae and Podoviridae as early as day 2. Myoviridae was significantly reduced in the WD-
fed group at 2 weeks (p = 0.001) and 8 weeks (p = 0.05) as compared to the Chow-fed group.
Myoviridae abundance continued to decline in WD-fed mice at 12 weeks (2.297 ± 0.5%), though
not significant due to a decrease observed in Chow-fed mice. In contrast to Myoviridae, we
noted a significant increase in relative abundance of Siphoviridae at 2 weeks (p = 0.0001).
Taken together, WD feeding induced elevated abundance of the Siphoviridae family and reduced
abundance in the Myoviridae family compared to Chow-fed mice.
Evaluating genus level bacteriophage profiles showed Chow-fed mice maintained a
relatively consistent enteric phageome profile until 12 weeks (Figure 2.6B). In contrast, the WD-
fed group exhibited an increase in P335-like viruses starting at 2 days, which was maintained
through 12 weeks (Figure 2.6B), with significant increases at 2 weeks (p = 1.78 x 10⁻⁵) and 8
weeks (p =0.0001). We also observed a significant depletion of the viral genus phiCD119-like
viruses at 2 weeks (p = 0.004) in WD-fed mice. Though not significant, phiCD119-like viruses
remained reduced in relative abundance in the WD-fed group at 8 weeks and 12 weeks. Other
significant shifts in bacteriophage profiles in the WD-fed group included an increase in phiETA-
like viruses at 8 weeks (p = 0.01), a decrease in T4-like viruses at 2 weeks (p = 0.0006) and a
decrease in T7-like viruses at 2 days (p = 0.03). Additionally, we noticed an increase in phiFL-
like viruses at 12 weeks. phiFL-like viruses are primarily temperate bacteriophage and this
increase could be attributed to an increase in host species containing a prophage. The WD-
induced alterations in the enteric phageome occurred as early as 2 days on diet (Figure 2.6B),
preceding changes in their bacterial host abundance (Figure 2.5B).

57
Correlations between Diet-Induced changes in the Bacterial and Bacteriophage Consortia
To obtain a more comprehensive picture of how diet affects the relationship between
specific phage genera and bacterial families, we calculated Pearson correlation coefficients
between the Caudovirales genera and the 55 most abundant bacterial families at the final time
point of 12 weeks (Figure 2.7). This analysis sorted bacteria and bacteriophages into two major
groups, 1) a large group of bacteria that correlated positively with a large group of phages (both
highlighted with green brackets) and 2) a smaller group of bacteria and bacteriophage that were
positively correlated with each other (orange brackets). The two groups also had conversely
negative correlations with members of the other (green vs. orange) group. This correlation
grouping allowed for separation of families, most of which clustered with other families
belonging to the same class. This was not true for members of the class Actinobacteria, Bacilli,
and Gammaproteobacteria whose families segregated because of differential correlation. Given
this information, we next determined the frequency of putative phage-host relationships between
the positively correlated groups.
Upon further investigation of bacteria:bacteriophage relationships, we identified 6 (26%)
of the 23 bacteriophage genera in the green grouping were strongly positively correlated
(correlation coefficient of 0.6 or higher) with their putative bacterial host family (Figure 2.7).
Additionally, 5 other bacteriophage genera within this grouping showed positive relationships
with their preferred bacterial host family (correlation coefficients between 0.4 and 0.6) [total
with above 47.8%]. Not all bacteriophage within this grouping correlated positively with putative
host. Nine of the bacteriophage genera within this grouping negatively correlated with their
putative host. The correlation coefficients of these bacteriophage genera with their host varied
from slightly negative to strongly negative (Appendix 1). Interestingly, bacteriophage genera

58
Figure 2.7. Diet Induced Bacteria-Bacteriophage Patterns in Obesity. Pearson’s correlation plot
of the top 55 most abundant Bacterial Families and all Bacteriophage Genera (Viral OTUs within
the order Caudovirales) for mice fed Chow or WD at 12 weeks. Positive values (red circles)
indicate positive correlation coefficients above 0.6, and negative values (blue circles) indicate
inverse correlation coefficients below -0.6. The size and shading of the circles indicate the
magnitude of the correlation, where darker shades indicate a stronger correlation than lighter
shades. Correlation coefficient values outside of the threshold of 0.6 are not included in this plot.
Putative host information and correlation coefficient values between bacteriophage genera and
putative bacterial host family are listed in Appendix 1.

59
with strong negative correlations in this grouping targeted either members of Bacillaceae,
Streptococcaceae or Staphylococcaceae. The green grouping showed a variety of relationships
between host and bacteriophage, but the orange grouping was mainly composed of strongly
positive bacteria:bacteriophage relationships. Of the 10 bacteriophage genera within the orange
grouping, 6 were strongly positively correlated with their preferred bacterial host family [60%].
Additionally, 2 other bacteriophage genera within this grouping while positively correlated with
their preferred bacterial host family, had weaker correlations (coefficients between 0.4 and 0.6)
[total with above 80%]. Taken together, phage abundance did positively correlate with the
abundance of their putative host bacteria in many cases, but not all.
Among the organisms outlined with green brackets, we see positive relationships between
6 bacteriophage and their putative bacterial host (Figure 2.7). These include bacteriophage
genera who target bacterial families Pasteurellaceae (phiPLPE-like viruses), Burkholderiaceae
(Bpp-1- and phiE125-like viruses), Clostridiaceae (phiCD119-like viruses) and
Enterobacteriaceae (Che8- and RB49-like viruses). Many of the bacteriophage belonging to these
genera are characterized as temperate. phiCD119-like viruses, for example, are temperate
bacteriophage that target Clostridium species as their host 31–33. Abundance of phiCD119-like
viruses, and other temperate bacteriophage, is likely dependent on bacterial host abundance if
they are present as integrated prophage. Five other bacteriophage genera within the green
grouping were somewhat positively correlated with their preferred bacterial host family
(0.4>x>0.6). These bacteriophages either targeted Enterobacteriaceae (Felix01-, P1- and P2-like
viruses) or Burkholderiaceae (Becp781-, Bcep22-, and P2-like viruses). Other bacteriophage
genera within the green grouping demonstrated no relationship or were negatively correlated
with their putative host. In fact, Streptococcaceae-targeting bacteriophage genera 1706- and

60
Sfi21-like viruses were strongly negatively correlated with their host, Streptococcaceae. Similar
results were seen for Staphylococcaceae-targeting bacteriophage genera 77-like viruses and
Bacillaceae- targeting bacteriophage genera SpBeta- and IEBH-like viruses.
The orange grouping contained fewer bacterial families and bacteriophage genera than
the green grouping (Figure 2.7). The majority of bacteriophage and putative host bacteria within
the orange grouping showed strong positive correlations. These include Streptococcaceae-
targeting P68-, Sfi11-, and P335-like viruses, Staphylococcaceae-targeting P68- and phiETA-like
viruses, Bacillaceae-targeting TP21-like viruses and Enterococcaceae-targeting phiFL-like
viruses. Many of these bacteriophage genera showed increases following WD feeding. For
example, P335-like viruses displayed a rapid increase in relative abundance in the phageome.
Bacteriophage within this genera target Lactococcus species as their hosts 33–37. Consistent with
this, we found a significant increase in Streptococcaceae, the taxonomic family containing the
genus Lactococcus, in WD-fed mice starting at 2 weeks. This genus is comprised of an
equivalent amount of virulent and temperate bacteriophage species. Thus, the elevation in
abundance of this bacteriophage genera cannot be solely due to replication of prophage via host
replication. Two other bacteriophage genera within the orange grouping were somewhat
positively correlated with their preferred bacterial host family (0.4>x>0.6). These bacteriophages
either targeted Streptococcaceae (936-like viruses) or Bacillaceae (Wbeta-like viruses). The
remaining bacteriophage genera within the orange grouping were not significantly correlated
with their host (Enterobacteriaceae-targeting T7-like viruses) or their host was not included in
this analysis due to low relative abundance (Halomonadaceae-targeting HAP1-like viruses).

61
Correlations between WD induced Metabolic Phenotype and the Intestinal Bacteria and
Bacteriophage populations
Next, we wanted to explore how specific bacterial families correlated with metabolic
phenotypes within the WD-fed group. Interestingly, bacterial families clustered into similar
groupings as those generated by correlations of bacteria and bacteriophage (again designated by
orange or green brackets, Figure 2.8A). Bacterial families grouped in the orange cluster
(Bacillaceae, Enterococcaceae, Lactobacillaceae, Leuconostocaceae, Listeriaceae,
Paenibacillaceae, Staphylococcaceae, Streptococcaceae, Micrococcaceae, Moraxellaceae and
Pseudomonadaceae) positively correlated with metabolic parameters shown to be indicative of
metabolic disease, namely HOMA IR, Percent Body Weight Change, Visceral Fat Weight, and
Day EE. Conversely, this orange group of bacterial families showed a strong inverse relationship
with Night RER. As mentioned previously, a lower night RER (close to 0.7) during the active
cycle would indicate primarily lipid utilization, characteristic of an inflexible metabolic status.
These results indicate that bacterial families within the orange group positively correlate with
key pathophysiological metabolic parameters associated with obesity. Thus, we can think of this
group as obesity-associated.
Correlation profiles showing a negative relationship with metabolic parameters
associated with obesity were apparent for the bacterial families within the green grouping,
including the majority of the families belonging to the classes Actinobacteria, Bacteroidia,
Betaproteobacteria, Clostridia, Cytophagia, Deltaproteobacteria, Epsilonproteobacteria,
Erysipelotrichi, Fibrobacteres, Flavobacteria, Fusobacteria, Gammaproteobacteria,
Negativicutes, Sphingobacteria, Spirochaetes, and Synergistia. Bacterial families within the
green grouping negatively correlated with HOMA IR, Percent Body Weight Change, Visceral
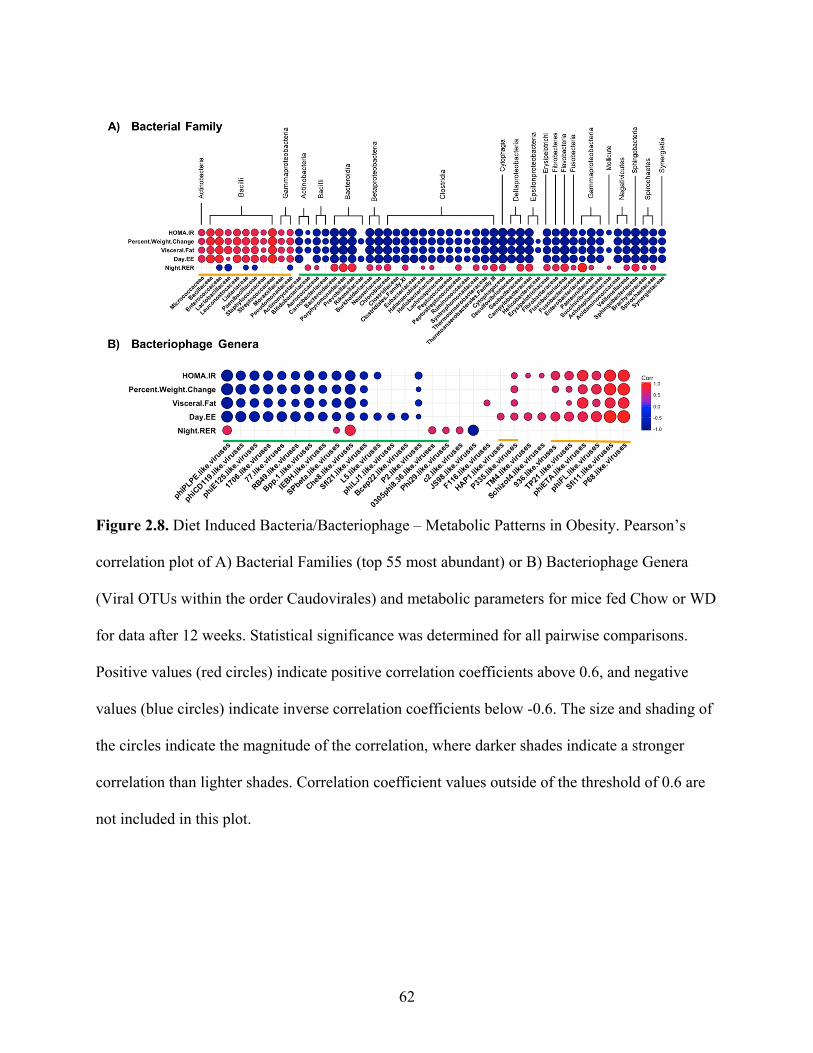
62
Figure 2.8. Diet Induced Bacteria/Bacteriophage – Metabolic Patterns in Obesity. Pearson’s
correlation plot of A) Bacterial Families (top 55 most abundant) or B) Bacteriophage Genera
(Viral OTUs within the order Caudovirales) and metabolic parameters for mice fed Chow or WD
for data after 12 weeks. Statistical significance was determined for all pairwise comparisons.
Positive values (red circles) indicate positive correlation coefficients above 0.6, and negative
values (blue circles) indicate inverse correlation coefficients below -0.6. The size and shading of
the circles indicate the magnitude of the correlation, where darker shades indicate a stronger
correlation than lighter shades. Correlation coefficient values outside of the threshold of 0.6 are
not included in this plot.

63
fat weight, and Day EE and were most often positively correlated with Night RER. Hence,
bacterial families grouped in green negatively correlate with key pathophysiological metabolic
parameters associated with obesity.
Because strong relationships were identified between bacterial families and metabolic
phenotypes, we sought to examine the relationships between bacteriophage populations in the
intestinal microbiome and the metabolic phenotype observed in the WD-fed animals. Many of
the bacteriophage genera that showed strong correlations to metabolic readouts correlated
similarly in terms of green and orange grouped bacteriophage genera (Figure 2.8B). Orange
labeled bacteriophage genera (P335-, 936-, TP21-, phiETA-, phiFL-, Sfi11- and P68-like viruses)
positively correlated with HOMA IR, Percent Body Weight Change, Visceral Fat Weight, and
Day EE. As these particular bacteriophage genera increase in relative abundance, phenotypic
markers for body weight gain increase following dietary exposure. In contrast, green labeled
bacteriophage genera (phiPLPE-, phiCD119-, phiE125-, 1706-, 77-, RB49-, Bpp1-, IEBH-,
SPbeta-, Che8-, Sfi21-like viruses, etc.) have a negative relationship with HOMA IR, Percent
Body Weight Change, Visceral Fat Weight, and Day EE revealing that as these metabolic
parameters increase, there was a decrease in the relative abundance of these bacteriophage
genera (Figure 2.8B). Because of the linked relationship between the bacteriophage genera and
their host, correlations between bacteriophage and metabolic parameters may be a reflection of
the bacterial host dynamics.
Discussion
In this study, we demonstrated that WD-feeding adversely effects the systemic metabolic
profile and the intestinal microbiome. Importantly, we have also demonstrated novel
64
relationships between specific microbiome constituents and pathophysiological metabolic
parameters associated with obesity. We described dynamic alterations to the composition of the
intestinal microbiota as early as 2 days following WD feeding. Furthermore, fluctuations in the
phageome were quite rapid, often preceding changes in abundance of their bacterial host. After
12-weeks of WD-feeding, constituents of the enteric microbiome, namely bacteria and
bacteriophages, showed distinct correlation patterns between bacteria and bacteriophage with the
metabolic phenotype, which allowed us to distinguish between a healthy microbiome and one
more typical of obesity.
Our observations reflect that compositional shifts the intestinal microbiota occur within
days following dietary exposure to the WD. Our data suggests that as animals consume a WD
over time, the diversity of microorganisms decreases over time, with over-representation of
certain organisms. This could be due to direct effects from the nutrient composition of WD or
indirect effects mediated by competition between microorganisms. The composition of the
microbiota between individuals on the same diet were relatively consistent, with only slight
variation. Yet, changes induced by WD feeding happened rapidly and trended toward decreased
diversity over time. One prominent example of rapid changes in WD-fed animals was the
transient rise in Verrucomicrobia which peaked at 2 weeks and declined to levels comparable to
Chow-fed counterparts by 12 weeks. This spike in Verrucomicrobia was mainly attributed to the
genera Akkermansia, which has been shown to play a protective role during obesity.
Administration of Akkermansia muciniphila during diet-induced obesity has been shown to
improve the metabolic profile and colonic mucus layer thickness 38. Perhaps these organisms aid
in short-term protection from intestinal microbiota dysbiosis or bloom simply due to nutrient

65
availability following dietary exposure. Nevertheless, Akkermansia spp. were unable to maintain
increased abundance after 8 weeks PD in our study.
At 12 weeks PD, we observed a depletion of Bacteroidetes and domination by Firmicutes in
WD-fed mice. The disproportionality of Bacteroidetes:Firmicutes has been previously associated
with the obese phenotype of the intestinal microbiota 8,12. Although changes in the microbiota
occurred rapidly, the shift in Bacteriodetes:Firmicutes ratio did not happen until late in our study,
at 12 weeks. Instead, we observed diet-induced fluctuations in several other phyla that preceded
the well-documented B:F ratio. Further, small changes were observed for bacteria at phylum
level, but more dynamic shifts were detectable in relative abundance of bacteria at the class level
as early as 2 days PD in WD-fed mice. The WD-fed group demonstrated a shift in bacterial
profile to one dominated by Bacilli in contrast to the Chow-fed group which was dominated by
Clostridia and Bacteroidia.
Many studies of the gut microbiota have been focused primarily on bacterial constituents,
utilizing16S amplicon sequencing, as these do account for the majority of organisms in the gut
microbiota. However, 16S amplicon sequencing has recently been described as having limited
taxonomic and functional resolution as compared to shotgun metagenomics 39. Primers used in
16S amplicon sequencing can also lead to discordant annotation results 39. For these reasons, we
chose a shotgun metagenomic sequencing approach which provides for identification of other
organisms within the microbiome (namely bacteriophage) as well as enhanced resolution of both
functional and taxonomic annotations. This approach, combined with the metabolic phenotype
analysis, has allowed us to connect several important aspects of host-microbiome interaction in
the context of WD-induced obesity. Not only have we observed changes that are consistent with
66
existing studies of the bacteriome in obesity 40,41, but we also bring into context changes in the
phageome that occur in tandem with mammalian host metabolic changes.
In recent years, there has been a rise in appreciation of the enteric virome. This is due to
technological advances in metagenomic sequencing, which has given us a reliable method to
examine the complexity within this community. The experimental design of our study allowed us
to follow the abundance patterns of a subset of organisms within the virome, the order
Caudovirales which contains bacteriophage. Of note, our study did not use methods to quantify
enveloped viruses or RNA viruses, and there may be much more to learn about these components
of the enteric virome, especially in the setting of obesity. We targeted bacteriophages in order to
describe the longitudinal shifts in their abundance following diet change as compared to their
bacterial host. To do this, we cross-annotated species annotations, within the order Caudovirales,
from the RefSeq database with the International Committee on Taxonomy of Viruses taxonomic
database or other documentation detailing classification of the bacteriophage into respective
genera (descriptions of genera present are outlined in Appendix 1).
In this study, we observed significant differences in the composition of bacterial consortia in
response to diet change, consistent with previous reports 40,41. We also observed shifts within the
bacteriophage communities in WD-fed animals even prior to those observed in bacterial
communities. Initially, we demonstrated that WD-feeding leads to increased abundance in
bacteriophage belonging to the Siphoviridae family, and a decreased abundance in those
belonging to the Myoviridae family. Similar changes have been observed in studies
characterizing changes in intestinal bacteriophage populations during inflammation 42. Previous
studies have also reported effects of diet on composition of the virome. Howe, et al.
demonstrated contrasting viral communities between individuals on a low fat and milk fat diet 12.

67
We also report dynamic changes in the phageome following WD feeding. Significant changes in
community structure were demonstrated beginning at 2 days PD in our WD fed mice. Pearson
correlation results also indicate intricate relationship networks between bacteria and
bacteriophage following dietary exposure. One explanation for elevated bacteriophage
abundance following diet change could be that viruses replicate at a much faster rate than
bacteria. Bacteria typically produce one daughter cell per replication cycle where one
bacteriophage can give rise to hundreds of new virions within one host cell per replication cycle.
Additionally, bacteriophage require less resources for production of progeny than bacteria. When
the opportunity arises, such as a bloom in target bacteria following nutrient availability,
bacteriophage can benefit from the increase in viable host bacteria. In this way, a small bloom of
bacteria could give rise to a rapid bloom of bacteriophage that target this host. Bacterial
abundance levels could appear reduced or stagnant as bacteriophage progeny are infecting new
daughter bacterial cells. This is until a plateau is reached in which bacteriophage have been
reported to co-exist with host which could be a result of co-evolution of the host or virus 43–45.
Many of the bacteriophage genera correlated positively with their host, indicating that their
relative abundance changed in parallel to their host. However, bacteriophage can bloom in the
presence of their host as well as coexist with them 46. We further demonstrate that bacteriophage
abundance dynamics do not always follow that of their host, and this pattern was exacerbated in
WD-fed mice. For example, members of the Streptococcaceae-targeting bacteriophage genera
showed a wide range of responses to WD-feeding. P335-like and 936-like viruses showed similar
responses to diet change, directly corresponding to that of their host while 1706-like viruses
showed very different patterns of abundance than their host. The P335-like viruses genus is
comprised of approximately equal portions of virulent and temperate bacteriophage species.

68
Therefore, the bloom of this bacteriophage genera could arise as a result of a combination of
interactions, such as prophage integration (temperate) in the host and kill-the-winner dynamics
(virulent). In the “kill-the-winner” scenario, host bacteria increase in abundance, followed by a
bloom in virulent bacteriophage who target that particular host. One good example of this that
we observed was the 936-like viruses, which increased on the heels of their host
Streptococcaceae. This genus of bacteriophage is strictly comprised of virulent bacteriophage
species, thus an increase in abundance was likely explained by kill-the-winner dynamics alone.
Previous theories of bacteriophage ecology and abundance predict bacteriophage populations
would follow that of their putative host - either due to lysogeny or kill-the-winner dynamics -
which much of our findings support. However, we also noted bacteriophage genera whose
abundance inversely correlated with the abundance of their bacterial host. This was exemplified
by 1706-like viruses, which are virulent bacteriophage who target Streptococcaceae, similar to
936-like viruses. They exhibited a reduction in abundance as compared to its bacterial host in
WD-fed animals, but not in Chow-fed animals. Potential explanations for this inverse correlation
are: 1) it could be due to a decrease in as yet-unidentified bacterial host populations; 2)
competition of different phages for the same host, perhaps some phages lose out, or 3) like a
recent publication reported, phage dynamics can change in response to non-host bacteria 45. To
our knowledge, 936-like and 1706-like viruses both target Lactococcus within Streptococcaceae.
Both 936-like viruses and their host Streptococcaceae displayed detectable elevations in
abundance following WD feeding. Bacteriophage persistence could also be based on sensitivities
of these bacteriophage external triggers, such as metabolites or inflammatory products, within
the microbiome following dietary exposure. Recent publications have also described how
bacteriophage communities experience compositional changes occurring early after shifting from

69
a low-fat to milk-fat diet in the absence of bacterial community compositional changes within 6
weeks 12. We demonstrated similar effects on the bacteriophage community following WD
feeding where bacteriophage abundance displayed early changes from chow counterparts. In our
study, we noted that many of the bacteriophage genera abundance changes preceded those of
their putative bacterial host family. Ongoing studies are aimed at more closely evaluating the
specific bacteria:bacteriophage dynamics following dietary exposure.
Here we show that compositional shifts in the microbiota occur prior to the onset of
pathophysiological metabolic parameters associated with obesity. Families within the class
Bacilli, namely Enterococcaceae, Streptococcaceae, Bacillaceae and Staphylococcaceae, showed
strong positive relationships with metabolic parameters elevated in WD-fed mice. Interestingly,
these families have been previously implicated in the literature as increasing the energy-
harvesting capacity of the microbiota, and thus contributing to the pathophysiology of obesity 47.
Therefore, the elevation in body weight, visceral fat, and metabolic inflexibility observed in the
WD-fed mice could be directly related to the elevation in these bacterial components in the
intestinal microbiota. The same study noted an inverse relationship between these obese-
associated bacterial families and members of the bacterial families Clostridiaceae,
Rumminococcaceae, Bacteroidaceae and Prevotellaceae 47. Similarly, we found that these
families were depleted in WD-fed animals and had strong negative relationships with the
metabolic parameters elevated in the WD-fed mice. Our findings support previous studies and
implicate the above listed bacteria as those associated with obesity, and those representative of a
leaner phenotype, respectively.
With the surge of antibiotic resistance within recent years, researchers are embracing the idea
of utilizing bacteriophage as therapy for bacterial infections. One noted advantage of

70
bacteriophage therapy to traditional antibiotics is the reduced impact on the organism’s
commensal microbiome. In a similar fashion, bacteriophage could be utilized to cause depletions
of certain blooms of bacterial constituents in the intestinal microbiome in order to bring about
homeostasis such as during colitis or obesity. The intestinal microbiota has been previously
implicated in having a causal role in the development of obesity 48. Considering this study and
other previous reports, bacteriophage therapy could be used to deplete obese-associated bacteria.
Thus, an important goal for the field will be further investigating bacteria-bacteriophage
dynamics and the impacts of this on the surrounding microbiome community. By evaluating the
dynamic relationship between bacteriophage and their bacterial hosts following WD-feeding, our
work provides an overview of the timeline of disruption of both constituents and how this relates
to the pathophysiology of obesity.
71
References 1. World Health Organization. Overweight and obesity fact sheet. (2016).
2. Hales, C. M., Carroll, M. D., Fryar, C. D. & Ogden, C. L. Prevalence of Obesity Among
Adults and Youth: United States, 2015-2016 Key findings Data from the National Health
and Nutrition Examination Survey.
https://www.cdc.gov/nchs/data/databriefs/db288_table.pdf#1. (2015).
3. Popkin, B. M. & Gordon-Larsen, P. The nutrition transition: Worldwide obesity
dynamics and their determinants. Int. J. Obes. 28, S2–S9 (2004).
4. Popkin, B. M., Adair, L. S. & Ng, S. W. Global nutrition transition and the pandemic of
obesity in developing countries. Nutr. Rev. 70, 3–21 (2012).
5. Klein, S. et al. Weight management through lifestyle modification for the prevention and
management of type 2 diabetes: Rationale and strategies. A statement of the American
Diabetes Association, the North American Association for the Study of Obesity, and the
American Society for Clinical Nutrition. American Journal of Clinical Nutrition vol. 80
257–263 (2004).
6. Singh, S., Dulai, P. S., Zarrinpar, A., Ramamoorthy, S. & Sandborn, W. J. Obesity in
IBD: Epidemiology, pathogenesis, disease course and treatment outcomes. Nature
Reviews Gastroenterology and Hepatology vol. 14 110–121 (2017).
7. Goodwin, P. J. & Stambolic, V. Impact of the Obesity Epidemic on Cancer. Annu. Rev.
Med. 66, 281–296 (2015).
8. Duncan, S. H. et al. Human colonic microbiota associated with diet, obesity and weight
loss. Int. J. Obes. 32, 1720–1724 (2008).
72
9. Human Microbiome Project Consortium. Structure, function and diversity of the healthy
human microbiome. Nature 486, 207–214 (2012).
10. Hollister, E. B., Gao, C. & Versalovic, J. Compositional and functional features of the
gastrointestinal microbiome and their effects on human health. Gastroenterology 146,
1449–58 (2014).
11. Cantarel, B. L., Lombard, V. & Henrissat, B. Complex Carbohydrate Utilization by the
Healthy Human Microbiome. PLoS One 7, e28742 (2012).
12. Howe, A. et al. Divergent responses of viral and bacterial communities in the gut
microbiome to dietary disturbances in mice. ISME J. 10, 1217–1227 (2016).
13. Sonnenburg, E. D. et al. Diet-induced extinctions in the gut microbiota compound over
generations. Nature 529, 212–5 (2016).
14. Ul Haq, I., Chaudhry, W. N., Akhtar, M. N., Andleeb, S. & Qadri, I. Bacteriophages and
their implications on future biotechnology: A review. Virology Journal vol. 9 (2012).
15. Hepworth, M. R. et al. Group 3 innate lymphoid cells mediate intestinal selection of
commensal bacteria-specific CD4+ T cells. Science (80-. ). 348, 1031–1035 (2015).
16. Reyes, A., Wu, M., McNulty, N. P., Rohwer, F. L. & Gordon, J. I. Gnotobiotic mouse
model of phage-bacterial host dynamics in the human gut. Proc. Natl. Acad. Sci. U. S. A.
110, 20236–41 (2013).
17. Minot, S. et al. The human gut virome: inter-individual variation and dynamic response
to diet. Genome Res. 21, 1616–25 (2011).
18. FASTX-Toolkit. http://hannonlab.cshl.edu/fastx_toolkit/.

73
19. Bolger, A. M., Lohse, M. & Usadel, B. Trimmomatic: a flexible trimmer for Illumina
sequence data. Bioinformatics 30, 2114–2120 (2014).
20. Meyer, F. et al. The metagenomics RAST server – a public resource for the automatic
phylogenetic and functional analysis of metagenomes. BMC Bioinformatics 9, 386
(2008).
21. International Committee on Taxonomy of Viruses. & King, A. Virus taxonomy : ninth
report of the International Committee on Taxonomy of Viruses. (Elsevier, 2011).
22. R Core Team. R: A language and environment for statistical computing. (2014).
23. Dixon, P. VEGAN, a package of R functions for community ecology. J. Veg. Sci. 14,
927–930 (2003).
24. Pohlert, T. trend: Non-Parametric Trend Tests and Change-Point Detection. R Packag.
version 1.1.0 (2018).
25. Revelle, W. R. psych: Procedures for Personality and Psychological Research. (2017).
26. Kassambara, A. ggcorrplot: Visualization of a correlation matrix using ggplot2.
https://github.com/kassambara/ggcorrplot (2015).
27. Zhu, C. & Yu, J. Nonmetric multidimensional scaling corrects for population structure in
association mapping with different sample types. Genetics 182, 875–88 (2009).
28. Shreiner, A. B., Kao, J. Y. & Young, V. B. The gut microbiome in health and in disease.
Curr. Opin. Gastroenterol. 31, 69–75 (2015).
29. Ziętak, M. et al. Altered Microbiota Contributes to Reduced Diet-Induced Obesity upon
Cold Exposure. Cell Metab. 23, 1216–1223 (2016).

74
30. David, L. A. et al. Diet rapidly and reproducibly alters the human gut microbiome.
Nature 505, (2014).
31. Hargreaves, K. R. & Clokie, M. R. J. A Taxonomic Review of Clostridium difficile
Phages and Proposal of a Novel Genus, "Phimmp04likevirus". Viruses 7,
2534–41 (2015).
32. Lavigne, R. et al. Classification of Myoviridae bacteriophages using protein sequence
similarity. BMC Microbiol. 9, 224 (2009).
33. ACLAME: Phages lifestyle. http://aclame.ulb.ac.be/Classification/Phages/life_style.html.
34. Labrie, S. & Moineau, S. Multiplex PCR for Detection and Identification of Lactococcal
Bacteriophages. Appl. Environ. Microbiol. 66, 987–994 (2000).
35. Blatny, J. M., Godager, L., Lunde, M. & Nes, I. F. Complete genome sequence of the
Lactococcus lactis temperate phage φLC3: comparative analysis of φLC3 and its relatives
in lactococci and streptococci. Virology 318, 231–244 (2004).
36. Samson, J. E. & Moineau, S. Characterization of Lactococcus lactis phage 949 and
comparison with other lactococcal phages. Appl. Environ. Microbiol. 76, 6843–52
(2010).
37. Christiansen, B., Johnsen, M. G., Stenby, E., Vogensen, F. K. & Hammer, K.
Characterization of the lactococcal temperate phage TP901-1 and its site-specific
integration. J. Bacteriol. 176, 1069–76 (1994).
38. Everard, A. et al. Cross-talk between Akkermansia muciniphila and intestinal epithelium
controls diet-induced obesity. Proc. Natl. Acad. Sci. U. S. A. 110, 9066–71 (2013).

75
39. Jovel, J. et al. Characterization of the Gut Microbiome Using 16S or Shotgun
Metagenomics. Front. Microbiol. 7, 459 (2016).
40. Hakkak, R., Korourian, S., Foley, S. L. & Erickson, B. D. Assessment of gut microbiota
populations in lean and obese Zucker rats. PLoS One 12, e0181451 (2017).
41. Backhed, F. et al. The gut microbiota as an environmental factor that regulates fat
storage. Proc. Natl. Acad. Sci. 101, 15718–15723 (2004).
42. Norman, J. M. et al. Disease-specific alterations in the enteric virome in inflammatory
bowel disease. Cell 160, 447–60 (2015).
43. Manrique, P. et al. Healthy human gut phageome. Proc. Natl. Acad. Sci. U. S. A. 113,
10400–10405 (2016).
44. Scanlan, P. D. Bacteria–Bacteriophage Coevolution in the Human Gut: Implications for
Microbial Diversity and Functionality. Trends in Microbiology vol. 25 614–623 (2017).
45. Hsu, B. B. et al. Dynamic Modulation of the Gut Microbiota and Metabolome by
Bacteriophages in a Mouse Model. Cell Host Microbe 25, 803-814.e5 (2019).
46. Hsu, B. B. et al. Dynamic Modulation of the Gut Microbiota and Metabolome by
Bacteriophages in a Mouse Model. Cell Host Microbe 25, 803-814.e5 (2019).
47. Turnbaugh, P. J. et al. An obesity-associated gut microbiome with increased capacity for
energy harvest. Nature 444, 1027–1031 (2006).
48. Ridaura, V. K. et al. Gut microbiota from twins discordant for obesity modulate
metabolism in mice. Science 341, 1241214 (2013).
76
Chapter 3
Longitudinal Bacteriophage:Host Dynamics Following Diet-Induced Disruption of the
Intestinal Microbiome
Abstract
The human microbiome has recently been estimated to contain roughly the same number
of microbial cells as in the adult human body. The intestinal microbiome has the potential to
benefit the host in many ways, such as metabolic cross-feeding and immune system priming,
amongst others. Positive interactions between the host and bacterial symbionts have been linked
to the maintenance and balance of microbial constituents. An imbalance or depletion of
microbial components of the intestinal microbiome, termed dysbiosis, can be detrimental for
both host and symbionts. With this in mind, it is important to determine the factors that influence
composition of the microbiome and how can we use this knowledge to develop treatment for
their manipulation. Here we explore the intestinal bacteriophage dynamics in parallel to their
bacterial host during steady-state (chow) and following high-fat western diet (WD) feeding. To
do this, microbial abundance estimates from microbiome samples of chow- and WD-fed mice
were used in various statistical analyses to better define bacteriophage:host relationships during
diet-induced variation. We found that WD feeding restructured the network community structure
within the gut, with bacteriophage contributing more to overall community structure as
compared to a chow diet. Furthermore, we found evidence that in many cases, bacteriophage
shared similar abundance patterns to that of the host, regardless of diet. However, bacteriophage
did not always follow the abundance patterns of their bacterial host. These findings suggest that
bacteriophage can respond to environmental stimuli, such as host bacterial blooms, that allow for
77
some stability during steady-state conditions. These dynamics can potentially have consequences
for the intestinal microbiome during dysbiosis and can predispose the mammalian host to
disease.

78
Introduction
The human microbiome has recently been estimated to contain roughly the same number
of cells as the adult human body, with an estimated 1014 in the colon alone 1. The intestinal
microbiome has the potential to benefit the host in many ways, such as metabolic cross-feeding
and immune system priming, amongst others. Positive interactions between the mammalian host
and bacterial symbionts has been linked to the maintenance and balance of microbial constituents
as well as overall health of the host 2–4. An imbalance or depletion of microbial components of
the intestinal microbiome, termed dysbiosis, can be detrimental for both host and symbionts.
Poor nutrient utilization, gastrointestinal disease, as well as disorders with the liver, heart, and
neurological system have been linked to microbiome dysbiosis 5–9. With this is mind, it is
important to determine the factors that influence composition of the microbiome and determine
how we can use this knowledge to develop treatments for their manipulation.
Regardless of the microbial environment, one of the most influential forces on microbial
composition is the variety and amount of nutrients available. This is especially true of the
intestinal environment. The intestinal microbiome composition typically reflects microbial
organisms whose metabolic capabilities enhance utilization of the types of nutrients ingested by
the host. For example, diets high in plant polysaccharides promote a colonic microbiome profile
that is dominated by the class Bacteroides and Clostridia which specialize in digestion of these
nutrients 10. In contrast, Bacteroides and Clostridia have been reported as being reduced in
relative abundance in the high-fat western diet (WD), as this diet is seen to support the growth of
the class, Bacilli 11. Furthermore, the microbiome associated with the low-fat, plant
polysaccharide rich diet is enriched for pathways including N-glycan degradation, sphingolipid
metabolism and glycosaminoglycan degradation 11. Alternatively, gut microbiome following 1

79
day of western diet feeding revealed obvious shifts in the gene composition with enrichment of
ATP-binding cassette transporters and phosphotransferase systems 5,11. Maintaining microbial
balance is of the upmost importance in optimal metabolic function and efficiency in the intestinal
microbiome. Conversely, certain assemblages of bacteria have been linked to metabolic disorder.
For example, WD-induced microbiome profiles have been reported to promote increased energy
harvest from luminal content, induce production of adipocytes, and induce or exacerbate the
obesogenic state of the host 5,12,13. Studies evaluating diet on microbial composition have
revealed a lot about bacterial dynamics in the intestinal microbiome. However, other microbial
populations in the microbiome, such as bacteriophage, have been underrepresented in the
literature and may hold insight into community structure in the intestinal microbial environment.
Bacteriophage are prokaryotic viruses that are among the most abundant members of the
virome (viral component of the microbiome), yet, they are among the least understood 14.
Bacteriophage can infect specific host bacteria and replicate through a lytic or lysogenic program
depending on their lifestyle 15. Much remains to be determined about behavior of bacteriophage
in microbial ecosystems, namely the intestinal microbiome. Investigating cause-and-effect
relationships of bacteriophage and their bacterial host is extremely challenging due to incomplete
bacteriophage annotation databases. Understanding the behavior of bacteriophages in the
intestinal tract may have the potential to provide insights to the intestinal microenvironment
during homeostasis and in times of dysbiosis. Recent interest in the phageome, the bacteriophage
component of the intestinal microbiome, has allowed researchers to illuminate an association
between elevated bacteriophage abundance and disease 16. Understanding the behavior of
bacteriophage in the intestinal microbiome may provide insights to microbial differences during
dysbiosis and bring about therapeutic treatments to modulate the microbiome.
80
Although bacteriophage are thought to be antagonistic to bacteria, they have displayed
more variability in their behavior as members of the intestinal microbiome. For example,
Manrique, et al. have described the core intestinal phageome that is shared among more than
one-half of all participants in the study 17. However, the same study described disruption of this
core phageome in patients with Chron’s disease and Ulcerative Colitis 17. Recent studies in
dietary influences on viral community structure reported that individuals on the same diet had
similar intestinal viral communities 18. Most of the variation seen in the phageome has been
attributed to bacteriophage reacting to host bacterial abundance patterns. In contrast, Hsu, et al.
report bacteriophage can coexist over time with targeted bacteria in the intestinal environment,
but their predation can induce cascading effects on microbial composition and, consequently, the
gut metabolome 19. This study addresses how bacteriophages impact bacterial communities in the
intestinal microbiome of gnotobiotic mice. However, there is still more to be understood about
bacteriophage dynamics in response to stimuli and if this is only due to host bacteria persistence
in a natural model.
In this study, we monitored intestinal bacteriophage abundance following introduction of
a high-fat western diet (WD) in parallel to their bacterial hosts. To do this, we administered the
WD over the course of 72 days. Fecal samples were subjected to high throughput sequencing in
order to quantify abundance of bacteriophage and their host. We found that WD feeding
restructured community relationships within the gut, with bacteriophage contributing more to
overall community structure as compared to a chow diet. Furthermore, we determined that in
many cases, bacteriophage shared similar abundance patterns to that of the host, regardless of
diet. However, bacteriophage did not always follow the abundance patterns of their bacterial
host. In some instances, we describe the reduction of bacteria and an inverse bloom of

81
bacteriophage in WD-fed mice which may be due to the bacteriophage predator-prey
relationship. Alternatively, certain bacteriophage genera displayed unique abundance patterns
following WD feeding, not only from host, but also from bacteriophage who target the same
host. These findings suggest that bacteriophage have the potential to respond to stimuli, such as
diet, independently of their host.
Methods
Animals and Diets
Male C57BL/6J mice from Jackson Laboratories (Bar Harbor, ME) were singly housed in
standard microisolator cages at the Veterinary Research Building, College of Veterinary
Medicine, Auburn University. The room was maintained at an ambient temperature of 22°C ±
2°C on a 12:12 light:dark cycle with zeitgeber time (ZT) 0 representing lights on and ZT12
representing lights off. All experimental procedures were approved by the Auburn University
Animal Care and Use Committee. Animals were fed standard rodent chow for 1-week during
acclimation to the facility. After which, animals were split into groups receiving either
the standard chow diet with tap water (Chow) or a High-Fat Western Diet with tap water
(WD). The chow diet (Teklad Global Rodent Diet 2018) contained 24% of calories from protein,
18% from fat, and 58% from carbohydrate. The WD diet was based on the AIN-93G diet and
consisted of 44% carbohydrate, 16% protein, and 40% fat, 30% of which was provided from
lard, 30% from butterfat, 30% from Crisco, 7% from soybean oil and 3% from corn oil. All
dietary groups were given food and water ad libitum.
Collection of fecal matter was performed at the initiation of diet change (Day 0) as well
at four other time points following WD feeding: 2 days, 2-, 8-, and 12-weeks. Animals were

82
removed from their home cages and placed in sterile microisolator cages without bedding for 3
hours. Food and water were provided to the animals during this time. Mice were then returned to
resident cages and feces were collected from the sterile cages for DNA extraction and shotgun
metagenomic sequencing.
Shotgun metagenomic sequencing-based Microbiome Profiling
Intestinal microbial abundance was obtained from the Sugar_study_2015_Trimmed
project on the MG-RAST repository (https://www.mg-
rast.org/mgmain.html?mgpage=project&project=mgp81921). Materials and methods of this
study are outlined in Chapter 2. To assess species-level bacteriophage dynamics, raw sequences
from this study were aligned to annotated bacteriophage sequences and compared to the putative
host genera. First, annotated fasta sequences were downloaded from the
Sugar_study_2015_Trimmed project on the MG-RAST repository for each treatment sample at
each timepoint. These sequences were filtered in order to create a database of Caudovirales
sequences that were members of bacteriophage genera utilized in the k-mean analysis. The
BWA-MEM algorithm was used to align raw reads of WD and Chow microbiome samples to the
corresponding bacteriophage database 20. Unmapped reads were removed using SAMtools 21 and
mapped read hits were quantified. Bacteriophage database hit counts were normalized and
converted to log2-fold change.
Microbiome statistical analysis
Interactions depicted within the co-occurrence networks were generated in R using
SparCC within the SPIEC-EASI package 22. SparCC calculates correlations values between

83
OTUs while accounting for sparse or missing data 22. SparCC correlation values greater |0.3|
were visualized in a network using igraph package 23. Only nodes with at least 1 interaction that
met the cutoff were included in the networks. Communities were detected using the multilevel
community detection method within the igraph package.
Time-series log2-fold change was calculated from normalized microbial abundance hits
from all bacteriophage genera and top 55 most abundant bacterial families at each time point. K-
mean cluster analysis of the log2-fold change was generated using the Short Time-series
Expression Miner (STEM) 24 with the parameters of 8 clusters and 25 random repeats. OTUs that
did not display significant abundance changes over the course of the experiment were not able to
be analyzed by STEM and were not included in the analysis. Two microbial taxa were not seen
to match any other clusters from the chow samples which formed two clusters containing one
cluster each. These two clusters were removed from this analysis.
Results
Microbiome Community Structure is Altered by the Western Diet
Before dissecting specific relationships between bacteriophage and their hosts, we
wanted to determine how components of the gut microbiota interacted with each other in
response to diet exposure. SparCC correlation coefficients were calculated for the top 55 most
abundant bacterial families and all bacteriophage genera in each group. High-confidence
coefficients were then plotted as a network to visually represent relationships. The chow network
contained 3 communities that were parsed based on the multilevel cluster detection method.
Based on this clustering method, the chow samples displayed a low modularity of 0.18.
Specifically, 2 large communities were detected, containing multiple nodes that displayed a high

84
degree of connectivity, with a large majority of the nodes representing bacterial OTUs. Nodes
with the highest degree of connectivity belong are representative of symbionts typically found in
a healthy microbiota. These include Bacteroidaceae, Clostridaceae, Prevotellaceae,
Enterococcaceae, Ruminococcaceae, amongst others. On the other hand, most nodes representing
bacteriophage genera displayed a low degree of connectivity, pointing to bacteria contributing
more to the overall community structure as compared to bacteriophage within the chow samples.
Similar to the chow samples, the WD samples contained 3 communities. However, the
WD samples displayed a slightly higher degree of modularity of 0.20. Most notably, nodes
representative of bacteriophage genera seemed to display a higher degree of connectivity, and
overall contribute more to the community structure within the WD samples. For example, TP21-,
phiFL-, phiETA-, and P335-like viruses displayed a high degree of connectivity within their
communities. Some of these relationships are to be expected; for example, TP21-like viruses are
temperate target bacteria within the family Enterococcaceae 25. Nodes representing these bacteria
and bacteriophage plot within the same community and share a similar degree of connectivity.
Similarly, virulent bacteriophage genera are contained within the same community as their host
bacterial family. This is exemplified in P335-like viruses and their relationship with the family
Streptococcaceae, as well as phiETA-like viruses and the family Staphylococcaceae. On the other
hand, some bacteriophage genera did not belong to the same community as their host. This was
exemplified through 1706- and Sfi21-like viruses and the family Streptococcaceae. In conclusion,
bacteriophage seem to contribute more to overall community structure within the WD samples.
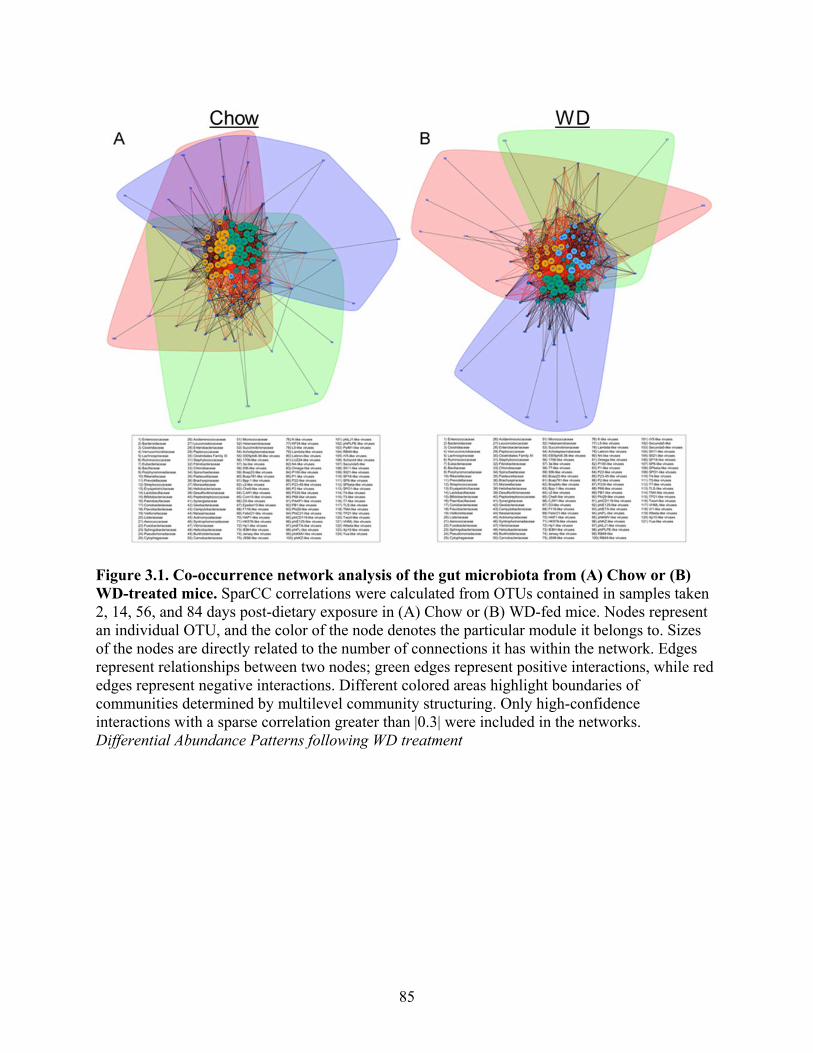
85
Figure 3.1. Co-occurrence network analysis of the gut microbiota from (A) Chow or (B) WD-treated mice. SparCC correlations were calculated from OTUs contained in samples taken 2, 14, 56, and 84 days post-dietary exposure in (A) Chow or (B) WD-fed mice. Nodes represent an individual OTU, and the color of the node denotes the particular module it belongs to. Sizes of the nodes are directly related to the number of connections it has within the network. Edges represent relationships between two nodes; green edges represent positive interactions, while red edges represent negative interactions. Different colored areas highlight boundaries of communities determined by multilevel community structuring. Only high-confidence interactions with a sparse correlation greater than |0.3| were included in the networks. Differential Abundance Patterns following WD treatment
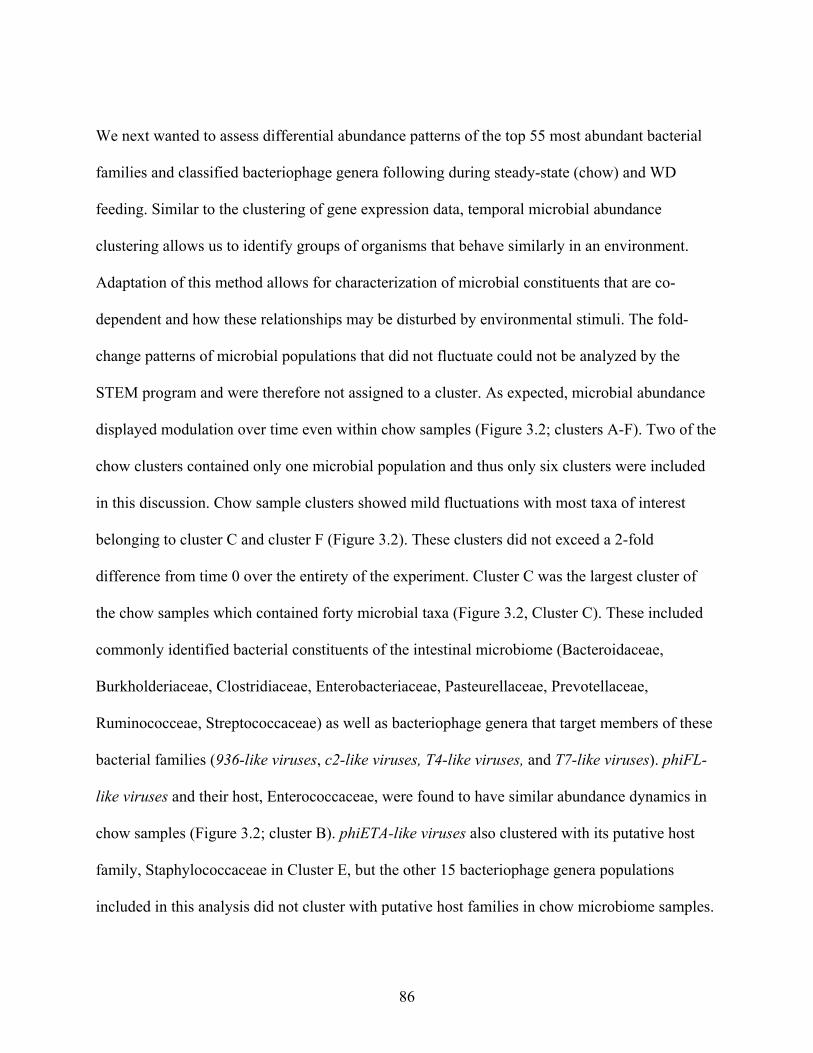
86
We next wanted to assess differential abundance patterns of the top 55 most abundant bacterial
families and classified bacteriophage genera following during steady-state (chow) and WD
feeding. Similar to the clustering of gene expression data, temporal microbial abundance
clustering allows us to identify groups of organisms that behave similarly in an environment.
Adaptation of this method allows for characterization of microbial constituents that are co-
dependent and how these relationships may be disturbed by environmental stimuli. The fold-
change patterns of microbial populations that did not fluctuate could not be analyzed by the
STEM program and were therefore not assigned to a cluster. As expected, microbial abundance
displayed modulation over time even within chow samples (Figure 3.2; clusters A-F). Two of the
chow clusters contained only one microbial population and thus only six clusters were included
in this discussion. Chow sample clusters showed mild fluctuations with most taxa of interest
belonging to cluster C and cluster F (Figure 3.2). These clusters did not exceed a 2-fold
difference from time 0 over the entirety of the experiment. Cluster C was the largest cluster of
the chow samples which contained forty microbial taxa (Figure 3.2, Cluster C). These included
commonly identified bacterial constituents of the intestinal microbiome (Bacteroidaceae,
Burkholderiaceae, Clostridiaceae, Enterobacteriaceae, Pasteurellaceae, Prevotellaceae,
Ruminococceae, Streptococcaceae) as well as bacteriophage genera that target members of these
bacterial families (936-like viruses, c2-like viruses, T4-like viruses, and T7-like viruses). phiFL-
like viruses and their host, Enterococcaceae, were found to have similar abundance dynamics in
chow samples (Figure 3.2; cluster B). phiETA-like viruses also clustered with its putative host
family, Staphylococcaceae in Cluster E, but the other 15 bacteriophage genera populations
included in this analysis did not cluster with putative host families in chow microbiome samples.

87
Figure 3.2. K-mean clustering of bacteria and bacteriophage differential abundance
patterns following WD exposure. K-mean clusters of all bacteriophage genera and top 55 most
abundant bacterial families in Chow or Western diet (WD) fed mice. Microbial taxa cluster of
Chow diet are depicted in clusters A-F. WD microbial taxa clusters are shown in clusters G-N.
Each colored line represents a different microbial taxa log2-fold change pattern. Differential
log2-fold change and cluster designation is outlined in Table 2.

88
In conclusion, a majority of dominant taxa within the intestinal microbiota underwent only minor
alterations in abundance over time when maintained on a consistent diet. During steady-state
conditions, bacteriophage also experience marginal alteration, but their abundance patterns do
not always statistically match that of the host.
In contrast to chow samples, WD samples displayed more organisms belonging to
clusters that underwent significant and dynamic fluctuations (Figure 3.2; clusters G-N). For
example, five taxa within chow samples displayed overt changes, 3-fold change or greater
(Figure 32.; clusters A-F). In contrast, twelve taxa within WD samples exhibited an overt change
in abundance (Figure 3.2; clusters G-N). Cluster J displayed similar dynamics to cluster C of the
chow samples, but only contained 17 microbial taxa. Both cluster J and C contain
Burkholderiaceae and Ruminococcaceae. Unlike cluster C of chow samples, cluster J of WD
samples did not contain any bacteriophage genera as many of the bacteriophage studied
displayed a greater magnitude of change following WD feeding. For example, Enterococcaceae
and targeting bacteriophage genera, phiFL-like viruses, abundance dynamics still matched as
they were both found in cluster L of WD samples, yet their abundance patterns were far different
from that seen in chow samples (Figure 3.2; cluster B). Similarly, 936-like viruses and
Streptococcaceae were still found to cluster together although they both benefit from rapid
blooms following WD feeding (Figure 3.2; cluster N). P335-like viruses target Streptococcaceae
and were also found in cluster N with their host in WD samples, although this was not the case in
chow samples. In conclusion, microbial communities experience more dynamic changes
following alteration to environmental stimuli, such as nutrient availability. Following WD-
feeding, less bacteriophage communities are statistically synchronous with host abundance
pattern, but many appeared to share a similar overall abundance trend.

89
Table 3.1: Log2 Fold Change and K-mean Clusters Data not shown for organisms that remain consistent throughout the experiment
TREATMENT AVERAGE LOG2 FOLD CHANGE K-MEAN CLUSTER
2D 14D 56D 84D
1706-LIKE VIRUSES CO 1.5 0.59 -0.24 1.95 5 WD -0.94 -2.48 -1.62 0.7 0
936-LIKE VIRUSES CO -0.77 -0.36 -0.51 1.03 2 WD 3.53 4.19 3.09 5.26 7
ACHOLEPLASMATACEAE CO 0.23 -0.04 0.97 1.56 5 WD -1.02 -1.69 -0.98 -0.17 0
ACIDAMINOCOCCACEAE CO 0.29 -0.18 -0.46 1.09 2 WD -0.25 -0.64 -0.54 0.56 1
ACTINOMYCETACEAE CO 0.19 0.1 0.07 1.34 2 WD -0.16 -0.27 -0.23 0.84 3
AEROCOCCACEAE CO 0.46 -0.15 -0.12 1.42 2 WD -0.23 -0.55 -0.71 1.04 1
BACILLACEAE CO 0.07 -0.02 1.36 3.81 1 WD 0.1 0.15 1.7 5.75 5
BACTEROIDACEAE CO -0.46 -0.1 -0.23 0.9 2 WD 0.33 0.29 0.77 1.2 6
BIFIDOBACTERIACEAE CO 0.05 -0.16 0.91 1.84 5 WD 1.8 1.59 0.64 0.86 6
BPP-1-LIKE VIRUSES CO
NA WD -1.1 1.26 1.7 2.23 2
BRACHYSPIRACEAE CO 0.07 -0.32 -0.43 1.2 2 WD 0.24 0.32 -0.32 0.71 3
BURKHOLDERIACEAE CO -0.38 -0.5 -0.94 0.85 2 WD -0.08 -0.31 -0.41 1.27 3
C2-LIKE VIRUSES CO -0.29 0.46 0.4 -0.55 2 WD
NA
CAMPYLOBACTERACEAE CO -0.01 0.17 0.01 1.48 2 WD 0.14 0.27 0.16 1.4 3
CARDIOBACTERIACEAE CO 0.61 0.54 0.21 2.06 5 WD -0.42 -0.03 -0.78 1.38 3
CHE8-LIKE VIRUSES CO 0.33 -0.15 0.98 1.52 5 WD -1.87 -3.63 -1.19 -3.58 0
CHLOROBIACEAE CO -0.7 -0.32 -0.32 0.99 2 WD 0.45 0.55 0.84 1.59 6
CLOSTRIDIACEAE CO 0.23 -0.18 -0.23 1.19 2 WD -0.11 -0.18 -0.5 0.8 1
CLOSTRIDIALES FAMILY XI CO 0.35 0.15 0.1 1.54 5 WD 0 -0.19 -0.12 0.85 3
CORIOBACTERIACEAE CO 0.19 -0.19 0.82 1.33 5 WD 0.33 0.3 0.83 1.78 6
CYTOPHAGACEAE CO -1.16 -0.43 -0.44 0.79 2 WD 0.43 0.33 0.87 1.51 6
DESULFOVIBRIONACEAE CO -0.09 -0.37 -0.31 1.24 2 WD 0.05 -0.07 -0.04 1.19 3
ENTEROBACTERIACEAE CO -0.21 0.01 -0.51 0.7 2 WD 0.12 0.17 0.15 1.75 3
ENTEROCOCCACEAE CO 0.64 -0.13 1.3 4.57 1 WD -0.22 -0.07 1.16 7.98 5
ERYSIPELOTRICHACEAE CO 0.23 -0.02 0.32 1.41 5 WD 0.68 0.56 0.14 1.12 6
EUBACTERIACEAE CO 0.24 -0.26 -0.2 1.15 2 WD -0.14 -0.15 -0.46 0.71 1
FIBROBACTERACEAE CO -0.19 -0.21 -0.42 0.88 2 WD
NA
FLAVOBACTERIACEAE CO -0.95 -0.29 -0.39 0.88 2 WD 0.51 0.71 1.2 1.69 6
FUSOBACTERIACEAE CO 0.04 -0.18 -0.27 1.21 2 WD 0.28 0.04 0.03 1.21 3
GEOBACTERACEAE CO -0.2 -0.2 -0.05 1.3 2 WD 0.44 0.56 0.36 1.5 6
HALANAEROBIACEAE CO -0.08 0.23 -0.03 1.41 2 WD -0.07 -0.25 -0.02 1.13 3
HELICOBACTERACEAE CO 0.25 0.02 -0.39 1.35 2 WD -0.24 -1.13 -1.47 1.41 1
L5-LIKE VIRUSES CO 0.08 -0.01 -0.15 1.09 2 WD -0.99 -1.52 -1.52 -2.14 0
LACHNOSPIRACEAE CO 0.22 -0.23 -0.21 1.15 2 WD -0.08 -0.04 -0.43 0.84 3
LACTOBACILLACEAE CO 1.18 -0.27 1.12 0.99 5 WD 3.68 2.57 1.82 3.41 7
LAMBDA-LIKE VIRUSES CO 1.18 -1.02 -2.19 0.73 3 WD 1.07 -0.78 1.88 2.14 2
LEUCONOSTOCACEAE CO -0.13 0.04 1.05 3.28 1 WD 1.6 3.21 2.84 5.22 7
LISTERIACEAE CO 0.17 -0.11 0.09 2.14 4 WD 0.88 1.95 1.13 4.1 5
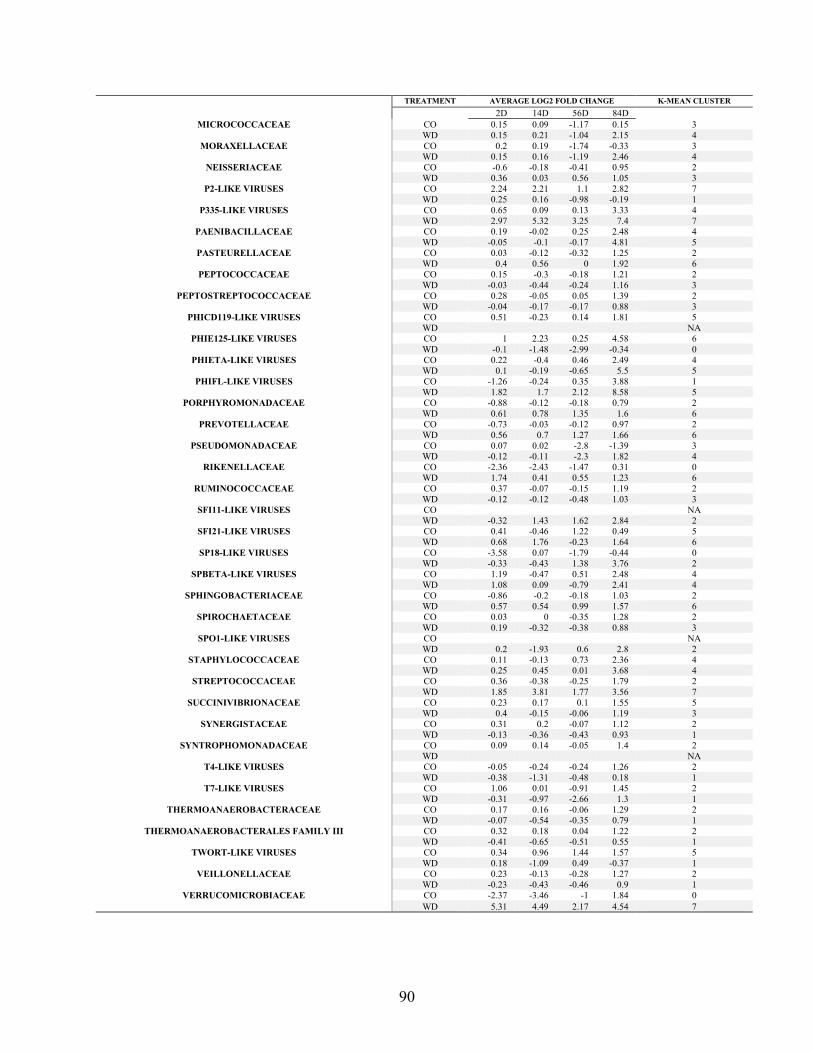
90
TREATMENT AVERAGE LOG2 FOLD CHANGE K-MEAN CLUSTER 2D 14D 56D 84D
MICROCOCCACEAE CO 0.15 0.09 -1.17 0.15 3 WD 0.15 0.21 -1.04 2.15 4
MORAXELLACEAE CO 0.2 0.19 -1.74 -0.33 3 WD 0.15 0.16 -1.19 2.46 4
NEISSERIACEAE CO -0.6 -0.18 -0.41 0.95 2 WD 0.36 0.03 0.56 1.05 3
P2-LIKE VIRUSES CO 2.24 2.21 1.1 2.82 7 WD 0.25 0.16 -0.98 -0.19 1
P335-LIKE VIRUSES CO 0.65 0.09 0.13 3.33 4 WD 2.97 5.32 3.25 7.4 7
PAENIBACILLACEAE CO 0.19 -0.02 0.25 2.48 4 WD -0.05 -0.1 -0.17 4.81 5
PASTEURELLACEAE CO 0.03 -0.12 -0.32 1.25 2 WD 0.4 0.56 0 1.92 6
PEPTOCOCCACEAE CO 0.15 -0.3 -0.18 1.21 2 WD -0.03 -0.44 -0.24 1.16 3
PEPTOSTREPTOCOCCACEAE CO 0.28 -0.05 0.05 1.39 2 WD -0.04 -0.17 -0.17 0.88 3
PHICD119-LIKE VIRUSES CO 0.51 -0.23 0.14 1.81 5 WD
NA
PHIE125-LIKE VIRUSES CO 1 2.23 0.25 4.58 6 WD -0.1 -1.48 -2.99 -0.34 0
PHIETA-LIKE VIRUSES CO 0.22 -0.4 0.46 2.49 4 WD 0.1 -0.19 -0.65 5.5 5
PHIFL-LIKE VIRUSES CO -1.26 -0.24 0.35 3.88 1 WD 1.82 1.7 2.12 8.58 5
PORPHYROMONADACEAE CO -0.88 -0.12 -0.18 0.79 2 WD 0.61 0.78 1.35 1.6 6
PREVOTELLACEAE CO -0.73 -0.03 -0.12 0.97 2 WD 0.56 0.7 1.27 1.66 6
PSEUDOMONADACEAE CO 0.07 0.02 -2.8 -1.39 3 WD -0.12 -0.11 -2.3 1.82 4
RIKENELLACEAE CO -2.36 -2.43 -1.47 0.31 0 WD 1.74 0.41 0.55 1.23 6
RUMINOCOCCACEAE CO 0.37 -0.07 -0.15 1.19 2 WD -0.12 -0.12 -0.48 1.03 3
SFI11-LIKE VIRUSES CO
NA WD -0.32 1.43 1.62 2.84 2
SFI21-LIKE VIRUSES CO 0.41 -0.46 1.22 0.49 5 WD 0.68 1.76 -0.23 1.64 6
SP18-LIKE VIRUSES CO -3.58 0.07 -1.79 -0.44 0 WD -0.33 -0.43 1.38 3.76 2
SPBETA-LIKE VIRUSES CO 1.19 -0.47 0.51 2.48 4 WD 1.08 0.09 -0.79 2.41 4
SPHINGOBACTERIACEAE CO -0.86 -0.2 -0.18 1.03 2 WD 0.57 0.54 0.99 1.57 6
SPIROCHAETACEAE CO 0.03 0 -0.35 1.28 2 WD 0.19 -0.32 -0.38 0.88 3
SPO1-LIKE VIRUSES CO
NA WD 0.2 -1.93 0.6 2.8 2
STAPHYLOCOCCACEAE CO 0.11 -0.13 0.73 2.36 4 WD 0.25 0.45 0.01 3.68 4
STREPTOCOCCACEAE CO 0.36 -0.38 -0.25 1.79 2 WD 1.85 3.81 1.77 3.56 7
SUCCINIVIBRIONACEAE CO 0.23 0.17 0.1 1.55 5 WD 0.4 -0.15 -0.06 1.19 3
SYNERGISTACEAE CO 0.31 0.2 -0.07 1.12 2 WD -0.13 -0.36 -0.43 0.93 1
SYNTROPHOMONADACEAE CO 0.09 0.14 -0.05 1.4 2 WD
NA
T4-LIKE VIRUSES CO -0.05 -0.24 -0.24 1.26 2 WD -0.38 -1.31 -0.48 0.18 1
T7-LIKE VIRUSES CO 1.06 0.01 -0.91 1.45 2 WD -0.31 -0.97 -2.66 1.3 1
THERMOANAEROBACTERACEAE CO 0.17 0.16 -0.06 1.29 2 WD -0.07 -0.54 -0.35 0.79 1
THERMOANAEROBACTERALES FAMILY III CO 0.32 0.18 0.04 1.22 2 WD -0.41 -0.65 -0.51 0.55 1
TWORT-LIKE VIRUSES CO 0.34 0.96 1.44 1.57 5 WD 0.18 -1.09 0.49 -0.37 1
VEILLONELLACEAE CO 0.23 -0.13 -0.28 1.27 2 WD -0.23 -0.43 -0.46 0.9 1
VERRUCOMICROBIACEAE CO -2.37 -3.46 -1 1.84 0 WD 5.31 4.49 2.17 4.54 7

91
Bacteria:Bacteriophage time-series dynamics are not always synchronous
We sought to compare the temporal differential abundance of host bacterial family and
the bacteriophage genera that target them following WD administration. As previously
mentioned, similar abundance patterns are exhibited by many of the bacteria:bacteriophage
relationships regardless of designated lifestyle (Figure 3.3). This is especially true for families
Bacillaceae, Enterococcaceae, and Staphylococcaceae where bacteriophage that target them
tended to follow the abundance pattern of their host regardless of diet. Likely, SPbeta-, phiFL-
and phiETA-like viruses abundance patterns are directly related to host abundance as they are
classified as temperate and could be present as prophage. SPO1-like viruses, on the other hand, is
classified as virulent and likely increases in abundance as Bacillaceae increases consistent with a
“kill-the-winner” pattern 26. In the classic predator-prey model of kill-the-winner, fast-growing
bacteria are infected by virulent bacteriophage that benefit from the bloom of their bacterial host
26,27. In this way, lytic bacteriophage are thought to play a role in bacterial community control
and structure.
Surprisingly, some bacteriophage acted in a different manner than that of their bacterial
host family. Bacterial families Enterbacteriaceae and Burkholderiaceae showed minimal change
in abundance over the course of the experiment regardless of diet. However, many of the
bacteriophage that target these families displayed a decline in abundance following
administration of the WD, namely CHE8-, T7- and phiE125-like viruses (Figure 3.3).
Burkholderiaceae-targeting phiE125-like viruses were classified as temperate but exhibited a 3-
fold decrease in abundance after 56 days on the WD. This was followed by a return to initial
levels in line with a slight increase in abundance of its host. Thus, this was a predictable pattern,
as host population abundance increases, the bacteriophage abundance would also increase.

92
Figure 3.3. Temporal bacteriophage
genus dynamics in perspective of
putative host family’s abundance
following WD exposure. K-mean data
was reconstructed to show mean log2-
fold change of bacterial host families
(Bacillaceae, Burkholderiaceae,
Enterobacteriaceae, Enterococcaceae,
Staphylococcaceae Streptococcaceae)
and bacteriophage genera that target
them in Chow or Western diet (WD)
microbiome samples. Figures on the left
show bacterial families and
bacteriophage genera abundance
dynamics from Chow microbiome
samples over time. Figures on the right
side are the matching
bacteria:bacteriophage relationship
follow WD feeding. Dotted lines
represent the bacterial host family and
solid, colored lines represent different
bacteriophage genera that target the
designated bacterial host family.
Putative host family and lifestyle
characterization is outlined in Table 1.
Differential log2-fold change and
cluster designation is outlined in Table
2.

93
The dynamics of Streptococcaceae and related bacteriophage genera are not as
predictable as those previously discussed. The Streptococcaceae and targeting bacteriophage
genera had similar abundance patterns overtime in the chow samples (Figure 3.3). Following
administration of the WD, larger fluctuations in abundance were observed for Streptococcaceae
and the bacteriophage genera who target them (Figure 3.3). Namely, virulent bacteriophage
genera 1706- and P335-like viruses did not reach above a 1-fold difference until 84 days in chow
samples indicating a relatively stable abundance profile (Figure 3.3). In WD-treated animals,
abundance patterns for 1706- and P335-like viruses began to diverge 2 days following dietary
exposure regardless of shared host and lifestyle. 1706-like viruses decreased 4-fold by 14 days in
treatment groups before beginning to recover to base levels by 84 days (Figure 3.3). P335-like
viruses’ abundance profile for WD-treated mice quickly rose 5-fold by 14 days. It was reduced
3-fold at 56 days but recovered by 84 days to above a 5-fold increase as compared to time 0
(Figure 3.3). This fold change progression is similar to that of its host, Streptococcaceae. This is
likely due to two factors: 1) “kill-the-winner” dynamics of virulent bacteriophage species that
comprised approximately half of the P335-like viruses abundance and 2) potential lysogenic
bacteriophage present as prophage in host genomes. Interestingly, dissimilar abundance patterns
were observed for Streptococcaceae-targeting bacteriophage genera 1706- and Sfi21-like viruses
following dietary exposure which indicates either an antagonistic relationship with their host or
that these viruses were negatively affected by bacterial host response to the WD. In summary,
bacteriophage do not always fluctuate in the same manner as their putative host following diet
change, indicating that bacteriophage population can be affected by diet change independently of
their host.

94
Diversity in abundance modulation among enteric bacteriophage species following WD feeding
We quantified log fold-change in bacteriophage species abundance over time in WD and
Chow microbiome samples in an attempt to better define individual bacteriophage species
dynamics following WD feeding. Temperate bacteriophage (designated by black titles; Figure
3.4) typically followed the same abundance patterns of their host (represented by dashed lines;
Figure 3.4) regardless of dietary conditions (Chow in blue, WD in red; Figure 3.4). Most of the
bacteriophage species followed similar abundance modulation throughout the experiment
regardless of diet, which agrees with findings previously discussed. For example, Staphylococcus
phage Sfi19, Burkholderia phage phiE202 and phi1026b experienced synchronous abundance
patterns in both dietary conditions. This could be due to the low variability in bacterial host
abundance over the course of the experiment. Interestingly, Lactococcus and Staphylococcus
also experienced relatively low variability in Chow-fed samples, yet, Lactococcus phage
Tuc2009 of P335-like viruses and Staphylococcus phage EW of phiETA-like viruses under these
conditions underwent a large bloom at the final time point, following a slight elevation in host
bacterial abundance. This confirms reports of the bacteriophage genera and their host dynamics
previously discussed (Figure 3.3 and 3.4). Lactococcus phage Tuc2009 exhibited a 10-fold
increase from initial abundance levels, and Staphylococcus phage EW displayed an 8-fold
increase at the final timepoint following a slight increase of host bacteria (< 2-fold increase on
average). Under WD conditions, Lactococcus phage Tuc2009 showed a significant bloom (6-
fold increase) that exceeded that of its host (3-fold increase) as early as 2 days following WD
feeding (Figure 3.4). This was even more distinct for WD samples at 84 days, where
Lactococcus phage Tuc2009 experienced an abundance increase 12-fold greater than the initial
levels and Lactococcus displayed 4-fold increase at the same timepoint. Taken together,

95
Figure 3.4. Differential log2-fold change patterns of bacteriophage species and their
putative host following WD feeding. Differential log2-fold change of bacteriophage species
following WD feeding in perspective of their bacterial host genera. Solid lines represent the
bacteriophage species while dashed lines represent host bacterial genera. WD (red) and Chow
diet (blue) are depicted within one figure for each bacteriophage species:bacterial host pair.
Bacteriophage species with green lettering are identified as virulent bacteriophage and those in
black are described as temperate bacteriophage.
96
temperate bacteriophage typically followed the abundance patterns of the bacterial host genera
regardless of diet. However, temperate bacteriophage did show examples of significant blooms
even following seemingly low abundance increases of the host.
Virulent bacteriophage (designated by red titles; Figure 3.4) dynamics were much more
variable than previous models have described. Classic models of virulent bacteriophage in
microbial communities, namely the kill-the-winner model, describe how any bacteria increasing
beyond a certain threshold in abundance will trigger a positive net production of bacteriophage,
based on viral host-specificity 26. Virulent bacteriophage species in our study followed this
model, and this was exemplified in the bacteriophage:host relationships of Lactococcus phage
P335, Lactococcus phage phiLC3, Lactococcus phage ul36, Streptococcus phage SMP,
Streptococcus phage SMP and Streptococcus phage Abc2, especially in WD samples. In Chow
samples, these bacteriophage species showed some decline in abundance, but recovered to or
exceed that of initial levels with an increase in host genera populations. WD samples showed
rapid elevation in abundance of these bacteriophage species following WD feeding, even with
minimal abundance changes of the host genera. Bacteriophage species responses were not
uniform, even among members of the same bacteriophage genera. For example, Lactococcus
phage P335, phiLC3 and ul36 are all members of P335-like viruses. Lactococcus phage phiLC3
and ul36 experienced rapid and significant blooms (12-fold and 14-fold increase by day 2) in
WD samples and remained elevated throughout the duration of the experiment. Although
Lactococcus phage P335 did exhibit an early bloom in WD samples (8-fold increase by 14 days),
this bacteriophage species did not reach equivalent elevation in log fold change patterns as other
members of P335-like viruses. Dissimilarity between Streptococcus phage SMP and Abc2 were
also observed in WD samples, even with low variation of bacterial host genera. Of interest, we

97
did see virulent bacteriophage that did not follow classic models of lytic behavior. Lactococcus
phage 1706 revealed similar abundance fluctuations to that of the host in Chow samples but had
contrasting dynamics in WD samples. Lactococcus phage 1706 experience a 3-fold decline in
abundance when their host Lactococcus reached a 5-fold increase in abundance. By the final
time point, we did see a net positive abundance increase in this bacteriophage species. Similarly,
Staphylococcus phage Twort had an early decline in abundance even when Staphylococcus
experiences elevations in abundance at the final timepoint. Virulent bacteriophage tended to
follow the kill-the-winner model, but we report that they do not always act according to this
model of behavior in a dynamic microbial community.
Discussion
In this study, we demonstrated that bacteriophage communities are sensitive to WD feeding.
The community network revealed that bacteriophage genera play integral roles in the
microbiome samples of WD-fed mice. The bacteriophage genera in the WD sample networks
also displayed a higher degree of connectivity, indicating they impact many more bacterial
families than those they target as hosts. Clustering strategies also highlighted the dynamic nature
of both bacteriophage genera and bacterial families following WD feeding. Overall, abundance
of bacterial families and bacteriophage genera did not greatly vary from baseline levels in control
samples and bacteria: bacteriophage dynamics were mostly synchronous. Within WD samples,
many temperate bacteriophages followed the abundance patterns of their putative host family
following WD feeding. However, virulent bacteriophage behavior was not as predictable. Some
Streptococcaceae-targeting bacteriophage underwent divergent abundance patterns from
Streptococcaceae. Taken together, WD feeding disrupted baseline levels of bacteriophage genera
98
and altered bacteriophage community’s contribution to have more of an impact on the
microbiome as a whole.
Here we show that compositional shifts in the microbiota following WD feeding result in
shift in the overall network of microbial community structure. I discussed in Chapter 1 that WD
microbiome samples depicted dissimilarity from chow counterparts in nMDS plots (Figure 2.4).
This is in line with previous reports of dissimilarity in intestinal microbiome composition
between opposing diets, where individuals on the same diet cluster closely together within
various ordination plots 13,28,29. Virus-like particle (VLP) of bacteriophage communities on a
low-fat diet have displayed dissimilarity from VLP communities of individuals fed a high-fat
diet 28. Furthermore, others investigations characterizing both prokaryotic and eukaryotic viral
populations in the intestinal microbiome (virome) report divergence of the virome communities
in human samples following low-fat or high-fat feeding 29. Individuals on the same diet had more
similar communities of virus-like particles in the intestinal microbiome than those on the
alternative diet 29. Our findings support and expand upon the understanding of these divergent
communities through evaluation of the community structure of the intestinal microbiome.
Community structure on the chow diet shows high connectivity between many bacterial
constituents. Bacteriophage genera were shown to have few connections and were more
peripheral in relation to the central network in the chow samples. WD samples showed a higher
modularity of communities than the basal diet. These modules may indicate a loss in microbial
community collaboration and proficiency. Bacteriophage genera in our WD samples had more
connections and were found to potentially play a more integral part in community structure as
compared to chow samples. Our findings support previous studies, and show bacteriophage

99
potentially contribute more to overall community structure in these communities as microbial
composition changes following WD feeding.
Recently, there has been a rise in appreciation of the enteric virome due to metagenomic
sequencing, which has given us a reliable method to study the complexity within this community
15. In the present study, we utilized whole shotgun metagenomic samples annotated by MG-
RAST to track abundance patterns of bacteriophage and their host. Of note, we were selectively
targeting the bacteriophage community, namely those belonging to the order Caudovirales. This
study did not use methods to speak to prokaryotic enveloped, prokaryotic RNA, or eukaryotic
viral abundance and how these viral components contribute to community structure in the
intestinal microbiome. To date, many studies report bacteriophage communities in terms of
VLPs 29–32. This is useful for evaluating the overall community but is not descriptive enough to
infer implications of these communities on the microbiome as a whole. The challenge facing
investigation of resident viral communities is that viral taxonomy identification databases are
severely incomplete. In this study, we attempted to establish defined populations of
bacteriophage in the intestinal microbiome in order to describe the dynamics of both the
bacteriophage and its putative host. To do this, we cross-annotated species annotations (70%
identity threshold), within the order Caudovirales, from the RefSeq database with the
International Committee on Taxonomy of Viruses taxonomic database or other documentation
detailing classification of the bacteriophage into respective genera. Descriptions of bacteriophage
genera present are outlined in Appendix 1. One limitation of our study pertained to
bacteriophage who were not specifically classified to a genus. We did see some change in the
relative abundance of those who fell in the unclassified components of our sample but were
unable to delve into these relationships. This limitation can only be overcome by significant

100
expansion of bacteriophage annotations within available databases. Another limitation of our
study lies in determining whether a viral annotation was due to prophage integration in host
genome, or if it was free living. To accommodate for this, we attempted to identify the lifestyle
characterization of the viral species used to better define the mechanism of abundance change.
This limitation of mis-annotation could still exist even in the event that bacterial and viral
components are separated prior to DNA extraction. To distinguish bacterial components from
integrated prophage will require development of new tools and significant improvement of viral
databases.
Recent studies have described the bacteriophage community’s potential to induce a cascading
effect in the intestinal microbiome 19,27,33. This study characterized bacteria:bacteriophage
dynamics following colonization of human gut commensal bacteria and administration of lytic
bacteriophage in gnotobiotic mice 19. First, the results established that bacteriophage can coexist
over time with targeted gut bacteria, which follows theoretical models of bacteriophage biology
19,26,27,33. This idea is supported in our chow samples, as a steady prevalence of bacteriophage
genera and their bacterial host was described for a vast majority of microbial constituents.
Following administration of bacteriophage, the researchers described alterations of not only
target bacterial communities, but also cascading effects that resulted in modulation of the
microbiota and metabolites they produced 19. The network analysis in the present study supports
this idea, as bacteriophage within the WD samples contributed more to the central network with
more interconnectivity. Hsu, et al. described a gnotobiotic model reminiscent of intestinal
microbiome alteration following bacteriophage therapy 19. In our study, we describe the
modulation potential of resident bacteriophage communities within the intestinal microbiome

101
following WD feeding. This allows for a better assessment the susceptibility of bacteriophage
populations to modulation following WD feeding.
The present study also characterized the variations of multiple bacteria:bacteriophage
relationships occurring in tandem with the entire microbiome following WD-induced community
changes. Bacteriophage genera dominated with temperate bacteriophage typically followed the
abundance patterns of their putative host. This was confirmed in bacteriophage species dynamics
with host bacterial genera. This behavior was attributed to the fact that they may be present as
prophage within the host genome. Temperate bacteriophage are thought to prefer lysogeny
within rapidly dividing host bacterial cells 27,33. As the host genome is replicated, so too is the
prophage genome replicated; this is known as ‘piggyback-the-winner’ 27,33. Temperate
bacteriophage do have the possibility of existing as free bacteriophage particles, similar to
virulent bacteriophage, and therefore the possibility of ambient temperate bacteriophage in our
samples cannot be overlooked. Spontaneous induction of prophage can occur in a range of
conditions such as following host induction of the SOS response 34–37, extrinsic factors like
altered gene expression of the host 38, coordination using communication molecules 39, molecular
cues 40 and phage-phage interactions 41,42. Spontaneous induction of prophage in these microbial
environments can serve to increase the pool of prophage being replicated, as well as kill off
related bacterial competitors 27. A more recent investigation also describes communication
among bacteriophage that act to coordinate lytic-lysogenic decisions 39. Models such as these
may provide explanation for bacteriophage lifestyle decisions in microbial communities, and
potential mechanisms of a bacteriophage’s ability to control bacterial communities. We also
described rapid abundance increases of Staphylococcus phage EW and Streptococcus phage
Tuc2009 in response to marginal host abundance blooms. In these bacteriophage species, there

102
may be a combination of piggyback-the-winner and prophage induction in response to some host
abundance threshold being reached. In contrast, Enterococcus phage phiFL4A showed close
correlations with host abundance patterns which likely explained solely by piggyback-the-winner
dynamics.
One possible explanation for elevation of free bacteriophage, such as virulent bacteriophage,
abundance following diet change could be due to the fact that viruses replicate at a much faster
rate than bacteria. One bacteriophage particle can give rise to hundreds of new virions within one
host cell per replication cycle as compared to host binary fission. Additionally, bacteriophage
require less resources and time to produce progeny than bacteria. When the opportunity arises,
such as a bloom in target bacteria in response to variation in nutrient availability, bacteriophage
can benefit from the increase in viable host bacteria. In this way, a small bloom of bacteria could
give rise to a larger production of bacteriophage that target this host. Bacterial abundance levels
could appear reduced or stagnant as bacteriophage progeny are infecting new daughter bacterial
cells. In this way, bacteriophage could curb potential unwanted blooms of organisms, such as
opportunistic pathogens and those who promote disease states and contribute to overall stability
of the microbiome. This has been outlined in the classic theoretical bacterial control model of
kill-the-winner 26. In this model, there is not much predation in steady states, and this preserves
the diversity of bacteriophages and bacteria. In the event that bacterial species bloom to a
particular threshold, bacteriophage can prevent any single bacterial species from over-taking the
whole community 26. This is exemplified in abundance patterns of virulent bacteriophage species
and their host in Chow samples. At the final timepoint for many of the bacteria genera studied,
we saw an increase in bacteria and virulent bacteriophage. Future investigations could extend the
duration of the experiment to see if these results point cyclical ebb-and-flow described in these

103
bacteriophage behavioral models. Similarly, in line with these models, we described significant
elevations of virulent bacteriophage species targeting Lactococcus following elevations in host
abundance in WD microbiome samples. In the context of our fold-change results, it appears that
bacteriophage experience more rapid and elevated abundance increases in response to WD
feeding. More sensitive sampling strategies will be needed to provide the necessary evidence of
the mechanisms and timeline of predator-prey dynamics in response to environmental stimuli.
We have demonstrated that bacteriophage abundance dynamics do not always follow that of
the host and this is exacerbated following WD feeding. As compared to control counterpart
dynamics, Streptococcaceae-targeting bacteriophage genera showed a wide range of sensitivities
to the WD. P335-like and 936-like viruses showed similar responses to the WD, which were
parallel to that of their host. More detailed investigations of bacteriophage species belonging to
P335-like viruses supported the possibility of this arising from the combination of both
temperate and virulent bacteriophage species propagation strategies. Previous theories of
bacteriophage ecology and abundance predict that bacteriophage populations would follow that
of their putative host - either due to lysogeny or kill-the-winner dynamics 26,33,43. In addition, we
also noted bacteriophage populations that were affected by diet inversely as compared to their
bacterial host. Similar to P335-like and 936-like viruses, 1706-like viruses are virulent
bacteriophage who target Streptococcaceae but showed a reduction in abundance as compared to
its bacterial host and control counterparts. I do not have a definitive explanation of why this
occurred, but it could be due to a decrease in additional unclassified bacterial host populations or
sensitivities of these bacteriophage to components, such as metabolites, within the microbiome
following dietary exposure. Nutrient have shown to influence the behavior of bacteriophage 44,45.
For example, adsorption efficiency of E. coli bacteriophage is influenced by temperature and the

104
presence of L-tryptophan in media 44. Other investigations of bacteriophage biology state that
nutrient poor conditions do not restrict bacteriophage reproduction as much as concentration of
bacteriophage where the lowest concentration of bacteriophage resulted in the highest progeny
yield 45. Our study demonstrates that relative abundance fluctuations tend to match that of their
host, but this study also demonstrates that bacteriophage communities can respond to
environmental stimuli independently of their host overtime. Future investigations into
bacteria:bacteriophage dynamics will hopefully reveal if alteration to bacteriophage abundance
precedes that of their bacterial host or if rapid replication of bacteriophage genera is disguising
blooms of the bacterial host.
With the surge of antibiotic resistance within recent years, researchers are embracing the idea of
utilizing bacteriophage as therapy for bacterial infections. Many have pointed to the specificity
of bacteriophage therapy being a major advantage of this treatment over broad-spectrum
antibiotics. However, Hsu, et al. showed the potent cascading effects of bacteriophage
administration on the microbiota species that are not directly targeted and the resulting
modulation to the metabolome 19. Rippling effects of bacteriophage prevalence could bring
about homeostasis or perpetuate disease states of the enteric microbiome. Potential therapies
could be developed by understanding the role bacteriophage play during microbiome
compositional alteration and applying these lessons to modulate microbial symbionts.
Furthermore, bacteriophage communities could act as an indicator population to help proactively
diagnose disruption of community structure in the intestinal microbiome. Our work provides
initial evidence of these bacteria:bacteriophage relationships within the intestinal microbiome
following WD feeding.

105
References
1. Sender, R., Fuchs, S. & Milo, R. Revised Estimates for the Number of Human and
Bacteria Cells in the Body. PLOS Biol. 14, e1002533 (2016).
2. Obata, Y. & Pachnis, V. The Effect of Microbiota and the Immune System on the
Development and Organization of the Enteric Nervous System. Gastroenterology vol.
151 836–844 (2016).
3. Cani, P. D. Human gut microbiome: hopes, threats and promises. Gut gutjnl-2018-
316723 (2018) doi:10.1136/gutjnl-2018-316723.
4. Zuo, T. et al. Gut mucosal virome alterations in ulcerative colitis. Gut gutjnl-2018-
318131 (2019) doi:10.1136/gutjnl-2018-318131.
5. Turnbaugh, P. J. et al. An obesity-associated gut microbiome with increased capacity for
energy harvest. Nature 444, 1027–1031 (2006).
6. Chang, J. Y. et al. Decreased Diversity of the Fecal Microbiome in Recurrent Clostridium
difficile –Associated Diarrhea. J. Infect. Dis. 197, 435–438 (2008).
7. Le Roy, T. et al. Intestinal microbiota determines development of non-alcoholic fatty
liver disease in mice. Gut 62, 1787–1794 (2013).
8. Zhu, W. et al. Gut Microbial Metabolite TMAO Enhances Platelet Hyperreactivity and
Thrombosis Risk. Cell 165, 111–124 (2016).
9. Hsiao, E. Y. et al. Microbiota modulate behavioral and physiological abnormalities
associated with neurodevelopmental disorders. Cell 155, 1451–1463 (2013).
106
10. Huttenhower, C. et al. Structure, function and diversity of the healthy human
microbiome. Nature 486, 207–214 (2012).
11. Turnbaugh, P. J. et al. The effect of diet on the human gut microbiome: a metagenomic
analysis in humanized gnotobiotic mice. Sci. Transl. Med. 1, 6ra14 (2009).
12. Backhed, F. et al. The gut microbiota as an environmental factor that regulates fat
storage. Proc. Natl. Acad. Sci. 101, 15718–15723 (2004).
13. Ridaura, V. K. et al. Gut microbiota from twins discordant for obesity modulate
metabolism in mice. Science 341, 1241214 (2013).
14. Lopetuso, L. R., Ianiro, G., Scaldaferri, F., Cammarota, G. & Gasbarrini, A. Gut Virome
and Inflammatory Bowel Disease. Inflamm. Bowel Dis. 22, 1708–1712 (2016).
15. Ofir, G. & Sorek, R. Contemporary Phage Biology: From Classic Models to New
Insights. Cell (2018) doi:10.1016/j.cell.2017.10.045.
16. Norman, J. M. et al. Disease-specific alterations in the enteric virome in inflammatory
bowel disease. Cell 160, 447–60 (2015).
17. Manrique, P. et al. Healthy human gut phageome. Proc. Natl. Acad. Sci. U. S. A. 113,
10400–10405 (2016).
18. Minot, S. et al. The human gut virome: inter-individual variation and dynamic response
to diet. Genome Res. 21, 1616–1625 (2011).
19. Hsu, B. B. et al. Dynamic Modulation of the Gut Microbiota and Metabolome by
Bacteriophages in a Mouse Model. Cell Host Microbe 25, 803-814.e5 (2019).
107
20. Li, H. & Durbin, R. Fast and accurate short read alignment with Burrows-Wheeler
transform. Bioinformatics 25, 1754–1760 (2009).
21. Li, H. et al. The Sequence Alignment/Map format and SAMtools. Bioinformatics 25,
2078–2079 (2009).
22. Kurtz, Z. D. et al. Sparse and Compositionally Robust Inference of Microbial Ecological
Networks. PLoS Comput. Biol. 11, (2015).
23. Csardi, G., & Nepusz, T. The Igraph Software Package for Complex Network Research.
InterJournal 2006, Complex Systems, 1695. - References - Scientific Research
Publishing.
https://www.scirp.org/(S(vtj3fa45qm1ean45vvffcz55))/reference/ReferencesPapers.aspx?
ReferenceID=1426710 (2006).
24. Ernst, J. & Bar-Joseph, Z. STEM: a tool for the analysis of short time series gene
expression data. BMC Bioinformatics 7, 191 (2006).
25. Klumpp, J., Calendar, R. & Loessner, M. J. Complete Nucleotide Sequence and
Molecular Characterization of Bacillus Phage TP21 and its Relatedness to Other Phages
with the Same Name. Viruses 2, 961–71 (2010).
26. Thingstad, T. & Lignell, R. Theoretical models for the control of bacterial growth rate,
abundance, diversity and carbon demand. Aquat. Microb. Ecol. 13, 19–27 (1997).
27. Silveira, C. B. & Rohwer, F. L. Piggyback-the-Winner in host-associated microbial
communities. npj Biofilms Microbiomes 2, 16010 (2016).

108
28. Howe, A. et al. Divergent responses of viral and bacterial communities in the gut
microbiome to dietary disturbances in mice. ISME J. 10, 1217–1227 (2016).
29. Minot, S. et al. The human gut virome: inter-individual variation and dynamic response
to diet. Genome Res. 21, 1616–25 (2011).
30. Dutilh, B. E. et al. A highly abundant bacteriophage discovered in the unknown
sequences of human faecal metagenomes. Nat. Commun. (2014)
doi:10.1038/ncomms5498.
31. Reyes, A., Wu, M., McNulty, N. P., Rohwer, F. L. & Gordon, J. I. Gnotobiotic mouse
model of phage-bacterial host dynamics in the human gut. Proc. Natl. Acad. Sci. U. S. A.
110, 20236–41 (2013).
32. Mobberley, J. M., Authement, R. N., Segall, A. M. & Paul, J. H. The temperate marine
phage PhiHAP-1 of Halomonas aquamarina possesses a linear plasmid-like prophage
genome. J. Virol. 82, 6618–30 (2008).
33. Knowles, B. et al. Lytic to temperate switching of viral communities. Nature (2016)
doi:10.1038/nature17193.
34. Little, J. W. Chance phenotypic variation. Trends Biochem. Sci. 15, 138 (1990).
35. Miyazaki, R. et al. Cellular Variability of RpoS Expression Underlies Subpopulation
Activation of an Integrative and Conjugative Element. PLoS Genet. 8, e1002818 (2012).
36. Nanda, A. M. et al. Analysis of SOS-induced spontaneous prophage induction in
Corynebacterium glutamicum at the single-cell level. J. Bacteriol. 196, 180–188 (2014).

109
37. Smith, C. L. & Oishi, M. Early events and mechanisms in the induction of bacterial SOS
functions: Analysis of the phage repressor inactivation process in vivo. Proc. Natl. Acad.
Sci. U. S. A. 75, 1657–1661 (1978).
38. Broussard, G. W. et al. Integration-Dependent Bacteriophage Immunity Provides Insights
into the Evolution of Genetic Switches. Mol. Cell 49, 237–248 (2013).
39. Erez, Z. et al. Communication between viruses guides lysis-lysogeny decisions. Nature
541, (2017).
40. Casjens, S. et al. The Chromosome of Shigella flexneri Bacteriophage Sf6: Complete
Nucleotide Sequence, Genetic Mosaicism, and DNA Packaging. J. Mol. Biol. 339, 379–
394 (2004).
41. Lemire, S., Figueroa-Bossi, N. & Bossi, L. Bacteriophage crosstalk: Coordination of
prophage induction by Trans-Acting antirepressors. PLoS Genet. 7, e1002149 (2011).
42. Campoy, S. et al. Induction of the SOS response by bacteriophage lytic development in
Salmonella enterica. Virology 351, 360–367 (2006).
43. Virgin, H. W. The virome in mammalian physiology and disease. Cell vol. 157 142–150
(2014).
44. Anderson, T. F. The Influence of Temperature and Nutrients on Plaque Formation by
Bacteriophages Active on Escherichia coli Strain B. J. Bacteriol. 55, 659 (1948).
45. Moebus, K. Marine bacteriophage reproduction under nutrient-limited growth of host
bacteria. II. Investigations with phage-host system [H3:H3/1]. Mar. Ecol. Prog. Ser. 144,
13–22 (1996).

110
Chapter 4
In vitro Analysis of Intestinal Inflammations Effect on Bacteriophage Infectivity Rates.
Abstract
The intestinal immune system must maintain a delicate balance between tolerance of
enteric commensals and defense against pathogens. The enteric microbiota is composed of a
variety of microorganisms, including bacteria, bacteriophage, and several others. During periods
of intestinal inflammation, the enteric microbiota can be subjected inadvertently to damage by
immune-derived antimicrobial agents, such as reactive oxygen and chlorine species. While we
have some knowledge of how inflammation affects bacteria, we understand significantly less
about how inflammatory products impact the dynamics of bacteria:bacteriophage interactions.
The primary objective of this study was to determine how immune system products, namely
hydrogen peroxide and hypochlorous acid, impact bacteriophage infectivity rates of a virulent
bacteriophage. The effect of hydrogen peroxide and hypochlorous acid on the infectivity rate of
bacteriophage was measured using a modified one-step growth curve, which determined the
timeline of the growth cycle and burst size of an Escherichia coli-specific bacteriophage, PF-2.
Adsorption kinetics allowed for quantification of adsorption efficiency during exposure to
hydrogen peroxide and hypochlorous acid. We observed a delay in adsorption rate in a dose-
dependent manner in the presence of either hydrogen peroxide or hypochlorous acid.
Additionally, hydrogen peroxide treated PF-2 samples were delayed in replication, presumably
due to inefficiency of adsorption, but this did not reduce overall progeny production at low
concentrations. Though adsorption kinetics were also modified in a dose-dependent manner by

111
hypochlorous acid, the replication cycle of PF-2 was not changed at doses of 0.6mg/L or 1mg/L
hypochlorous acid. Hypochlorous acid treatment did result in a slightly longer latent period, but
this did not result in significant change in the overall timeline or progeny produced. In
conclusion, we demonstrated the negative effects of reactive oxygen and chlorine species on the
adsorption efficiency of PF-2. For reactive oxygen, this translates into downstream effects of
delayed and reduced replication cycles especially at higher concentrations. Regardless of delay
in adsorption, hypochlorous acid treatment did not affect the overall infectivity rate of PF-2 even
at the highest dose.
112
Introduction
Bacteriophage have recently gained much attention in the field of microbial ecology,
especially among those who investigate the intestinal microbiome. These prokaryote-targeting
viruses are dominant members of the viral community in many microbial environments,
including the intestinal microbiome 1,2. It is well established that bacteria play a role in the
mammalian health and physiology. Recent investigations of bacteriophage communities have
displayed evidence that they too are contributing members of microbial communities, namely the
healthy gut microbiome 1,3. Bacteriophage, namely those belonging to the order Caudovirales,
are tailed, double-stranded DNA viruses as seen in Figure 4.1B. Caudovirales is further divided
into Podoviridae, Siphoviridae, and Myoviridae families 2. In Chapters 1 and 2, we discussed the
impact of environmental stimuli, namely WD feeding, on the composition of the bacteriophage
community in the intestinal microbiome. Similar findings of bacteriophage modulation have
been reported in the context of nutrient availability 4 and intestinal inflammation 3,5. However,
detailed mechanism for the plasticity seen in the bacteriophage communities has yet to be
determined, especially in the setting of intestinal inflammation.
The mammalian intestine can be home to both commensal and opportunistic pathogenic
bacteria, among other microorganisms 6. The intestinal immune system has a unique challenge in
maintaining homeostasis while providing protection from invading pathogens 7. In times of
pathogenic invasion or a breach in the intestinal barrier, the immune system becomes activated
and intestinal inflammation initiates with signaling of proinflammatory cytokines and
recruitment of granulocytes 8. Among the first innate immune cells to arrive at the scene of
inflammation is neutrophils 9. These innate granulocytes are equipped with machinery that aids
in destruction of pathogenic threats - including phagocytosis, granules filled with antimicrobial
113
agents, and respiratory burst caused by NADPH oxidase 10–12. Many of these antimicrobial
tactics are used in tandem to maximize clearing of infectious agents. For example, neutrophils
can maximize the potency of NADPH oxidase action by the additional release of
myeloperoxidase during degranulation 12. Reactive oxygen intermediates are released into the
extracellular space following oxidative burst by neutrophils. One of these intermediates,
hydrogen peroxide, acts as the substrate in the myeloperoxidase-catalyzed peroxidation of
chloride ions to form reactive chlorine intermediates, namely hypochlorous acid 10,12. It is well
established that these antimicrobial substances aid the immune system in clearing bacterial
threats 12. In response, bacteria have evolved global regulatory systems for adaptation to both
environmental and/or inflammatory stress. These regulatory systems aid in detecting and
initiating responses to stressors including pH, nutrient depletion, and oxidation that could destroy
necessary proteins and nucleic acids 13. Genes within these systems are usually autoregulating,
and increase or decrease expression based on the level of the stress applied to the system 13–15.
Activation of lytic-lysogenic switches have been reported in the temperate lambda bacteriophage
following damage response system (the SOS response) activation 16. However, it is unclear how
these environmental conditions affect free bacteriophage particles, virulent bacteriophage or
newly released temperate bacteriophage, and their ability to efficiently and effectively infect.
Recent publications show evidence that bacteriophage communities display modulation
within the enteric microbiome during intestinal inflammation3,5,17. For example, members of the
defined core phageome were significantly depleted or absent in IBD patients as compared to
healthy counterparts 3. Additionally, Norman, et al. reported elevations in bacteriophage richness
with reciprocal decline in bacterial diversity in fecal microbiome samples of IBD patients 5.
Elevated bacteriophage abundance could be connected with bacterial dysbiosis and could lead to
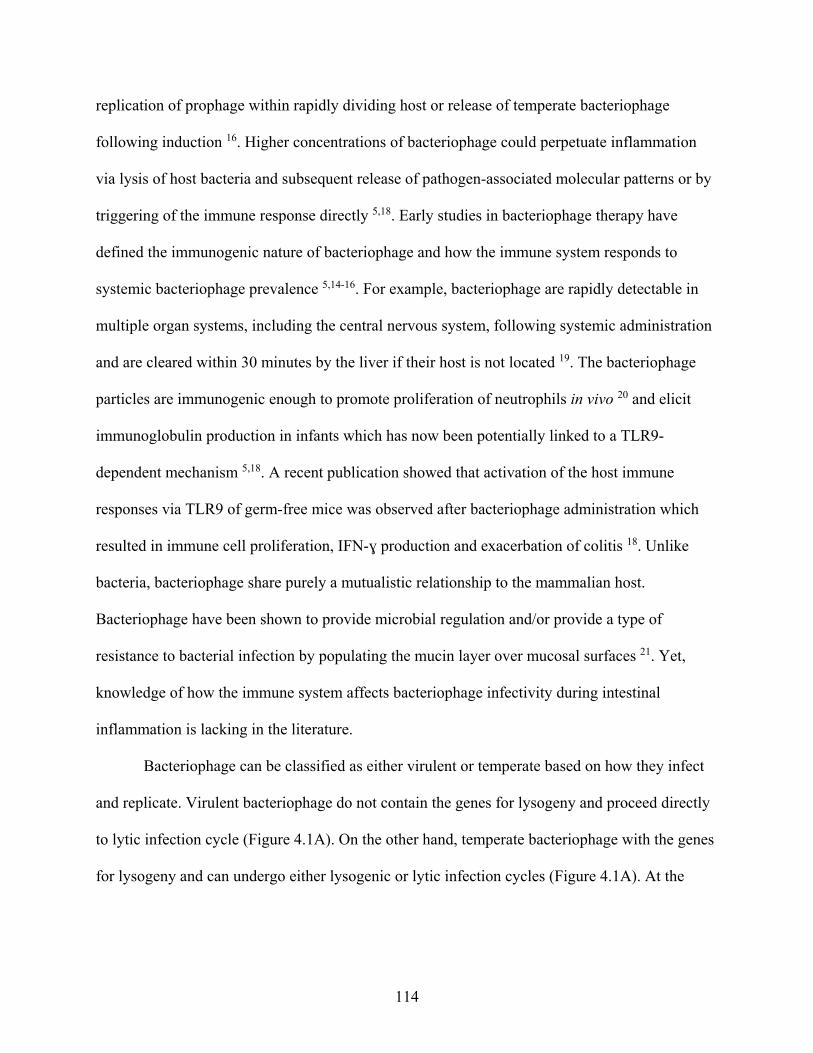
114
replication of prophage within rapidly dividing host or release of temperate bacteriophage
following induction 16. Higher concentrations of bacteriophage could perpetuate inflammation
via lysis of host bacteria and subsequent release of pathogen-associated molecular patterns or by
triggering of the immune response directly 5,18. Early studies in bacteriophage therapy have
defined the immunogenic nature of bacteriophage and how the immune system responds to
systemic bacteriophage prevalence 5,14-16. For example, bacteriophage are rapidly detectable in
multiple organ systems, including the central nervous system, following systemic administration
and are cleared within 30 minutes by the liver if their host is not located 19. The bacteriophage
particles are immunogenic enough to promote proliferation of neutrophils in vivo 20 and elicit
immunoglobulin production in infants which has now been potentially linked to a TLR9-
dependent mechanism 5,18. A recent publication showed that activation of the host immune
responses via TLR9 of germ-free mice was observed after bacteriophage administration which
resulted in immune cell proliferation, IFN-ɣ production and exacerbation of colitis 18. Unlike
bacteria, bacteriophage share purely a mutualistic relationship to the mammalian host.
Bacteriophage have been shown to provide microbial regulation and/or provide a type of
resistance to bacterial infection by populating the mucin layer over mucosal surfaces 21. Yet,
knowledge of how the immune system affects bacteriophage infectivity during intestinal
inflammation is lacking in the literature.
Bacteriophage can be classified as either virulent or temperate based on how they infect
and replicate. Virulent bacteriophage do not contain the genes for lysogeny and proceed directly
to lytic infection cycle (Figure 4.1A). On the other hand, temperate bacteriophage with the genes
for lysogeny and can undergo either lysogenic or lytic infection cycles (Figure 4.1A). At the

115
Figure 4.1. Bacteriophage life cycles and morphology. (a) Bacteriophage life cycles. (b)
Bacteriophage taxonomy within the order Caudovirales is based on morphology. A
representative type of bacteriophage is present for each taxonomical group within this order.
Both images from Ofir and Sorek, 2017 1.

116
conclusion of infection, all bacteriophage undergo the lytic infection cycle, where progeny phage
particles are released from the host cell in a process that most often involves host cell lysis via
bacteriophage-derived proteins (Figure 4.1A) 1. Infection begins with adsorption of the phage
particle or virion to its host cell through specific receptor recognition. The eclipse phase of the
phage infection cycle describes the time taken to adsorb and deliver nucleic acid into host cells
(Figure 4.2). The following stage is termed the synthetic period where new bacteriophage
particles are being produced intracellularly. The collective term for the eclipse and synthetic
period is the latent period, otherwise described as the time period in which attachment, entry,
replication, transcription, translation and assembly of progeny occur (Figure 4.2) 22. Following
the latent period comes the rise period where bacteriophage progeny are emerging from host
bacterial cells, described as the burst 22. Many investigations of bacteria:bacteriophage
relationships utilize temperate bacteriophage to explain bacteriophage behavior following host
response to environmental stimuli. Yet, virulent bacteriophage can also be affected by decisions
of the host. Virulent bacteriophage are potent modulators of bacterial composition as they have
been sought after as the anti-bacterial agents in bacteriophage therapy 1. Understanding
bacteriophage behavior during bacterial stress may give insight to the resilience of bacteriophage
therapies during inflammation as well as elucidate potential mechanisms of bacteriophage
modulation during intestinal inflammation.
In this study, we examined known antimicrobial agents of the immune system and their
potential effects on virulent bacteriophage infectivity rates during inflammation. We performed a
series of assays to determine efficiency of adsorption and progeny production in an intestinal
bacteriophage isolate. Reactive oxygen and chlorine species had deleterious effects on

117
Figure 4.2. Diagram of Bacteriophage Replication Timeline. (Image from One step
multiplication curve for bacteriophages – Biotech Khan) 23.
118
bacteriophage adsorption efficiency with increasing concentrations. We found that delays in
adsorption were followed by delayed and reduced progeny production in hydrogen peroxide
treatments. However, this was not the case for hypochlorous acid samples where bacteriophage
infectivity rates were seemingly unaffected regardless of treatment and dosing timing. Our study
highlights effects of reactive oxygen and chlorine species on the reproduction efficiency of
enteric virulent bacteriophage. Characterization of such a process will allow more insight into
how bacteriophage are affected by inflammation.
Materials and Methods
Bacteriophage isolation and bacterial isolation
Microbial isolates were harvested from fecal samples of a Mangalica Pig housed at the
Auburn University Swine Facility. We were able to isolate a Gram-negative bacterium that was
identified as Escherichia coli based on the following criteria: negative Gram-stain; motile rods;
positive growth on EMB plates with metallic green colonies; catalase positive; negative for
growth on MSA plates, positive mannitol, lactose, and nitrate metabolism, among other
biochemical tests. This E. coli isolate was utilized as the indicator strain in bacteriophage
isolation of PF-2 and in subsequent bacteriophage infectivity experiments.
To isolate bacteriophage, fecal samples were diluted 1:10 in salt-magnesium buffer with
10% beef extract. Homogenized samples were filtered through a 0.45 µm filter. Sample filtrate
was administered to a double agar overlay plate as part of the spot test as described by Clokie
and Kropinski 24. In short, a double agar overlay is a plating strategy where 200 µL of E. coli
culture, or the indicator strain, is added to 3 mL of a soft agar (0.7% agar) containing 0.1% of
2,3,5-Triphenyltetrazolium chloride (TTC) (Supplier: Millipore Sigma). TTC acts as a dye to
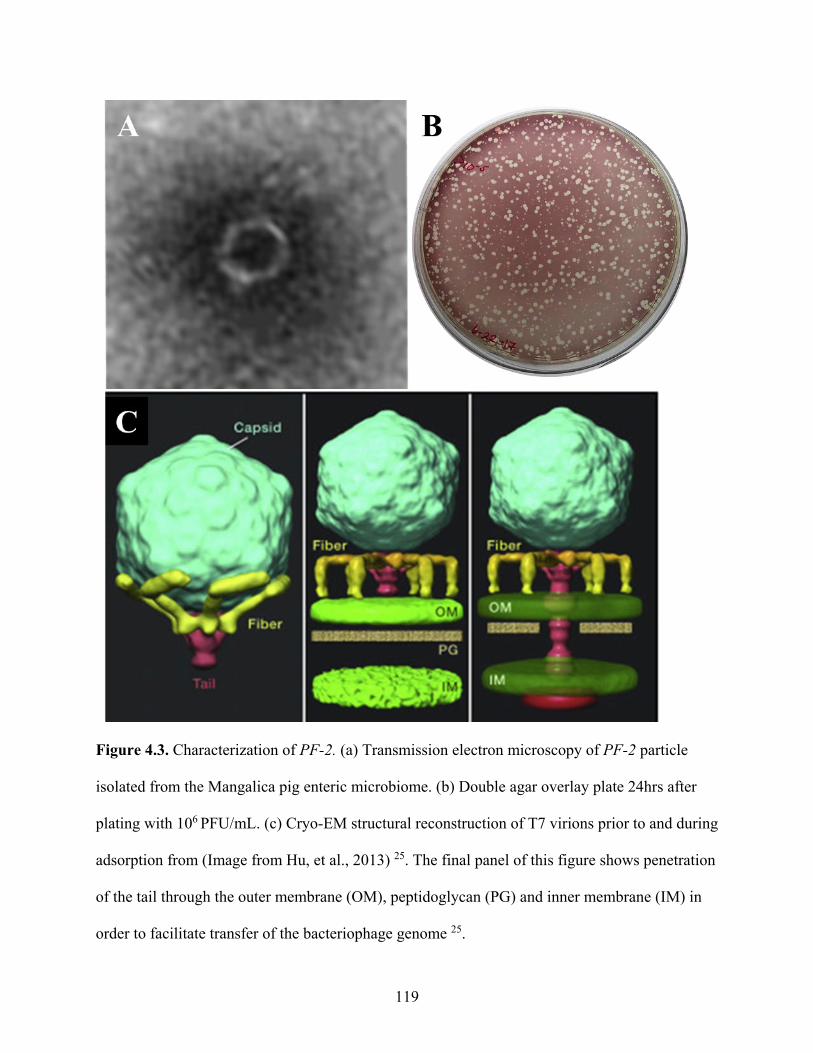
119
Figure 4.3. Characterization of PF-2. (a) Transmission electron microscopy of PF-2 particle
isolated from the Mangalica pig enteric microbiome. (b) Double agar overlay plate 24hrs after
plating with 106 PFU/mL. (c) Cryo-EM structural reconstruction of T7 virions prior to and during
adsorption from (Image from Hu, et al., 2013) 25. The final panel of this figure shows penetration
of the tail through the outer membrane (OM), peptidoglycan (PG) and inner membrane (IM) in
order to facilitate transfer of the bacteriophage genome 25.

120
provide a colored backdrop of the bacterial lawn. This allowed bacteriophage plaques to be
easily identified following addition of bacteriophage as shown in Figure 4.3B. Positive spot tests
were cored, and cores were allowed to diffuse in 500 µL of SM buffer with 10% chloroform 4
hours at room temperature. The upper phase of the solutions containing cores were removed and
used in bacteriophage isolation procedures. Multiple rounds of bacteriophage isolation were
conducted in which single plaques were cored, processed, and utilized in the following isolation
assay. Following this series of isolation passes, one bacteriophage was isolated and amplified.
This bacteriophage was given the designation of PF-2. PF-2 has been characterized as a virulent,
E. coli-targeting bacteriophage. Transmission electron microscopy revealed that PF-2 had a
short, non-contractile tail, morphology consistent with the family Podoviridae (Figure 4.3A).
Recent advancements in microscopy have allowed for a 3D rendering of a similar Podoviridae
bacteriophage, Escherichia bacteriophage T7, to better characterize its morphology and
mechanics (Figure 4.3C; From Hu, et al., 2013) 25. We speculate that PF-2 could share
morphological and behavioral similarities to what was described by Hu, et al., 2013 25.
Morphological and behavior characteristics of PF-2 have been characterized but sequencing of
the PF-2 genome has not been performed to date to either classify or identify this bacteriophage.
Plaque morphology of PF-2 showed clear plaques with finite size and distinct edges (Figure
4.3B). Plaque characteristics, such as selective growth on log-phase bacteria and ability to lyse a
significant portion of bacterial cell culture, were indications that PF-2 is a virulent
bacteriophage. Cell surface receptors of E. coli utilized in adsorption have not been characterized
for PF-2. PF-2 did not display cross reactivity on Samonella enteria. All together, these
characteristics made the bacteriophage isolate PF-2 an ideal candidate for further
experimentation.

121
Figure 4.4. Diagram of adsorption constant methods and description of analysis.
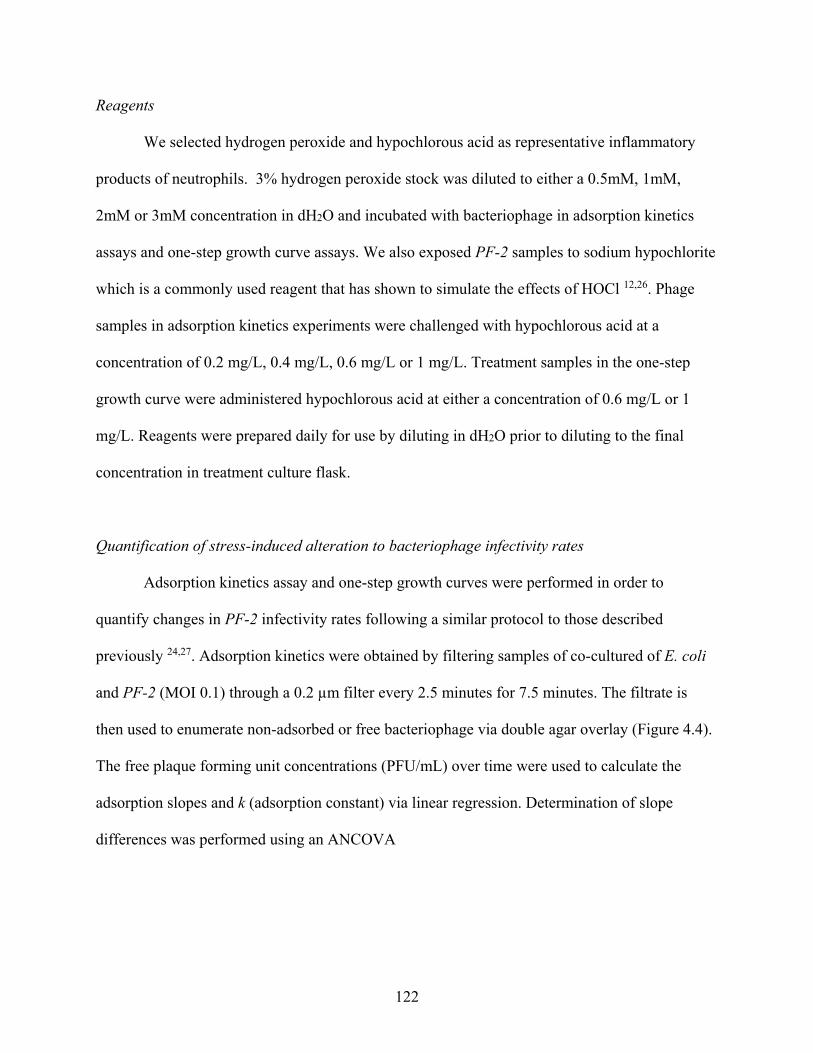
122
Reagents
We selected hydrogen peroxide and hypochlorous acid as representative inflammatory
products of neutrophils. 3% hydrogen peroxide stock was diluted to either a 0.5mM, 1mM,
2mM or 3mM concentration in dH2O and incubated with bacteriophage in adsorption kinetics
assays and one-step growth curve assays. We also exposed PF-2 samples to sodium hypochlorite
which is a commonly used reagent that has shown to simulate the effects of HOCl 12,26. Phage
samples in adsorption kinetics experiments were challenged with hypochlorous acid at a
concentration of 0.2 mg/L, 0.4 mg/L, 0.6 mg/L or 1 mg/L. Treatment samples in the one-step
growth curve were administered hypochlorous acid at either a concentration of 0.6 mg/L or 1
mg/L. Reagents were prepared daily for use by diluting in dH2O prior to diluting to the final
concentration in treatment culture flask.
Quantification of stress-induced alteration to bacteriophage infectivity rates
Adsorption kinetics assay and one-step growth curves were performed in order to
quantify changes in PF-2 infectivity rates following a similar protocol to those described
previously 24,27. Adsorption kinetics were obtained by filtering samples of co-cultured of E. coli
and PF-2 (MOI 0.1) through a 0.2 µm filter every 2.5 minutes for 7.5 minutes. The filtrate is
then used to enumerate non-adsorbed or free bacteriophage via double agar overlay (Figure 4.4).
The free plaque forming unit concentrations (PFU/mL) over time were used to calculate the
adsorption slopes and k (adsorption constant) via linear regression. Determination of slope
differences was performed using an ANCOVA

123
Figure 4.5. Description of modified one-step growth curve protocol.

124
Dose-dependent effects on burst were determined by the one-step growth curve as
described previously 24,28. To do this, mono- and co-cultures of E. coli and PF-2 were treated
following the strategy outlined in Figure 4.5 at a MOI of 0.1. Cultures were incubated at 37° C
for 10 minutes to allow for adsorption. Following the adsorption period, cultures were diluted in
treatment flasks and stress-inducing products were added at the appropriate concentration. We
sampled mono- and co-cultures of bacteria and bacteriophage every 5 minutes to determine
PFU/mL and every 10 minutes to determine bacterial colony forming units (CFU/mL) for a total
of 60 min (Figure 4.5). One step growth curve experiment using HOCl treatments had additional
treatments of HOClinitial and HOClinitial+. HOClinitial samples received a dose of HOCl at the start
of the 10-minute allotment time for adsorption and were not treated with HOCl again upon
initiation of growth curve sampling. HOClinitial+ samples were treated in a similar fashion to
HOClinitial samples with the addition of a secondary dosing at the initiation of the growth curve
(diagram of methods can be found in Appendix 3). Burst estimates were determined by
subtracting free PFU/mL prior to burst (5 minutes post-adsorption) from total PFU/mL follow
burst plateau (~30 minutes post-adsorption; variable). Free PFU/mL were estimated by filtering
EP and EPH samples at 5 minutes post-adsorption through a 0.2 µm filter. The filtrate was then
used to enumerate plaques via double agar overlay. Significance differences of treatment
samples from control samples were determined using the students t-test.
Results
Reactive oxygen species do not directly damage PF-2
We first established a dose range suitable to induce stress in E. coli without killing either
phage or bacteria. These experiments were conducted in tandem with the one-step growth curve.
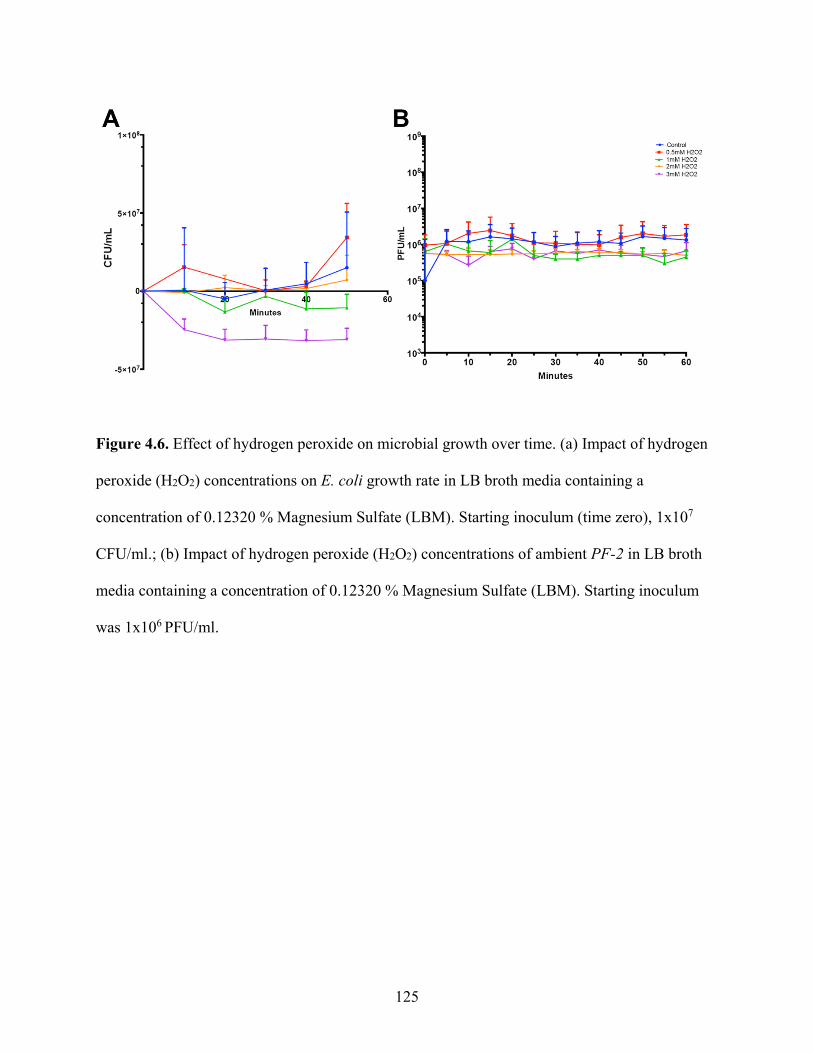
125
Figure 4.6. Effect of hydrogen peroxide on microbial growth over time. (a) Impact of hydrogen
peroxide (H2O2) concentrations on E. coli growth rate in LB broth media containing a
concentration of 0.12320 % Magnesium Sulfate (LBM). Starting inoculum (time zero), 1x10⁷
CFU/ml.; (b) Impact of hydrogen peroxide (H2O2) concentrations of ambient PF-2 in LB broth
media containing a concentration of 0.12320 % Magnesium Sulfate (LBM). Starting inoculum
was 1x10⁶ PFU/ml.

126
We did see a dose-dependent effect of H2O2 on bacterial cultures (Figure 4.6A). Bacterial cell
loss was detected in samples treated with 3mM H2O2, thus, this treatment was not utilized in
downstream experiments (Figure 4.6A). PF-2, an E. coli-targeting virulent bacteriophage, did
not display any sensitivity to H2O2 as determined by consistent PFU/mL over the course of the
experiment regardless of H2O2 concentration (Figure 4.6B). These findings lead us to conclude
that PF-2 bacteriophage particles were less sensitive to hydrogen peroxide-induced oxidative
stress than their bacterial hosts and were still able to infect host cells after H2O2 exposure.
Reactive oxygen species negatively impacts PF-2’s adsorption efficiency
To assess the effects of reactive oxygen species on PF-2’s ability to adsorb, we
performed a series of adsorption constant determination assays in the presence of varying
concentrations of H2O2. In control samples, PF-2 displayed an average adsorption slope of -
4.456 over the course of 7.5 minutes (Table 4.1). This describes the acceleration of the loss of
free bacteriophage in the culture as they undergo reversible and irreversible adsorption to
bacterial host. From this, we were able to determine that the adsorption constant (k) of PF-2 is
1.7290 x 10⁻⁷ mL/min (Table 4.1). The adsorption constant describes the likelihood of a single
bacteriophage adsorbing to a single bacterium within a defined volume and time. A higher
adsorption constant relates to a faster overall adsorption rate. PF-2 displayed relatively rapid
adsorption speed with approximately 30% of the bacteriophage adsorbing within 7.5 minutes
(Figure 4.7).
Low concentrations of H2O2 caused a significant delay in adsorption as indicated by a
significant slope incline following 0.5mM H2O2 treatment (Figure 4.7A; Table 4.1). Though not
significant, 1mM H2O2 treatment was similar to 0.5mM treatment in having an adsorption slope

127
Figure 4.7. Dose-dependent effect of hydrogen peroxide on adsorption kinetics over time. Free
bacteriophage estimate following hydrogen peroxide (H2O2) treatment at a concentration of (a)
0.5mM, (b) 1mM and (c) 2mM on cultures of bacteria:bacteriophage. Detailed quantification of
slope, k and p-value are outlined in Table 4.1. * p < 0.05; ** p < 0.01; *** p < 0.001.
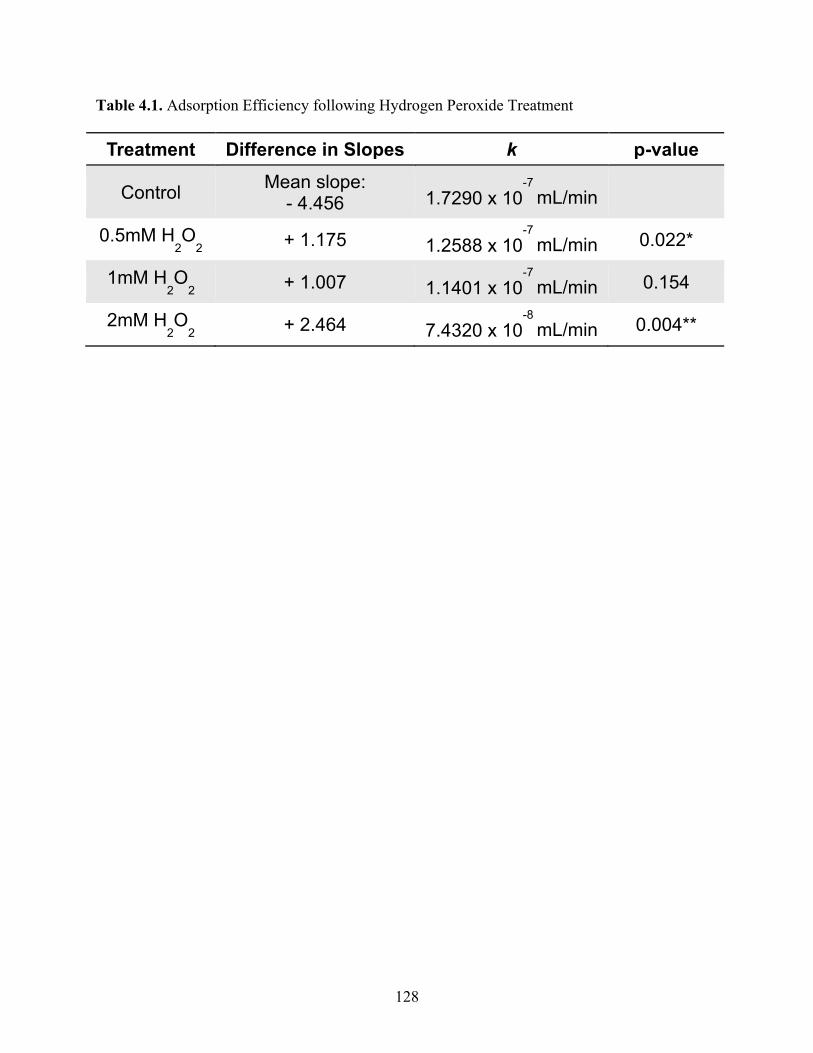
128
Table 4.1. Adsorption Efficiency following Hydrogen Peroxide Treatment
Treatment Difference in Slopes k p-value
Control Mean slope: - 4.456 1.7290 x 10
-7 mL/min
0.5mM H2O
2 + 1.175 1.2588 x 10
-7 mL/min 0.022*
1mM H2O
2 + 1.007 1.1401 x 10
-7 mL/min 0.154
2mM H2O
2 + 2.464 7.4320 x 10
-8 mL/min 0.004**
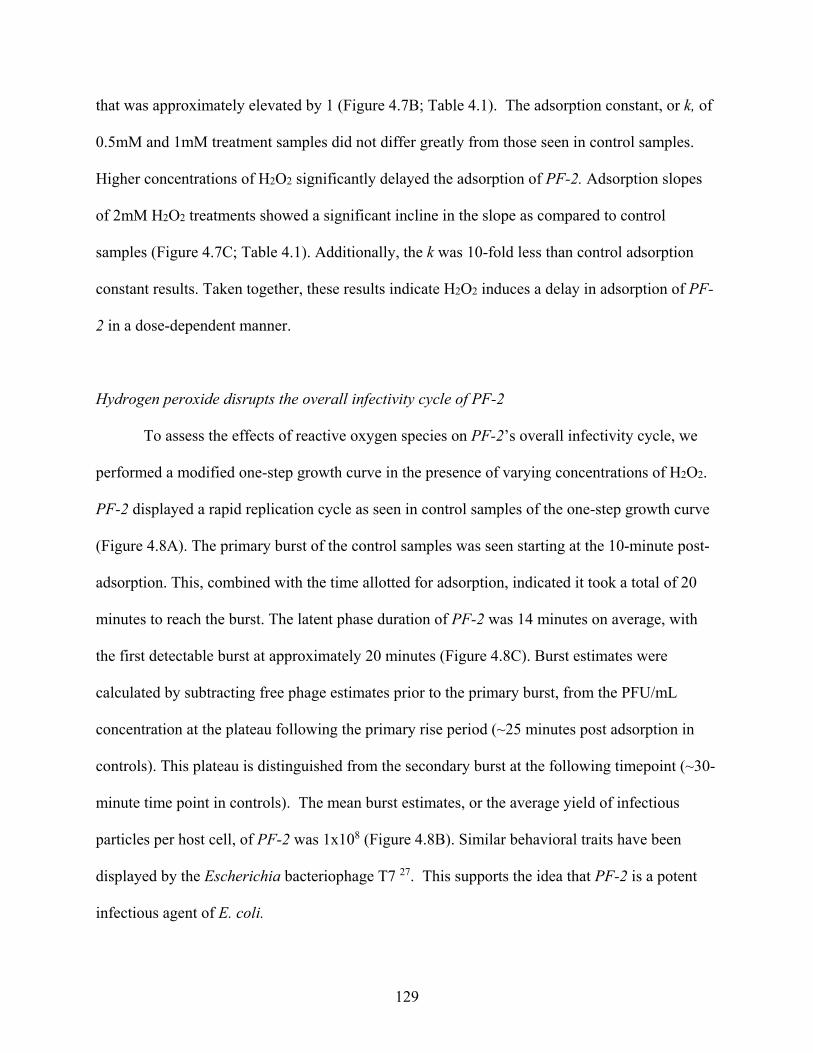
129
that was approximately elevated by 1 (Figure 4.7B; Table 4.1). The adsorption constant, or k, of
0.5mM and 1mM treatment samples did not differ greatly from those seen in control samples.
Higher concentrations of H2O2 significantly delayed the adsorption of PF-2. Adsorption slopes
of 2mM H2O2 treatments showed a significant incline in the slope as compared to control
samples (Figure 4.7C; Table 4.1). Additionally, the k was 10-fold less than control adsorption
constant results. Taken together, these results indicate H2O2 induces a delay in adsorption of PF-
2 in a dose-dependent manner.
Hydrogen peroxide disrupts the overall infectivity cycle of PF-2
To assess the effects of reactive oxygen species on PF-2’s overall infectivity cycle, we
performed a modified one-step growth curve in the presence of varying concentrations of H2O2.
PF-2 displayed a rapid replication cycle as seen in control samples of the one-step growth curve
(Figure 4.8A). The primary burst of the control samples was seen starting at the 10-minute post-
adsorption. This, combined with the time allotted for adsorption, indicated it took a total of 20
minutes to reach the burst. The latent phase duration of PF-2 was 14 minutes on average, with
the first detectable burst at approximately 20 minutes (Figure 4.8C). Burst estimates were
calculated by subtracting free phage estimates prior to the primary burst, from the PFU/mL
concentration at the plateau following the primary rise period (~25 minutes post adsorption in
controls). This plateau is distinguished from the secondary burst at the following timepoint (~30-
minute time point in controls). The mean burst estimates, or the average yield of infectious
particles per host cell, of PF-2 was 1x10⁸ (Figure 4.8B). Similar behavioral traits have been
displayed by the Escherichia bacteriophage T7 27. This supports the idea that PF-2 is a potent
infectious agent of E. coli.
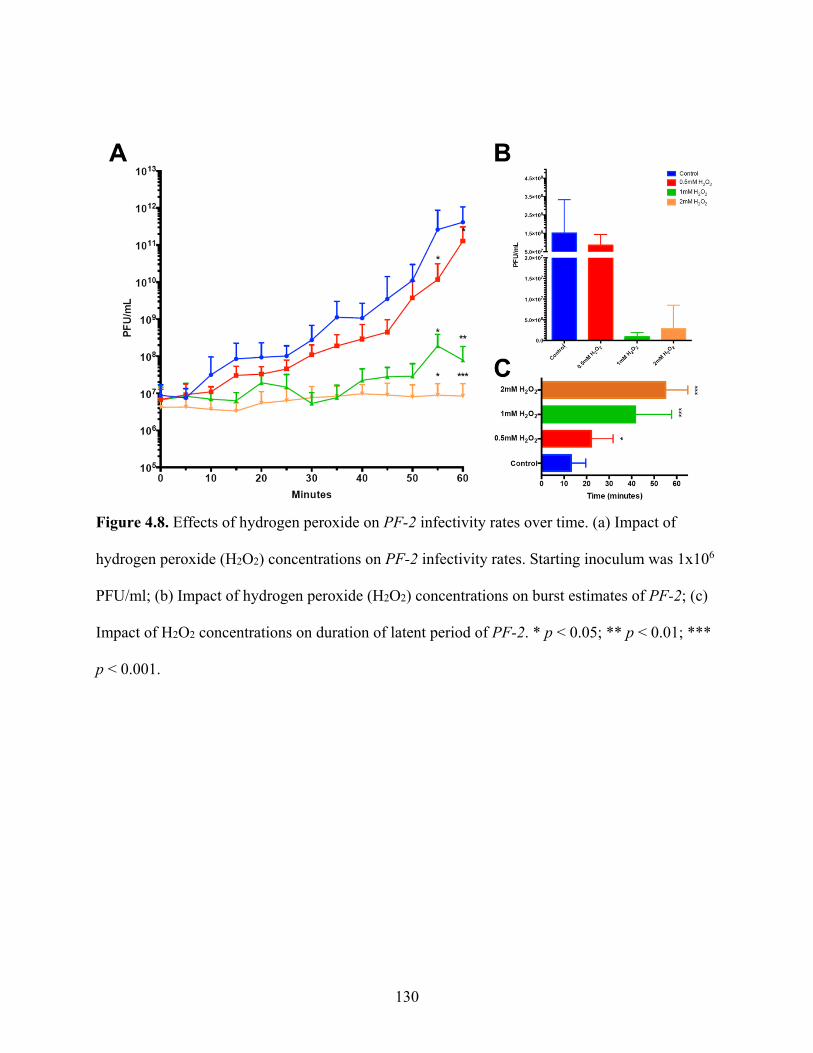
130
Figure 4.8. Effects of hydrogen peroxide on PF-2 infectivity rates over time. (a) Impact of
hydrogen peroxide (H2O2) concentrations on PF-2 infectivity rates. Starting inoculum was 1x10⁶
PFU/ml; (b) Impact of hydrogen peroxide (H2O2) concentrations on burst estimates of PF-2; (c)
Impact of H2O2 concentrations on duration of latent period of PF-2. * p < 0.05; ** p < 0.01; ***
p < 0.001.
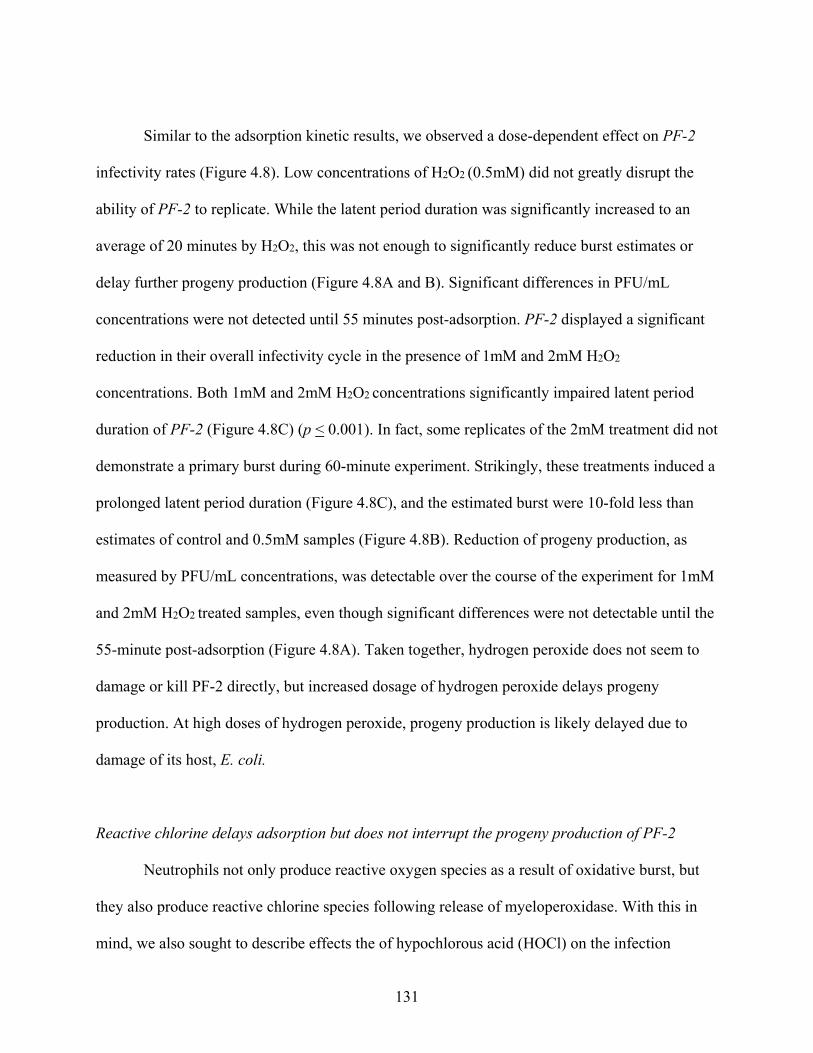
131
Similar to the adsorption kinetic results, we observed a dose-dependent effect on PF-2
infectivity rates (Figure 4.8). Low concentrations of H2O2 (0.5mM) did not greatly disrupt the
ability of PF-2 to replicate. While the latent period duration was significantly increased to an
average of 20 minutes by H2O2, this was not enough to significantly reduce burst estimates or
delay further progeny production (Figure 4.8A and B). Significant differences in PFU/mL
concentrations were not detected until 55 minutes post-adsorption. PF-2 displayed a significant
reduction in their overall infectivity cycle in the presence of 1mM and 2mM H2O2
concentrations. Both 1mM and 2mM H2O2 concentrations significantly impaired latent period
duration of PF-2 (Figure 4.8C) (p < 0.001). In fact, some replicates of the 2mM treatment did not
demonstrate a primary burst during 60-minute experiment. Strikingly, these treatments induced a
prolonged latent period duration (Figure 4.8C), and the estimated burst were 10-fold less than
estimates of control and 0.5mM samples (Figure 4.8B). Reduction of progeny production, as
measured by PFU/mL concentrations, was detectable over the course of the experiment for 1mM
and 2mM H2O2 treated samples, even though significant differences were not detectable until the
55-minute post-adsorption (Figure 4.8A). Taken together, hydrogen peroxide does not seem to
damage or kill PF-2 directly, but increased dosage of hydrogen peroxide delays progeny
production. At high doses of hydrogen peroxide, progeny production is likely delayed due to
damage of its host, E. coli.
Reactive chlorine delays adsorption but does not interrupt the progeny production of PF-2
Neutrophils not only produce reactive oxygen species as a result of oxidative burst, but
they also produce reactive chlorine species following release of myeloperoxidase. With this in
mind, we also sought to describe effects the of hypochlorous acid (HOCl) on the infection

132
Figure 4.9. Dose-dependent effect of hypochlorous acid on adsorption kinetics over time. Free
bacteriophage estimate following hypochlorous acid (HOCl) treatment at a concentration of (a)
0.2mg/L, (b) 0.4mg/L, (c) 0.6gm/L and (d) 1mg/L on cultures of bacteria:bacteriophage. Detailed
quantification of slope, k and p-value are outlined in Table 4.2. * p < 0.05; ** p < 0.01; *** p <
0.001.
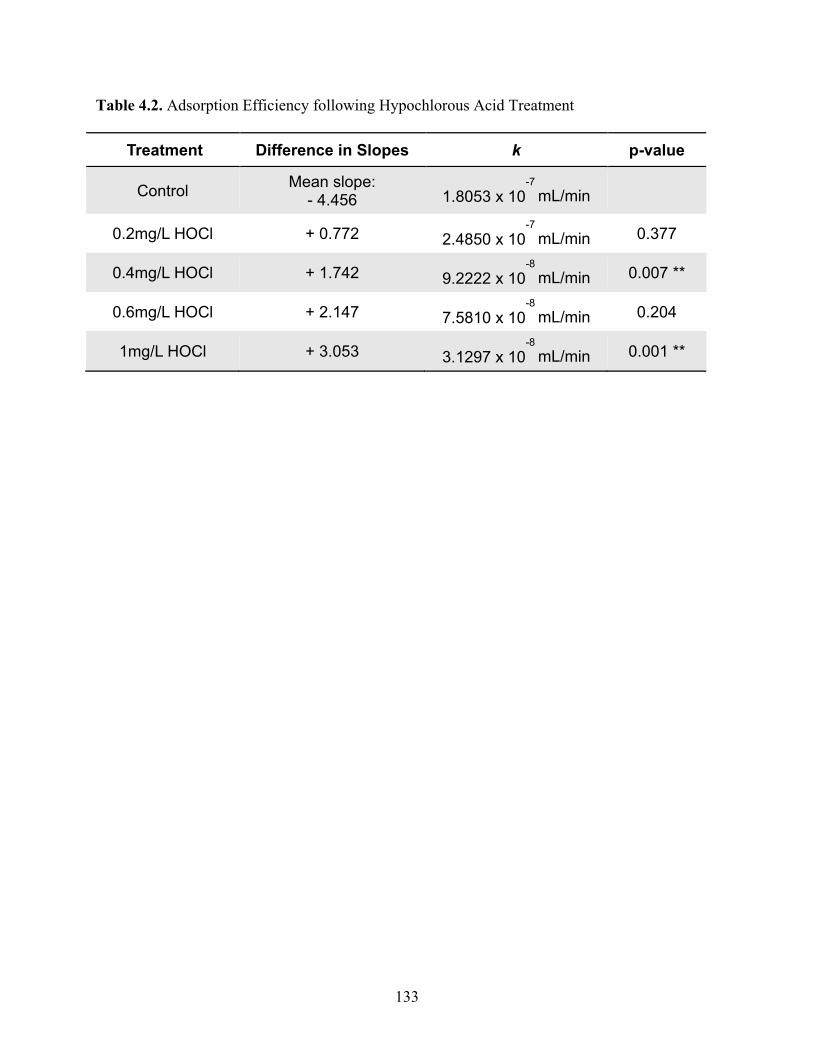
133
Table 4.2. Adsorption Efficiency following Hypochlorous Acid Treatment
Treatment Difference in Slopes k p-value
Control Mean slope: - 4.456 1.8053 x 10
-7 mL/min
0.2mg/L HOCl + 0.772 2.4850 x 10⁻⁷
mL/min 0.377
0.4mg/L HOCl + 1.742 9.2222 x 10⁻⁸
mL/min 0.007 **
0.6mg/L HOCl + 2.147 7.5810 x 10⁻⁸
mL/min 0.204
1mg/L HOCl + 3.053 3.1297 x 10⁻⁸
mL/min 0.001 **

134
efficiency of PF-2. Similar to reports of H2O2, HOCl did not appear to destroy or damage PF-2
bacteriophage particles directly, as there was not a detectable reduction of viable PF-2 particles
over the course of the experiment regardless of treatment. Additionally, bacteriophage were able
to infect host bacteria following treatment regardless of duration in specified concentration (data
not shown). Though not directly damaged by HOCl, PF-2 did prove to be less efficient in its
ability to adsorb in increasing concentrations of HOCl (Figure 4.9). 0.2 mg/L HOCl treatment
did not result in significant differences in k or slope (Figure 4.9A; Table 4.2). For other
concentrations of HOCl, we observed a dose-dependent increase in the adsorption slope by
approximately 1 between each treatment as compared to the control, with significant differences
for 0.4 mg/L and 1 mg/L HOCl treatment (Figure 4.9B, C, D; Table 4.2). Elevation in slope
resulted in a lower k for 0.4 mg/L, 0.6 mg/L and 1 mg/L HOCl treatment groups (Table 4.2).
These results lead us to conclude that HOCl treatment reduces the adsorption efficiency of PF-2
in a dose-dependent manner.
Although HOCl negatively impacted PF-2’s ability to adsorb, this did not translate into
negative effects on downstream progeny production. Control samples displayed similar trends
consistent with the characterized infectivity cycle of PF-2. Surprisingly, 0.6mg/L did not prove
to have a major effect on PF-2’s ability to produce progeny (Figure 4.10). Over the course of the
60 minutes, we did not detect any significant difference between 0.6 mg/L HOCl treatment and
control samples (Figure 4.10A), nor were there detectable differences in burst estimates (Figure
4.10B) or the latent period duration (Figure 4.10C). The one-step growth curve in these
experiments aimed to evaluate the infectivity cycle following adsorption. This would simulate
bacterial stress occurring after adsorption. With the understanding that HOCl treatment
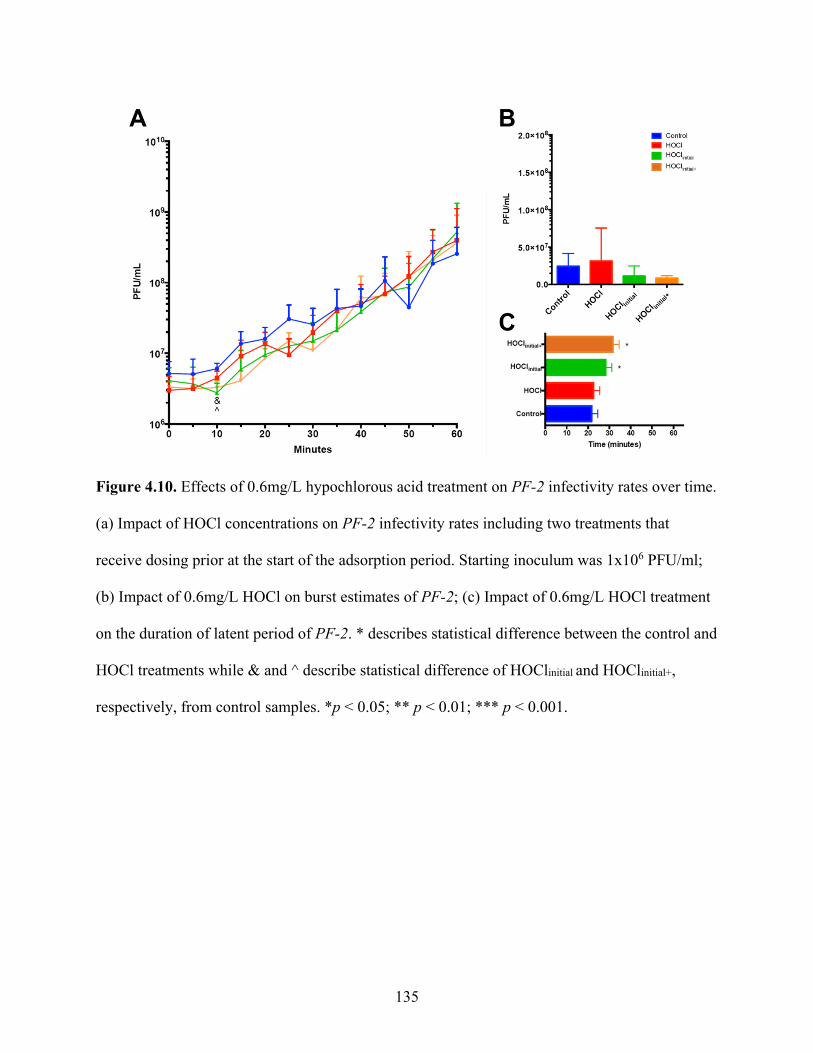
135
Figure 4.10. Effects of 0.6mg/L hypochlorous acid treatment on PF-2 infectivity rates over time.
(a) Impact of HOCl concentrations on PF-2 infectivity rates including two treatments that
receive dosing prior at the start of the adsorption period. Starting inoculum was 1x10⁶ PFU/ml;
(b) Impact of 0.6mg/L HOCl on burst estimates of PF-2; (c) Impact of 0.6mg/L HOCl treatment
on the duration of latent period of PF-2. * describes statistical difference between the control and
HOCl treatments while & and ^ describe statistical difference of HOClinitial and HOClinitial+,
respectively, from control samples. *p < 0.05; ** p < 0.01; *** p < 0.001.

136
negatively affected adsorption efficiency (Figure 4.9C), we added two additional treatment
groups to describe the effect of HOCl treatment during adsorption on progeny production. We
detected a significant difference at the 10-minute time point for HOClinitial and HOClinitial+
treatments (Figure 4.10A). This is likely explained by the significant, 5-minute delay in the latent
period of the HOClinitial or HOClinitial+ samples, followed by a burst at the 20-minute time point
that is comparable control samples (Figure 4.10C). There was also a slight reduction in
estimated burst size following HOClinitial or HOClinitial+ treatments, however, these were not
significantly different from the control (Figure 4.10B). At 25 minutes, HOClinitial and HOClinitial+
treatments showed a reduction in PFU/mL estimates, but this again is likely due to the slight
delay of the primary burst, as the following time points for these samples were comparable to
bacteriophage abundances seen in control samples (Figure 4.10A). Under 0.6mg/L treatment
conditions, PF-2 was able to undergo normal replication regardless of dosing during adsorption
(HOClinitial), after adsorption (HOCl), or throughout both events (HOClinitial+).
For the1mg/L HOCl treatment, we again did not see major deviations of PF-2’s
characterized growth cycle (Figure 4.11A). A significant reduction was observed for HOCl
treatments at the final two timepoints regardless of dosing strategy (Figure 4.11A). This may
indicate that progeny produced following the primary burst period have a delayed secondary rise
due to inefficient adsorption. Significant differences in burst estimates and latent period duration
were not observed for any treatment of 1mg/L HOCl (Figure 4.11B and C) as compared to
control samples. Under 1.0mg/L treatment conditions, PF-2 is able to undergo normal replication
rates regardless of dosing strategy, but residual effects of HOCl may inhibit replication potential
of newly synthesized progeny.
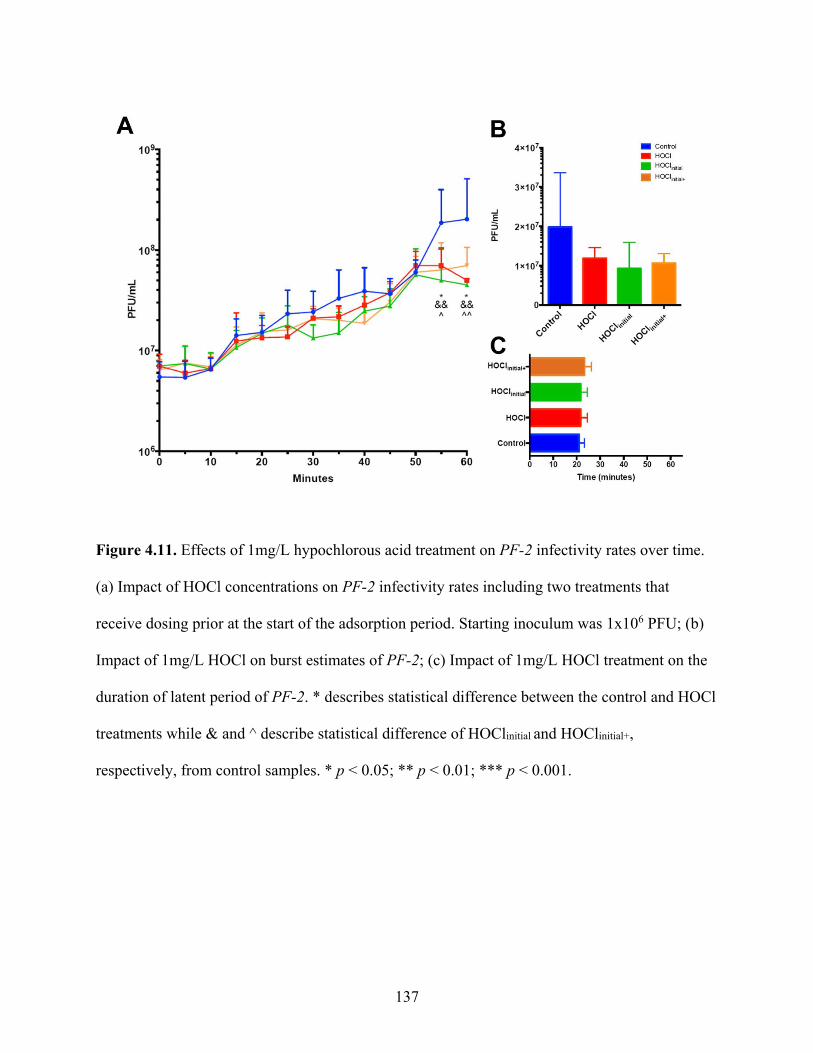
137
Figure 4.11. Effects of 1mg/L hypochlorous acid treatment on PF-2 infectivity rates over time.
(a) Impact of HOCl concentrations on PF-2 infectivity rates including two treatments that
receive dosing prior at the start of the adsorption period. Starting inoculum was 1x10⁶ PFU; (b)
Impact of 1mg/L HOCl on burst estimates of PF-2; (c) Impact of 1mg/L HOCl treatment on the
duration of latent period of PF-2. * describes statistical difference between the control and HOCl
treatments while & and ^ describe statistical difference of HOClinitial and HOClinitial+,
respectively, from control samples. * p < 0.05; ** p < 0.01; *** p < 0.001.
138
Discussion
Here we describe the infectivity rates of an enteric virulent bacteriophage, PF-2, and
characterize the effects of reactive chlorine and oxygen species on the efficiency of virulent
bacteriophage infection. Although PF-2 was not damaged directly, both reactants elicited
elevations in slopes of adsorption indicating delayed and inefficient adsorption. For hydrogen
peroxide, delayed adsorption coincides with reductions in progeny production and increased
latent period duration. Hypochlorous acid did not prove to greatly alter the infectivity potential
of PF-2 regardless of inefficient adsorption indicated by a lower k in comparable concentrations.
When HOCl treatment was administered pre-adsorption, we did see a significant delay in the
latent period, but this did not appear to alter progeny production. Taken together, reactive
oxygen and chlorine species have shown to reduce adsorption efficiency of PF-2. Hydrogen
peroxide treatment also greatly reduces replication rates of this virulent bacteriophage in elevated
concentrations. Overall, immune-derived antimicrobial agents have the potential to alter
infectivity efficiency of virulent bacteriophage.
We undertook the task of addressing these questions with a use of a bacteriophage isolate
from porcine fecal samples. We felt that using an intestinal isolate may give better descriptions
of mammalian host effects during intestinal inflammation on bacteria:bacteriophage dynamics
within the intestinal microbiome than a lab strain. This particular isolate, PF-2, proved to be
resilient in the presence of hydrogen peroxide and hypochlorous acid exclusively. However,
contrasting responses in downstream reproduction efficiency speaks to the dependency on the
bacterial host. These studies were performed on one bacteriophage:host relationship and may not
explain events that occur within the dynamic environment of the intestinal microbiome. Future
investigations could explore these responses in co-cultures of multiple bacterial isolates and

139
bacteriophage to simulate the nature of community involvement in bacteriophage efficiency
during events of stress, similar to the microbiome environment during intestinal inflammation.
Bacterial adaptability to the presence of hydrogen peroxide has been extensively studied
12,29,30. From this, we know exposure of low concentrations of hydrogen peroxide lead to the
induction of cellular defense mechanisms in exponentially growing cells under the control of
transcriptional activator, OxyR 12. These strategies aim to protect against the most common
effects of hydrogen peroxide. Hydrogen peroxide resistance is also one of the many functions
encoded under the control of rpoS, which enables bacteria to survive starvation 12. PF-2 did not
prove to have adequate replication efficiency using static bacterial host cultures in stationary
phase. Therefore, we utilized exponentially growing cells which would allow us to assess the full
effects of similar mechanisms on bacteriophage infectivity following oxidative burst.
Quantification of bacterial stress response induction was not measured in these experiments.
Future experimentation will benefit from the correlation between induction of stress response
genes with bacteriophage reproduction efficiency during inflammation-induced stress.
In bacteria, stress responses to external stressors, such as those triggered by DNA
damage, lead to activation of the lytic-lysogenic switch, such as in the case of Escherichia
bacteriophage Lambda 16,29,31. In this study, we describe the adverse effect of hydrogen peroxide
on PF-2 progeny production 16. The effects of high concentrations of H2O2 were apparent as
early as the eclipse phase of the growth cycle. It is possible the elevation of bacteriophage
diversity seen in microbiome samples of IBD patients 3,5 could be due to a combination of free
phage particles released following induction of prophage, and free virulent bacteriophage that are
unable to infect their host shortly after hydrogen peroxide exposure.
140
Similar mechanisms that confer resistance to hydrogen peroxide are utilized in protection
against hypochlorous acid stress 12. Resistance to hypochlorous acid damage in E. coli is largely
mediated by genes that are upregulated during oxidative conditions 30. Myeloperoxidase-
catalyzed peroxidation of chloride ions during inflammatory responses induces rpoS- and oxyR-
governed adaptive responses to protect against hypochlorous acid stress 12. This is likely due to
the fact that hypochlorous acid and hydrogen peroxide can generate common deleterious reactive
oxygen species, such as hydroxyl radicals, that act to damage DNA 12. However, hypochlorous
acid does not readily diffuse across bacterial cell membranes like hydrogen peroxide 12.
Regardless, hypochlorous acid is considered a nonselective oxidant that reacts avidly with a
variety of cellular components, and negatively affects metabolic processes of bacterial cells 12.
At low concentrations, hypochlorous acid has a more bacteriostatic effect, as it rapidly acts to
inhibit cell division 12. The low concentrations used in our study did seem to negatively affect
efficiency of adsorption. Interestingly, hypochlorous acid treatment following adsorption had
essentially no effect on ability of PF-2 to produce viable progeny. It is possible that
hypochlorous acid induces oxidative damage of cell surface receptors needed for adsorption.
With the additional understanding that hypochlorous acid does not readily diffuse across the
membrane, bacteriophage are likely not exposed to oxidative conditions at low concentrations of
hypochlorous acid following adsorption. The mechanism behind reduced growth levels in higher
doses of HOCl will require further investigation. Additionally, more descriptive investigations of
receptor damage and bacteriophage adsorption efficiency could give insight as to what cell
surface receptors may be responsible for less efficient adsorption of PF-2.
Understanding bacteriophage biology in the context of the inflammatory environment can
enhance our understanding of bacteriophage therapy efficiency, as well as provide mechanistic
141
explanations to elevation in bacteriophage abundance during intestinal inflammation 5. The
varying responses of these two reactants that induce similar bacterial responses calls for more
investigations into the mechanistic characterization of bacteriophage infection in the context of
inflammation. In this same context, bacteriophage therapy may be less efficient during early
onset inflammation due to the high influx of neutrophils and their products, namely reactive
oxygen species. Alternatively, other immune compounds, like hypochlorous acid, can act in
conjunction with bacteriophage to stagnate bacterial abundance while bacteriophage lyse host
cells following completion of infection. With the surge of antibiotic resistance within recent
years, researchers are embracing the idea of utilizing bacteriophage as therapy for bacterial
infections. Our work provides context to virulent bacteriophage infection potential during
inflammation-induced bacterial stress. Future work in bacteriophage therapy could look at effect
of other immune-derived products and their effects on bacteriophage therapy efficiency to further
elucidate bacteriophage behavior in inflammatory environments.

142
References
1. Ofir, G. & Sorek, R. Contemporary Phage Biology: From Classic Models to New
Insights. Cell (2018) doi:10.1016/j.cell.2017.10.045.
2. Lopetuso, L. R., Ianiro, G., Scaldaferri, F., Cammarota, G. & Gasbarrini, A. Gut Virome
and Inflammatory Bowel Disease. Inflamm. Bowel Dis. 22, 1708–1712 (2016).
3. Manrique, P. et al. Healthy human gut phageome. Proc. Natl. Acad. Sci. U. S. A. 113,
10400–10405 (2016).
4. Howe, A. et al. Divergent responses of viral and bacterial communities in the gut
microbiome to dietary disturbances in mice. ISME J. 10, 1217–1227 (2016).
5. Norman, J. M. et al. Disease-specific alterations in the enteric virome in inflammatory
bowel disease. Cell 160, 447–60 (2015).
6. Chang, J. Y. et al. Decreased Diversity of the Fecal Microbiome in Recurrent Clostridium
difficile –Associated Diarrhea. J. Infect. Dis. 197, 435–438 (2008).
7. Barr, J. J., Youle, M. & Rohwer, F. Innate and acquired bacteriophage-mediated
immunity. Bacteriophage 3, e25857 (2013).
8. Ryan, G. B. & Majno, G. Acute inflammation. A review. Am. J. Pathol. 86, 183–276
(1977).
9. Knowles, B. et al. Lytic to temperate switching of viral communities. Nature (2016)
doi:10.1038/nature17193.

143
10. Hurst, J. K., Barrette, W. C., Michel, B. R. & Rosen, H. Hypochlorous acid and
myeloperoxidase-catalyzed oxidation of iron-sulfur clusters in bacterial respiratory
dehydrogenases. Eur. J. Biochem. 202, 1275–82 (1991).
11. De Oliveira, S., Rosowski, E. E. & Huttenlocher, A. Neutrophil migration in infection
and wound repair: Going forward in reverse. Nature Reviews Immunology vol. 16 378–
391 (2016).
12. Dukan, S., Danie`, D. & Touati, D. Hypochlorous Acid Stress in Escherichia coli:
Resistance, DNA Damage, and Comparison with Hydrogen Peroxide Stress. JOURNAL
OF BACTERIOLOGY vol. 178 http://jb.asm.org/ (1996).
13. Ron, E. Z. Bacterial Stress Response. in The Prokaryotes 1012–1027 (Springer New
York, 2006). doi:10.1007/0-387-30742-7_32.
14. Wilson, B. A., Salyers, A. A., Whitt, D. D. & Winkler, M. E. Bacterial Pathogenesis.
Bacterial Pathogenesis (American Society of Microbiology, 2011).
doi:10.1128/9781555816162.
15. Bacterial Stress Responses, Second Edition. Bacterial Stress Responses, Second Edition
(American Society of Microbiology, 2011). doi:10.1128/9781555816841.
16. Howard-Varona, C., Hargreaves, K. R., Abedon, S. T. & Sullivan, M. B. Lysogeny in
nature: Mechanisms, impact and ecology of temperate phages. ISME Journal (2017)
doi:10.1038/ismej.2017.16.
17. Hsu, B. B. et al. Dynamic Modulation of the Gut Microbiota and Metabolome by
Bacteriophages in a Mouse Model. Cell Host Microbe 25, 803-814.e5 (2019).

144
18. Gogokhia, L. et al. Expansion of Bacteriophages Is Linked to Aggravated Intestinal
Inflammation and Colitis. Cell Host Microbe 25, 285-299.e8 (2019).
19. Appelmans, R. Le dosage du bactériophage. Compt Rend Soc Biol 85, 701 (1921).
20. Weber-Dabrowska, B., Zimecki, M., Mulczyk, M. & Górski, A. Effect of phage therapy
on the turnover and function of peripheral neutrophils. FEMS Immunol. Med. Microbiol.
34, 135–8 (2002).
21. Barr, J. J. et al. Bacteriophage adhering to mucus provide a non–host-derived immunity.
Proc. Natl. Acad. Sci. 110, 10771–10776 (2013).
22. One step multiplication curve for bacteriophages. – Biotech Khan.
https://biotechkhan.wordpress.com/2014/07/01/one-step-multiplication-curve-for-
bacteriophages/.
23. One step multiplication curve for bacteriophages. – Biotech Khan.
https://biotechkhan.wordpress.com/2014/07/01/one-step-multiplication-curve-for-
bacteriophages/.
24. Clokie, M. R. J., Kropinski, A. M. (Andrew M. B. & Lavigne, R. Bacteriophages :
methods and protocols.
25. Hu, B., Margolin, W., Molineux, I. J. & Liu, J. The bacteriophage T7 virion undergoes
extensive structural remodeling during infection. Science (80-. ). 339, 576–579 (2013).
26. McKenna, S. M. & Davies, K. J. A. The inhibition of bacterial growth by hypochlorous
acid. Possible role in the bactericidal activity of phagocytes. Biochem. J. 254, 685–692
(1988).

145
27. Storms, Z. J., Smith, L., Sauvageau, D. & Cooper, D. G. Modeling bacteriophage
attachment using adsorption efficiency. Biochem. Eng. J. 64, 22–29 (2012).
28. Jun, J. W. et al. Bacteriophage application to control the contaminated water with
Shigella. Sci. Rep. 6, 22636 (2016).
29. Selva, L. et al. Killing niche competitors by remote-control bacteriophage induction.
Proc. Natl. Acad. Sci. U. S. A. 106, 1234–1238 (2009).
30. Yamamoto, N. Damage, repair, and recombination. II. Effect of hydrogen peroxide on the
bacteriophage genome. Virology 38, 457–463 (1969).
31. Nanda, A. M. et al. Analysis of SOS-induced spontaneous prophage induction in
Corynebacterium glutamicum at the single-cell level. J. Bacteriol. 196, 180–188 (2014).
146
Chapter 5
Discussion and Conclusion
Summary of Work
In this dissertation, I have described the dynamics of enteric bacteriophage interactions
with their hosts and their ability to adapt to environmental stimuli. We demonstrated that WD-
feeding adversely effects the systemic metabolic profile and the intestinal microbiome. We also
described dynamic alterations to the composition of the intestinal microbiota as early as 2 days
post WD-feeding. Furthermore, fluctuations in the phageome occurred rapidly post WD-feeding,
often preceding changes in abundance of their bacterial host. After 12-weeks of WD-feeding,
constituents of the enteric microbiome, namely bacteria and bacteriophages, showed distinct
correlation patterns between microbiome constituents and the metabolic phenotype, which
allowed us to distinguish between a healthy microbiome and one more typical of obesity. We
also noted significant differences in the composition of microbial communities within the
intestinal microbiome, which is consistent with previous reports 1–4.
The western diet induces alterations of the intestinal microbiome that coincides with metabolic
dysregulation of the mammalian host.
It has well been established that bacterial components of the intestinal microbiome
undergo alterations in community composition following diet change 1,2,5. Recent reports have
also implicated diet change in inducing bacteriophage community modulation 3,4. One such
previous study demonstrated contrasting viral communities between individuals on a low-fat

147
versus a milk-fat diet 3. In this study, mice microbiome samples were characterized in a 6-week
diet perturbation study in response to low-fat and milk-fat diet. The researcher utilized a milk-fat
diet, due to the high-refined sugar content which made it a close approximation of western diet
consumption 3. They characterized dissimilarity in community composition of virus-like particles
using an nMDS ordination plot. Similar to this study, our findings support the notion that the
host’s diet can induce modulation of the microbiome, including both bacteria and bacteriophage
populations. Many analytical strategies used throughout this dissertation have provided evidence
that alterations in bacteriophage community structure tends to coincide with abundance changes
of the putative host. For example, as Streptococcaceae began to bloom following WD feeding,
we also saw a reciprocal increase in the abundance of P335-like viruses’ a phage known to prey
on this group of bacteria 6–8. Alterations of bacteriophage abundance in the microbiome
following diet change could be attributed to bacteriophage replication rates being much faster
than that of host bacteria 9. One bacteriophage can give rise to hundreds of new virions within
one host cell where bacteria typically produce one daughter cell per replication cycle 9,10. Not
only do bacteriophage produce a larger fraction of progeny per replication cycle, but they also
require far less resources for reproduction than bacteria as many of these are supplied by the host
11. Should an opportunity arise, bacteriophage are thought to exploit blooms of viable host
bacteria, such as those that occur following nutrient oscillations 11–14. Thus, a modest increase in
abundance of host bacteria could result in rapid bacteriophage progeny production. In this way,
bacteriophage could curb potential unwanted blooms of opportunistic pathogens or organisms
implicated in inflammatory disease, potentially stabilizing the overall microbiome.

148
Unique dynamics of bacteriophage during microbiome modulation
In a more in-depth analysis of this relationship (Chapter 3), we further explore the
influence of WD-feeding on the modulation of bacteriophage communities in relation to host
bacteria populations. Community structure of the gut microbiota within our chow diet animals
revealed a high connectivity between many bacterial constituents. The bacterial communities
within the chow diet were more closely associated with other community clusters and appeared
to dominate the central community as depicted by Figure 3.1. WD microbiome network structure
had a higher modularity, denoted by more distance between community clusters, than the chow
diet. Distances observed between community modules on the WD suggest that the WD may lead
to a loss in microbial community collaboration and metabolic proficiency of the intestinal
microbiome. Additionally, bacteriophage genera in WD samples appeared to play a more integral
role in the intestinal microbiome as compared to chow samples. Many bacteriophage genera
were shown to locate more centrally on the network analysis plots of WD samples and displayed
a higher degree of connectivity within the WD microbiome. These results indicate that
bacteriophage communities impact more components of the intestinal microbiome than just their
host, results consistent with similar finding in the literature 11,15–17. Hsu, et al. conducted
experiments using gnotobiotic mice (germ-free mice that are colonized with a defined set of
microorganisms) to monitor the influence of bacteriophage predation on bacterial community
stability within the intestinal microbiome. The results showed that bacteriophage can coexist
overtime with targeted gut bacteria, which aligns with bacteriophage predation models 12–15 as
well as results from the chow microbiome samples in our study. Many investigations have
established that bacteriophage have the potential to modulate host bacterial abundance 11,18–20,
but recent findings also suggest that bacteriophage predation on one particular host bacteria can

149
induce a cascade of alterations in microbial communities, namely the intestinal microbiome 15.
The bacteriophage-induced community modulation was also accompanied with significant
alteration to the metabolite profile of the intestinal microbiome 15. Our findings support these
ideas and describe how bacteriophage populations can contribute to the overall community
structure. Complementary results from chapters 2 and 3 support the idea that the WD induces
dissimilarity in microbiome composition from their chow counterparts. Furthermore, the
alterations of microbial populations are accompanied by bacteriophage occupying a more central
role in the in the overall community structure of the gut microbiome in the WD as compared to
the chow diet.
The relative abundance of bacterial families and bacteriophage genera in our study did
not greatly vary from baseline levels in chow samples and bacteria:bacteriophage dynamics were
generally synchronized. Temperate bacteriophage, regardless of diet, tended to correlate closely
with the abundance patterns of their putative host family. This makes sense, as temperate
bacteriophage are said to prefer to be integrated as prophage during the exponential growth phase
of their host bacteria, also known as piggyback-the-winner 13,14,21. Under steady state conditions,
some spontaneous induction does occur in microbial environments which serves to perpetuate
bacteriophage replication, provide genetic information transfer among bacteria within the
microbiome, or to kill off related bacterial competitors 11,14,21–25. Under stress-inducing
conditions, temperate bacteriophage have demonstrated the ability to switch from lysogenic to
lytic cycles in response to the bacterial host stress-induced SOS response 23,26,27. It has been
proposed that temperate bacteriophage have developed this mechanism in an effort to allow for
their survival in the event of host cell death 26,27. More recent investigations also described
communication among bacteriophage that act to coordinate these lytic-lysogenic decision 28. In

150
this study, the authors report that the temperate Bacillus bacteriophage phi3T relies on a small
communication molecule, termed arbitrium molecule, to unanimously execute lysis-lysogeny 28.
Models such as these may provide explanation for bacteriophage lifestyle decisions in microbial
communities, and potential mechanisms of a bacteriophage’s ability to control bacterial
communities. In the current study, we described rapid increases in Staphylococcus phage EW
and Streptococcus phage Tuc2009 abundance in response to comparably marginal host blooms.
In these bacteriophage species, there is potentially a combination of piggyback-the-winner and
lytic switching in response to some abundance threshold being reached in the host. In contrast,
Enterococcus phage phiFL4A showed close correlations with host replication and abundance
patterns, which is likely explained solely by piggyback-the-winner dynamics.
Virulent bacteriophage behavior was not as dynamic in the Chow samples as compared to
WD microbiome samples. Similarly, the kill-the-winner model describes that there is not much
predation during steady-state conditions, and this preserves the diversity of bacteriophages and
bacteria 12. In Chapter 2, we found microbiome samples of mice on the basal chow diet had
consistent bacterial and bacteriophage diversity and evenness rankings, while WD samples
revealed a temporal decline in these metrics over the course of 12-week experiment.
Furthermore, virulent bacteriophage behavior did not always follow the classic bacteriophage
models following WD feeding 12,29,30. Traditional models of virulent behavior, such as the kill-
the-winner dynamic, would predict an increase in bacteriophage abundance alongside or
following a bloom in targeted bacterial host populations 12,29,30. A seemingly small bloom of
bacteria could give rise to an exponentially larger production of bacteriophage for reasons
described previously 11,20. In the event that bacterial species bloom to a particular threshold,
bacteriophage can prevent any single bacterial species from overtaking the whole microbial

151
community 12. In this way, bacteriophage could curve potential unwanted blooms of organisms,
such as opportunistic pathogens and those who promote disease states, as to contribute to overall
stability of the microbiome. Our studies support the kill-the-winner model of virulent
bacteriophage species in chow microbiome samples. We did note an increase in many bacteria
and the virulent bacteriophage that target them in the chow samples at the final timepoint of the
study. Future investigations could extend the duration of the experiment to see if these results
point to a cyclical ebb and flow as is described in previously mentioned bacteriophage behavioral
models 12,14,29,30. Similarly, in line with these models, we described significant elevations of
virulent bacteriophage species targeting Lactococcus following elevations in host abundance in
WD microbiome samples. In the context of log-fold change, it appears that bacteriophage
experienced more rapid and elevated abundance increases in response to WD feeding.
Development of more sensitive sampling strategies will be needed to provide the necessary
evidence of the mechanisms and timeline of predator-prey dynamics in response to
environmental stimuli. Where these interactions are expected based on information outlined in
the literature 12,14,29,30, some Lactococcus-targeting bacteriophage demonstrated divergent
abundance patterns from Lactococcus following WD feeding, namely Lactococcus phage 1706.
Investigative procedures used in our studies did not explain why this phenomenon occurred. It is
possible that Lactococcus phage 1706 did not benefit from the bloom in Lactococcus following
WD feeding because either it targeted another unclassified bacterial host, it was unable to
successfully infect Lactococcus under these environmental conditions, or Lactococcus was not
susceptible to this bacteriophage due to bacterial evolution or gene upregulation following
nutrient availability 31,32. Taken together, these findings provide evidence that bacteriophage do

152
not always follow patterns of their host, and this may be exacerbated during microbial adaptation
to environmental stimuli.
The impact of the bacterial stress response on reproduction efficiency of virulent bacteriophage
One stimulus that could greatly affect microbial prevalence is the inflammatory
environment created by immune cell activation. In Chapter 4, I described the infectivity rates of
an enteric bacteriophage isolate, PF-2, and demonstrated the effects of reactive chlorine and
oxygen species on its infectivity potential. Although PF-2 was not damaged directly, both
reactants elicited delayed or inefficient adsorption to its host, Escherichia coli. In the case of
hydrogen peroxide treatment, not only was adsorption delayed, but there was also a prolonged
latent period with a reduction in overall progeny produced. Bacteria utilize similar resistance
mechanisms to survive hydrogen peroxide and hypochlorous acid exposure 33,34. During
exponential phase, the adaptive response to H2O2 in bacteria is mediated by the induction of the
oxyR regulon 33,35. Protection against HOCl exposure has also linked to induction of oxyR
regulon 33. Although the specific genes involved in the oxyR-dependent resistance have not be
identified, differential gene expression of katG, ahp, and dps were experienced between H2O2
and HOCl samples 33. Yet, hypochlorous acid did not prove to greatly alter the infectivity
potential of PF-2, regardless of lower k in comparable dose concentrations. Both hydrogen
peroxide and hypochlorous acid have been implicated in facilitating production of harmful
oxidative species which can act to damage DNA 33,35,36. At low concentrations, hypochlorous
acid is more of a bacteriostatic agent, as it rapidly acts to inhibit cell division 33,36. Interestingly,
hypochlorous acid treatment following adsorption had essentially no effect on ability of PF-2 to
produce viable progeny. It is possible that hypochlorous acid induces oxidative damage of cell
153
surface receptors needed for adsorption which results in delayed adsorption efficiency, but this
does not appear to negatively affect downstream progeny production at these concentrations.
With the additional understanding that hypochlorous acid does not readily diffuse across the
membrane 33,36, bacteriophage are likely not exposed to oxidative damage within the host
following administration of a low dose of hypochlorous acid. Overall, immune-derived
antimicrobial agents have the potential to alter infectivity efficiency in virulent bacteriophage
which could result in ineffective bacteriophage treatment during initiation of inflammation.
Implications of these findings
These studies explore bacteriophage dynamics under various environmental stimuli and
provide evidence that bacteriophage are integral members of microbial environments, especially
in the context of dysbiosis. Recent publications have discussed the contribution of bacteriophage
in microbial environments, such as the intestinal microbiome 3,15,17. Temperate bacteriophage, in
particular, have been studied in this setting as they have been proven to have an effect on
bacterial communities via mediation of horizontal gene transfer, alteration of host gene
expression, and providing protection against infection from other bacteriophages 11,13,14.
Thorough investigations of the temperate Escherichia bacteriophage Lambda have characterized
the lysis-lysogeny decision as a complex, intricate network of transcriptional repressors and
activators, as well as other components 11,27,28,37,38. The prophage monitors the metabolic state of
the host, as well as the bacteriophage multiplicity of infection in order to make decisions of when
to implement the switch to lytic cycle 11,13,27,28,37. A recent study examined lysogeny dynamics of
Bacillus phage phi3T and found that a quorum sensing like mechanisms of small-molecule
communication between bacteriophages is used to coordinate lysis-lysogeny decision of

154
temperate bacteriophage 28. Media with high concentrations of the communication molecule
influenced bacteriophage induction providing evidence that a density threshold of the molecule
should be reached to induce lytic cycle activation 28. Unlike temperate bacteriophage, virulent
bacteriophage were not thought to be capable of altering infection cycles in response to
environmental stimuli. Virulent bacteriophage are thought to following kill-the-winner
dynamics, where virulent bacteriophage benefit from blooming host bacteria 13,20. In line with
these models, we described low variability of temperate and virulent bacteriophage abundance
under steady-state conditions and the abundance patterns of bacteriophage populations were in
parallel to the temporal dynamics of the bacterial host. Following diet change, we characterized
rapid and exaggerated fluctuations of temperate and virulent bacteriophage. In WD samples,
virulent bacteriophage typically matched the abundance patterns of the bacterial host, although
they experienced greater abundance increases as compared to the host. However, some
bacteriophage did not experience this rapid expansion, and were seen to decline in abundance
following WD feeding. These findings align with well characterized bacteriophage behavior
11,13,14,29, as well as contradict them such as in the case of Lactococcus phage 1706. Furthermore,
the integration and interconnectivity of bacteriophage genera in the intestinal microbiome
community networks of WD-fed mice provided further evidence of their ability to not only affect
host prevalence, but also a vast multitude of mutualistic relationships within the microbiome.
This idea has been demonstrated by Hsu, et al. where the authors demonstrate the potent
cascading effects of bacteriophage administration on the microbiome community structure, and
the resulting modulation to the metabolome 20. In relation to modulation during WD feeding, we
demonstrated novel relationships between specific microbiome constituents and
pathophysiological metabolic parameters associated with obesity.

155
The intestinal microbiome has gained much attention in respect to its contributions to
mammalian host health. Many studies of the gut microbiome have been focused primarily on
bacterial constituents, utilizing16S amplicon sequencing, as these do account for the majority of
metabolically relevant organisms in the gut microbiota 1,5,32,39. 16S amplicon sequencing,
although sound technology, is lacking in comparison to shotgun metagenomics due to its limited
taxonomic and functional resolution 40. Primers used in 16S amplicon sequencing can also lead
to discordant annotation results 40,41. Our studies utilized shotgun metagenomic sequencing
which allowed for identification other organisms within the microbiome, namely bacteriophage,
as well as enhanced resolution of both functional and taxonomic annotations. The intestinal
microbiome data was then compared with the metabolic phenotype analysis which allowed us to
connect several important aspects of host-microbiome interaction in the context of WD-induced
obesity. Not only did we observe changes that are consistent with existing studies of the
bacteriome in obesity 1,2,42–44, but also we bring into context changes in the phageome in concert
with host metabolic changes. For our study, the distinct advantage of shotgun metagenomics was
the ability to characterize bacteriophage population alongside putative bacterial host. However,
this does not speak to the vast amount of information that can be obtained from these types of big
data sets so long as you have the time and programs to investigate them.
With the surge of antibiotic resistance within recent years, researchers are embracing
the idea of utilizing bacteriophage as therapy for bacterial infections. One noted advantage of
bacteriophage therapy to traditional antibiotics is their high degree of specificity, reducing off-
target impacts on the host’s commensal microbiome 18,45,46. In a similar fashion, bacteriophage
could be utilized to cause depletions of certain bacterial constituents in the intestinal microbiome
in order to bring about homeostasis during diseases such as colitis or obesity. However, recent

156
publications discussed here describe the rippling effects of bacteriophage administration that
could bring about homeostasis or perpetuate disease states of the enteric microbiome 20. Potential
therapies could be developed by understanding the role bacteriophage play during dysbiosis and
applying these lessons to modulate microbial symbionts. Furthermore, bacteriophage
communities could act as an indicator population to help proactively diagnose disruption of
community structure in the intestinal microbiome.
Bacteriophage therapy can also benefit from characterization of bacteriophage behavior
in the context of inflammation. In bacteria, stress responses, such as those triggered by cell DNA
damage, lead to activation of the lytic-lysogenic switch that occurs for temperate bacteriophage
35,47,48. We characterized an enteric bacteriophage isolate’s response to immune-derived
oxidizing reagents to assess the infectivity potential in the presence of immune stressors. Our
work provides context to bacteriophage infection potential during inflammation-induced
bacterial stress. Where these findings may have implications for bacteriophage therapy
efficiency, we think this investigation also expands the understanding of virulent enteric
bacteriophage behavior in an inflammatory environment. Rather than use a lab strain, we used a
bacteriophage isolate from a porcine fecal sample to better describe the potential effects of
mammalian host-derived inflammatory products on bacteria:bacteriophage dynamics within the
intestinal microbiome. This particular isolate, PF-2, proved to be resistant to damage from
hydrogen peroxide and hypochlorous acid when unaccompanied by their host. However, when
bacteriophage were in the presence of their host and immune stressors, differences in replication
efficiencies illustrate the potential for differential responses of bacteriophage. We described the
damaging effects of hydrogen peroxide and hypochlorous acid on adsorption potential of
bacteriophage. However, this did not relate to downstream bacteriophage replication efficiency

157
for all inflammatory products. Similar studies found that hydrogen peroxide was responsible for
inactivation of bacteriophage via damage of nucleic acids, but there was a range of responses
among nucleic acid types 34. In similar concentrations of H2O2, inactivation of RNA phage MS2
occurred rapidly, while this phenomenon occurred more slowly for the double-stranded DNA
phage P22 34. Yet, hydrogen peroxide has been implicated in prophage induction 11,34,48,49. This
may explain the elevated bacteriophage abundance following initiation of inflammation, but it
does not speak to the infectivity potential of the progeny. In the context of the intestinal
environment, microbiome samples of patients suffering from IBD have been reported as having
increase diversity and richness of bacteriophages populations, and this was correlated with a
decline in bacterial diversity 16,17. These results may be due to induction of prophage, but, again,
it may not appropriately illustrate the infectivity potential of free bacteriophage. Additionally,
bacteriophage administration has shown to induce proliferation of neutrophils which could
further perpetuate the phenotype in IBD patients 50. Taken together, bacteriophage therapy may
prove to be less efficient during early onset inflammation due to the accumulation of
granulocytes and their products. Alternatively, other immune-derived antimicrobial agents, such
as hypochlorous acid, can complement actions of bacteriophage. It is intriguing to think that the
action of one enzyme could make a significant difference in the infectivity potential of
bacteriophage in an oxidative environment.
Short-comings, Limitations, and Future work
In recent years, there has been a rise in appreciation of the enteric virome. This is due to
technological advances in metagenomic sequencing, which has given us a reliable method to
examine the complexity within this community. The experimental design of our study allowed us

158
to follow the abundance patterns of a subset of organisms within the virome, the order
Caudovirales, which contains bacteriophage. Of note, our study did not use methods to quantify
enveloped viruses or RNA viruses, and there may be much more to learn about these components
of the enteric virome, especially in the setting of obesity. We targeted bacteriophages in order to
describe the longitudinal shifts in their abundance following diet change as compared to their
bacterial host. To do this, we cross-annotated species annotations (70% identity threshold),
within the order Caudovirales, from the RefSeq database with the International Committee on
Taxonomy of Viruses taxonomic database or other documentation detailing classification of the
bacteriophage into respective genera (descriptions of genera present are outlined in Appendix 1).
One limitation of our study pertained to bacteriophage who were not specifically
classified to a genus. We did see some change in the relative abundance of those who fell in the
unclassified components of our samples but were unable to delve into these relationships. This
limitation is consistent among many enteric bacteriophage investigations and can only be
overcome by significant expansion of bacteriophage annotations within available databases.
Another limitation of our study lies in determining whether a viral annotation was integrated into
the genome of the host, or if it was free living, as bacteriophage were not filtered from fecal
microbiome samples. To accommodate for this, we attempted to identify the lifestyle
characterization of the viral species used to better define the mechanism of abundance change.
This limitation of mis-annotation could still exist even in the event that bacterial and viral
components are separated prior to DNA extraction. To distinguish bacterial components from
integrated prophage will require development of new tools and significant improvement of viral
databases.

159
Limitations in experimental methods or platforms direct the scientific community to
develop improved strategies to answer the deeper questions around them. One such strategy
could aim to characterize bacteria:bacteriophage dynamics and determine which population,
bacteriophage or host, expands first. Different stimuli and development of more sensitive
sampling techniques can help reveal the full range of bacteriophage dynamics. More questions
remain unanswered in the final study, as this was a newly established model of virulent
bacteriophage dynamics. First, we studied a limited range of immune-derived antimicrobial
compounds. Effects of a wider range of antimicrobial agents are necessary for more thorough
descriptions of bacteriophage behavior and infectivity potential in inflammatory environments.
The two reactants, hydrogen peroxide and hypochlorous acid, both resulted in negative effects on
adsorption efficiency. Yet, hypochlorous acid did not display many of the negative effects in
downstream progeny production. Along these lines, more descriptive investigations of receptor
damage and bacteriophage efficiency could give insight as to what cell surface receptors may be
responsible for less efficient adsorption of enteric bacteriophage. The varying responses of
bacteriophage to two reactants that reportedly induce similar bacterial responses calls for more
investigations into the mechanistic characterization of bacteriophage infection during bacterial
stress. These studies could also benefit from parallel quantification of bacterial gene expression
in order to establish correlations between virulent bacteriophage activity and induction of host
stress response in the context of intestinal inflammation. Finally, these studies were performed
on one bacteriophage:host relationship, and may not explain events that occur within the
dynamic environment of the intestinal microbiome. Future investigations could explore these
responses in co-cultures of multiple bacterial isolates and bacteriophage to simulate the nature of

160
community involvement in bacteriophage efficiency during events of stress, similar to the
microbiome environment during intestinal inflammation.
Conclusion
Throughout this collective work, we have characterized the responsive nature of
bacteriophage. In early investigations (Chapters 2 and 3), we discussed the responsive nature of
bacteriophage to WD-feeding, and their role as integral components of the microbiome.
Monitoring abundance patterns of bacteriophage in relation to their host supports the idea that
bacteriophage do not solely react to the abundance functions of their host. In the final portion of
this work, we expand on these ideas and demonstrate that individual bacteriophage can respond
differently to oxidative treatments, even though similar adaptation strategies are utilized by the
host. Collectively, these studies provide evidence that bacteriophage are integral members of
microbial environments that can respond to environmental stimuli regardless of host effects. The
responses of bacteriophage could prove to have greater implications for microbiome modulation
and efficiency of bacteriophage therapy.

161
References
1. Hakkak, R., Korourian, S., Foley, S. L. & Erickson, B. D. Assessment of gut microbiota
populations in lean and obese Zucker rats. PLoS One 12, e0181451 (2017).
2. Turnbaugh, P. J. et al. An obesity-associated gut microbiome with increased capacity for
energy harvest. Nature 444, 1027–1031 (2006).
3. Howe, A. et al. Divergent responses of viral and bacterial communities in the gut
microbiome to dietary disturbances in mice. ISME J. 10, 1217–1227 (2016).
4. Minot, S. et al. The human gut virome: inter-individual variation and dynamic response
to diet. Genome Res. 21, 1616–1625 (2011).
5. Turnbaugh, P. J. et al. The effect of diet on the human gut microbiome: a metagenomic
analysis in humanized gnotobiotic mice. Sci. Transl. Med. 1, 6ra14 (2009).
6. Samson, J. E. & Moineau, S. Characterization of Lactococcus lactis phage 949 and
comparison with other lactococcal phages. Appl. Environ. Microbiol. 76, 6843–52
(2010).
7. Blatny, J. M., Godager, L., Lunde, M. & Nes, I. F. Complete genome sequence of the
Lactococcus lactis temperate phage φLC3: comparative analysis of φLC3 and its relatives
in lactococci and streptococci. Virology 318, 231–244 (2004).
8. Christiansen, B., Johnsen, M. G., Stenby, E., Vogensen, F. K. & Hammer, K.
Characterization of the lactococcal temperate phage TP901-1 and its site-specific
integration. J. Bacteriol. 176, 1069–76 (1994).

162
9. Abedon, S. T. Kinetics of phage-mediated biocontrol of bacteria. Foodborne Pathogens
and Disease vol. 6 807–815 (2009).
10. Hyman, P. Bacteriophages and Nanostructured Materials. in Advances in Applied
Microbiology vol. 78 55–73 (Academic Press Inc., 2012).
11. Ofir, G. & Sorek, R. Contemporary Phage Biology: From Classic Models to New
Insights. Cell (2018) doi:10.1016/j.cell.2017.10.045.
12. Thingstad, T. & Lignell, R. Theoretical models for the control of bacterial growth rate,
abundance, diversity and carbon demand. Aquat. Microb. Ecol. 13, 19–27 (1997).
13. Knowles, B. et al. Lytic to temperate switching of viral communities. Nature (2016)
doi:10.1038/nature17193.
14. Silveira, C. B. & Rohwer, F. L. Piggyback-the-Winner in host-associated microbial
communities. npj Biofilms Microbiomes 2, 16010 (2016).
15. Hsu, B. B. et al. Dynamic Modulation of the Gut Microbiota and Metabolome by
Bacteriophages in a Mouse Model. Cell Host Microbe 25, 803-814.e5 (2019).
16. Norman, J. M. et al. Disease-specific alterations in the enteric virome in inflammatory
bowel disease. Cell 160, 447–60 (2015).
17. Manrique, P. et al. Healthy human gut phageome. Proc. Natl. Acad. Sci. U. S. A. 113,
10400–10405 (2016).
18. Sybesma, W. et al. Bacteriophages as potential treatment for urinary tract infections.
Front. Microbiol. 7, (2016).

163
19. Ul Haq, I., Chaudhry, W. N., Akhtar, M. N., Andleeb, S. & Qadri, I. Bacteriophages and
their implications on future biotechnology: A review. Virology Journal vol. 9 (2012).
20. Hsu, B. B. et al. Dynamic Modulation of the Gut Microbiota and Metabolome by
Bacteriophages in a Mouse Model. Cell Host Microbe 25, 803-814.e5 (2019).
21. Lemire, S., Figueroa-Bossi, N. & Bossi, L. Bacteriophage crosstalk: Coordination of
prophage induction by Trans-Acting antirepressors. PLoS Genet. 7, e1002149 (2011).
22. Campoy, S. et al. Induction of the SOS response by bacteriophage lytic development in
Salmonella enterica. Virology 351, 360–367 (2006).
23. Little, J. W. Chance phenotypic variation. Trends Biochem. Sci. 15, 138 (1990).
24. Miyazaki, R. et al. Cellular Variability of RpoS Expression Underlies Subpopulation
Activation of an Integrative and Conjugative Element. PLoS Genet. 8, e1002818 (2012).
25. Broussard, G. W. et al. Integration-Dependent Bacteriophage Immunity Provides Insights
into the Evolution of Genetic Switches. Mol. Cell 49, 237–248 (2013).
26. Nanda, A. M. et al. Analysis of SOS-induced spontaneous prophage induction in
Corynebacterium glutamicum at the single-cell level. J. Bacteriol. 196, 180–188 (2014).
27. Smith, C. L. & Oishi, M. Early events and mechanisms in the induction of bacterial SOS
functions: Analysis of the phage repressor inactivation process in vivo. Proc. Natl. Acad.
Sci. U. S. A. 75, 1657–1661 (1978).
28. Erez, Z. et al. Communication between viruses guides lysis-lysogeny decisions. Nature
541, (2017).
164
29. Guenther, S., Huwyler, D., Richard, S. & Loessner, M. J. Virulent bacteriophage for
efficient biocontrol of Listeria monocytogenes in ready-to-eat foods. Appl. Environ.
Microbiol. 75, 93–100 (2009).
30. Rodriguez-Valera, F. et al. Explaining microbial population genomics through phage
predation. Nat. Rev. Microbiol. 7, 828–836 (2009).
31. Scanlan, P. D. Bacteria–Bacteriophage Coevolution in the Human Gut: Implications for
Microbial Diversity and Functionality. Trends in Microbiology vol. 25 614–623 (2017).
32. Muegge, B. D. et al. Diet Drives Convergence in Gut Microbiome Functions Across
Mammalian Phylogeny and Within Humans. Science (80-. ). 332, 970–974 (2011).
33. Dukan, S., Danie`, D. & Touati, D. Hypochlorous Acid Stress in Escherichia coli:
Resistance, DNA Damage, and Comparison with Hydrogen Peroxide Stress. JOURNAL
OF BACTERIOLOGY vol. 178 http://jb.asm.org/ (1996).
34. Yamamoto, N. Damage, repair, and recombination. II. Effect of hydrogen peroxide on the
bacteriophage genome. Virology 38, 457–463 (1969).
35. Bacterial Stress Responses, Second Edition. Bacterial Stress Responses, Second Edition
(American Society of Microbiology, 2011). doi:10.1128/9781555816841.
36. McKenna, S. M. & Davies, K. J. The inhibition of bacterial growth by hypochlorous acid.
Possible role in the bactericidal activity of phagocytes. Biochem. J. 254, 685–92 (1988).
37. Houk, V. S. & DeMarini, D. M. Induction of prophage lambda by chlorinated pesticides.
Mutat. Res. Mutagen. Relat. Subj. 182, 193–201 (1987).
165
38. Casjens, S. et al. The Chromosome of Shigella flexneri Bacteriophage Sf6: Complete
Nucleotide Sequence, Genetic Mosaicism, and DNA Packaging. J. Mol. Biol. 339, 379–
394 (2004).
39. Trosvik, P., Stenseth, N. C. & Rudi, K. Convergent temporal dynamics of the human
infant gut microbiota. ISME J. 4, 151–158 (2010).
40. Jovel, J. et al. Characterization of the Gut Microbiome Using 16S or Shotgun
Metagenomics. Front. Microbiol. 7, 459 (2016).
41. Frank, J. A. et al. Critical evaluation of two primers commonly used for amplification of
bacterial 16S rRNA genes. Appl. Environ. Microbiol. 74, 2461–2470 (2008).
42. Backhed, F. et al. The gut microbiota as an environmental factor that regulates fat
storage. Proc. Natl. Acad. Sci. 101, 15718–15723 (2004).
43. David, L. A. et al. Diet rapidly and reproducibly alters the human gut microbiome.
Nature 505, 559–563 (2014).
44. Ley, R. E., Turnbaugh, P. J., Klein, S. & Gordon, J. I. Microbial ecology: Human gut
microbes associated with obesity. Nature 444, 1022–1023 (2006).
45. Mai, V., Ukhanova, M., Reinhard, M. K., Li, M. & Sulakvelidze, A. Bacteriophage
administration significantly reduces shigella colonization and shedding by shigella-
challenged mice without deleterious side effects and distortions in the gut microbiota.
Bacteriophage (2015) doi:10.1080/21597081.2015.1088124.
46. Danis-Wlodarczyk, K. et al. A proposed integrated approach for the preclinical
evaluation of phage therapy in Pseudomonas infections. Sci. Rep. 6, 28115 (2016).

166
47. Howard-Varona, C., Hargreaves, K. R., Abedon, S. T. & Sullivan, M. B. Lysogeny in
nature: Mechanisms, impact and ecology of temperate phages. ISME Journal (2017)
doi:10.1038/ismej.2017.16.
48. Selva, L. et al. Killing niche competitors by remote-control bacteriophage induction.
Proc. Natl. Acad. Sci. U. S. A. 106, 1234–1238 (2009).
49. Role of catalase in SOS induction by H2O2. (A) Survival of S. aureus... | Download
Scientific Diagram. https://www.researchgate.net/figure/Role-of-catalase-in-SOS-
induction-by-H2O2-A-Survival-of-S-aureus-strains-in-media_fig2_23785136.
50. Weber-Dabrowska, B., Zimecki, M., Mulczyk, M. & Górski, A. Effect of phage therapy
on the turnover and function of peripheral neutrophils. FEMS Immunol. Med. Microbiol.
34, 135–8 (2002).

167
Appendix 1. Bacteriophage Genera Characteristics Database
Information collected from ICTV144 and other literature in order to annotate species within the order Caudovirales Family Subfamily Genera Lifestyle Present Within
Sample Host Family Reference Myoviridae 0305phi8-36-like viruses Virulent Bacillaceae 145 Siphoviridae 1706-like viruses Virulent Streptococcaceae 146 Siphoviridae 3a-like viruses Virulent and Temperate Staphylococcus 76,147 Siphoviridae 77-like viruses Temperate Staphylococcus 148 Siphoviridae 936-like viruses Virulent Streptococcaceae 149,150 Podoviridae Bcep22-like viruses Virulent Burkholderiaceae 151 Myoviridae Bcep781-like viruses Virulent Burkholderiaceae 76,152,153 Myoviridae BcepMu-like viruses Temperate Burkholderiaceae 154 Podoviridae Bpp-1-like viruses Temperate Alcaligenaceae, Burkholderia 76,155 Siphoviridae c2-like viruses Virulent Streptococcaceae 77,149,156,157 Siphoviridae Che8-like viruses Mostly Temperate (1 Unknown) Enterobacteriaceae 158 Siphoviridae CJW1-like viruses Virulent Mycobacteriaceae 158,159 unclassified Cvm10-like viruses Virulent Enterobacteriaceae 160 Siphoviridae D3112-like viruses Unknown Pseudomonadaceae 161,162 Siphoviridae D3-like viruses Temperate Pseudomonadaceae 163 Podoviridae Epsilon15-like viruses Temperate Enterobacteriaceae 164,165 Podoviridae F116-like viruses Temperate Pseudomonadaceae 166 Myoviridae FelixO1-like viruses Virulent Enterobacteriaceae 167 Myoviridae HAP1-like viruses Temperate Halomonadaceae 103,168 Siphoviridae HK578-like viruses Virulent Enterobacteriaceae 169 Myoviridae Peduovirinae HP1-like viruses Temperate Pasteurellaceae 76,170,171 Siphoviridae IEBH-like viruses Temperate Bacillaceae 172 Siphoviridae Guernseyvirinae Jersey-like viruses Virulent Enterobacteriaceae 173,174 Myoviridae Tevenvirinae JS98-like viruses Unknown Enterobacteriaceae Myoviridae Spounavirinae K-like viruses Virulent Staphylococcus 76 Podoviridae Autogrphivirinae KP34-like viruses Virulent Enterobacteriaceae 175,176 Siphoviridae L5-like viruses Virulent and Temperate Mycobacteriaceae 158,159,177 Siphoviridae Lambda-like viruses Temperate Multiple 178–183 Siphoviridae Lebron-like viruses Temperate Mycobacteriaceae 158 Podoviridae LUZ24-like viruses Temperate Pseudomonadaceae 184 Podoviridae N4-like viruses Virulent Enterobacteriaceae 185 Siphoviridae Omega-like viruses Temperate Mycobacteriaceae 158 Myoviridae Spounavirinae P100-like viruses Virulent Listeriaceae 134 Myoviridae P1-like viruses Temperate Enterobacteriaceae 64,186 Podoviridae P22-like viruses Temperate Enterobacteriaceae 76,110,181,187–189 Siphoviridae P23-45-like viruses Virulent Thermaceae 190 Myoviridae Peduovirinae P2-like viruses Temperate Burkholderiaceae, Enterobacteraceae 75,181,187,191,192 Siphoviridae P335-like viruses Virulent and Temperate Streptococcaceae 64,76,77,79 Podoviridae Picovirinae P68-like viruses Virulent Staphylococcus, Streptococcus 193,194 Myoviridae PAKP1-like viruses Unknown Vibrionaceae Myoviridae PB1-like viruses Virulent Burkholderiaceae 75,195 Podoviridae Picovirinae Phi29-like viruses Virulent Bacillaceae, Streptococcaceae 196 Siphoviridae PhiC31-like viruses Temperate Streptomycetaceae 197 Myoviridae phiCD119-like viruses Temperate Clostridaceae 74,198–200 Siphoviridae phiE125-like viruses Temperate Burkholderia 152 Siphoviridae phiETA-like viruses Temperate Staphylococcus 64,76,147,185,201,202 Siphoviridae phiFL-like viruses Temperate Enterococcaceae 203 Podoviridae Autogrphivirinae phiKMV-like viruses Virulent Pseudomonadaceae 176 Myoviridae phiKZ-like viruses Virulent Pseudomonadaceae 142 Siphoviridae phiLJ1-like viruses Virulent Lactobacillaceae 204 Myoviridae phiPLPE-like viruses Virulent and Temperate Pateurellaceae 205,206 Siphoviridae PsiM1-like viruses Unknown Methanobacteriaceae Myoviridae Tevenvirinae RB49-like viruses Virulent Enterobacteriaceae 207 Myoviridae rV5-like viruses Virulent Enterobacteriaceae 164,208 Myoviridae Tevenvirinae Schizot4-like viruses Virulent Vibrionaceae 207 Myoviridae Secunda5-like viruses Virulent Aeromonadaceae 207 Siphoviridae Sfi11-like viruses Virulent and Temperate Streptococcaceae 76,209–211 Siphoviridae Sfi21-like viruses Virulent and Temperate Clostridium, Streptococcaceae 76,199,210,212 Myoviridae Tevenvirinae SP18-like viruses Virulent Enterobacteriaceae 127,213,214 Podoviridae Autogrphivirinae SP6-like viruses Virulent Enterobacteriaceae 76,181,187 Siphoviridae SPbeta-like viruses Temperate Bacillaceae 215 Myoviridae Spounavirinae SPO1-like viruses Virulent Bacillaceae 76,187 Myoviridae Tevenvirinae T4-like viruses Virulent Multiple 64,76,207,216–218 Siphoviridae T5-like viruses Virulent Enterobacteriaceae 76,219 Podoviridae Autogrphivirinae T7-like viruses Virulent Enterobacteriaceae 64,76,181,185,187,220–222 Siphoviridae TM4-like viruses Virulent Mycobacteriaceae 177,223 Siphoviridae TP21-like viruses Temperate Bacillaceae 99 Myoviridae Spounavirinae Twort-like viruses Virulent Staphylococcus 76 Myoviridae VHML-like viruses Temperate Vibrionaceae 76 Myoviridae Vi1-like viruses Virulent Comamonadeceae 224 Siphoviridae Wbeta-like viruses Temperate Bacillaceae 99 Siphoviridae Xp10-like viruses Virulent Xanthomonadaceae 76,225 Siphoviridae Yua-like viruses Temperate Alphaproteobacteria 226
168
References 1. Chassaing, B., Aitken, J. D., Gewirtz, A. T. & Vijay-Kumar, M. Gut Microbiota Drives
Metabolic Disease in Immunologically Altered Mice. in Advances in Immunology vol. 116 93–112 (Academic Press Inc., 2012).
2. Turnbaugh, P. J. et al. The effect of diet on the human gut microbiome: a metagenomic analysis in humanized gnotobiotic mice. Sci. Transl. Med. 1, 6ra14 (2009).
3. Lander, E. S. et al. Initial sequencing and analysis of the human genome. Nature 409, 860–921 (2001).
4. A review of 10 years of human microbiome research activities at the US National Institutes of Health, Fiscal Years 2007-2016. Microbiome vol. 7 31 (2019).
5. Muller, P. A. et al. Crosstalk between muscularis macrophages and enteric neurons regulates gastrointestinal motility. Cell 158, 300–313 (2014).
6. Weinstock, G. M. Genomic approaches to studying the human microbiota. Nature vol. 489 250–256 (2012).
7. Wagatsuma, K. et al. Diversity of Gut Microbiota Affecting Serum Level of Undercarboxylated Osteocalcin in Patients with Crohn’s Disease. Nutrients 11, (2019).
8. HAMER, H. M. et al. Review article: the role of butyrate on colonic function. Aliment. Pharmacol. Ther. 27, 104–119 (2007).
9. Cani, P. D. Human gut microbiome: hopes, threats and promises. Gut gutjnl-2018-316723 (2018) doi:10.1136/gutjnl-2018-316723.
10. HOSHI, H. et al. Lymph Follicles and Germinal Centers in Popliteal lymph Nodes and Other Lymphoid Tissues of Germ-Free and Conventional Rats. Tohoku J. Exp. Med. 166, 297–307 (1992).
11. Hapfelmeier, S. et al. Reversible microbial colonization of germ-free mice reveals the dynamics of IgA immune responses. Science (80-. ). 328, 1705–1709 (2010).
12. Lopetuso, L. R., Ianiro, G., Scaldaferri, F., Cammarota, G. & Gasbarrini, A. Gut Virome and Inflammatory Bowel Disease. Inflamm. Bowel Dis. 22, 1708–1712 (2016).
13. Obata, Y. & Pachnis, V. The Effect of Microbiota and the Immune System on the Development and Organization of the Enteric Nervous System. Gastroenterology vol. 151 836–844 (2016).
14. Trosvik, P., Stenseth, N. C. & Rudi, K. Convergent temporal dynamics of the human infant gut microbiota. ISME J. 4, 151–158 (2010).
15. Hepworth, M. R. et al. Group 3 innate lymphoid cells mediate intestinal selection of commensal bacteria-specific CD4+ T cells. Science (80-. ). 348, 1031–1035 (2015).
16. Virgin, H. W. The virome in mammalian physiology and disease. Cell vol. 157 142–150 (2014).
17. Human Microbiome Project Consortium. Structure, function and diversity of the healthy human microbiome. Nature 486, 207–214 (2012).
18. Edwards, L. A. et al. Aberrant response to commensal Bacteroides thetaiotaomicron in Crohn’s disease: An ex vivo human organ culture study. Inflamm. Bowel Dis. 17, 1201–1208 (2011).
19. Duncan, S. H. et al. Reduced dietary intake of carbohydrates by obese subjects results in decreased concentrations of butyrate and butyrate-producing bacteria in feces. Appl. Environ. Microbiol. 73, 1073–8 (2007).
20. Ridaura, V. K. et al. Gut microbiota from twins discordant for obesity modulate metabolism in mice. Science 341, 1241214 (2013).

169
21. Ley, R. E., Turnbaugh, P. J., Klein, S. & Gordon, J. I. Microbial ecology: Human gut microbes associated with obesity. Nature 444, 1022–1023 (2006).
22. Turnbaugh, P. J. et al. An obesity-associated gut microbiome with increased capacity for energy harvest. Nature 444, 1027–1031 (2006).
23. Ofir, G. & Sorek, R. Contemporary Phage Biology: From Classic Models to New Insights. Cell (2018) doi:10.1016/j.cell.2017.10.045.
24. Manrique, P. et al. Healthy human gut phageome. Proc. Natl. Acad. Sci. U. S. A. 113, 10400–10405 (2016).
25. Norman, J. M. et al. Disease-specific alterations in the enteric virome in inflammatory bowel disease. Cell 160, 447–60 (2015).
26. Minot, S. et al. The human gut virome: inter-individual variation and dynamic response to diet. Genome Res. 21, 1616–25 (2011).
27. Reyes, A. et al. Viruses in the faecal microbiota of monozygotic twins and their mothers. Nature 466, 334–338 (2010).
28. Huttenhower, C. et al. Structure, function and diversity of the healthy human microbiome. Nature 486, 207–214 (2012).
29. Kobyliak, N., Virchenko, O. & Falalyeyeva, T. Pathophysiological role of host microbiota in the development of obesity. Nutr. J. 15, 43 (2016).
30. Parekh, P. J., Arusi, E., Vinik, A. I. & Johnson, D. A. The role and influence of gut microbiota in pathogenesis and management of obesity and metabolic syndrome. Frontiers in Endocrinology vol. 5 (2014).
31. Thaiss, C. A. et al. Hyperglycemia drives intestinal barrier dysfunction and risk for enteric infection. Science (80-. ). 359, (2018).
32. Howe, A. et al. Divergent responses of viral and bacterial communities in the gut microbiome to dietary disturbances in mice. ISME J. 10, 1217–1227 (2016).
33. Vernocchi, P., Del Chierico, F. & Putignani, L. Gut microbiota profiling: Metabolomics based approach to unravel compounds affecting human health. Frontiers in Microbiology vol. 7 (2016).
34. Sun, L. et al. Insights into the role of gut microbiota in obesity: pathogenesis, mechanisms, and therapeutic perspectives. Protein Cell 9, 397 (2018).
35. Duncan, S. H. et al. Human colonic microbiota associated with diet, obesity and weight loss. Int. J. Obes. 32, 1720–1724 (2008).
36. Minot, S. et al. The human gut virome: inter-individual variation and dynamic response to diet. Genome Res. 21, 1616–1625 (2011).
37. Ryan, G. B. & Majno, G. Acute inflammation. A review. Am. J. Pathol. 86, 183–276 (1977).
38. Goldman, H. Acute versus chronic colitis: How and when to distinguish by biopsy. Gastroenterology vol. 86 (1984).
39. Samanta, A. K., Torok, V. A., Percy, N. J., Abimosleh, S. M. & Howarth, G. S. Microbial fingerprinting detects unique bacterial communities in the faecal microbiota of rats with experimentally-induced colitis. J. Microbiol. 50, 218–225 (2012).
40. Wen, Z. & Fiocchi, C. Inflammatory bowel disease: Autoimmune or immune-mediated pathogenesis? in Clinical and Developmental Immunology vol. 11 195–204 (2004).
41. Skaar, E. P. The Battle for Iron between Bacterial Pathogens and Their Vertebrate Hosts. PLoS Pathog. 6, e1000949 (2010).
42. Ron, E. Z. Bacterial Stress Response. in The Prokaryotes 1012–1027 (Springer New

170
York, 2006). doi:10.1007/0-387-30742-7_32. 43. Wilson, B. A., Salyers, A. A., Whitt, D. D. & Winkler, M. E. Bacterial Pathogenesis.
Bacterial Pathogenesis (American Society of Microbiology, 2011). doi:10.1128/9781555816162.
44. Bacterial Stress Responses, Second Edition. Bacterial Stress Responses, Second Edition (American Society of Microbiology, 2011). doi:10.1128/9781555816841.
45. Smith, C. L. & Oishi, M. Early events and mechanisms in the induction of bacterial SOS functions: Analysis of the phage repressor inactivation process in vivo. Proc. Natl. Acad. Sci. U. S. A. 75, 1657–1661 (1978).
46. Gogokhia, L. et al. Expansion of Bacteriophages Is Linked to Aggravated Intestinal Inflammation and Colitis. Cell Host Microbe 25, 285-299.e8 (2019).
47. Barr, J. J. et al. Bacteriophage adhering to mucus provide a non–host-derived immunity. Proc. Natl. Acad. Sci. 110, 10771–10776 (2013).
48. Appelmans, R. Le dosage du bactériophage. Compt Rend Soc Biol 85, 701 (1921). 49. World Health Organization. Overweight and obesity fact sheet. (2016). 50. Hales, C. M., Carroll, M. D., Fryar, C. D. & Ogden, C. L. Prevalence of Obesity Among
Adults and Youth: United States, 2015-2016 Key findings Data from the National Health and Nutrition Examination Survey. https://www.cdc.gov/nchs/data/databriefs/db288_table.pdf#1. (2015).
51. Popkin, B. M. & Gordon-Larsen, P. The nutrition transition: Worldwide obesity dynamics and their determinants. Int. J. Obes. 28, S2–S9 (2004).
52. Popkin, B. M., Adair, L. S. & Ng, S. W. Global nutrition transition and the pandemic of obesity in developing countries. Nutr. Rev. 70, 3–21 (2012).
53. Klein, S. et al. Weight management through lifestyle modification for the prevention and management of type 2 diabetes: Rationale and strategies. A statement of the American Diabetes Association, the North American Association for the Study of Obesity, and the American Society for Clinical Nutrition. American Journal of Clinical Nutrition vol. 80 257–263 (2004).
54. Singh, S., Dulai, P. S., Zarrinpar, A., Ramamoorthy, S. & Sandborn, W. J. Obesity in IBD: Epidemiology, pathogenesis, disease course and treatment outcomes. Nature Reviews Gastroenterology and Hepatology vol. 14 110–121 (2017).
55. Goodwin, P. J. & Stambolic, V. Impact of the Obesity Epidemic on Cancer. Annu. Rev. Med. 66, 281–296 (2015).
56. Hollister, E. B., Gao, C. & Versalovic, J. Compositional and functional features of the gastrointestinal microbiome and their effects on human health. Gastroenterology 146, 1449–58 (2014).
57. Cantarel, B. L., Lombard, V. & Henrissat, B. Complex Carbohydrate Utilization by the Healthy Human Microbiome. PLoS One 7, e28742 (2012).
58. Sonnenburg, E. D. et al. Diet-induced extinctions in the gut microbiota compound over generations. Nature 529, 212–5 (2016).
59. Ul Haq, I., Chaudhry, W. N., Akhtar, M. N., Andleeb, S. & Qadri, I. Bacteriophages and their implications on future biotechnology: A review. Virology Journal vol. 9 (2012).
60. Reyes, A., Wu, M., McNulty, N. P., Rohwer, F. L. & Gordon, J. I. Gnotobiotic mouse model of phage-bacterial host dynamics in the human gut. Proc. Natl. Acad. Sci. U. S. A. 110, 20236–41 (2013).
61. FASTX-Toolkit. http://hannonlab.cshl.edu/fastx_toolkit/.

171
62. Bolger, A. M., Lohse, M. & Usadel, B. Trimmomatic: a flexible trimmer for Illumina sequence data. Bioinformatics 30, 2114–2120 (2014).
63. Meyer, F. et al. The metagenomics RAST server – a public resource for the automatic phylogenetic and functional analysis of metagenomes. BMC Bioinformatics 9, 386 (2008).
64. International Committee on Taxonomy of Viruses. & King, A. Virus taxonomy : ninth report of the International Committee on Taxonomy of Viruses. (Elsevier, 2011).
65. R Core Team. R: A language and environment for statistical computing. (2014). 66. Dixon, P. VEGAN, a package of R functions for community ecology. J. Veg. Sci. 14,
927–930 (2003). 67. Pohlert, T. trend: Non-Parametric Trend Tests and Change-Point Detection. R Packag.
version 1.1.0 (2018). 68. Revelle, W. R. psych: Procedures for Personality and Psychological Research. (2017). 69. Kassambara, A. ggcorrplot: Visualization of a correlation matrix using ggplot2.
https://github.com/kassambara/ggcorrplot (2015). 70. Zhu, C. & Yu, J. Nonmetric multidimensional scaling corrects for population structure in
association mapping with different sample types. Genetics 182, 875–88 (2009). 71. Shreiner, A. B., Kao, J. Y. & Young, V. B. The gut microbiome in health and in disease.
Curr. Opin. Gastroenterol. 31, 69–75 (2015). 72. Ziętak, M. et al. Altered Microbiota Contributes to Reduced Diet-Induced Obesity upon
Cold Exposure. Cell Metab. 23, 1216–1223 (2016). 73. David, L. A. et al. Diet rapidly and reproducibly alters the human gut microbiome. Nature
505, (2014). 74. Hargreaves, K. R. & Clokie, M. R. J. A Taxonomic Review of Clostridium difficile
Phages and Proposal of a Novel Genus, "Phimmp04likevirus". Viruses 7, 2534–41 (2015).
75. Lavigne, R. et al. Classification of Myoviridae bacteriophages using protein sequence similarity. BMC Microbiol. 9, 224 (2009).
76. ACLAME: Phages lifestyle. http://aclame.ulb.ac.be/Classification/Phages/life_style.html. 77. Labrie, S. & Moineau, S. Multiplex PCR for Detection and Identification of Lactococcal
Bacteriophages. Appl. Environ. Microbiol. 66, 987–994 (2000). 78. Blatny, J. M., Godager, L., Lunde, M. & Nes, I. F. Complete genome sequence of the
Lactococcus lactis temperate phage φLC3: comparative analysis of φLC3 and its relatives in lactococci and streptococci. Virology 318, 231–244 (2004).
79. Samson, J. E. & Moineau, S. Characterization of Lactococcus lactis phage 949 and comparison with other lactococcal phages. Appl. Environ. Microbiol. 76, 6843–52 (2010).
80. Christiansen, B., Johnsen, M. G., Stenby, E., Vogensen, F. K. & Hammer, K. Characterization of the lactococcal temperate phage TP901-1 and its site-specific integration. J. Bacteriol. 176, 1069–76 (1994).
81. Everard, A. et al. Cross-talk between Akkermansia muciniphila and intestinal epithelium controls diet-induced obesity. Proc. Natl. Acad. Sci. U. S. A. 110, 9066–71 (2013).
82. Jovel, J. et al. Characterization of the Gut Microbiome Using 16S or Shotgun Metagenomics. Front. Microbiol. 7, 459 (2016).
83. Hakkak, R., Korourian, S., Foley, S. L. & Erickson, B. D. Assessment of gut microbiota populations in lean and obese Zucker rats. PLoS One 12, e0181451 (2017).
84. Backhed, F. et al. The gut microbiota as an environmental factor that regulates fat storage. Proc. Natl. Acad. Sci. 101, 15718–15723 (2004).
172
85. Scanlan, P. D. Bacteria–Bacteriophage Coevolution in the Human Gut: Implications for Microbial Diversity and Functionality. Trends in Microbiology vol. 25 614–623 (2017).
86. Hsu, B. B. et al. Dynamic Modulation of the Gut Microbiota and Metabolome by Bacteriophages in a Mouse Model. Cell Host Microbe 25, 803-814.e5 (2019).
87. Hsu, B. B. et al. Dynamic Modulation of the Gut Microbiota and Metabolome by Bacteriophages in a Mouse Model. Cell Host Microbe 25, 803-814.e5 (2019).
88. Sender, R., Fuchs, S. & Milo, R. Revised Estimates for the Number of Human and Bacteria Cells in the Body. PLOS Biol. 14, e1002533 (2016).
89. Zuo, T. et al. Gut mucosal virome alterations in ulcerative colitis. Gut gutjnl-2018-318131 (2019) doi:10.1136/gutjnl-2018-318131.
90. Chang, J. Y. et al. Decreased Diversity of the Fecal Microbiome in Recurrent Clostridium difficile –Associated Diarrhea. J. Infect. Dis. 197, 435–438 (2008).
91. Le Roy, T. et al. Intestinal microbiota determines development of non-alcoholic fatty liver disease in mice. Gut 62, 1787–1794 (2013).
92. Zhu, W. et al. Gut Microbial Metabolite TMAO Enhances Platelet Hyperreactivity and Thrombosis Risk. Cell 165, 111–124 (2016).
93. Hsiao, E. Y. et al. Microbiota modulate behavioral and physiological abnormalities associated with neurodevelopmental disorders. Cell 155, 1451–1463 (2013).
94. Li, H. & Durbin, R. Fast and accurate short read alignment with Burrows-Wheeler transform. Bioinformatics 25, 1754–1760 (2009).
95. Li, H. et al. The Sequence Alignment/Map format and SAMtools. Bioinformatics 25, 2078–2079 (2009).
96. Kurtz, Z. D. et al. Sparse and Compositionally Robust Inference of Microbial Ecological Networks. PLoS Comput. Biol. 11, (2015).
97. Csardi, G., & Nepusz, T. The Igraph Software Package for Complex Network Research. InterJournal 2006, Complex Systems, 1695. - References - Scientific Research Publishing. https://www.scirp.org/(S(vtj3fa45qm1ean45vvffcz55))/reference/ReferencesPapers.aspx?ReferenceID=1426710 (2006).
98. Ernst, J. & Bar-Joseph, Z. STEM: a tool for the analysis of short time series gene expression data. BMC Bioinformatics 7, 191 (2006).
99. Klumpp, J., Calendar, R. & Loessner, M. J. Complete Nucleotide Sequence and Molecular Characterization of Bacillus Phage TP21 and its Relatedness to Other Phages with the Same Name. Viruses 2, 961–71 (2010).
100. Thingstad, T. & Lignell, R. Theoretical models for the control of bacterial growth rate, abundance, diversity and carbon demand. Aquat. Microb. Ecol. 13, 19–27 (1997).
101. Silveira, C. B. & Rohwer, F. L. Piggyback-the-Winner in host-associated microbial communities. npj Biofilms Microbiomes 2, 16010 (2016).
102. Dutilh, B. E. et al. A highly abundant bacteriophage discovered in the unknown sequences of human faecal metagenomes. Nat. Commun. (2014) doi:10.1038/ncomms5498.
103. Mobberley, J. M., Authement, R. N., Segall, A. M. & Paul, J. H. The temperate marine phage PhiHAP-1 of Halomonas aquamarina possesses a linear plasmid-like prophage genome. J. Virol. 82, 6618–30 (2008).
104. Knowles, B. et al. Lytic to temperate switching of viral communities. Nature (2016) doi:10.1038/nature17193.
105. Little, J. W. Chance phenotypic variation. Trends Biochem. Sci. 15, 138 (1990). 106. Miyazaki, R. et al. Cellular Variability of RpoS Expression Underlies Subpopulation

173
Activation of an Integrative and Conjugative Element. PLoS Genet. 8, e1002818 (2012). 107. Nanda, A. M. et al. Analysis of SOS-induced spontaneous prophage induction in
Corynebacterium glutamicum at the single-cell level. J. Bacteriol. 196, 180–188 (2014). 108. Broussard, G. W. et al. Integration-Dependent Bacteriophage Immunity Provides Insights
into the Evolution of Genetic Switches. Mol. Cell 49, 237–248 (2013). 109. Erez, Z. et al. Communication between viruses guides lysis-lysogeny decisions. Nature
541, (2017). 110. Casjens, S. et al. The Chromosome of Shigella flexneri Bacteriophage Sf6: Complete
Nucleotide Sequence, Genetic Mosaicism, and DNA Packaging. J. Mol. Biol. 339, 379–394 (2004).
111. Lemire, S., Figueroa-Bossi, N. & Bossi, L. Bacteriophage crosstalk: Coordination of prophage induction by Trans-Acting antirepressors. PLoS Genet. 7, e1002149 (2011).
112. Campoy, S. et al. Induction of the SOS response by bacteriophage lytic development in Salmonella enterica. Virology 351, 360–367 (2006).
113. Anderson, T. F. The Influence of Temperature and Nutrients on Plaque Formation by Bacteriophages Active on Escherichia coli Strain B. J. Bacteriol. 55, 659 (1948).
114. Moebus, K. Marine bacteriophage reproduction under nutrient-limited growth of host bacteria. II. Investigations with phage-host system [H3:H3/1]. Mar. Ecol. Prog. Ser. 144, 13–22 (1996).
115. Barr, J. J., Youle, M. & Rohwer, F. Innate and acquired bacteriophage-mediated immunity. Bacteriophage 3, e25857 (2013).
116. Hurst, J. K., Barrette, W. C., Michel, B. R. & Rosen, H. Hypochlorous acid and myeloperoxidase-catalyzed oxidation of iron-sulfur clusters in bacterial respiratory dehydrogenases. Eur. J. Biochem. 202, 1275–82 (1991).
117. De Oliveira, S., Rosowski, E. E. & Huttenlocher, A. Neutrophil migration in infection and wound repair: Going forward in reverse. Nature Reviews Immunology vol. 16 378–391 (2016).
118. Dukan, S., Danie`, D. & Touati, D. Hypochlorous Acid Stress in Escherichia coli: Resistance, DNA Damage, and Comparison with Hydrogen Peroxide Stress. JOURNAL OF BACTERIOLOGY vol. 178 http://jb.asm.org/ (1996).
119. Howard-Varona, C., Hargreaves, K. R., Abedon, S. T. & Sullivan, M. B. Lysogeny in nature: Mechanisms, impact and ecology of temperate phages. ISME Journal (2017) doi:10.1038/ismej.2017.16.
120. Weber-Dabrowska, B., Zimecki, M., Mulczyk, M. & Górski, A. Effect of phage therapy on the turnover and function of peripheral neutrophils. FEMS Immunol. Med. Microbiol. 34, 135–8 (2002).
121. One step multiplication curve for bacteriophages. – Biotech Khan. https://biotechkhan.wordpress.com/2014/07/01/one-step-multiplication-curve-for-bacteriophages/.
122. One step multiplication curve for bacteriophages. – Biotech Khan. https://biotechkhan.wordpress.com/2014/07/01/one-step-multiplication-curve-for-bacteriophages/.
123. Clokie, M. R. J., Kropinski, A. M. (Andrew M. B. & Lavigne, R. Bacteriophages : methods and protocols.
124. Hu, B., Margolin, W., Molineux, I. J. & Liu, J. The bacteriophage T7 virion undergoes extensive structural remodeling during infection. Science (80-. ). 339, 576–579 (2013).

174
125. McKenna, S. M. & Davies, K. J. A. The inhibition of bacterial growth by hypochlorous acid. Possible role in the bactericidal activity of phagocytes. Biochem. J. 254, 685–692 (1988).
126. Storms, Z. J., Smith, L., Sauvageau, D. & Cooper, D. G. Modeling bacteriophage attachment using adsorption efficiency. Biochem. Eng. J. 64, 22–29 (2012).
127. Jun, J. W. et al. Bacteriophage application to control the contaminated water with Shigella. Sci. Rep. 6, 22636 (2016).
128. Selva, L. et al. Killing niche competitors by remote-control bacteriophage induction. Proc. Natl. Acad. Sci. U. S. A. 106, 1234–1238 (2009).
129. Yamamoto, N. Damage, repair, and recombination. II. Effect of hydrogen peroxide on the bacteriophage genome. Virology 38, 457–463 (1969).
130. Abedon, S. T. Kinetics of phage-mediated biocontrol of bacteria. Foodborne Pathogens and Disease vol. 6 807–815 (2009).
131. Hyman, P. Bacteriophages and Nanostructured Materials. in Advances in Applied Microbiology vol. 78 55–73 (Academic Press Inc., 2012).
132. Sybesma, W. et al. Bacteriophages as potential treatment for urinary tract infections. Front. Microbiol. 7, (2016).
133. Campoy, S. et al. Induction of the SOS response by bacteriophage lytic development in Salmonella enterica. Virology 351, 360–367 (2006).
134. Guenther, S., Huwyler, D., Richard, S. & Loessner, M. J. Virulent bacteriophage for efficient biocontrol of Listeria monocytogenes in ready-to-eat foods. Appl. Environ. Microbiol. 75, 93–100 (2009).
135. Rodriguez-Valera, F. et al. Explaining microbial population genomics through phage predation. Nat. Rev. Microbiol. 7, 828–836 (2009).
136. Muegge, B. D. et al. Diet Drives Convergence in Gut Microbiome Functions Across Mammalian Phylogeny and Within Humans. Science (80-. ). 332, 970–974 (2011).
137. McKenna, S. M. & Davies, K. J. The inhibition of bacterial growth by hypochlorous acid. Possible role in the bactericidal activity of phagocytes. Biochem. J. 254, 685–92 (1988).
138. Houk, V. S. & DeMarini, D. M. Induction of prophage lambda by chlorinated pesticides. Mutat. Res. Mutagen. Relat. Subj. 182, 193–201 (1987).
139. Frank, J. A. et al. Critical evaluation of two primers commonly used for amplification of bacterial 16S rRNA genes. Appl. Environ. Microbiol. 74, 2461–2470 (2008).
140. David, L. A. et al. Diet rapidly and reproducibly alters the human gut microbiome. Nature 505, 559–563 (2014).
141. Mai, V., Ukhanova, M., Reinhard, M. K., Li, M. & Sulakvelidze, A. Bacteriophage administration significantly reduces shigella colonization and shedding by shigella-challenged mice without deleterious side effects and distortions in the gut microbiota. Bacteriophage (2015) doi:10.1080/21597081.2015.1088124.
142. Danis-Wlodarczyk, K. et al. A proposed integrated approach for the preclinical evaluation of phage therapy in Pseudomonas infections. Sci. Rep. 6, 28115 (2016).
143. Role of catalase in SOS induction by H2O2. (A) Survival of S. aureus... | Download Scientific Diagram. https://www.researchgate.net/figure/Role-of-catalase-in-SOS-induction-by-H2O2-A-Survival-of-S-aureus-strains-in-media_fig2_23785136.
144. International Committee on Taxonomy of Viruses (ICTV). https://talk.ictvonline.org/taxonomy/.
145. Serwer, P., Wright, E. T., Chang, J. T. & Liu, X. Enhancing and initiating phage-based

175
therapies. Bacteriophage 4, e961869 (2014). 146. Garneau, J. E., Tremblay, D. M. & Moineau, S. Characterization of 1706, a virulent phage
from Lactococcus lactis with similarities to prophages from other Firmicutes. Virology 373, 298–309 (2008).
147. Bueno, E., García, P., Martínez, B. & Rodríguez, A. Phage inactivation of Staphylococcus aureus in fresh and hard-type cheeses. Int. J. Food Microbiol. 158, 23–27 (2012).
148. Goerke, C. et al. Diversity of prophages in dominant Staphylococcus aureus clonal lineages. J. Bacteriol. 191, 3462–8 (2009).
149. Michelsen, O., Cuesta-Dominguez, A., Albrechtsen, B. & Jensen, P. R. Detection of bacteriophage-infected cells of Lactococcus lactis by using flow cytometry. Appl. Environ. Microbiol. 73, 7575–81 (2007).
150. Mahony, J. et al. Sequence and comparative genomic analysis of lactococcal bacteriophages jj50, 712 and P008: evolutionary insights into the 936 phage species. FEMS Microbiol. Lett. 261, 253–261 (2006).
151. Gill, J. J. et al. Genomes and characterization of phages Bcep22 and BcepIL02, founders of a novel phage type in Burkholderia cenocepacia. J. Bacteriol. 193, 5300–13 (2011).
152. Summer, E. J., Gill, J. J., Upton, C., Gonzalez, C. F. & Young, R. Role of phages in the pathogenesis of Burkholderia, or ‘Where are the toxin genes in Burkholderia phages?’. Curr. Opin. Microbiol. 10, 410–7 (2007).
153. Summer, E. J. et al. Divergence and mosaicism among virulent soil phages of the Burkholderia cepacia complex. J. Bacteriol. 188, 255–68 (2006).
154. Langley, R. J., Kenna, D., Bartholdson, J., Campopiano, D. J. & Govan, J. R. W. Temperate bacteriophages DK4 and BcepMu from Burkholderia cenocepacia J2315 are identical. FEMS Immunol. Med. Microbiol. 45, 349–350 (2005).
155. Liu, M. et al. Genomic and genetic analysis of Bordetella bacteriophages encoding reverse transcriptase-mediated tropism-switching cassettes. J. Bacteriol. 186, 1503–17 (2004).
156. Rakonjac, J., O’Toole, P. W. & Lubbers, M. Isolation of lactococcal prolate phage-phage recombinants by an enrichment strategy reveals two novel host range determinants. J. Bacteriol. 187, 3110–21 (2005).
157. Eraclio, G. et al. A virulent phage infecting Lactococcus garvieae, with homology to Lactococcus lactis phages. Appl. Environ. Microbiol. 81, 8358–65 (2015).
158. Hatfull, G. F. The Secret Lives of Mycobacteriophages. 82, 179–288 (2012). 159. Trigo, G. et al. Phage Therapy Is Effective against Infection by Mycobacterium ulcerans
in a Murine Footpad Model. PLoS Negl. Trop. Dis. 7, e2183 (2013). 160. Santos, T. M. A. & Bicalho, R. C. Complete genome sequence of vB_EcoM_ECO1230-
10: A coliphage with therapeutic potential for bovine metritis. Vet. Microbiol. 148, 267–275 (2011).
161. Sepúlveda-Robles, O., Kameyama, L. & Guarneros, G. High diversity and novel species of Pseudomonas aeruginosa bacteriophages. Appl. Environ. Microbiol. 78, 4510–5 (2012).
162. Budzik, J. M., Rosche, W. A., Rietsch, A. & O’Toole, G. A. Isolation and characterization of a generalized transducing phage for Pseudomonas aeruginosa strains PAO1 and PA14. J. Bacteriol. 186, 3270–3 (2004).
163. Kropinski, A. M. Sequence of the genome of the temperate, serotype-converting, Pseudomonas aeruginosa bacteriophage D3. J. Bacteriol. 182, 6066–74 (2000).
164. Liao, W.-C. et al. T4-Like genome organization of the Escherichia coli O157:H7 lytic phage AR1. J. Virol. 85, 6567–78 (2011).

176
165. Perry, L. L. et al. Sequence analysis of Escherichia coli O157:H7 bacteriophage PhiV10 and identification of a phage-encoded immunity protein that modifies the O157 antigen. FEMS Microbiol. Lett. 292, 182–6 (2009).
166. Byrne, M. & Kropinski, A. M. The genome of the Pseudomonas aeruginosa generalized transducing bacteriophage F116. Gene 346, 187–194 (2005).
167. Lehman, S. M., Kropinski, A. M., Castle, A. J. & Svircev, A. M. Complete genome of the broad-host-range Erwinia amylovora phage phiEa21-4 and its relationship to Salmonella phage felix O1. Appl. Environ. Microbiol. 75, 2139–47 (2009).
168. Lan, S.-F. et al. Characterization of a new plasmid-like prophage in a pandemic Vibrio parahaemolyticus O3:K6 strain. Appl. Environ. Microbiol. 75, 2659–67 (2009).
169. Carrias, A. et al. Comparative genomic analysis of bacteriophages specific to the channel catfish pathogen Edwardsiella ictaluri. Virol. J. 8, 6 (2011).
170. Beilstein, F. & Dreiseikelmann, B. Temperate bacteriophage PhiO18P from an Aeromonas media isolate: characterization and complete genome sequence. Virology 373, 25–9 (2008).
171. Campoy, S., Aranda, J., Alvarez, G., Barbé, J. & Llagostera, M. Isolation and sequencing of a temperate transducing phage for Pasteurella multocida. Appl. Environ. Microbiol. 72, 3154–60 (2006).
172. Grose, J. H., Jensen, G. L., Burnett, S. H. & Breakwell, D. P. Genomic comparison of 93 Bacillus phages reveals 12 clusters, 14 singletons and remarkable diversity. BMC Genomics 15, 855 (2014).
173. De Lappe, N., Doran, G., O’Connor, J., O’Hare, C. & Cormican, M. Characterization of bacteriophages used in the Salmonella enterica serovar Enteritidis phage-typing scheme. J. Med. Microbiol. 58, 86–93 (2009).
174. Kim, S.-H. et al. Complete genome sequence of Salmonella bacteriophage SS3e. J. Virol. 86, 10253–4 (2012).
175. Drulis-Kawa, Z. et al. Isolation and characterisation of KP34—a novel φKMV-like bacteriophage for Klebsiella pneumoniae. Appl. Microbiol. Biotechnol. 90, 1333–1345 (2011).
176. Adriaenssens, E. M. et al. Bacteriophages LIMElight and LIMEzero of Pantoea agglomerans, belonging to the "phiKMV-like viruses". Appl. Environ. Microbiol. 77, 3443–50 (2011).
177. Hassan, S. et al. Lytic Efficiency of Mycobacteriophages. Open Syst. Biol. J. 3, 21–28 (2010).
178. Ellis, D. M. & Dean, D. H. Location of the Bacillus subtilis temperate bacteriophage phi 105 attP attachment site. J. Virol. 58, 223–4 (1986).
179. Hemphill, H. E. & Whiteley, H. R. Bacteriophages of Bacillus subtilis. Bacteriol. Rev. 39, 257–315 (1975).
180. Günthert, U. & Reiners, L. Bacillus subtilis phage SPR codes for a DNA methyltransferase with triple sequence specificity. Nucleic Acids Res. 15, 3689–702 (1987).
181. Grose, J. H. & Casjens, S. R. Understanding the enormous diversity of bacteriophages: the tailed phages that infect the bacterial family Enterobacteriaceae. Virology 468–470, 421–43 (2014).
182. Lynch, K. H., Seed, K. D., Stothard, P. & Dennis, J. J. Inactivation of Burkholderia cepacia complex phage KS9 gp41 identifies the phage repressor and generates lytic

177
virions. J. Virol. 84, 1276–88 (2010). 183. Price-Carter, M. et al. The evolution and distribution of phage ST160 within Salmonella
enterica serotype Typhimurium. doi:10.1017/S0950268810002335. 184. Shen, X. et al. Functional identification of the DNA packaging terminase from
Pseudomonas aeruginosa phage PaP3. Arch. Virol. 157, 2133–2141 (2012). 185. PhageSeed.
http://www.phantome.org/PhageSeed/seedviewer.cgi?page=Subsystems&subsystem=T7-like_cyanophage_core_proteins.
186. Łobocka, M. B. et al. Genome of bacteriophage P1. J. Bacteriol. 186, 7032–68 (2004). 187. Whichard, J. M. et al. Complete genomic sequence of bacteriophage felix o1. Viruses 2,
710–30 (2010). 188. Villafane, R., Zayas, M., Gilcrease, E. B., Kropinski, A. M. & Casjens, S. R. Genomic
analysis of bacteriophage epsilon 34 of Salmonella enterica serovar Anatum (15+). BMC Microbiol. 8, 227 (2008).
189. Mmolawa, P. T., Schmieger, H., Tucker, C. P. & Heuzenroeder, M. W. Genomic structure of the Salmonella enterica serovar Typhimurium DT 64 bacteriophage ST64T: evidence for modular genetic architecture. J. Bacteriol. 185, 3473–5 (2003).
190. Minakhin, L. et al. Genome comparison and proteomic characterization of Thermus thermophilus bacteriophages P23-45 and P74-26: siphoviruses with triplex-forming sequences and the longest known tails. J. Mol. Biol. 378, 468–80 (2008).
191. Lynch, K. H., Stothard, P. & Dennis, J. J. Genomic analysis and relatedness of P2-like phages of the Burkholderia cepacia complex. BMC Genomics 11, 599 (2010).
192. Urban-Chmiel, R. et al. Isolation and Characterization of Lytic Properties of Bacteriophages Specific for M. haemolytica Strains. PLoS One 10, e0140140 (2015).
193. Deghorain, M. & Van Melderen, L. The Staphylococci phages family: an overview. Viruses 4, 3316–35 (2012).
194. Nelson, D., Schuch, R., Zhu, S., Tscherne, D. M. & Fischetti, V. A. Genomic sequence of C1, the first streptococcal phage. J. Bacteriol. 185, 3325–32 (2003).
195. Essoh, C. et al. Investigation of a Large Collection of Pseudomonas aeruginosa Bacteriophages Collected from a Single Environmental Source in Abidjan, Côte d’Ivoire. PLoS One 10, e0130548 (2015).
196. Meijer, W. J., Horcajadas, J. A. & Salas, M. Phi29 family of phages. Microbiol. Mol. Biol. Rev. 65, 261–87 ; second page, table of contents (2001).
197. Gregory, M. A., Till, R. & Smith, M. C. M. Integration site for Streptomyces phage phiBT1 and development of site-specific integrating vectors. J. Bacteriol. 185, 5320–3 (2003).
198. Revathi, G., Fralick, J. A. & Rolfe, R. D. In vivo lysogenization of a Clostridium difficile bacteriophage ФCD119. Anaerobe 17, 125–9 (2011).
199. Sekulovic, O., Garneau, J. R., Néron, A. & Fortier, L.-C. Characterization of temperate phages infecting Clostridium difficile isolates of human and animal origins. Appl. Environ. Microbiol. 80, 2555–63 (2014).
200. Hargreaves, K. R., Kropinski, A. M. & Clokie, M. R. J. What does the talking?: quorum sensing signalling genes discovered in a bacteriophage genome. PLoS One 9, e85131 (2014).
201. Daniel, A., Bonnen, P. E. & Fischetti, V. A. First complete genome sequence of two Staphylococcus epidermidis bacteriophages. J. Bacteriol. 189, 2086–100 (2007).

178
202. Bae, T., Baba, T., Hiramatsu, K. & Schneewind, O. Prophages of Staphylococcus aureus Newman and their contribution to virulence. Mol. Microbiol. 62, 1035–47 (2006).
203. Adriaenssens, E. M. et al. Integration of genomic and proteomic analyses in the classification of the Siphoviridae family. Virology 477, 144–154 (2015).
204. Lu, Z. et al. Sequence analysis of the Lactobacillus plantarum bacteriophage ΦJL-1. Gene 348, 45–54 (2005).
205. Leblanc, C., Caumont-Sarcos, A., Comeau, A. M. & Krisch, H. M. Isolation and genomic characterization of the first phage infecting Iodobacteria: ϕPLPE, a myovirus having a novel set of features. Environ. Microbiol. Rep. 1, 499–509 (2009).
206. Comeau, A. M. et al. Phage morphology recapitulates phylogeny: the comparative genomics of a new group of myoviruses. PLoS One 7, e40102 (2012).
207. Petrov, V. M., Ratnayaka, S., Nolan, J. M., Miller, E. S. & Karam, J. D. Genomes of the T4-related bacteriophages as windows on microbial genome evolution. Virol. J. 7, 292 (2010).
208. Kropinski, A. M. et al. The host-range, genomics and proteomics of Escherichia coli O157:H7 bacteriophage rV5. Virol. J. 10, 76 (2013).
209. Deveau, H. et al. Phage response to CRISPR-encoded resistance in Streptococcus thermophilus. J. Bacteriol. 190, 1390–400 (2008).
210. Guglielmotti, D. M. et al. Genome analysis of two virulent Streptococcus thermophilus phages isolated in Argentina. Int. J. Food Microbiol. 136, 101–9 (2009).
211. Ali, Y. et al. Temperate Streptococcus thermophilus phages expressing superinfection exclusion proteins of the Ltp type. Front. Microbiol. 5, 98 (2014).
212. Horgan, M. et al. Genome analysis of the Clostridium difficile phage PhiCD6356, a temperate phage of the Siphoviridae family. Gene 462, 34–43 (2010).
213. Dalmasso, M. et al. Three New Escherichia coli Phages from the Human Gut Show Promising Potential for Phage Therapy. PLoS One 11, e0156773 (2016).
214. Lim, J.-A. et al. Complete genome sequence of the Pectobacterium carotovorum subsp. carotovorum virulent bacteriophage PM1. Arch. Virol. 159, 2185–2187 (2014).
215. McLaughlin, J. R., Wong, H. C., Ting, Y. E., Van Arsdell, J. N. & Chang, S. Control of lysogeny and immunity of Bacillus subtilis temperate bacteriophage SP beta by its d gene. J. Bacteriol. 167, 952–9 (1986).
216. Jin, J. et al. Isolation and characterization of ZZ1, a novel lytic phage that infects Acinetobacter baumannii clinical isolates. BMC Microbiol. 12, 156 (2012).
217. Ignacio-Espinoza, J. C. & Sullivan, M. B. Phylogenomics of T4 cyanophages: lateral gene transfer in the ‘core’ and origins of host genes. Environ. Microbiol. 14, 2113–2126 (2012).
218. Shi, Y. et al. Characterization and determination of holin protein of Streptococcus suis bacteriophage SMP in heterologous host. Virol. J. 9, 70 (2012).
219. Hong, J. et al. Identification of host receptor and receptor-binding module of a newly sequenced T5-like phage EPS7. FEMS Microbiol. Lett. 289, 202–209 (2008).
220. Pickard, D. et al. A conserved acetyl esterase domain targets diverse bacteriophages to the Vi capsular receptor of Salmonella enterica serovar Typhi. J. Bacteriol. 192, 5746–54 (2010).
221. Sillankorva, S., Neubauer, P. & Azeredo, J. Pseudomonas fluorescens biofilms subjected to phage phiIBB-PF7A. BMC Biotechnol. 8, 79 (2008).
222. Zhao, X. et al. Outer membrane proteins ail and OmpF of Yersinia pestis are involved in the adsorption of T7-related bacteriophage Yep-phi. J. Virol. 87, 12260–9 (2013).

179
223. Pope, W. H. et al. Cluster K Mycobacteriophages: Insights into the Evolutionary Origins of Mycobacteriophage TM4. PLoS One 6, e26750 (2011).
224. Mihara, T. et al. A Ralstonia solanacearum phage ϕRP15 is closely related to Viunalikeviruses and encodes 19 tRNA-related sequences. Virol. Reports 6, 61–73 (2016).
225. Lee, C.-N., Lin, J.-W., Weng, S.-F. & Tseng, Y.-H. Genomic characterization of the intron-containing T7-like phage phiL7 of Xanthomonas campestris. Appl. Environ. Microbiol. 75, 7828–37 (2009).
226. Lohr, J. E., Chen, F. & Hill, R. T. Genomic analysis of bacteriophage PhiJL001: insights into its interaction with a sponge-associated alpha-proteobacterium. Appl. Environ. Microbiol. 71, 1598–609 (2005).
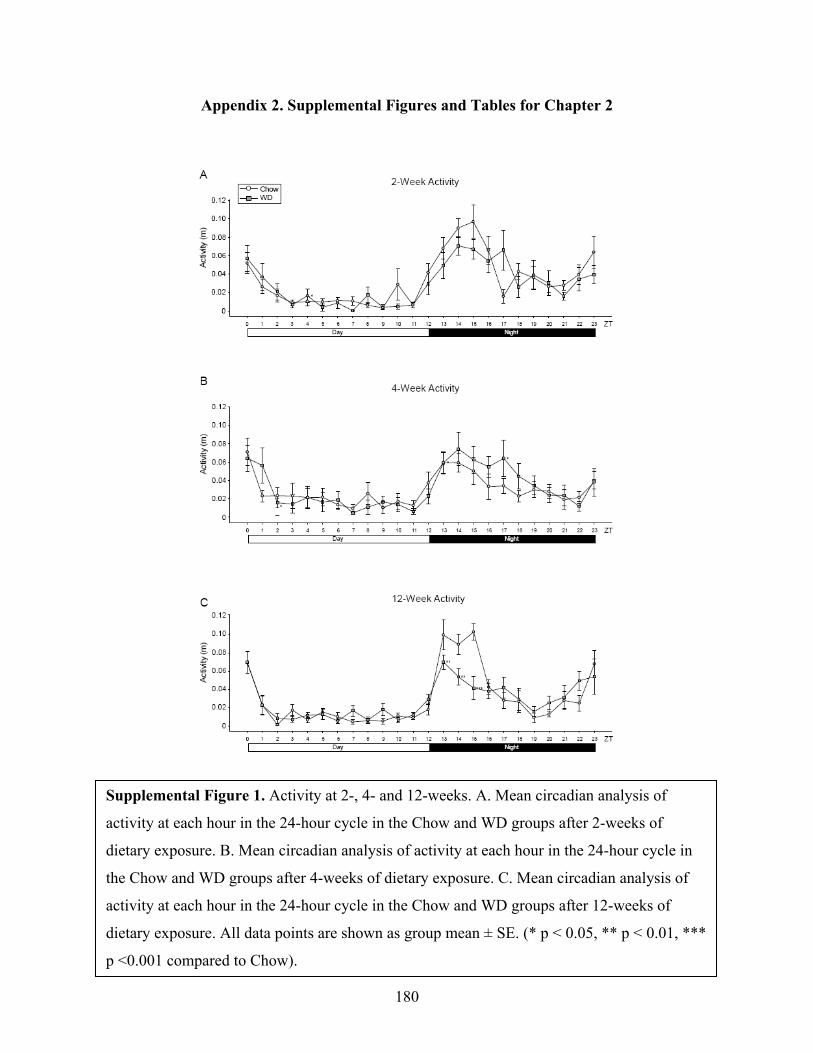
180
Appendix 2. Supplemental Figures and Tables for Chapter 2
Supplemental Figure 1. Activity at 2-, 4- and 12-weeks. A. Mean circadian analysis of
activity at each hour in the 24-hour cycle in the Chow and WD groups after 2-weeks of
dietary exposure. B. Mean circadian analysis of activity at each hour in the 24-hour cycle in
the Chow and WD groups after 4-weeks of dietary exposure. C. Mean circadian analysis of
activity at each hour in the 24-hour cycle in the Chow and WD groups after 12-weeks of
dietary exposure. All data points are shown as group mean ± SE. (* p < 0.05, ** p < 0.01, ***
p <0.001 compared to Chow).
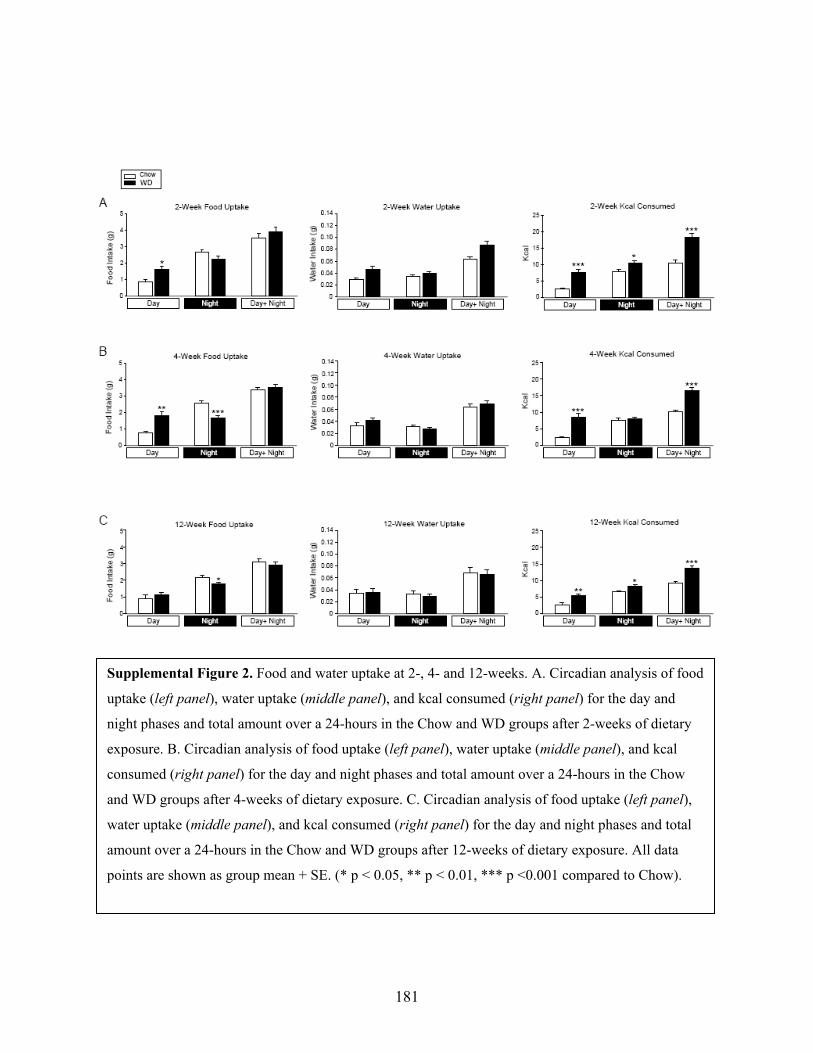
181
Supplemental Figure 2. Food and water uptake at 2-, 4- and 12-weeks. A. Circadian analysis of food
uptake (left panel), water uptake (middle panel), and kcal consumed (right panel) for the day and
night phases and total amount over a 24-hours in the Chow and WD groups after 2-weeks of dietary
exposure. B. Circadian analysis of food uptake (left panel), water uptake (middle panel), and kcal
consumed (right panel) for the day and night phases and total amount over a 24-hours in the Chow
and WD groups after 4-weeks of dietary exposure. C. Circadian analysis of food uptake (left panel),
water uptake (middle panel), and kcal consumed (right panel) for the day and night phases and total
amount over a 24-hours in the Chow and WD groups after 12-weeks of dietary exposure. All data
points are shown as group mean + SE. (* p < 0.05, ** p < 0.01, *** p <0.001 compared to Chow).
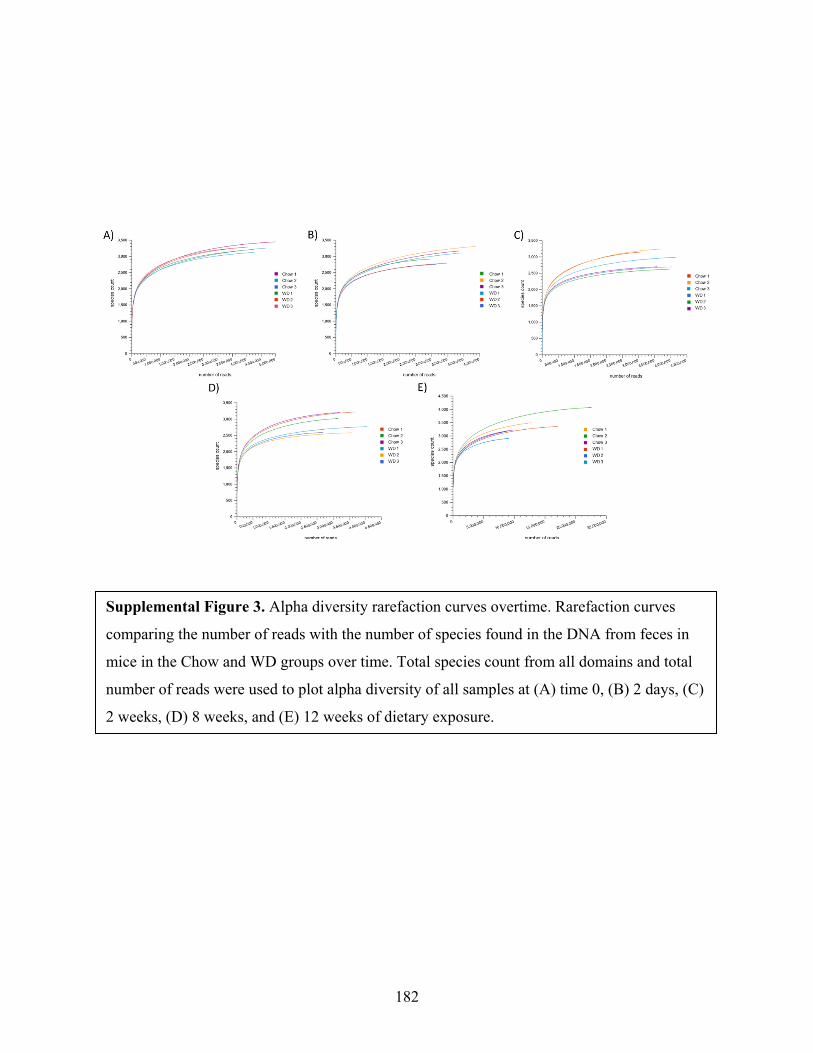
182
Supplemental Figure 3. Alpha diversity rarefaction curves overtime. Rarefaction curves
comparing the number of reads with the number of species found in the DNA from feces in
mice in the Chow and WD groups over time. Total species count from all domains and total
number of reads were used to plot alpha diversity of all samples at (A) time 0, (B) 2 days, (C)
2 weeks, (D) 8 weeks, and (E) 12 weeks of dietary exposure.

183
Supplemental Figure 4. Measure of diversity and evenness in microbial assemblages over
time. Shannon diversity was used to estimate changes in diversity for A) Bacterial OTUs and
B) Bacteriophage OTUs (Viral OTUs within the order Caudovirales) and Pielou’s Evenness
index was used to estimate changes in evenness for C) Bacterial OTUs and D) Bacteriophage
OTUs within the fecal microbiota of mice in the Chow and WD groups at time 0, 2 days, 2, 8,
and 12 weeks after diets began. *P < 0.05; **P < 0.01; ***P < 0.001. Pearson’s correlation
plot of E) Diversity and Evenness with Metabolic parameters.

184
Supplemental Figure 5. nMDS ordination of the microbiota samples separated by time. The
taxonomic profiles of the samples were used to compute the sample dissimilarity matrix using
Bray-Curtis dissimilarity index. The matrix was used to compute an ordination of the samples
in two dimensions (MDS1 and MDS2). The stress associated with this ordination is 0.168.
The shapes in the plot denote the diet (Chow or WD). Plots are separated by time point (0
days, 2 days and 2, 8, 12 weeks after diets began).

185
Supplemental Figure 6. Changes in relative abundance of microbial composition after
administration of the Western diet. Phylum level bacterial composition in mice fed a Chow or
WD at 0 days, 2 days and 2, 8 and 12 weeks after diets began. The mean relative abundance
(%) of bacterial phyla are shown.
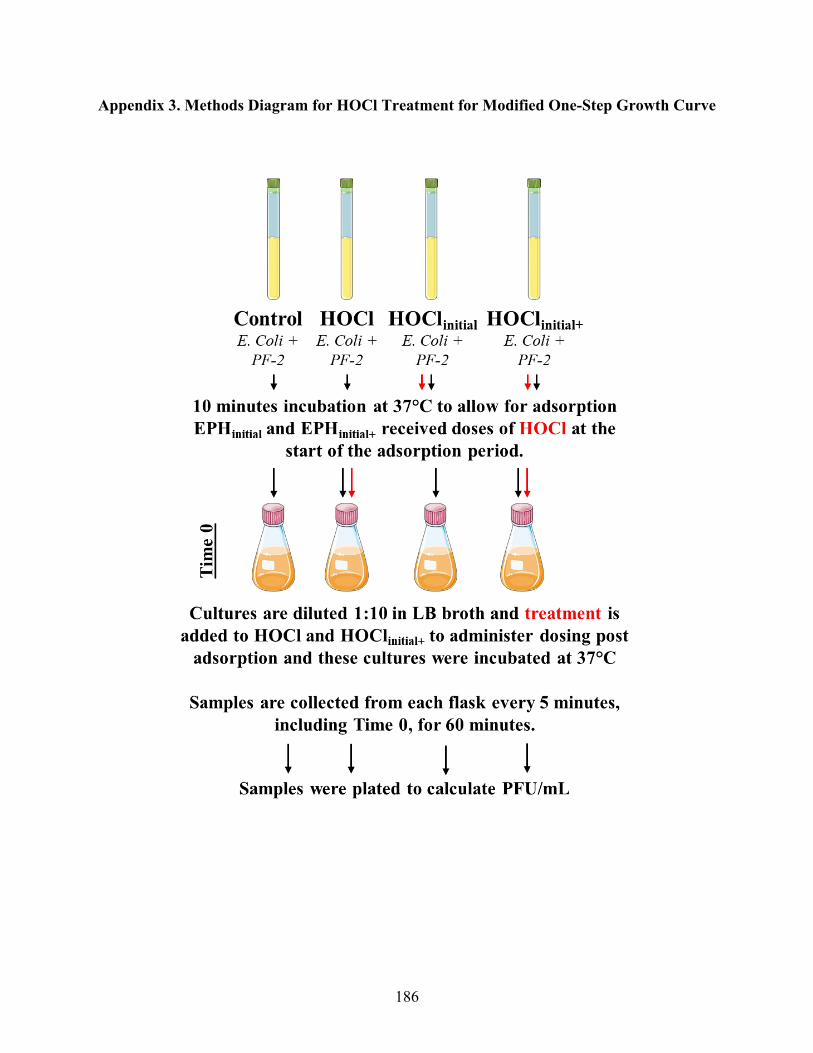
186
Appendix 3. Methods Diagram for HOCl Treatment for Modified One-Step Growth Curve


