
USING PISA VARIABLES TO EXPLAIN
PERFORMANCE ON JUNIOR CERTIFICATE
EXAMINATIONS IN MATHEMATICS AND
SCIENCE
Nick Sofroniou, Judith Cosgrove, and Gerry Shiel
Educational Research Centre
St Patrick’s College, Dublin
Multilevel models of achievement on the Junior Certificate Examination (JCE) taken
at the end of junior cycle in second-level schools are presented for mathematics and
for science. The response variables are derived from JCE grades in mathematics and
science of students who participated in the OECD Programme for International
Student Assessment (PISA) in 2000. Explanatory variables consist of answers that
students and their principal teachers gave on questionnaires administered as part of
the PISA survey, as well as school-level variables taken from the database of the Irish
Department of Education and Science. The model developed for JCE mathematics
contained 10 student-level variables that included indicators of socioeconomic status
and parental education, the number of books in the home, absenteeism, completion of
homework on time, and intent to leave school prior to completion of the senior cycle
(grades 10-12), as well as an interaction between student gender and completion of
homework on time. At the school level, the model developed for mathematics
contained two variables: school sector (whether vocational, secondary, or
community/comprehensive) and designated disadvantaged status. The model for
JCE science was similar to that for mathematics, also including socioeconomic status
and parental education, books in the home, absenteeism, completion of homework on
time, and intent to leave school at the student level. An interaction between books in
the home and student gender was observed. The model also included at the school
level school sector and designated disadvantaged status as well as school disciplinary
climate. These models were compared with those of achievement on the PISA
mathematics and science scales. A considerable degree of similarity between the two
sets of models was found, confirming the association of a number of student-level
and school-level variables with performance on both the JCE and PISA.
The international report on PISA 2000, which provides an overview of the
results of the assessment, includes the between-school and within-school
variance components in achievement on the three literacy scales for each
country (OECD, 2001). The variance component that lies between schools gives
an indication of how much schools differ from each other with respect to
achievement, since it corresponds to the variance that can be attributed to
schools. Expressed as a proportion, the between-school variance component,
The Irish Journal of Education, 2002, xxxiii, pp. 99-124.

sometimes misleadingly called the intra-class correlation, is referred to as the
intra-cluster correlation (ICC) in this paper. It is also commonly expressed as a
percentage, and is presented in this form throughout the paper. The lower the
between-school variance, or ICC, the more homogenous schools are with
respect to achievement (see Postlethwaite, 1995).
Across OECD countries, 14.0% of the total variation lies between countries,
28.0% is between schools, and the majority (58.0%) lies within schools. The
corresponding figures for scientific literacy are 8.8%, 28.4%, and 62.8%.
Although the percentage of variation in achievement that lies between countries
is higher for mathematical literacy than for scientific literacy, it should be noted
that the between-country variance components are small, are based on a small
sample of countries, and are not as stable as the components at the other two
levels (D. Willms, personal communication, 12 July, 2002). The between-
school variance components within Ireland are substantially lower than the
OECD average (11.4% for mathematical literacy and 14.1% for scientific
literacy), suggesting that Irish schools are comparatively homogenous with
respect to achievement.
The between-school variance components associated with the Irish PISA
data are lower than previous international studies of achievement might have led
one to expect (Kellaghan, Madaus & Rakow, 1979; Smyth, 1999). For example,
in an analysis of data for Irish students in eighth grade (second year of secondary
school) in the Third International Mathematics and Science Study (TIMSS)
carried out at the Educational Research Centre using maximum likelihood
estimation of variance components and all five plausible values associated with
the achievement estimates, ICCs of 44% and 33% for mathematics and science
respectively, were obtained1. When performance on JCE mathematics and
science for the same group of students was analysed, ICCs of 61% and 52%,
respectively, were obtained. However, these estimates are likely to have been
inflated since the TIMSS sample design entailed sampling of an intact
mathematics class, while PISA entailed a random sample of 15-year olds across
classes and grade (year) levels. This implies that the between-school variance
components (ICCs) associated with the TIMSS data also include all the
between-class variance, for mathematics, and some of the between-class
variance, for science. The sample design of TIMSS inflates the between-school
variance components for the JCE results of that sample in a similar fashion to
100 NICK SOFRONIOU, JUDITH COSGROVE, AND GERRY SHIEL
1 These estimates are somewhat lower than those reported in Martin, Mullis, Gregory,Hoyle, & Shen, (2000) (.50 for mathematics and .38 for science).

their scores on the original scales (Sofroniou & Kellaghan, in press). This also
appears to be a plausible explanation of the variance components found in a
recent study of students’ overall performance on the JCE carried out by Smyth
(1999), who reported an ICC of 22 percent. Note, however, that Smyth selected
students with reference to their base classes, so they would not have been
together for most subjects. This makes the calculation of variance components
for academic subjects problematic.
The PISA international report includes three hierarchical linear models of
achievement on the three literacy scales. Each model has three levels: one for
country, one for school, and one for student, i.e., two nested random effects plus
the random component for the residual variation. Fitting a hierarchical linear
model across countries in this manner makes the assumption that individual
countries are exchangeable, given the terms included in the model, and that the
variation of countries from the country average follows a Normal distribution.
The three-level model for mathematical literacy explains 32.2% of between-
country variation, 67.8% of variation between schools, and 11.2% of variation
between students. The three-level model for scientific literacy is broadly similar,
accounting for 15.6% of between-country variation, 69.0% of variation between
schools, and 10.7% of variation within schools. The approach taken in the
present paper, which is most appropriate for a detailed study of the Irish
population, involves fitting a two-level hierarchical linear model to a single
country’s data, and analysing the between-school and within-school variance
components, as well as the fixed effects, specific to the country.
Since only one model for each domain was developed across all countries, the
international models run the risk of omitting a number of variables that may be
relevant to explaining achievement in individual countries. The international
models did not include any domain-specific explanatory variables (e.g., use of a
calculator during the assessment, or time spent doing science homework).
Furthermore, the fitting of a Normally-distributed random effects model at the
country level raises theoretical issues concerning inferences about the
population from which the relatively small number of countries is deemed to be a
random sample (within the context of a frequentist statistical framework), or
about the exchangeability of one country for another (in a Bayesian statistical
framework) (see Raudenbush, Cheong, & Fotiu, 1994).
Following a decision to develop hierarchical linear models of achievement on
the PISA literacy assessments, subsets of the larger set of explanatory variables
were identified as candidates for inclusion, taking into account collinearity of
variables in the full set and policy issues identified by the PISA National
Committee. The Irish models of mathematical and scientific literacy were found
PERFORMANCE ON JUNIOR CERTIFICATE MATHEMATICS AND SCIENCE 101

to explain about three-quarters of between-school variance, and about one-third
of the variance within schools (Shiel, Cosgrove, Sofroniou, & Kelly, 2001).
The Irish model for mathematical literacy included just two school-level
variables (school type, i.e., sector and designated disadvantaged status) and
several student-level variables: gender, socioeconomic status, number of
siblings, index of books in the home, dropout risk, frequency of completion of
homework on time, grade (year) level, parental education, lone-parent status,
and an interaction term (gender x lone-parent status). The model for scientific
literacy included the same two school-level variables, and several student-level
variables: gender, socioeconomic status, number of siblings, index of books in
the home, dropout risk, frequency of completion of homework on time, grade
(year) level, student absenteeism, whether the student studies science in school,
parental engagement, and an interaction term (gender x index of books in the
home).
In the Irish national report on PISA 2000, some comparisons were drawn
between the performance of students on PISA, and their performance on the JC
English, mathematics and science examinations (Shiel et al., 2001). To make
these comparisons possible, the JCE grades of PISA students who had taken the
examination in 1999 (33.1%) or 2000 (60.9%) were matched with the PISA
database. Students’ JCE grades were placed on a JCE Performance Scale that
ranges from 1 to 12 (in the case of English and mathematics) or 4 to 12 (in the
case of science) to accommodate the level of the examination taken (Higher,
Ordinary, Foundation) (Table 1).
Table 1
Junior Certificate Performance Scale
Higher Level Ordinary Level Foundation Level
Junior Certificate
Performance Scale Score
A 12
B 11
C 10
D A 9
E B 8
F C 7
D A 6
E B 5
F C 4
D 3
E 2
F 1
Foundation level science is not offered.
102 NICK SOFRONIOU, JUDITH COSGROVE, AND GERRY SHIEL

The scale has been used in a number of studies to summarize overall
performance on the JCE rather than on individual subjects (Kellaghan & Dwan,
1995; Martin & Hickey, 1993). Exploratory comparisons between the 12-point
scale and alternative 8-, 10- and 14-point scales using ordinary least-squares
(OLS) regressions found that the 12-point scales (9-point in the case of science)
generally worked better than the alternatives (see Shiel et al., 2001, p. 224).
However, because the scale is bounded at its upper and lower points, care is needed
in predicting from the extremes of explanatory variables with linear models.
Shiel et al. (2001) note that the PISA framework for mathematical literacy is
rooted in the Realistic Mathematics Education (RME) approach (see, e.g., van
den Heuvel-Panhuizen, 1998), which differs from the more abstract, context-
free mathematics approach in the Junior Certificate mathematics syllabus and
examination. While questions in the Junior Certificate mathematics
examination papers are presented in a mathematical and abstract context with
little or no redundant information, in PISA, students were presented with
questions that were commonly embedded in rich authentic contexts, often
accompanied by text and diagrams. Discrimination between necessary and
redundant information and formulation of the problem (‘mathematization’)
were commonly required.
The general aims and objectives of the Junior Certificate science syllabus
(Department of Education, 1990) appear to be broadly congruent with those
identified in the PISA framework for scientific literacy (Shiel et al., 2001).
Further, neither assessment in its current form accords a high degree of emphasis
to physics or chemistry. However, there are some notable differences. PISA
includes questions in areas of applied science such as genetics and the
greenhouse effect, neither of which appears on the Junior Certificate science
syllabus in its current form. PISA also emphasizes earth science to a greater
extent than the Junior Certificate science syllabus, which includes it as an
optional rather than a core component.
Apart from some differences in science content areas, there are differences
between the two science assessments with respect to the emphasis placed on an
understanding of science processes and the scientific method. The Junior
Certificate science syllabus emphasizes the understanding of scientific
concepts, but accords a much lower emphasis to the understanding of the
scientific process and method (such as identifying and formulating hypotheses,
evaluating and communicating conclusions, or the design of a valid
experiment). In contrast, PISA gives precedence to the understanding of the
scientific method and scientific processes.
PERFORMANCE ON JUNIOR CERTIFICATE MATHEMATICS AND SCIENCE 103

Despite differences between the two assessments, correlations between
students’ scores for PISA mathematical and scientific literacy and their Junior
Certificate Performance Scale scores in the respective subjects are substantial
and significant(p<.001)2
; for both mathematical literacy/JCE mathematics and
scientific literacy/JCE science, it is .73. The strength of the correlations is
perhaps surprisingly high, and suggests that explanatory models of achievement
on the two sets of assessments might be broadly similar.
The purpose of the study reported in this paper was to develop multilevel
models3
of performance on Junior Certificate Examinations (JCE) in
mathematics and science, and to compare these with models of performance
based on tests of mathematical and scientific literacy administered as part of the
OECD Programme for International Student Assessment (PISA). Response
variables are the outcomes of students who participated in PISA on the 1999 and
2000 Junior Certificate mathematics and science examinations. A subset of the
variables collected in the PISA questionnaires and from the Irish Department of
Education and Science schools database comprise the explanatory variables
used in the models.
METHOD
Participants
Participants in the current study were 15-year olds (i.e., born in 1984)
attending Irish second-level schools who had participated in PISA in 2000, who
had taken the Junior Certificate Examination in either 1999 or 2000, and for
whom data on all the PISA student-level candidate variables were available
(Table 2; Table A1). A total of 1,896 students had complete data on the relevant
variables in the Junior Certificate mathematics examination dataset, and 1,629
in the Junior Certificate science examination dataset. The proportion of females
in the mathematics dataset is .53, and in the science dataset .49. The mean JCE
Performance Scale score for mathematics is 8.20 (SD=2.05), and the mean JCE
Performance Scale score for science is 9.36 (SD=1.77).
104 NICK SOFRONIOU, JUDITH COSGROVE, AND GERRY SHIEL
2 The test statistics and the method used to establish the significance of correlationcoefficients are reported on p. 206 of Shiel et al. (2001).
3 A multilevel model is a statistical model which explains variation in an outcome (inthis case student academic achievement) through the addition of explanatoryvariables at two or more levels, e.g., the school (cluster level) and student (within-cluster level). The clustering of students into schools is taken into account through theaddition of one or more random effects.

Variables
Candidate variables considered for inclusion in the models for JCE
mathematics and science were ones that had been used to model PISA
mathematical and scientific literacy, with two exceptions. While the PISA
models included a variable reflecting the grade the student was in, this was
replaced in the JCE models by the year in which the student had taken the Junior
Certificate (1999 or 2000). Furthermore, while the model for achievement in
PISA scientific literacy included a variable indicating whether or not the student
had studied science at junior cycle level, this variable was not needed in the JCE
model since all students in that dataset had studied science (Table 2; Appendix 1).
Eleven student-level variables and six school-level variables were
considered for inclusion in analyses. The student-level variables were
(i) socioeconomic status, as indicated by the higher of the parents’ occupation
(where applicable) coded according to the International Standard
Classification of Occupations (ISCO) (see Ganzeboom & Treiman, 1996)
(ii) parental engagement, a composite variable constructed from responses to
items on the student questionnaire, scaled to have a mean of 0 and standard
deviation of 1
(iii) number of siblings, which ranged from 0 to 11
(iv) student gender
(v) parental education, which is the higher of the parents’ completed level of
education (where applicable, ranging from primary to third-level)
(vi) lone parent status (whetheroneorbothparentsresideinthestudent’shousehold)
(vii) dropout risk (intent to leave school prior to completion of the senior cycle,
which spans grades 10-12)
(viii) number of absences from school in the two weeks prior to the PISA survey,
ranging from none to three or more
(ix) completion of homework on time ranging from never to always
(x) year in which the JCE was taken (1999 or 2000)
(xi) index of the number of books in the home ranging from none to more than
500 (the log of the scale was used).
The school-level variables were:
(i) disciplinary climate, a composite variable constructed from responses to
items on the student questionnaire and aggregated to the school level
(ii) student-teacher ratio, the total student enrolment divided by the total
number of teachers (where full-time students were given a weight of 1 and
part-time teachers a weight of 0.5)
PERFORMANCE ON JUNIOR CERTIFICATE MATHEMATICS AND SCIENCE 105
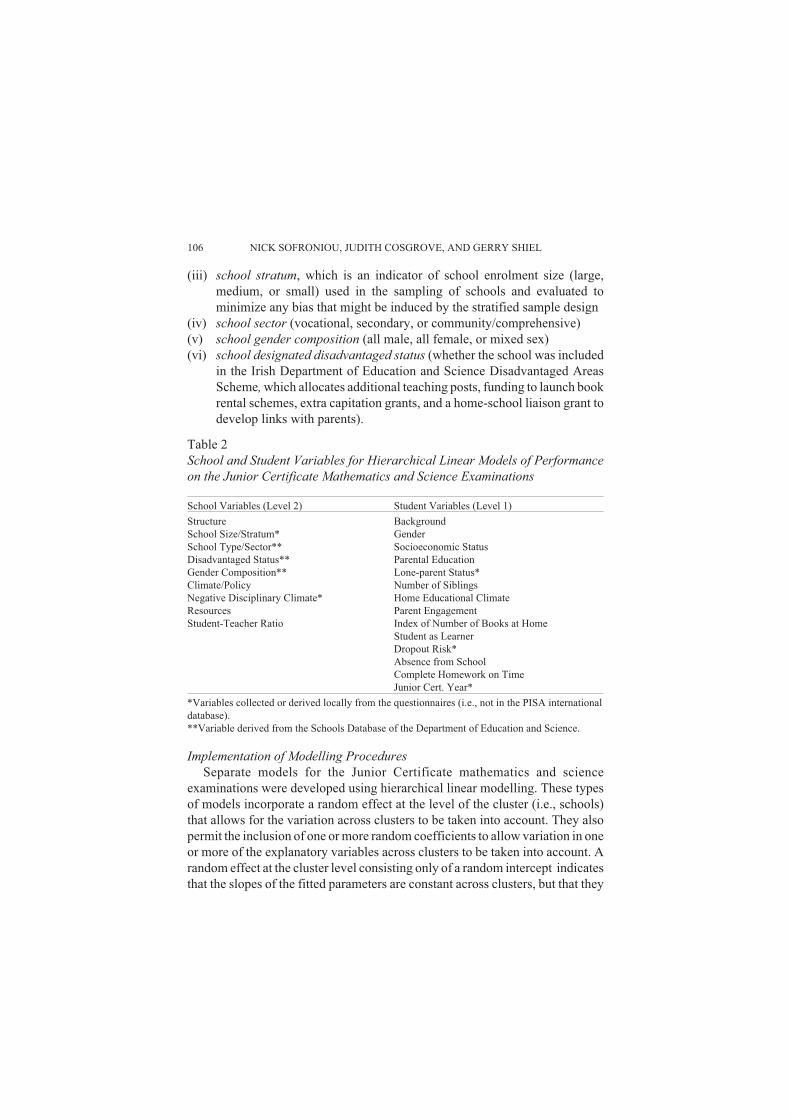
(iii) school stratum, which is an indicator of school enrolment size (large,
medium, or small) used in the sampling of schools and evaluated to
minimize any bias that might be induced by the stratified sample design
(iv) school sector (vocational, secondary, or community/comprehensive)
(v) school gender composition (all male, all female, or mixed sex)
(vi) school designated disadvantaged status (whether the school was included
in the Irish Department of Education and Science Disadvantaged Areas
Scheme, which allocates additional teaching posts, funding to launch book
rental schemes, extra capitation grants, and a home-school liaison grant to
develop links with parents).
Table 2
School and Student Variables for Hierarchical Linear Models of Performance
on the Junior Certificate Mathematics and Science Examinations
School Variables (Level 2) Student Variables (Level 1)
Structure Background
School Size/Stratum* Gender
School Type/Sector** Socioeconomic Status
Disadvantaged Status** Parental Education
Gender Composition** Lone-parent Status*
Climate/Policy Number of Siblings
Negative Disciplinary Climate* Home Educational Climate
Resources Parent Engagement
Student-Teacher Ratio Index of Number of Books at Home
Student as Learner
Dropout Risk*
Absence from School
Complete Homework on Time
Junior Cert. Year*
*Variables collected or derived locally from the questionnaires (i.e., not in the PISA international
database).
**Variable derived from the Schools Database of the Department of Education and Science.
Implementation of Modelling Procedures
Separate models for the Junior Certificate mathematics and science
examinations were developed using hierarchical linear modelling. These types
of models incorporate a random effect at the level of the cluster (i.e., schools)
that allows for the variation across clusters to be taken into account. They also
permit the inclusion of one or more random coefficients to allow variation in one
or more of the explanatory variables across clusters to be taken into account. A
random effect at the cluster level consisting only of a random intercept indicates
that the slopes of the fitted parameters are constant across clusters, but that they
106 NICK SOFRONIOU, JUDITH COSGROVE, AND GERRY SHIEL

vary in a parallel manner from school to school. Making a coefficient random
rather than fixed indicates that the slope for that explanatory variable varies
significantly from one school to another, i.e., across the clusters.
In the models presented in this paper, full maximum likelihood estimation
was used. This method enables deviance tests of both fixed and random effects to
be carried out. The HLM 5 software package was used for estimation, together
with macros written in GLIM 4. Consistent with Aitkin, Francis, and Hinde (in
press), sampling weights were not applied in developing the models; rather, the
sample design strata were evaluated in the model itself. Uncentred continuous
explanatory variables were used. This results in the model intercept having the
conventional interpretation of the intercept in OLS regression (i.e., the value of
the linear predictor when all explanatory variables have a value of zero). The
development of each model involved the procedures which follow.
Candidate variables at the student level were initially evaluated separately as
fixed effects added to a random intercept-only model of achievement (in either the
Junior Certificate mathematics or science examination models), and then
evaluated simultaneously. Non-significant variables, with the exception of gender
which was retained to enable subsequent evaluation of gender interactions (a
matter of policy interest), were omitted from the model using a manual backwards
elimination strategy. Any borderline significant variables (i.e., p=.05 to .10) were
retained at this point. Categorical variables with more than two levels (such as
frequency of absence from school) were evaluated using omnibus tests of
deviance changes by fitting the model with, and without, the corresponding set of
dummy variables. Following this, interactions between student gender and the
other student-level variables were tested separately by addition to the model, and
significant interactions were added to form a new model.
School-level variables were then evaluated both separately and
simultaneously in the same manner as those at the student level. One school-
level variable, student-teacher ratio, was missing for one school. To avoid the
loss of data, a missing value indicator method was applied, in which student-
teacher ratio was nested within a binary variable (where a value of 1 indicated
non-missing) (see Lindsey & Lindsey, 2001).
The explicit stratifying variable, school size (the number of 15-year olds enrolled),
which had been used in the sample design, was included as a variable at this level,
as were the two variables used as implicit stratifying variables (school type and
school gender composition). The evaluation of these three variables served to
ensure that the unweighted analysis was not distorted by over-sampling of any
particular sub-group. The school-level variables were then added to the random
intercept model containing the student-level variables and any variables for
PERFORMANCE ON JUNIOR CERTIFICATE MATHEMATICS AND SCIENCE 107

which parameter estimates were not significant were removed sequentially. Any
remaining explanatory variables were then tested using a stricter criterion (p< .05).
Estimates and tests of quadratic terms for all continuous variables at both
levels were tested separately (or jointly in cases where there were interactions
between those variables and gender). Significant quadratic terms (and their
interactions with gender if applicable) were added to the model and evaluated
sequentially. Finally, random coefficients for student-level variables were tested
through changes in deviance referred to a chi-squared distribution, with the
change in the number of terms in the model as the number of degrees of freedom.
RESULTS
Junior Certificate Mathematics Examination
Model of Performance. Prior to testing each student-level variable by
addition to a random intercept-only model, exploratory analyses of the
curvilinearity of their relationships with performance on the Junior Certificate
mathematics examination indicated that index of books in the home would be
well represented by its logarithmic form. Table 3 shows the parameter estimates
Table 3
Performance Scores on the Junior Certificate Mathematics Examination:
All Level 1 Variables Tested as Separate Models by Addition to the Random
Intercept-Only Model
Parameter SE Test Statistic df p
Gender: Male – Female -0.106 0.112 t = -0.945 1894 .345Socioeconomic Status 0.034 0.003 t = 11.685 1894 <.001Parental Education χ 2
=95.342 3 <.001
None/Primary–Upper Sec -0.750 0.157Lower Sec–Upper Sec -0.613 0.123Third Level–Upper Sec 0.418 0.108
Lone-parent: Yes– No -0.683 0.136 t =-5.025 1894 <.001Number of Siblings -0.105 0.032 t = -3.262 1894 .001Parent Engagement 0.342 0.046 t = 7.378 1894 <.001Log Index of Books in the Home 1.733 0.132 t = 13.162 1894 <.001Dropout Risk: Yes– No -1.795 0.131 t = -13.751 1894 <.001Absence χ2
=74.336 2 <.001
No days–1 or 2 days 0.659 0.0983 days or more–1 or 2 days -0.460 0.178
Homework on Time χ2= 108.493 3 <.001
Never–Mostly -0.959 0.216Sometimes–Mostly -0.654 0.111Always–Mostly 0.596 0.110
Junior Cert. Year (2000-1999) -0.455 0.093 t = -4.883 1894 <.001
χ2 tests are based on deviance differences.
108 NICK SOFRONIOU, JUDITH COSGROVE, AND GERRY SHIEL

and tests of significance of the student-level variables that were tested
separately. All are significant with the exception of gender. When all variables
were entered simultaneously, all remain significant, except for gender, which
becomes borderline significant (p=.055), and the direction of its parameter
estimate changes from positive to negative.
After testing for interactions with each variable separately, it was found that
gender interacted significantly with single parent status, homework on time, and
log of books in the home. However, when tested simultaneously through
addition to the student-level model, only one interaction remains significant:
gender x homework on time.
The next stage involved testing each school-level variable separately when
added to an intercept-only model (Table 4)4. All school-level variables tested
separately are significant with the exception of school size, the explicit
stratifying variable.
Table 4
Achievement Scores on the Junior Certificate Mathematics Examination:
All Level 2 Variables Tested as Separate Models by Addition to the Intercept-
Only Model
Parameter SE Test Statistic df p
Negative Disciplinary Climate -0.556 0.214 t = -2.600 137 .010
School Type χ2= 32.995 2 <.001
Secondary–Community/Comp 0.251 0.216
Vocational–Community/Comp -0.844 0.250
Not Designated Disadv–Disadvantaged 0.821 0.175 t = 4.680 137 <.001
School Gender Composition χ2= 12.145 2 .002
All Males–Mixed 0.716 0.219
All Females–Mixed 0.411 0.186
School Size (Number of 15–Year Olds) χ2= 4.114 2 .128
Large–Medium -0.139 0.389
Small–Medium 0.340 0.194
Student–Teacher Ratio 0.115 0.042 t = 2.727 136 .007
χ2 tests are based on deviance difference.
PERFORMANCE ON JUNIOR CERTIFICATE MATHEMATICS AND SCIENCE 109
4 Student-teacher ratio was tested as a fixed effect nested within its non-missing binaryindicator in models for achievement in both the Junior Certificate mathematics andscience examinations.

When all school-level variables were added to the existing student-level
model, school size remains non-significant. Student-teacher ratio loses its
significance in the presence of the other variables, and negative disciplinary
climate becomes borderline significant (p=.082). Following the removal of
school size and student-teacher ratio, as negative disciplinary climate is no
longer significant (p=.106), it too was removed from the model. As school
gender composition is also non-significant at this point (p=.095), as is the non-
missing indicator for student-teacher ratio (p=.075) and the number of siblings
(p=.077), they too were removed from the model.
Tests for curvilinearity of the two continuous student-level variables that
remained in the model (socioeconomic status and parental engagement)
revealed no significant curvilinear relationships with performance on the
Junior Certificate mathematics examination. Finally, random coefficients for
the remaining student-level variables were tested by adding each one separately
to the model, yielding a final model (Table 5), which includes one statistically
significant random coefficient at the student level (lone-parent status).
The variance components associated with the intercept-only model
correspond to the intra-cluster correlation of the response variable (.156). This
suggests that 15.6% of the variance in achievement is attributable to the school
level, the remainder coming from the student/class level, though information
on the class groupings of students was not gathered in PISA. To estimate the
proportions of variance explained by the model, the variance components
associated with the model prior to the addition of the random coefficients for
lone-parent status were used. The mean number of 15-year olds enrolled in the
population (86.88) was used as the typical cluster size in the calculations (see
Snijders & Bosker, 1999). The model explains 29.5% of variance within
schools, and 64.3% of variance between schools.
A comparison with the analysis of the PISA 2000 model of mathematical
literacy (Shiel et al., 2001, Chapter 5) indicates that the percentage of variance
that lies between schools is somewhat higher for the Junior Certificate
mathematics examination than for PISA mathematical literacy (15.6% versus
11.4%). The percentage of within-school variance explained by the two models
is comparable (29.5% versus 31.9%), while the percentage of explained
between-school variance is slightly lower for the Junior Certificate mathematics
examination than for PISA mathematical literacy (64.3% versus 78.8%). The
addition of the school-level variables to the model of achievement on the Junior
Certificate mathematics examination results in an increase of 10.2% of
explained variance at the school level and 1.7% at the student level.
110 NICK SOFRONIOU, JUDITH COSGROVE, AND GERRY SHIEL

Table 5
Final Model of Performance on the Junior Certificate Mathematics Examination
Parameter SE Test Statistic df p
Intercept 6.100 0.303Student-Level VariablesGender: Male–Female 0.219 0.120Socioeconomic Status 0.017 0.003 t = 5.742 1874 <.001Parental Education χ2
=13.405 3 .004
None/Primary–Upper Sec -0.300 0.144Lower Sec–Upper Sec -0.342 0.111Third Level–Upper Sec 0.016 0.101
Lone-Parent Status: Yes–No 0.453 0.125 t = -3.616 138 .001Log Index of Books in the Home 0.928 0.131 t = 7.101 1874 <.001Parental Engagement 0.103 0.043 t = 2.393 1874 .017Dropout Risk: Yes– No -1.249 0.127 t = -9.811 1874 <.001Junior Certificate Year (2000-1999) -0.432 0.083 t = -5.202 1874 <.001Absence χ2
= 25.256 2 <.001
No days–1 or 2 days 0.366 0.0853 days or more–1 or 2 days -0.202 0.157Homework on Time
Never–Mostly -0.822 0.314Sometimes–Mostly -0.454 0.139Always–Mostly 0.616 0.135
Gender x Homework on Time χ2= 9.072 3 .028
Gender x Never–Mostly 0.652 0.401Gender x Sometimes–Mostly 0.236 0.197Gender x Always–Mostly -0.339 0.198
School-Level VariablesSchool Type χ2
= 14.241 2 .001
Secondary–Community/Comp -0.016 0.164Vocational–Community/Comp -0.538 0.186Not Designated Disadv–Disadvantaged 0.334 0.132 t = 2.541 135 .011
Variance ComponentsLevel 2 Random Component
Intercept Variance 0.269Single Parent RC χ2
= 6.613 2 .037
Single Parent Variance 0.235Intercept-Single Parent Covariance -0.236
Level 1 Variance 2.742
Variables Dropped from Model (in sequence)School Size School Gender CompositionStudent-Teacher Ratio Number of SiblingsNegative Disciplinary Climate Non-missing Indicator for Student-Teacher Ratio
χ2tests are based on deviance differences.
Fitted Values of the Model. The model is additive in the sense that every
variable contributes to the linear predictor. Contributions can be used to
compare the effects of explanatory variables. While the contributions of
PERFORMANCE ON JUNIOR CERTIFICATE MATHEMATICS AND SCIENCE 111

categorical variables are directly apparent from the final model (Table 5), those
corresponding to continuous variables and any interactions are not. Therefore,
some example values are provided.
As evident from the parameter estimates in Table 5, a student in a vocational
school has a predicted Junior Certificate mathematics examination grade that is
0.54 grades (around one-quarter of a standard deviation) below that of the
predicted score of a student in a community/comprehensive school; and a
student at risk of dropping out of school before the end of the senior cycle has a
predicted grade that is 1.25 grades (three-fifths of a standard deviation) below
the predicted score of a student who is not at risk. For a variable with a random
slope (dropout risk in the case of the final model of performance on the Junior
Certificate mathematics examination), the range of values that the random slope
takes for 95% of the population may be estimated by taking the square root of the
variance associated with the slope (i.e., the standard deviation), and adding +/-
1.96 times this value to the parameter estimate. For dropout risk, the values range
from -2.20 to -0.30 grades.
Continuous variables were categorized into high, medium, and low
categories, using the values closest to the 33rd and 67th percentiles on their
scales as cut-points, and these values were used in estimating effects of being at
the mean of each of these groups, using the parameter values from the model in
Table 5. Table 6 gives the contributions for students scoring at the means of the
high, medium, and low categories for the two continuous variables in the final
model of achievement on the Junior Certificate mathematics examination.
Table 6
Contributions to Grades in the Junior Certificate Mathematics Examination
Attributable to Socioeconomic Status and Parental Engagement
Variable Estimated Contributions to Scores
Socioeconomic StatusLow 0.520Medium 0.800High 1.082
Parental EngagementLow -0.127Medium -0.013High 0.084
The difference in the predicted scores of students at the mean of the low and
high socioeconomic backgrounds is 0.56 of a grade (just over one-quarter of a
standard deviation), while the difference between the predicted scores of
112 NICK SOFRONIOU, JUDITH COSGROVE, AND GERRY SHIEL

students indicating they are at the mean of low and high parental engagement is
just 0.21 of a grade (around one-tenth of a standard deviation).
Table 7 presents data on the contributions to achievement associated with the
index of books in the home (which is in its logarithmic form in the model). The
estimates suggest that the effect of different numbers of books in the home tapers
off at the upper end, and that the difference in the predicted scores of students
with no books at home and those with more than 500 books is 1.81 grades (nine-
tenths of a standard deviation).
Table 7
Contributions to Grades in the Junior Certificate Mathematics Examination
Attributable to Number of Books in the Home
Index of Books in the Home Estimated Contributions to Scores
No Books (1) 0.000
1-10 books (2) 0.643
11-50 books (3) 1.019
51-100 books (4) 1.286
101-250 books (5) 1.493
251-500 books (6) 1.662
501+ books (7) 1.805
Table 8 shows the contributions of frequency of completion of homework on
time, which had a significant interaction with gender. The estimates suggest that
female students who never complete their homework on time are predicted to
score 0.87 grades lower than males in the same category, and that there is little
difference in the expected scores (just 0.12 grades) of male and female students
who always complete their homework on time. The difference between the
lowest and highest categories is higher for females than for males (1.44 grades
compared to 0.45 grades), suggesting that the effect for this explanatory variable
is substantially stronger for females.
Table 8
Contributions to Grades in the Junior Certificate Mathematics Examination
Attributable to Frequency of Completion of Homework on Time, for Male and
Female Students
Completion ofHomework on Time
Estimated Contributions to ScoresMales Females
Never 0.049 -0.822Sometimes 0.001 -0.454Mostly 0.219 0.000Always 0.496 0.615
PERFORMANCE ON JUNIOR CERTIFICATE MATHEMATICS AND SCIENCE 113

Junior Certificate Science Examination
Model of Performance. Table 9 shows the parameter estimates and tests of
significance for the student-level variables that were initially tested separately in
modelling performance on the Junior Certificate science examinations. All
candidate variables are significant. When all variables were entered
simultaneously, single parent status and parental engagement are no longer
significant at the initial criterion (p<.10) and were removed from the model at
this point. Junior Certificate year is borderline significant after removal, but was
retained until tests for the significance of interactions between gender and the
other explanatory variables were carried out.
Table 9
Performance Scores on the Junior Certificate Science Examination:
All Level 1 Variables Tested as Separate Models by Addition to the Random
Intercept-Only Model
Parameter SE Test Statistic df p
Gender: Male – Female -0.476 0.103 t = -4.616 1627 <.001
Socioeconomic Status 0.029 0.003 t = 10.664 1627 <.001
Parental Education χ2= 77.211 3 <.001
None/Primary–Upper Sec -0.582 0.151
Lower Sec–Upper Sec -0.346 0.116
Third Level–Upper Sec 0.484 0.099
Lone-parent: Yes– No -0.379 0.134 t = -2.830 1627 .005
Number of Siblings -0.140 0.030 t = -4.662 1627 <.001
Parent Engagement 0.276 0.044 t = 6.257 1627 <.001
Log Index of Books in the Home 1.584 0.124 t = 12.736 1627 <.001
Dropout Risk: Yes– No -1.797 0.126 t = -14.280 1627 <.001
Absence χ2= 59.741 2 <.001
No days–1 or 2 days 0.577 0.089
3 days or more–1 or 2 days -0.299 0.163
Homework on Time χ2= 87.000 3 <.001
Never–Mostly -0.997 0.204
Sometimes–Mostly -0.555 0.104
Always–Mostly 0.452 0.104
Junior Cert. Year (2000-1999) -0.214 0.089 t = -2.410 1627 .016
χ2tests are based on deviance differences.
After testing the significance of interactions between gender and the other
explanatory variables separately, just one significant interaction emerged:
gender x index of books in the home. This term was then added to the model
and variables that were borderline significant were removed. All variables
114 NICK SOFRONIOU, JUDITH COSGROVE, AND GERRY SHIEL
retain significance except for Junior Certificate year (p=.100) which was
removed.
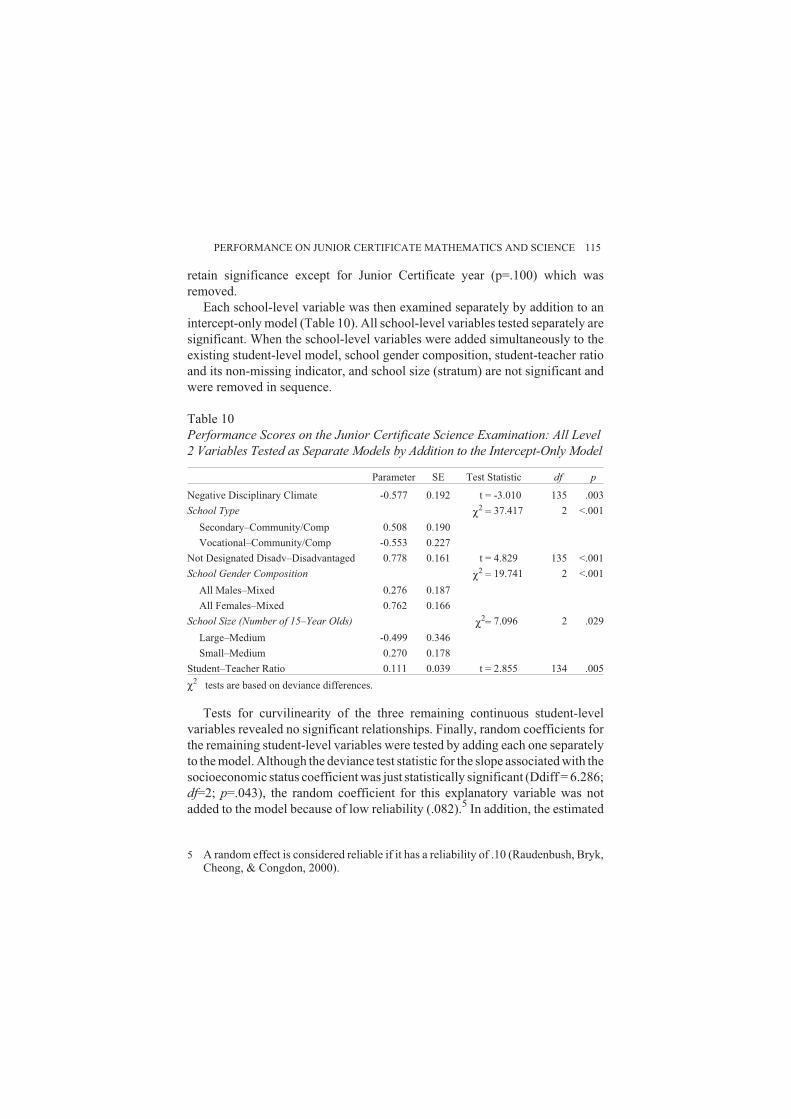
Each school-level variable was then examined separately by addition to an
intercept-only model (Table 10). All school-level variables tested separately are
significant. When the school-level variables were added simultaneously to the
existing student-level model, school gender composition, student-teacher ratio
and its non-missing indicator, and school size (stratum) are not significant and
were removed in sequence.
Table 10
Performance Scores on the Junior Certificate Science Examination: All Level
2 Variables Tested as Separate Models by Addition to the Intercept-Only Model
Parameter SE Test Statistic df p
Negative Disciplinary Climate -0.577 0.192 t = -3.010 135 .003
School Type χ2= 37.417 2 <.001
Secondary–Community/Comp 0.508 0.190
Vocational–Community/Comp -0.553 0.227
Not Designated Disadv–Disadvantaged 0.778 0.161 t = 4.829 135 <.001
School Gender Composition χ2= 19.741 2 <.001
All Males–Mixed 0.276 0.187
All Females–Mixed 0.762 0.166
School Size (Number of 15–Year Olds) χ2= 7.096 2 .029
Large–Medium -0.499 0.346
Small–Medium 0.270 0.178
Student–Teacher Ratio 0.111 0.039 t = 2.855 134 .005
χ2tests are based on deviance differences.
Tests for curvilinearity of the three remaining continuous student-level
variables revealed no significant relationships. Finally, random coefficients for
the remaining student-level variables were tested by adding each one separately
to the model. Although the deviance test statistic for the slope associated with the
socioeconomic status coefficient was just statistically significant (Ddiff = 6.286;
df=2; p=.043), the random coefficient for this explanatory variable was not
added to the model because of low reliability (.082).5
In addition, the estimated
PERFORMANCE ON JUNIOR CERTIFICATE MATHEMATICS AND SCIENCE 115
5 A random effect is considered reliable if it has a reliability of .10 (Raudenbush, Bryk,Cheong, & Congdon, 2000).

random coefficient was far less than 1.96 times its standard error (random
coefficient = 0.00008, with standard error = 0.0378). Thus, the final model
(Table 11) does not involve quadratic terms or random coefficients, and contains
one interaction term.
Table 11
Final Model of Achievement Scores on the Junior Certificate Science
Examination
Parameter SE Test Statistic df p
Intercept 6.720 0.351
Student-Level Variables
Gender: Male–Female 0.731 0.367
Socioeconomic Status 0.013 0.003 t = 4.825 1610 <. 001
Parental Education χ2= 8.067 3 .045
Primary-Upper Second -0.275 0.137
Lower Second-Upper Second -0.121 0.104
Third Level-Upper Second 0.104 0.092
Log Index of Books in the Home 1.261 0.177
Dropout Risk: Yes– No -1.293 0.121 t = -10.663 1610 <. 001
Absence χ2= 33.865 2 <. 001
No days–1 or 2 days 0.396 0.080
3 days or more–1 or 2 days -0.186 0.145
Homework on Time χ2= 34.820 3 <. 001
Never–Mostly -0.538 0.185
Sometimes–Mostly -0.233 0.095
Always–Mostly 0.342 0.093
Number of Siblings -0.091 0.027 t = -3.386 1610 .001
Log (Index of Books) x Gender -0.601 0.227 t = -2.648 1610 .008
School-Level Variables
School Type χ2= 11.038 2 .004
Secondary–Community/Comp 0.170 0.144
Vocational–Community/Comp -0.278 0.170
Not Designated Disadv–Disadvantaged 0.238 0.121 t = 1.974 132 .048
Negative Disciplinary Climate -0.286 0.132 t = -2.169 132 .030
Variance Components
Level 2 Variance 0.133 χ2= 251.803 132 <.001
Level 1 Variance 2.062
Variables Dropped from Model (in sequence)
Lone-Parent Status Student-Teacher Ratio
Parental Engagement Non-Missing Indicator for Student-Teacher Ratio
Junior Certificate Year School Size (stratum)
School Gender Composition
χ2tests of fixed effects are based on deviance differences.
116 NICK SOFRONIOU, JUDITH COSGROVE, AND GERRY SHIEL

The variance components associated with the intercept-only model of
achievement on the Junior Certificate science examination are given by the
intra-cluster correlation (.162), which indicates that 16.2% of the variance in
achievement is attributable to the school level, the remainder coming from the
student/class level. The model explains 31.1% of variance within schools, and
71.3% of variance between schools.
A comparison with the PISA model of scientific literacy suggests that the
percentage of variance that lies between schools for the two science assessments
is close (16.2% for the Junior Certificate examination and 14.1% for PISA). The
proportion of within-school variance explained by the two models is also similar
(31.1% for the Junior Certificate science examination versus 34.1% for PISA
scientific literacy), as is the percentage of explained between-school variance
(71.3% for the Junior Certificate science examination and 74.5% for PISA
scientific literacy). The addition of the school-level variables to the model of
achievement on the Junior Certificate science examination results in an increase
of 10.7% of explained variance at the school level and 1.9% at the student level.
Fitted Values of the Model. As examples of the contribution of categorical
variables, a student in a school that is designated disadvantaged is predicted to
score 0.29 grades (around one-sixth of a standard deviation) below that of the
score predicted for a student in a school that is not designated disadvantaged; and
a student at risk of dropping out of school before the end of the senior cycle has a
predicted grade that is 1.29 grades (almost three-quarters of a standard
deviation) below the predicted score of a student who is not at risk.
Table 12 gives the contributions for students scoring at the means of the high,
medium, and low groupings for the two continuous variables in the final model
of achievement on the Junior Certificate science examination.
Table 12
Contributions to Grades in the Junior Certificate Science Examination
Attributable to Socioeconomic Status and Negative Disciplinary Climate
Variable Estimated Contributions to Scores
Socioeconomic Status
Low 0.391
Medium 0.615
High 0.834
Negative Disciplinary Climate
Low 0.145
Medium 0.018
High -0.099
PERFORMANCE ON JUNIOR CERTIFICATE MATHEMATICS AND SCIENCE 117

The difference in the predicted scores of students of low and high
socioeconomic backgrounds is 0.44 of a grade (one-quarter of a standard
deviation), and the difference between the predicted scores of students in
schools with high and low negative disciplinary climates is 0.24 grades (around
one-seventh of a standard deviation).
Table 13
Contributions to Grades in the Junior Certificate Science Examination
Attributable to Number of Books in the Home, by Gender
Index of Books
in the Home
Estimated Contributions to Scores
Males Females
No Books (1) 0.731 0.000
1-10 books (2) 1.189 0.874
11-50 books (3) 1.457 1.386
51-100 books (4) 1.647 1.749
101-250 books (5) 1.794 2.030
251-500 books (6) 1.915 2.260
501+ books (7) 2.016 2.454
Table 13 shows the contributions to achievement associated with the index of
books in the home (which is in its logarithmic form in the model, and interacts
significantly with gender). At the lower end of the scale, the predicted
contribution is higher for males, while at the upper end, the contribution to the
achievement of females is higher. The gradient for males is shallower, tapering
off slightly at the upper categories, while that for females is steeper and tapers off
more noticeably. When one compares the difference between the uppermost and
lowermost categories, for females, it amounts to 2.45 grades (1.4 standard
deviations), while for males, it is 1.29 grades (under three-quarters of a standard
deviation).
CONCLUSION
An examination of variance components associated with the models of
achievement on PISA mathematical and scientific literacy indicates that those
for Ireland are well below the corresponding OECD averages (11.4% compared
to 31.4% in the case of mathematical literacy, and 14.1% compared to 30.6% in
the case of scientific literacy). This suggests that Irish schools are comparatively
homogenous with respect to achievement in both mathematical and scientific
literacy, though there is considerable variation within schools on these
118 NICK SOFRONIOU, JUDITH COSGROVE, AND GERRY SHIEL

measures. Irish schools are also comparatively more homogenous with respect
to achievement in reading literacy (Shiel et al., 2001).
The between-school variance components associated with the models of
achievement in the Junior Certificate mathematics and science examinations are
also quite low (15.6% and 16.2%, respectively), although the value for Junior
Certificate mathematics is somewhat higher than for achievement in PISA
mathematical literacy (11.4%). These components for both PISA Junior
Certificate mathematics and science achievement are lower than the results of
previous international studies for Ireland would suggest (Beaton et al., 1996a;
Beaton et al., 1996b). However, the use of intact-class sampling in previous
studies had the effect of combining between-school and between-class variance
into a single component.
The final model of achievement on the Junior Certificate mathematics
examination described in this paper explains 64.3% of variance between schools
and 29.5% within schools. The model of achievement in PISA mathematical
literacy explained 78.8% of the variance between schools, and 31.9% of within-
school variance (Shiel et al., 2001). Although the value for explained between-
school variance is somewhat higher for the PISA model of mathematical
literacy, it should be borne in mind that the variance components associated with
the two measures of achievement in mathematics differ somewhat. (For PISA
mathematics the percentage of the total variance that lies between schools was
11.4, while for Junior Certificate mathematics, it was 15.6).
The final models of achievement in mathematics are broadly similar. At the
school level, just two of the six candidate variables were retained in both of the
final models: school type and designated disadvantaged status.
At the student level, an index reflecting the number of books in the home (a
proxy for home educational resources) is highly significant in both models:
differences in the expected scores of students with the highest and lowest
numbers of books amount to just over one standard deviation in the case of
achievement on PISA mathematical literacy, and just under one standard
deviation for the Junior Certificate mathematics examination. Although
socioeconomic status is significant in both models of achievement in
mathematics, its effect (around one-quarter of a standard deviation in achievement
between low and high groups in both models) cannot be regarded as large
compared with other related explanatory variables such as books in the home.
Another explanatory variable that is highly significant in both models of
mathematical achievement (PISA and the Junior Certificate examination) is
dropout risk. Its expected contribution to achievement in both measures is just
over three-fifths of a standard deviation. However, it is of interest that the effect
PERFORMANCE ON JUNIOR CERTIFICATE MATHEMATICS AND SCIENCE 119

of dropout risk varies across schools in the model of the Junior Certificate
mathematics examination, but is constant in the case of PISA mathematical
literacy. It should be borne in mind that students taking PISA included those who
took the Junior Certificate examinations about ten months prior to taking the
PISA assessment (in 1999) and those who took it two months after taking the
PISA assessment (in 2000). Students’ intention to leave school early may
change somewhat after they sit the Junior Certificate examination.
Lone-parent status also survived in both models, although effects of living in
a household headed by one parent in the case of PISA mathematical literacy
should be interpreted in light of an interaction with the student’s gender. It
should be noted that, when tested separately, the interaction between gender and
lone-parent status in the model of achievement on Junior Certificate
mathematics is significant, and that it is rendered non-significant in the presence
of a term reflecting an interaction between frequency of completing homework
on time and gender, which may merit more in-depth exploration.
The effects associated with frequency of absence from school are moderate
(the difference between the expected scores of students who are least and most
frequently absent is 0.57 of a grade or three-tenths of a standard deviation) and
suggest that missing school is detrimental to performance on the Junior
Certificate mathematics examination. This variable is not significant in the case
of PISA mathematical literacy when the remaining variables in the
corresponding final model are present. The effects associated with parental
engagement are small (around one-tenth of a standard deviation), and, although
statistically significant, are unlikely to be of substantive importance.
The PISA model of mathematical literacy included two variables (apart from
grade level) that are not in the final model for the Junior Certificate mathematics
examination: number of siblings and parental education. The fact that parental
education is significant for achievement in PISA mathematical literacy but not
Junior Certificate mathematics, coupled with the fact that absence from school is
significant in the model for Junior Certificate mathematics only, suggests that
exposure to the curriculum is more relevant to school-based mathematical
literacy, but that parents may have a role to play in the more general
mathematical literacy achievements of their children.
The final models of achievement in PISA scientific literacy (Shiel et al.,
2001) and Junior Certificate science, described in this paper, are very similar.
The final model of achievement on Junior Certificate science explains 71.3% of
variance between schools and 31.1% within schools. The model of achievement
in PISA scientific literacy explained 74.5% of the variance between schools, and
34.1% of within-school variance.
120 NICK SOFRONIOU, JUDITH COSGROVE, AND GERRY SHIEL

In terms of the variables included in both models, at the school level, school
type and designated disadvantaged status were included, as was the case with the
two models of achievement in mathematical literacy. However, the model for
achievement in Junior Certificate science also included a variable reflecting
negative disciplinary climate at the school level. The contribution of negative
disciplinary climate (about one-seventh of a standard deviation difference
between the expected scores of students in schools with high and low negative
climates) is comparable to the contribution of attending a school that is
designated disadvantaged. It may be the case that effective instruction in
preparation for the Junior Certificate science examination is more vulnerable to
a poor disciplinary climate. This is plausible when one considers that in science
classes where students are participating in practical work in small groups,
effective discipline may be more crucial to students’ learning than in classes in
other subjects, where students sit and work mostly as a whole class (e.g., Beaton
et al., 1996a; Beaton et al., 1996b).
At the student level, dropout risk is highly significant in both models. The
difference between the expected scores of students who intended to drop out and
those who did not was almost two-thirds of a standard deviation in PISA, and
almost three-quarters of a standard deviation in the case of Junior Certificate
science. The number of books in the home was also related to achievement, and
in both models, there was a significant interaction with gender: the effects of
books in the home was stronger for females; females with fewer books at home
did less well than males, and females with more books did better than males. A
gender x books in the home interaction was also observed in the final model of
achievement in PISA reading literacy (Shiel et al., 2001) and Junior Certificate
English (Sofroniou, Shiel, & Cosgrove, 2000) and merits further exploration.
A comparison of the six models of achievement described in this paper and
elsewhere (Shiel et al., 2001; Sofroniou et al., 2000) indicates that two school-
level characteristics are consistently related to achievement in multiple
domains: school type and designated disadvantaged status. These two variables
explain an additional 10 to 11% of variance between schools, over and above
several important student characteristics.
All six models include a variable reflecting student socioeconomic status.
However, the effects are rather small compared to other variables. Indeed,
variables relating to students’ learning habits emerge as significant after
accounting for socioeconomic status and related variables, including frequency
of absenteeism and frequency of completion of homework on time. This is
important because student learning behaviours may be more amenable to change
than socioeconomic status.
PERFORMANCE ON JUNIOR CERTIFICATE MATHEMATICS AND SCIENCE 121

A variable reflecting students’ intent to drop out of school prior to completion
of senior cycle is also included in all six models. The differences between the
expected achievement scores of students who did and did not intend to drop out
were substantial, ranging from around three-fifths to three-quarters of a standard
deviation. Intent to drop out is not uncommon; Shiel et al. (2001) reported that
14.0% of the PISA sample intended to drop out prior to completing the senior
cycle. Moreover, the effects of dropout risk were found to vary across schools in
the case of the models of Junior Certificate mathematics, Junior Certificate
English, and PISA reading literacy. These findings point to the need to examine
dropout risk more closely as a research and policy issue.
REFERENCES
Aitkin, M., Francis, B., & Hinde, J. (in press). Statistical modelling in GLIM 4
(2nd ed.). Oxford: Oxford University Press.
Beaton, A.E., Mullis, V.S., Martin, M.O., Gonzalez, E.J., Kelly, D.L., & Smith,
T.A. (1996a). Mathematics achievement in the middle-school years: IEA’s
Third International Mathematics and Science Study. Chestnut Hill, MA:
TIMSS International Study Center, Boston College.
Beaton, A.E., Mullis, I.V., Martin, M.O., Gonzalez, E.J., Smith, T.A., & Kelly,
D.L. (1996b). Science achievement in the middle-school years: IEA’s Third
International Mathematics and Science Study. Chestnut Hill, MA: TIMSS
International Study Centre, Boston College.
Department of Education. (1990). The Junior Certificate science syllabus.
Dublin: Stationery Office.
Ganzeboom, H.B., & Treiman, D.J. (1996). Internationally comparable
measures of occupational status for the 1988 international standard
classification of occupations. Social Science Research, 25, 201-239.
Kellaghan, T., & Dwan, B. (1995). The 1994 Junior Certificate Examination: A
review of results. Dublin: National Council for Curriculum and Assessment.
Kellaghan, T., Madaus, G.F., & Rakow, E.A. (1979). Within-school variance in
achievement: School effects or error? Studies in Educational Evaluation, 5,
101-107.
Lindsey, J.K., & Lindsey, P.J. (2001). Detecting covariates with non-random
missing values in a survey of primary education in Madagascar. Journal of
the Royal Statistical Society, 164 (Part 2), 327-338.
Martin, M.O., & Hickey, B.L. (1993). The 1992 Junior Certificate Examination:
A review of results. Dublin: National Council for Curriculum and
Assessment.
122 NICK SOFRONIOU, JUDITH COSGROVE, AND GERRY SHIEL

Martin, M.O., Mullis, I.V.S., Gregory, K.D., Hoyle, C., & Shen, C. (2000).
Effective schools in science and mathematics: IEA’s Third International
Mathematics and Science Study. Chestnut Hill, MA: TIMSS International
Study Center, Boston College.
OECD (Organisation for Economic Co-operation and Development). (2001).
Knowledge and skills for life: First results of PISA 2000. Paris: Author.
OECD. (2002). Sample tasks from the PISA 2000 assessment: Reading,
mathematical and scientific literacy. Paris: Author.
Postlethwaite, T. N. (1995). Calculation and interpretation of between-school
and within-school variance in achievement. In OECD, Measuring what
students learn (pp. 81-91). Paris: OECD.
Raudenbush, S.W., Bryk, A.S., Cheong, Y.F., & Congdon, R.T. (2000). HLM5
hierarchical linear and nonlinear modelling manual. Lincolnwood, IL:
Scientific Software International.
Raudenbush, S.W., Cheong, Y.F., & Fotiu, R.F. (1994). Synthesising cross-
national classroom effects data: Alternative models and methods. In M.
Binkley, K. Rust, & M. Winglee (Eds.), Methodological issues in
comparative educational studies: The case of the IEA Reading Literacy
Study. Washington, DC: U.S. Department of Education, National Center for
Educational Statistics.
Shiel, G., Cosgrove, J., Sofroniou, N., & Kelly, A. (2001). Ready for life: The
literacy achievements of Irish 15-year olds with comparative international
data. Dublin: Educational Research Centre.
Smyth, E. (1999). Do schools differ? Academic and personal development
among pupils in the second-level sector. Dublin: ESRI/Oak Tree Press.
Snijders, A.B., & Bosker, R.J. (1999). Multilevel analysis: An introduction to
basic and advanced multilevel modelling. London: Sage.
Sofroniou, N., & Kellaghan, T. (in press). The utility of TIMSS scales in
predicting students' state examination performance. Journal of Educational
Measurement.
Sofroniou, N., Shiel, G., & Cosgrove, J. (2000). Explaining performance on the
Junior Certificate Examination: A multilevel approach. Irish Journal of
Education, 31, 25-47.
Van den Heuvel-Panhuizen, M. (1998). Realistic mathematics education. Paper
presented in Kristiansand, Norway, 5-9 June. http://www.fi.uu.nl/en/rme/
welcome.html.
PERFORMANCE ON JUNIOR CERTIFICATE MATHEMATICS AND SCIENCE 123

APPENDIX 1
Description of Candidate Variables
Level/Variable
Level 2 (School)
School Size/Stratum* Categorical (3): Large (81+ 15-year olds enrolled); Medium
(41-80); Small (40 or less); reference category: Medium
School Type/Sector** Categorical (3): Secondary, Community/Comprehensive;
Vocational ; reference category: Community/Comprehensive
Disadvantaged Status** Binary (Designated Disadvantaged/Not Designated
Disadvantaged); reference Category: Yes
Gender Composition** Categorical (3): All Boys, All Girls, Mixed Sex; reference
category: Mixed Sex
Negative Disciplinary Climate* Continuous: Composite based on student responses to
statements about behaviour in class; OECD M=0.0; SD=1.00
Student-Teacher Ratio Continuous: Total enrolment divided by the total number of
teachers (each full-time teacher=1; each part-time=0.5);
M=15.1; SD=1.82
Level 1 (Student)
Gender Binary (Male, Female); reference category: female
Socioeconomic Status Continuous: Higher of parent(s’ ) occupation; Range=16-88,
Irish M=48.4; SD=15.65***
Parental Education Categorical (4): Primary, Lower Second-level, Upper Second-
Level; Third Level; reference category: Upper Second-level
Lone-parent Status* Binary (Yes, No); reference category: Yes
No. of Siblings Continuous: Range=0-11; Mode=2
Parent Engagement Continuous: Composite based on student responses to
statements about interactions with parent(s); OECD M=0.0;
SD=1.00
Log Index of Books at Home Categorical (7); Range on untransformed scale=0-10 books-
250 books
Dropout Risk* Binary (High, Low): Based on student’s intent to drop out of
school before the end of Senior Cycle; reference category: Low
Absence from School Categorical (3): 0 absences (no absences in two weeks prior to
PISA); 1-2 absences; 3 absences; reference category: 1-2
absences
Complete Homework on Time Categorical (4): No Homework (never done on time);
Sometimes; Mostly, Always; reference category: Mostly
Junior Cert. Year* Binary (1999, 2000); reference category: 1999
*Variables collected or derived locally from the questionnaires (i.e., not in the PISA international
database).
**Variables derived from the Schools Database of the Department of Education and Science.
***Based on the International Standard Classification of Occupations (ISCO) system (see
Ganzeboom & Treiman, 1996).
124 NICK SOFRONIOU, JUDITH COSGROVE, AND GERRY SHIEL


