The Land Degradation Assessment
in Drylands (LADA)
on The National Level
Prof Wang Junhou
March 2013
bull Preparation
bull Assessment process for each step
bull Conclusion
Contents
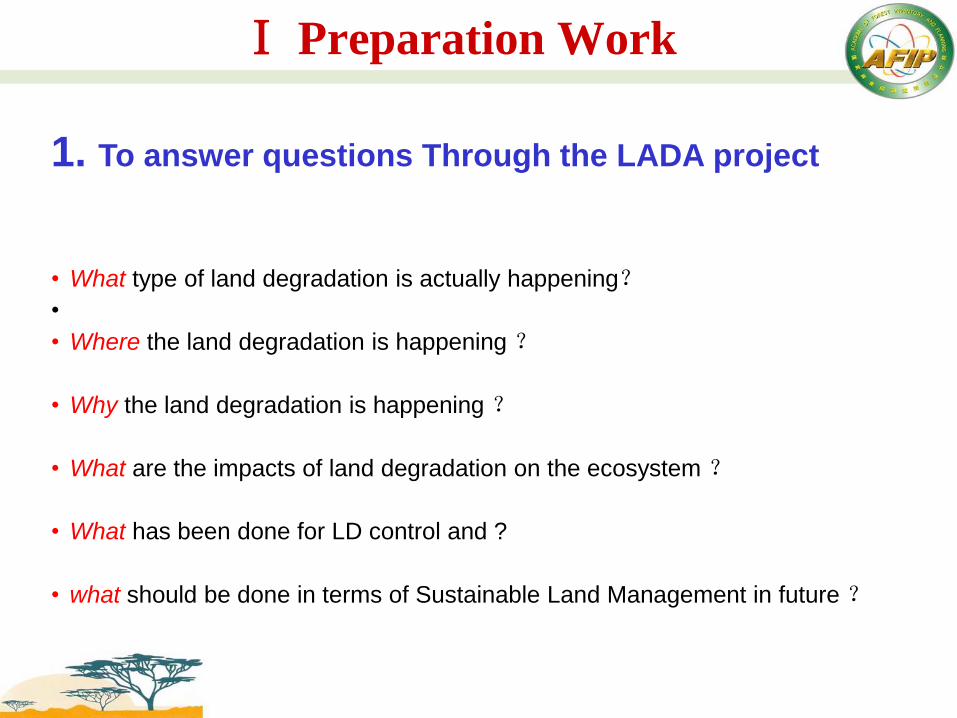
1 To answer questions Through the LADA project
bull What type of land degradation is actually happening
bull
bull Where the land degradation is happening
bull Why the land degradation is happening
bull What are the impacts of land degradation on the ecosystem
bull What has been done for LD control and
bull what should be done in terms of Sustainable Land Management in future
Ⅰ Preparation Work
2 The methodology
bullBase on the LUS Mapping result
bullUse relevant available data and information combining
expertsrsquo knowledge and experience
bullTo fill the LADA manual table and answer 24 question
bullThrough the DPSIR framework to analyze the national land
degradation
Drivers-pressure-state-impact-response (DPSIR)
bullTo obtaining a series of data and information related land degradation SLM technology
bullTo get the way to establishing a assessment system on land use land degradation and land management
bullTo prepare the way and identify areas of greatest interest
for more local and detailed assessments( find the hot ponits and bright points for Local Lada)
bullTo provide information and reliable basis to decision
makers and different UN conventions in particular UNCCD
UNCBD and UNFCCC
3The Objectives
4 The Establishment of Work Team
bull National LADA coordinator (Gov official)
bull Project staff (organization and management)
bull Assessment experts
Multi-departments agriculture water resource forestry and statistics
Multi-subjects desertification soil conservation land use grazing management livestock agriculture forestry geography statistic and economy analysis GIS and remote sensing
Multi-levels central government department Province department county department
5 Training and Workshop
bull To understand the WOCATLADA
manual well including methodology
indicators and assessment technical
routes
bull To discuss the technical problems
and make the work scheme
6 LADA Manual development and complement
Refinement of the LADA Work Manual on the base of the
WOCATLADA Manual
According the situation and characteristics of land degradation in your
country the LADA Work Manual on national level should be refined as your
own manual
Some assessment indicators and method should be added LD type mdashFreeze-thawing in China
Some contents need to be more in detail land use intensity
land degradation degree
LD Rate
conservation names
bull national desertification monitoring data and database
bull national soil erosion monitoring data and database
bull Farmland management data
bull Rangeland degradation monitoring data
bull Society and economy statistics data
bull National forest resource monitor and assessment
bull National ecological construction data (forestry
measures soil and water conservation measures
pasture management agricultural practices etc)
中国荒漠化土地分布图(2004年)
Distribution of Desertification in China
7 Collection of Available Datasets and Information
8 The relevant data and information supplement
The field survey on LD and Vegetation
Social and economic data collection
Ⅱ Process
1 Land use systems mapping
12kinds of Mapping data
Land cover irrigation livestock city protected area temperature crop species and
growth period DEM (digital elevation models) soil population GDP (gross
domestic product )
The basic data is the Land cover
Overlay other 11 kinds data with Land Cover
26 LUS types
and their codes
Number Land use system types Code
1 Forestry-no usenot managed (Natural) 001
2 Forestry-Protected areas 002
3 Forestry-Pastoralism moderate or higher 004
4 Herbaceous-no usenot managed (Natural) 007
5 Herbaceous-Protected areas 008
6 Herbaceous-Extensive pastoralism 009
7 Herbaceous-Mod Intensive pastoralism 010
8 Herbaceous-Intensive pastoralism 011
9 Rainfed Agriculture (Subsistencecommercial) 013
10 Agro-pastoralism Mod Intensive 014
11 Agro-pastoralism Intensive 015
12 Agro-pastoralism mod intensive or higher with Large scale irrigation 016
13 Agriculture-Large scale irrigation (gt 25 pixel size) 017
14 Agriculture-Protected areas 018
15 Urban areas 019
16 Wetlands-no usenot managed (Natural) 020
17 Wetlands-Protected areas 021
18 Wetlands-Agro-pastoralism 023
19 Bare areas-no usenot managed (Natural) 024
20 Bare areas-Protected areas 025
21 Bare areas-Extensive pastoralism 026
22 Water-Protected areas 029
23 Water-Inland Fisheries 030
24 shrub-no usenot managed (Natural) 101
25 shrub-Protected areas 102
26 shrub-Pastoralism moderate or higher 103
2 The confirmation of the assessment units
(1) The assessment area and assessment administration unit
administration
assessment unit
county (365 counties
in 12 provinces)
assessment area
dryland (aridity index is 16 to 16 excepting desert and Gobi)
National assessment units
LUS (26) overlay Administration
counties (365)
(2)Overlay the LUS map with the administration
boundary of the assessment area
In China the assessment
administration unit is county the
assessment area includes 365
counties and 2875 LUS units
3The standardization of questionaire and LUS Unit
Code
LUS Unit Code
The Formatted Questionnaire table
a assessment experts are divided into several working groups
each consisting of 3-4 experts
b Each group is responsible for several administration units
(experts should be familiar with the assessment district )
c the assessment results will be shared between the groups to
correct mistakes and exchange opinions
D Before delivering FAO the LADA working group will solicit
the expert committee suggestions carry out the revision and
supplement to the assessment results
4 Work Regulations and procedures
steps Questions
1Experts
Information
Name subject institute Address
2Land use Area trend of the LUS
Land use intensity trends
3Land
degradation
Types of land degradation
Extent of the degradation type
Degree of land degradation
Rate of degradation
Direct causes of land degradation
Indirect causes of land degradation
Impact on ecosystem services
Level of impact on ecosystem services
5 The assessment
steps Questions
4Land
conservation
(Response
indicators)
Name of the Technology for the Conservation
and Management
Conservation groups
Conservation measures
Purpose of the SLM Technologies
Extent of SLM Technology
Degradation addressed
Effectiveness of implemented SLM Technologies
Effectiveness trend of SLM Technologies
Impact on ecosystem services
Level of impact on ecosystem services
Period of implementation
5Expert
recommend
ation
Recommendation
Remarks and additional information
Step1 Experts Information
Step2 Assessment on Land use system (LUS)
(3 items)
Item1 The area trend of LUS unit
(the are changed in last 10 years)
bull2 rapidly increasing ie extended gt 10
bull1 slowly increasing ie extended lt 10
bull0 remains stable ie no changed
bull -1 slowly decreasing ie reducedlt 10
bull -2 rapidly decreasing ie reduced gt 10
Item2 The intensity of LUS unit
bull2 major increase
bull1 moderate increase
bull0 No major changes
bull-1 moderate decrease
bull -2 major decrease
Indicators and value (increase is negative- decrease is positive+)
farmlandMachinery use amount of pesticide and
chemical fertilizer use irrigation organic manure use etc
forest landcutting grazing conservation afforestation etc
Rangeland Amount of livestock overload (overgrazing) livestock
intensity conservation etc
Wetland cultivation drainage grazing conservation management etc
Bareland overgrazing management method livestock intensity
increase or decrease etc
water pollution fishing (pisciculture) conservation etc
The reasons of each LUS for
Area Change
Intensity Change
Item3 Remarks
LUS Type Area Trend Intensity Trend Remark
Forestry-Protected
areas
0 -1 Conservation and
afforestation
Rainfed Agriculture 2 0 Reclamation of
rangeland
The result of Step2
Step2 Land degradation for per land use system unit
bullType of land degradation
bull Extent()
bull Degree
bull Rate
bull Driver
bull Pressure
bull Effect on ecosystem service
bullRemarks
mdashmdash8 items
1 O No degradation
2 W Soil erosion by water bull Wt Loss of topsoil surface erosion
bull Wg Gully erosion gullying
bull Wm Mass movements landslides
bull Wr Riverbank erosion
bull Wc Coastal erosion
bull Wo Offsite degradation effects
3 E Soil erosion by wind bull Et Loss of topsoil
bull Ed Deflation and deposition
bull Eo Offsite degradation effects
4 C Chemical soil deterioration bull Cn Fertility decline and reduced organic matter content
bull Ca Acidification
bull Cp Soil pollution
bull Cs Salinisation alkalinisation
bull C Chemical soil deterioration
bull Cn Fertility decline and reduced organic matter content
Item1 Types of land degradation (multinomial selection)
(7 types and 36 subtypes)
5 P Physical soil deterioration bullPc Compaction
bullPk Sealing and crusting
bullPw Waterlogging
bullPs Subsidence of organic soils settling of soil
bullPu Loss of bio-productive function due to other activities
6 H Water degradation bullHa Aridification
bullHs Change in quantity of surface water
bullHg Change in groundwater aquifer level
bullHp Decline of surface water quality
bullHq Decline of groundwater quality
bullHw Reduction of the buffering capacity of wetland areas
7 B Biological degradation bullBc Reduction of vegetation cover
bullBh Loss of habitats
bullBq Quantity biomass decline
bullBf Detrimental effects of fires
bullBs Quality and species composition diversity decline
bullBl Loss of soil life
bullBp Increase of pests diseases loss of predators
Chemical soil deterioration
(Salinisationalkalinisation)
Wind erosion
Water erosion Biological degradation
Range land degradation
Item2 Extent() of LDThe percentage of each type of land degradation in the assessment unit(LUS)
Item3 Degree of LD (for each type of land degradation)
0 no degradation
1 Light
2 Moderate
3 Strong
4 Extreme
Degree Quantity of Soil Erosion
no degradation lt200
Light 200-2500
Moderate 2500-5000
Strong 5000-8000
Extreme 8000
Wind and Water Erosion
(Theoretic values Unit Soil Erosion Modulus(tkm2a))
The LD Degree of a land plot
bullwater-erosion of Rangeland Woodland Bare land
indicator standard score importance
Slope
degree
le 5 1 1
6-15 2
16-25 3
gt25 4
Erosion
gully area
ratio
le 5 15 15
6-15 3
16-25 45
gt25 6
Vegetation
Coverage
gt60 2 2
60-41 4
40-21 6
le 20 8
degree Total Score
no degradation(0) 45-6
Light(1) 7-9
Moderate(2) 10-12
Strong(3) 13-15
Extreme(4) 16-18
Index of indicators
degree of degradation
The Degree of a LUS Unit
Degree Total Score Degree No
no degradation 45-6 0
Light 7-9 1
Moderate 10-12 2
Strong 13-15 3
Extreme 16-18 4
The Degree of a LUS Unit
bull Use the method of the
weighted average
sumAiDi
D=
sumAi
Ai is the area of the ith land plot
Di is the Degree of ith land plot (Di value is from 0 to 4)
degree Degree value
Light 1
Moderate 2
Strong 3
Extreme 4
Plot No 1-1 1-2 1-3 total
LD area (ha) 158 216 183 557
LD Degree 2 3 1
Extend of LD area 28 65 51 50
LUS The Forestry-no usenot management (water erosion)
Average degree Degree value
Light 10-17
Moderate 18-25
Strong 26-33
Extreme 34-40
sumAiDi
D= =(158times2+216times3+183times1) (158+216+183)=188
sumAi
Item4 Rate of degradation
3 rapidly increasing
2 moderately increasing
1 slowly increasing
0 no change in degradation
-1 slowly decreasing
-2 moderately decreasing
-3 rapidly decreasing
Indicators (The rate of the land degradation is due to the
changes of degree and area of each degraded LUS)
bullThe area of the degradation land
bullThe degree of the degradation land
The change rate of the area of the degradation land
in the last 10 years (X=)
The change rate of the higher degree area (Y=)
score score
Xgt10 3 Xgt20 3
5ltXle10 2 10ltXle20 2
1ltX le5 1 1ltX le10 1
-1 leXle1 0 -1 leXle1 0
-1ltX le-5 -1 -1ltX le-10 -1
-5ltXle-10 -2 -10ltXle-20 -2
Xlt-10 -3 Xlt-20 -3
The assessment method of degradation Rate
Rate Value (x+y)
3 rapidly increasing 5-6
2 moderately increasing 3-4
1 slowly increasing 1-2
0 no change in degradation 0
-1 slowly decreasing 1-(-2)
-2 moderately decreasing -3-(-4)
-3 rapidly decreasing -5-(-6)
Item5 Direct causes (12 drivers)
s Soil management improper management of the soil
1048707 (s1) cultivation of unsuitable soils
1048707 (s2) missing or insufficient soil conservation measures
1048707 (s3) heavy machinery
1048707 (s4) tillage practice (ploughing harrowing etc)
1048707 (s5) others
c Crop management improper management of grass shrub and tree crops
1048707 (c1) reduction of plant cover and residues
1048707 (c2) inappropriate application of manure fertilizer herbicides pesticides and other agrochemicals
1048707 (c3) nutrient mining excessive removal without appropriate replacement of nutrients
1048707 (c4) shortening of the fallow period in shifting cultivation
1048707 (c5) inappropriate irrigation
1048707 (c6) inappropriate use of water in rainfed agriculture 1048707
(c7) others
f Deforestation and removal of natural vegetation extensive removal of natural vegetation
1048707 (f1) large-scale commercial forestry
1048707 (f2) expansion of urban settlement areas and industry
1048707 (f3) conversion to agriculture
1048707 (f4) forest grassland fires
1048707 (f5) road construction
1048707 (f6) others
e Over-exploitation of vegetation for domestic use
1048707 (e1) excessive gathering of fuel wood (local) timber fencing materials
1048707 (e2) removal of fodder
1048707 (e3) others
g Overgrazing
1048707 (g1) excessive numbers of livestock
1048707 (g2) trampling along animal paths
1048707 (g3) others
i Industrial activities and mining
1048707 (i1) industry
1048707 (i2) mining
1048707 (i3) waste deposition
1048707 (i4) others
u Urbanisation and infrastructure development
1048707 (u1) settlements and roads
1048707 (u2) (urban) recreation
1048707 (u3) others
p Discharges leading to point contamination of surface and ground water resources
1048707 (p1) sanitary sewage disposal
1048707 (p2) waste water discharge
1048707 (p3) others
q Release of airborne pollutants from industrial activities and urbanisation
1048707 (q1) contamination of vegetation crops and soil
1048707 (q2) contamination of surface and ground water resources
1048707 (q3) others
w Disturbance of the water cycle
1048707 (w1) lower infiltration rates increased surface runoff
1048707 (w2) others
o Over-abstraction excessive withdrawal of water 1048707 (o1) irrigation
1048707 (o2) industrial use
1048707 (o3) domestic use
1048707 (o4) decreasing water use efficiency
1048707 (o5) others
n Natural causes
1048707 (n1) change in temperature
1048707 (n2) change of seasonal rainfall
1048707 (n3) heavyextreme rainfall (intensity and amounts)
1048707 (n4) windstorms dust storms
1048707 (n5) floods
1048707 (n6) droughts
1048707 (n7) other natural causes
p Population Pressure
t Land Tenure(使用期限)
h Poverty wealth
l Labour Availability
r Inputs and infrastructure
e Education access to knowledge and support services
w War and conflict
g Governance institutional
o Others (specify)
Item6 Indirect causes (pressures)
(multinomial selection)
Item7Impact on ecosystem services (Impact indicator)
P Productive Services (P1) production and risk
(P2) water for human animal and plant
consumption
(P3) land availability
S Socio-cultural services and human
well-being (S1) spiritual aesthetic cultural landscape and
heritage values recreation and tourism
(S2) education and knowledge (including
indigenous knowledge)
(S3) conflicts
(S4) food security health and poverty
(S5) net income
(S6) private and public infrastructure (buildings
roads dams etc)
(1)Type of impact
E Ecological services (E1) water cycle floods storms excessive rains
(E2) water cycle drought dry season flow availability of
water
(E3) organic matter status
(E4) soil cover (vegetation mulch etc)
(E5) soil structure surface (eg sealing and crusting) and
subsoil affecting infiltration water and nutrient holding
capacity salinity
(E6) nutrient cycle (N P K) and the carbon cycle
(E7) soil formation (including wind-deposited soils)
(E8) biodiversity
(E9) greenhouse gas emission
(E10) (micro)-climate (wind shade temperature humidity)
(multinomial selection)
The Impact of LD on ES should be Negative(-1-2-3)
(2)Level of impact
county LUS code Type (state)
Extent() Degree Rate Remarks
Horqin Youyi Zhongqi
152222002
E 2 1 0 protected since 2000
W 26 1 -1
152222008 E 56 2 0 communal grazing area
152222009
E 2 1 0
deep slope farmland
W 31 1 1
152222010
E 32 1 0
Sandy rainfed farmland
W 15 2 0
Item8 Remarks
The result of Step3
Step4 Land Conservation and Management (LSM technology)
bullName
bullConservation groups
bullConservation measures
bullPurpose
bullExtent of SLM Technology
bullDegradation addressed
bullEffectiveness of implemented SLM Technologies
bullEffectiveness trend of SLM Technologies
bullImpact on ecosystem services(ESS )and Level
bullPeriod of implementation
bullUsing The Best SLM Technologies (QT)
bullRemark
mdashmdash12 Items
The sustainable
management (SLM)
Technologies (QT) and
Approaches (QA) with a
detailed information on
conservation activities will
be provided in this step
Item1 Name of SLM
There are 94 cases of SLM technology in China
Provide a common name for the most widespread technologies applied within
each land use system unit
English Name Chinese Name definition Code
Closing rangeland to Facilitate
Vegetation Restoration
草原封禁植被恢复
The use of fences will be
degraded grassland fenced
off to prohibit grazing that
interference Natural
vegetation restoration
1
Returning farmland to forest 退耕还林 Planting trees in farmland
and building the forest 2
Bench Terraces Construction
for farmland 农田梯田建设
The sloping land erosion
has occurred by
mechanical or manual
terracing
3
Returning farmland to forest
Fixing mobile sand dunes by
Straw square barriers
1 CA Conservation agriculture mulching (mainly agronomic measures)
2 NM Manuring composting nutrient management (mainly agronomic
measures)
3 RO Rotational system shifting cultivation fallow slash and burn
4 VS Vegetative strips cover (mainly vegetative measures)
5 AF Agroforestry (mainly vegetative combined with agronomic)
6 AP Afforestation and forest protection
7 RH Gully control rehabilitation (structural combined with vegetative)
8 TR Terraces (structural but often combined with vegetative and
agronomic measures)
Item2 SLM groups(19groups)
(According the characters and functions of technology)
9 GR Grazing land management (management practices with associated vegetative
and agronomic measures)
bull WH Water harvesting (structural but also combined)
bull SA Groundwater salinity regulation water use efficiency
bull WQ Water quality improvements (structural management and vegetative)
bull SD Sand dune stabilization (vegetative structural and management)
bull CB Coastal bank protection (vegetative structural and management)
bull PR Protection against natural hazards (floods storms earth quake etc)
bull SC Storm water control road runoff (structural vegetative management)
bull WM Water Management
bull Co Conservation of natural biodiversity
bull OT Other (specify)
A Agronomic soil management
A1 Vegetation soil cover
A2 Organic matter soil fertility
A3 Soil surface treatment
A4 Subsurface treatment
A5 Others
V Vegetative
V1 Tree and shrub cover
V2 Grasses and perennial herbaceous plants
V3 Clearing of vegetation
V4 Others
Item3 Conservation measures
(According the measure of technology)
bull S Structural
bull S1 Bench terraces (lt6)
bull S2 Forward sloping terraces (gt6)
bull S3 Bunds banks
bull S4 Graded ditches waterways
bull S5 Level ditches pits
bull S6 Dams pans store excessive water
bull S7 Reshaping surface
bull S8 Walls barriers palisades
bull S9 Others
bull M Management
bull M1 Change of land use type
bull M2 Change of management intensity level
bull M3 Layout according to natural and human environment
bull M4 Major change in timing of activities
bull M5 Control change of species composition
bull M6 Others
bull CB Combinations
bull Any combinations of the above measures are possible
Item4 Purposes of the SLM Technologies
P Prevention implies the use of conservation measures that maintain natural
resources and their environmental and productive function on land that may be prone
to degradation The implication is that good land management practice is already in
place it is effectively the antithesis of human-induced land degradation
M Mitigation is intervention intended to reduce ongoing degradation This comes in at
a stage when degradation has already begun The main aim here is to halt further
degradation and to start improving resources and their functions Mitigation impacts
tend to be noticeable in the short to medium term this then provides a strong
incentive for further efforts The word lsquomitigationrsquo is also sometimes used to describe
reducing the impacts of degradation
R Rehabilitation is required when the land is already degraded to such an extent that
the original use is no longer possible and land has become practically unproductive
Here longer-term and more costly investments are needed to show any impact
Item5 Extent of SLM Technology The area percentage of mapping unit(each LUS unit) of the SLM
technology
Item6 Degradation addressed Specify the degradation type addressed by the SLM Technology
The degradation types are same with Step3
Item7 Effectiveness of implemented SLM Technologies
4 Very high
3 High
2 Moderate
1 Low
Item8 Effectiveness trend of SLM Technologies
1 increase in effectiveness
0 no change in effectiveness
-1 decrease in effectiveness
Item9 Impact on ecosystem services (Impact indicator)
P Productive Services
(P1) production and risk
(P2) water for human animal and plant
consumption
(P3) land availability
S Socio-cultural services and human
well-being
(S1) spiritual aesthetic cultural
landscape and heritage values
recreation and tourism
(S2) education and knowledge
(S3) conflicts
(S4) food security health and poverty
(S5) net income
(S6) private and public infrastructure
(1)Type of impact
E Ecological services
(E1) water cycle floods storms
excessive rains
(E2) water cycle drought dry season
flow availability of water
(E3) organic matter status
(E4) soil cover
(E5) soil structure surface and subsoil
affecting infiltration water and
nutrient holding capacity salinity
(E6) nutrient cycle (N P K) and the
carbon cycle
(E7) soil formation
(E8) biodiversity
(E9) greenhouse gas emission
(E10) (micro)-climate
(2)Level of impact
bull -3 high negative impact (more than 50)
bull -2 negative impact (10-50)
bull -1 low negative impact (0mdash10)
bull 1 low positive impact (0mdash10)
bull 2 positive impact (10mdash50)
bull 3 high positive impact (more than 50)
The Impact of LSM on ES should be Positive(123)
Item10 Period of implementation
Indicate since what year the technology has been implemented
Item11 Reference to QT (best technology practices)
Summary a series of best technologies and to identify whether this technology is one of them
Add the reference number of best SLM Technologies
Bench Terraces
Construction for farmland Grass Grid Sand Barrier High Vertical Live
Sand Barriers
51
The best technology practices(51 types in China)
The book of The
best practices for
LD Control in
China has been
published
helliphelliphelliphelliphelliphelliphelliphelliphelliphelliphelliphelliphelliphelliphelliphelliphelliphelliphelliphelliphelliphelliphelliphelliphelliphelliphellip
Item11 Remark
county LUS code LD Type (state)
Name of SLM Remarks
Horqin Youyi Zhongqi
152222002
E Returning the
Cultivated Land
to Forestland
National project since 2000
152222009 W Bench Terraces
Construction for
farmland
Great potential for large scale
The result of the Step4
The assessment unit shrub-pastoralism moderate or higher in Yangyuan County hebei Province
Step5 Expert recommendation
Item1 Recommendation
A Adaptation the degradation is either too serious to deal with
or it is not worthwhile the effort to invest in
P prevention the use of conservation measures where some
degradation has already occurred
M Mitigation intervention intended to reduce ongoing
degradation
R Rehabilitation It is the intervention when the land is already
degraded to such an extent need longer-term and more costly
investments
Item2 Remarks and additional information
Comments and Suggestions
mdashmdash2 Itemas
The result of the Step5
Ⅲ Conclusion
1 The practical methodology LADA method has integrated available data and collected information expertrsquos
knowledge and experiences to assess land degradation and sustainable management
in an economical mode
2 The adoptive DPSIR framework The State-drivers-pressures-impact-reaction Analyses System is available
3 Practical results and a lot of information
Through the LADA project a lot of information related to the land degradation and sustainable conservation were got
4 Gaps (1)Indicators and Their assessment standards should be more in detail and quantified
bull LU Intensity
bull LD Degree
bull LD Rate
bull Impact Level
(2)Experts from different fields with the different background knowledge and understanding there will be a little differences in evaluation results on the same land
assessment
Thank you
bull Preparation
bull Assessment process for each step
bull Conclusion
Contents
1 To answer questions Through the LADA project
bull What type of land degradation is actually happening
bull
bull Where the land degradation is happening
bull Why the land degradation is happening
bull What are the impacts of land degradation on the ecosystem
bull What has been done for LD control and
bull what should be done in terms of Sustainable Land Management in future
Ⅰ Preparation Work
2 The methodology
bullBase on the LUS Mapping result
bullUse relevant available data and information combining
expertsrsquo knowledge and experience
bullTo fill the LADA manual table and answer 24 question
bullThrough the DPSIR framework to analyze the national land
degradation
Drivers-pressure-state-impact-response (DPSIR)
bullTo obtaining a series of data and information related land degradation SLM technology
bullTo get the way to establishing a assessment system on land use land degradation and land management
bullTo prepare the way and identify areas of greatest interest
for more local and detailed assessments( find the hot ponits and bright points for Local Lada)
bullTo provide information and reliable basis to decision
makers and different UN conventions in particular UNCCD
UNCBD and UNFCCC
3The Objectives
4 The Establishment of Work Team
bull National LADA coordinator (Gov official)
bull Project staff (organization and management)
bull Assessment experts
Multi-departments agriculture water resource forestry and statistics
Multi-subjects desertification soil conservation land use grazing management livestock agriculture forestry geography statistic and economy analysis GIS and remote sensing
Multi-levels central government department Province department county department
5 Training and Workshop
bull To understand the WOCATLADA
manual well including methodology
indicators and assessment technical
routes
bull To discuss the technical problems
and make the work scheme
6 LADA Manual development and complement
Refinement of the LADA Work Manual on the base of the
WOCATLADA Manual
According the situation and characteristics of land degradation in your
country the LADA Work Manual on national level should be refined as your
own manual
Some assessment indicators and method should be added LD type mdashFreeze-thawing in China
Some contents need to be more in detail land use intensity
land degradation degree
LD Rate
conservation names
bull national desertification monitoring data and database
bull national soil erosion monitoring data and database
bull Farmland management data
bull Rangeland degradation monitoring data
bull Society and economy statistics data
bull National forest resource monitor and assessment
bull National ecological construction data (forestry
measures soil and water conservation measures
pasture management agricultural practices etc)
中国荒漠化土地分布图(2004年)
Distribution of Desertification in China
7 Collection of Available Datasets and Information
8 The relevant data and information supplement
The field survey on LD and Vegetation
Social and economic data collection
Ⅱ Process
1 Land use systems mapping
12kinds of Mapping data
Land cover irrigation livestock city protected area temperature crop species and
growth period DEM (digital elevation models) soil population GDP (gross
domestic product )
The basic data is the Land cover
Overlay other 11 kinds data with Land Cover
26 LUS types
and their codes
Number Land use system types Code
1 Forestry-no usenot managed (Natural) 001
2 Forestry-Protected areas 002
3 Forestry-Pastoralism moderate or higher 004
4 Herbaceous-no usenot managed (Natural) 007
5 Herbaceous-Protected areas 008
6 Herbaceous-Extensive pastoralism 009
7 Herbaceous-Mod Intensive pastoralism 010
8 Herbaceous-Intensive pastoralism 011
9 Rainfed Agriculture (Subsistencecommercial) 013
10 Agro-pastoralism Mod Intensive 014
11 Agro-pastoralism Intensive 015
12 Agro-pastoralism mod intensive or higher with Large scale irrigation 016
13 Agriculture-Large scale irrigation (gt 25 pixel size) 017
14 Agriculture-Protected areas 018
15 Urban areas 019
16 Wetlands-no usenot managed (Natural) 020
17 Wetlands-Protected areas 021
18 Wetlands-Agro-pastoralism 023
19 Bare areas-no usenot managed (Natural) 024
20 Bare areas-Protected areas 025
21 Bare areas-Extensive pastoralism 026
22 Water-Protected areas 029
23 Water-Inland Fisheries 030
24 shrub-no usenot managed (Natural) 101
25 shrub-Protected areas 102
26 shrub-Pastoralism moderate or higher 103
2 The confirmation of the assessment units
(1) The assessment area and assessment administration unit
administration
assessment unit
county (365 counties
in 12 provinces)
assessment area
dryland (aridity index is 16 to 16 excepting desert and Gobi)
National assessment units
LUS (26) overlay Administration
counties (365)
(2)Overlay the LUS map with the administration
boundary of the assessment area
In China the assessment
administration unit is county the
assessment area includes 365
counties and 2875 LUS units
3The standardization of questionaire and LUS Unit
Code
LUS Unit Code
The Formatted Questionnaire table
a assessment experts are divided into several working groups
each consisting of 3-4 experts
b Each group is responsible for several administration units
(experts should be familiar with the assessment district )
c the assessment results will be shared between the groups to
correct mistakes and exchange opinions
D Before delivering FAO the LADA working group will solicit
the expert committee suggestions carry out the revision and
supplement to the assessment results
4 Work Regulations and procedures
steps Questions
1Experts
Information
Name subject institute Address
2Land use Area trend of the LUS
Land use intensity trends
3Land
degradation
Types of land degradation
Extent of the degradation type
Degree of land degradation
Rate of degradation
Direct causes of land degradation
Indirect causes of land degradation
Impact on ecosystem services
Level of impact on ecosystem services
5 The assessment
steps Questions
4Land
conservation
(Response
indicators)
Name of the Technology for the Conservation
and Management
Conservation groups
Conservation measures
Purpose of the SLM Technologies
Extent of SLM Technology
Degradation addressed
Effectiveness of implemented SLM Technologies
Effectiveness trend of SLM Technologies
Impact on ecosystem services
Level of impact on ecosystem services
Period of implementation
5Expert
recommend
ation
Recommendation
Remarks and additional information
Step1 Experts Information
Step2 Assessment on Land use system (LUS)
(3 items)
Item1 The area trend of LUS unit
(the are changed in last 10 years)
bull2 rapidly increasing ie extended gt 10
bull1 slowly increasing ie extended lt 10
bull0 remains stable ie no changed
bull -1 slowly decreasing ie reducedlt 10
bull -2 rapidly decreasing ie reduced gt 10
Item2 The intensity of LUS unit
bull2 major increase
bull1 moderate increase
bull0 No major changes
bull-1 moderate decrease
bull -2 major decrease
Indicators and value (increase is negative- decrease is positive+)
farmlandMachinery use amount of pesticide and
chemical fertilizer use irrigation organic manure use etc
forest landcutting grazing conservation afforestation etc
Rangeland Amount of livestock overload (overgrazing) livestock
intensity conservation etc
Wetland cultivation drainage grazing conservation management etc
Bareland overgrazing management method livestock intensity
increase or decrease etc
water pollution fishing (pisciculture) conservation etc
The reasons of each LUS for
Area Change
Intensity Change
Item3 Remarks
LUS Type Area Trend Intensity Trend Remark
Forestry-Protected
areas
0 -1 Conservation and
afforestation
Rainfed Agriculture 2 0 Reclamation of
rangeland
The result of Step2
Step2 Land degradation for per land use system unit
bullType of land degradation
bull Extent()
bull Degree
bull Rate
bull Driver
bull Pressure
bull Effect on ecosystem service
bullRemarks
mdashmdash8 items
1 O No degradation
2 W Soil erosion by water bull Wt Loss of topsoil surface erosion
bull Wg Gully erosion gullying
bull Wm Mass movements landslides
bull Wr Riverbank erosion
bull Wc Coastal erosion
bull Wo Offsite degradation effects
3 E Soil erosion by wind bull Et Loss of topsoil
bull Ed Deflation and deposition
bull Eo Offsite degradation effects
4 C Chemical soil deterioration bull Cn Fertility decline and reduced organic matter content
bull Ca Acidification
bull Cp Soil pollution
bull Cs Salinisation alkalinisation
bull C Chemical soil deterioration
bull Cn Fertility decline and reduced organic matter content
Item1 Types of land degradation (multinomial selection)
(7 types and 36 subtypes)
5 P Physical soil deterioration bullPc Compaction
bullPk Sealing and crusting
bullPw Waterlogging
bullPs Subsidence of organic soils settling of soil
bullPu Loss of bio-productive function due to other activities
6 H Water degradation bullHa Aridification
bullHs Change in quantity of surface water
bullHg Change in groundwater aquifer level
bullHp Decline of surface water quality
bullHq Decline of groundwater quality
bullHw Reduction of the buffering capacity of wetland areas
7 B Biological degradation bullBc Reduction of vegetation cover
bullBh Loss of habitats
bullBq Quantity biomass decline
bullBf Detrimental effects of fires
bullBs Quality and species composition diversity decline
bullBl Loss of soil life
bullBp Increase of pests diseases loss of predators
Chemical soil deterioration
(Salinisationalkalinisation)
Wind erosion
Water erosion Biological degradation
Range land degradation
Item2 Extent() of LDThe percentage of each type of land degradation in the assessment unit(LUS)
Item3 Degree of LD (for each type of land degradation)
0 no degradation
1 Light
2 Moderate
3 Strong
4 Extreme
Degree Quantity of Soil Erosion
no degradation lt200
Light 200-2500
Moderate 2500-5000
Strong 5000-8000
Extreme 8000
Wind and Water Erosion
(Theoretic values Unit Soil Erosion Modulus(tkm2a))
The LD Degree of a land plot
bullwater-erosion of Rangeland Woodland Bare land
indicator standard score importance
Slope
degree
le 5 1 1
6-15 2
16-25 3
gt25 4
Erosion
gully area
ratio
le 5 15 15
6-15 3
16-25 45
gt25 6
Vegetation
Coverage
gt60 2 2
60-41 4
40-21 6
le 20 8
degree Total Score
no degradation(0) 45-6
Light(1) 7-9
Moderate(2) 10-12
Strong(3) 13-15
Extreme(4) 16-18
Index of indicators
degree of degradation
The Degree of a LUS Unit
Degree Total Score Degree No
no degradation 45-6 0
Light 7-9 1
Moderate 10-12 2
Strong 13-15 3
Extreme 16-18 4
The Degree of a LUS Unit
bull Use the method of the
weighted average
sumAiDi
D=
sumAi
Ai is the area of the ith land plot
Di is the Degree of ith land plot (Di value is from 0 to 4)
degree Degree value
Light 1
Moderate 2
Strong 3
Extreme 4
Plot No 1-1 1-2 1-3 total
LD area (ha) 158 216 183 557
LD Degree 2 3 1
Extend of LD area 28 65 51 50
LUS The Forestry-no usenot management (water erosion)
Average degree Degree value
Light 10-17
Moderate 18-25
Strong 26-33
Extreme 34-40
sumAiDi
D= =(158times2+216times3+183times1) (158+216+183)=188
sumAi
Item4 Rate of degradation
3 rapidly increasing
2 moderately increasing
1 slowly increasing
0 no change in degradation
-1 slowly decreasing
-2 moderately decreasing
-3 rapidly decreasing
Indicators (The rate of the land degradation is due to the
changes of degree and area of each degraded LUS)
bullThe area of the degradation land
bullThe degree of the degradation land
The change rate of the area of the degradation land
in the last 10 years (X=)
The change rate of the higher degree area (Y=)
score score
Xgt10 3 Xgt20 3
5ltXle10 2 10ltXle20 2
1ltX le5 1 1ltX le10 1
-1 leXle1 0 -1 leXle1 0
-1ltX le-5 -1 -1ltX le-10 -1
-5ltXle-10 -2 -10ltXle-20 -2
Xlt-10 -3 Xlt-20 -3
The assessment method of degradation Rate
Rate Value (x+y)
3 rapidly increasing 5-6
2 moderately increasing 3-4
1 slowly increasing 1-2
0 no change in degradation 0
-1 slowly decreasing 1-(-2)
-2 moderately decreasing -3-(-4)
-3 rapidly decreasing -5-(-6)
Item5 Direct causes (12 drivers)
s Soil management improper management of the soil
1048707 (s1) cultivation of unsuitable soils
1048707 (s2) missing or insufficient soil conservation measures
1048707 (s3) heavy machinery
1048707 (s4) tillage practice (ploughing harrowing etc)
1048707 (s5) others
c Crop management improper management of grass shrub and tree crops
1048707 (c1) reduction of plant cover and residues
1048707 (c2) inappropriate application of manure fertilizer herbicides pesticides and other agrochemicals
1048707 (c3) nutrient mining excessive removal without appropriate replacement of nutrients
1048707 (c4) shortening of the fallow period in shifting cultivation
1048707 (c5) inappropriate irrigation
1048707 (c6) inappropriate use of water in rainfed agriculture 1048707
(c7) others
f Deforestation and removal of natural vegetation extensive removal of natural vegetation
1048707 (f1) large-scale commercial forestry
1048707 (f2) expansion of urban settlement areas and industry
1048707 (f3) conversion to agriculture
1048707 (f4) forest grassland fires
1048707 (f5) road construction
1048707 (f6) others
e Over-exploitation of vegetation for domestic use
1048707 (e1) excessive gathering of fuel wood (local) timber fencing materials
1048707 (e2) removal of fodder
1048707 (e3) others
g Overgrazing
1048707 (g1) excessive numbers of livestock
1048707 (g2) trampling along animal paths
1048707 (g3) others
i Industrial activities and mining
1048707 (i1) industry
1048707 (i2) mining
1048707 (i3) waste deposition
1048707 (i4) others
u Urbanisation and infrastructure development
1048707 (u1) settlements and roads
1048707 (u2) (urban) recreation
1048707 (u3) others
p Discharges leading to point contamination of surface and ground water resources
1048707 (p1) sanitary sewage disposal
1048707 (p2) waste water discharge
1048707 (p3) others
q Release of airborne pollutants from industrial activities and urbanisation
1048707 (q1) contamination of vegetation crops and soil
1048707 (q2) contamination of surface and ground water resources
1048707 (q3) others
w Disturbance of the water cycle
1048707 (w1) lower infiltration rates increased surface runoff
1048707 (w2) others
o Over-abstraction excessive withdrawal of water 1048707 (o1) irrigation
1048707 (o2) industrial use
1048707 (o3) domestic use
1048707 (o4) decreasing water use efficiency
1048707 (o5) others
n Natural causes
1048707 (n1) change in temperature
1048707 (n2) change of seasonal rainfall
1048707 (n3) heavyextreme rainfall (intensity and amounts)
1048707 (n4) windstorms dust storms
1048707 (n5) floods
1048707 (n6) droughts
1048707 (n7) other natural causes
p Population Pressure
t Land Tenure(使用期限)
h Poverty wealth
l Labour Availability
r Inputs and infrastructure
e Education access to knowledge and support services
w War and conflict
g Governance institutional
o Others (specify)
Item6 Indirect causes (pressures)
(multinomial selection)
Item7Impact on ecosystem services (Impact indicator)
P Productive Services (P1) production and risk
(P2) water for human animal and plant
consumption
(P3) land availability
S Socio-cultural services and human
well-being (S1) spiritual aesthetic cultural landscape and
heritage values recreation and tourism
(S2) education and knowledge (including
indigenous knowledge)
(S3) conflicts
(S4) food security health and poverty
(S5) net income
(S6) private and public infrastructure (buildings
roads dams etc)
(1)Type of impact
E Ecological services (E1) water cycle floods storms excessive rains
(E2) water cycle drought dry season flow availability of
water
(E3) organic matter status
(E4) soil cover (vegetation mulch etc)
(E5) soil structure surface (eg sealing and crusting) and
subsoil affecting infiltration water and nutrient holding
capacity salinity
(E6) nutrient cycle (N P K) and the carbon cycle
(E7) soil formation (including wind-deposited soils)
(E8) biodiversity
(E9) greenhouse gas emission
(E10) (micro)-climate (wind shade temperature humidity)
(multinomial selection)
The Impact of LD on ES should be Negative(-1-2-3)
(2)Level of impact
county LUS code Type (state)
Extent() Degree Rate Remarks
Horqin Youyi Zhongqi
152222002
E 2 1 0 protected since 2000
W 26 1 -1
152222008 E 56 2 0 communal grazing area
152222009
E 2 1 0
deep slope farmland
W 31 1 1
152222010
E 32 1 0
Sandy rainfed farmland
W 15 2 0
Item8 Remarks
The result of Step3
Step4 Land Conservation and Management (LSM technology)
bullName
bullConservation groups
bullConservation measures
bullPurpose
bullExtent of SLM Technology
bullDegradation addressed
bullEffectiveness of implemented SLM Technologies
bullEffectiveness trend of SLM Technologies
bullImpact on ecosystem services(ESS )and Level
bullPeriod of implementation
bullUsing The Best SLM Technologies (QT)
bullRemark
mdashmdash12 Items
The sustainable
management (SLM)
Technologies (QT) and
Approaches (QA) with a
detailed information on
conservation activities will
be provided in this step
Item1 Name of SLM
There are 94 cases of SLM technology in China
Provide a common name for the most widespread technologies applied within
each land use system unit
English Name Chinese Name definition Code
Closing rangeland to Facilitate
Vegetation Restoration
草原封禁植被恢复
The use of fences will be
degraded grassland fenced
off to prohibit grazing that
interference Natural
vegetation restoration
1
Returning farmland to forest 退耕还林 Planting trees in farmland
and building the forest 2
Bench Terraces Construction
for farmland 农田梯田建设
The sloping land erosion
has occurred by
mechanical or manual
terracing
3
Returning farmland to forest
Fixing mobile sand dunes by
Straw square barriers
1 CA Conservation agriculture mulching (mainly agronomic measures)
2 NM Manuring composting nutrient management (mainly agronomic
measures)
3 RO Rotational system shifting cultivation fallow slash and burn
4 VS Vegetative strips cover (mainly vegetative measures)
5 AF Agroforestry (mainly vegetative combined with agronomic)
6 AP Afforestation and forest protection
7 RH Gully control rehabilitation (structural combined with vegetative)
8 TR Terraces (structural but often combined with vegetative and
agronomic measures)
Item2 SLM groups(19groups)
(According the characters and functions of technology)
9 GR Grazing land management (management practices with associated vegetative
and agronomic measures)
bull WH Water harvesting (structural but also combined)
bull SA Groundwater salinity regulation water use efficiency
bull WQ Water quality improvements (structural management and vegetative)
bull SD Sand dune stabilization (vegetative structural and management)
bull CB Coastal bank protection (vegetative structural and management)
bull PR Protection against natural hazards (floods storms earth quake etc)
bull SC Storm water control road runoff (structural vegetative management)
bull WM Water Management
bull Co Conservation of natural biodiversity
bull OT Other (specify)
A Agronomic soil management
A1 Vegetation soil cover
A2 Organic matter soil fertility
A3 Soil surface treatment
A4 Subsurface treatment
A5 Others
V Vegetative
V1 Tree and shrub cover
V2 Grasses and perennial herbaceous plants
V3 Clearing of vegetation
V4 Others
Item3 Conservation measures
(According the measure of technology)
bull S Structural
bull S1 Bench terraces (lt6)
bull S2 Forward sloping terraces (gt6)
bull S3 Bunds banks
bull S4 Graded ditches waterways
bull S5 Level ditches pits
bull S6 Dams pans store excessive water
bull S7 Reshaping surface
bull S8 Walls barriers palisades
bull S9 Others
bull M Management
bull M1 Change of land use type
bull M2 Change of management intensity level
bull M3 Layout according to natural and human environment
bull M4 Major change in timing of activities
bull M5 Control change of species composition
bull M6 Others
bull CB Combinations
bull Any combinations of the above measures are possible
Item4 Purposes of the SLM Technologies
P Prevention implies the use of conservation measures that maintain natural
resources and their environmental and productive function on land that may be prone
to degradation The implication is that good land management practice is already in
place it is effectively the antithesis of human-induced land degradation
M Mitigation is intervention intended to reduce ongoing degradation This comes in at
a stage when degradation has already begun The main aim here is to halt further
degradation and to start improving resources and their functions Mitigation impacts
tend to be noticeable in the short to medium term this then provides a strong
incentive for further efforts The word lsquomitigationrsquo is also sometimes used to describe
reducing the impacts of degradation
R Rehabilitation is required when the land is already degraded to such an extent that
the original use is no longer possible and land has become practically unproductive
Here longer-term and more costly investments are needed to show any impact
Item5 Extent of SLM Technology The area percentage of mapping unit(each LUS unit) of the SLM
technology
Item6 Degradation addressed Specify the degradation type addressed by the SLM Technology
The degradation types are same with Step3
Item7 Effectiveness of implemented SLM Technologies
4 Very high
3 High
2 Moderate
1 Low
Item8 Effectiveness trend of SLM Technologies
1 increase in effectiveness
0 no change in effectiveness
-1 decrease in effectiveness
Item9 Impact on ecosystem services (Impact indicator)
P Productive Services
(P1) production and risk
(P2) water for human animal and plant
consumption
(P3) land availability
S Socio-cultural services and human
well-being
(S1) spiritual aesthetic cultural
landscape and heritage values
recreation and tourism
(S2) education and knowledge
(S3) conflicts
(S4) food security health and poverty
(S5) net income
(S6) private and public infrastructure
(1)Type of impact
E Ecological services
(E1) water cycle floods storms
excessive rains
(E2) water cycle drought dry season
flow availability of water
(E3) organic matter status
(E4) soil cover
(E5) soil structure surface and subsoil
affecting infiltration water and
nutrient holding capacity salinity
(E6) nutrient cycle (N P K) and the
carbon cycle
(E7) soil formation
(E8) biodiversity
(E9) greenhouse gas emission
(E10) (micro)-climate
(2)Level of impact
bull -3 high negative impact (more than 50)
bull -2 negative impact (10-50)
bull -1 low negative impact (0mdash10)
bull 1 low positive impact (0mdash10)
bull 2 positive impact (10mdash50)
bull 3 high positive impact (more than 50)
The Impact of LSM on ES should be Positive(123)
Item10 Period of implementation
Indicate since what year the technology has been implemented
Item11 Reference to QT (best technology practices)
Summary a series of best technologies and to identify whether this technology is one of them
Add the reference number of best SLM Technologies
Bench Terraces
Construction for farmland Grass Grid Sand Barrier High Vertical Live
Sand Barriers
51
The best technology practices(51 types in China)
The book of The
best practices for
LD Control in
China has been
published
helliphelliphelliphelliphelliphelliphelliphelliphelliphelliphelliphelliphelliphelliphelliphelliphelliphelliphelliphelliphelliphelliphelliphelliphelliphelliphellip
Item11 Remark
county LUS code LD Type (state)
Name of SLM Remarks
Horqin Youyi Zhongqi
152222002
E Returning the
Cultivated Land
to Forestland
National project since 2000
152222009 W Bench Terraces
Construction for
farmland
Great potential for large scale
The result of the Step4
The assessment unit shrub-pastoralism moderate or higher in Yangyuan County hebei Province
Step5 Expert recommendation
Item1 Recommendation
A Adaptation the degradation is either too serious to deal with
or it is not worthwhile the effort to invest in
P prevention the use of conservation measures where some
degradation has already occurred
M Mitigation intervention intended to reduce ongoing
degradation
R Rehabilitation It is the intervention when the land is already
degraded to such an extent need longer-term and more costly
investments
Item2 Remarks and additional information
Comments and Suggestions
mdashmdash2 Itemas
The result of the Step5
Ⅲ Conclusion
1 The practical methodology LADA method has integrated available data and collected information expertrsquos
knowledge and experiences to assess land degradation and sustainable management
in an economical mode
2 The adoptive DPSIR framework The State-drivers-pressures-impact-reaction Analyses System is available
3 Practical results and a lot of information
Through the LADA project a lot of information related to the land degradation and sustainable conservation were got
4 Gaps (1)Indicators and Their assessment standards should be more in detail and quantified
bull LU Intensity
bull LD Degree
bull LD Rate
bull Impact Level
(2)Experts from different fields with the different background knowledge and understanding there will be a little differences in evaluation results on the same land
assessment
Thank you
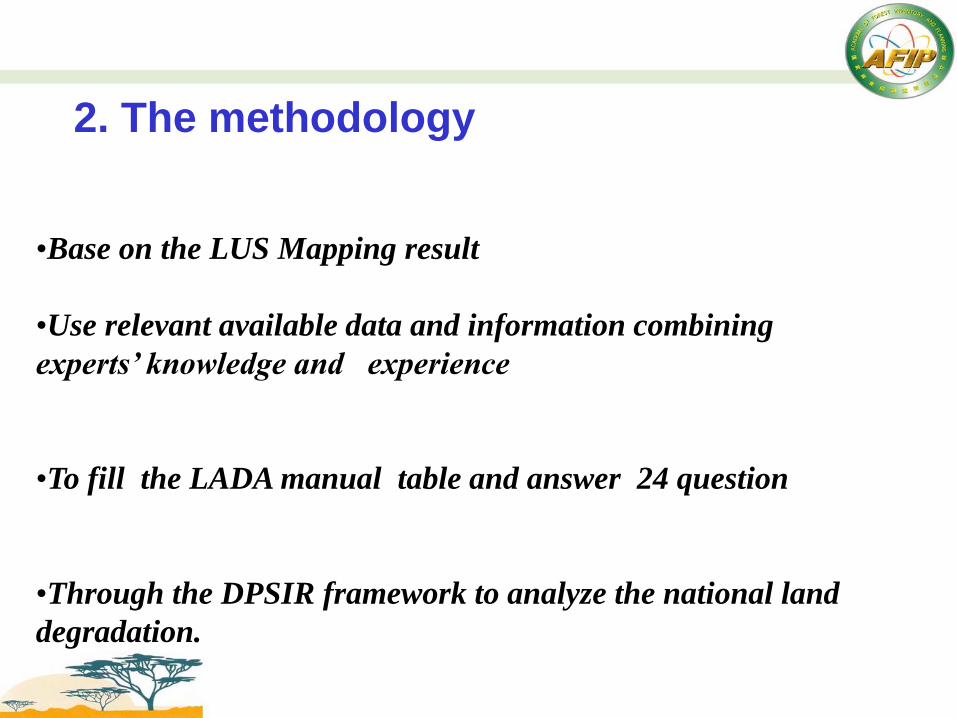
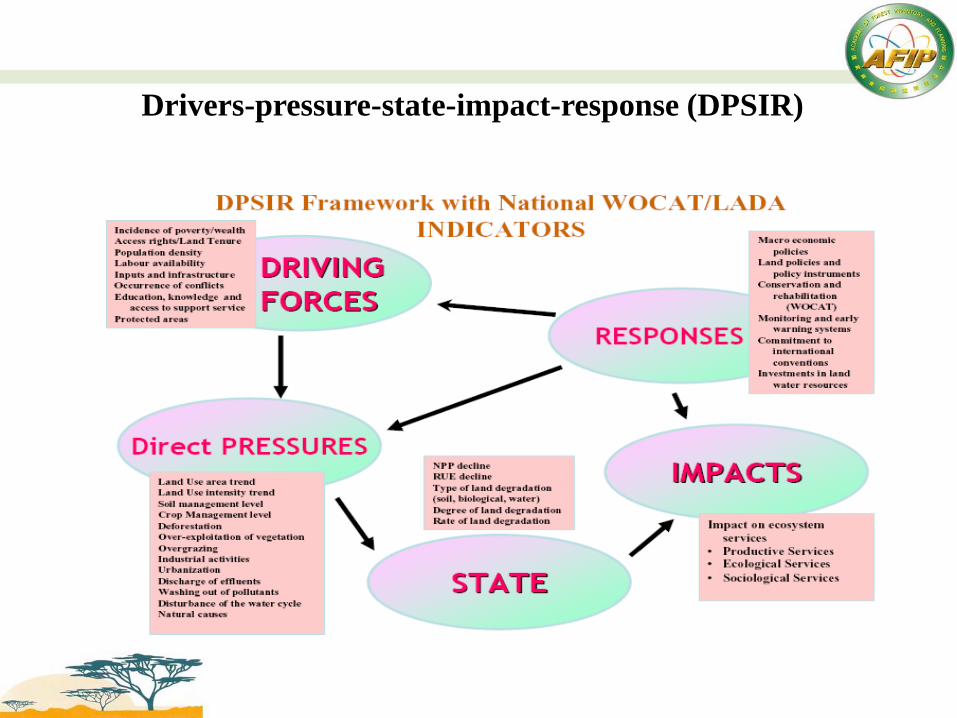
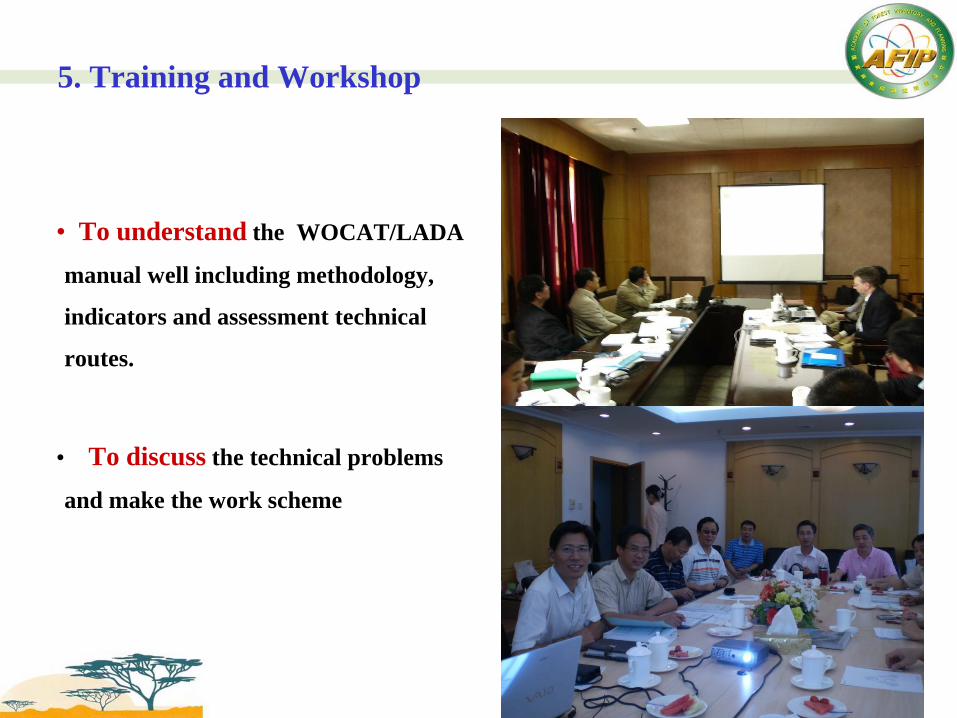
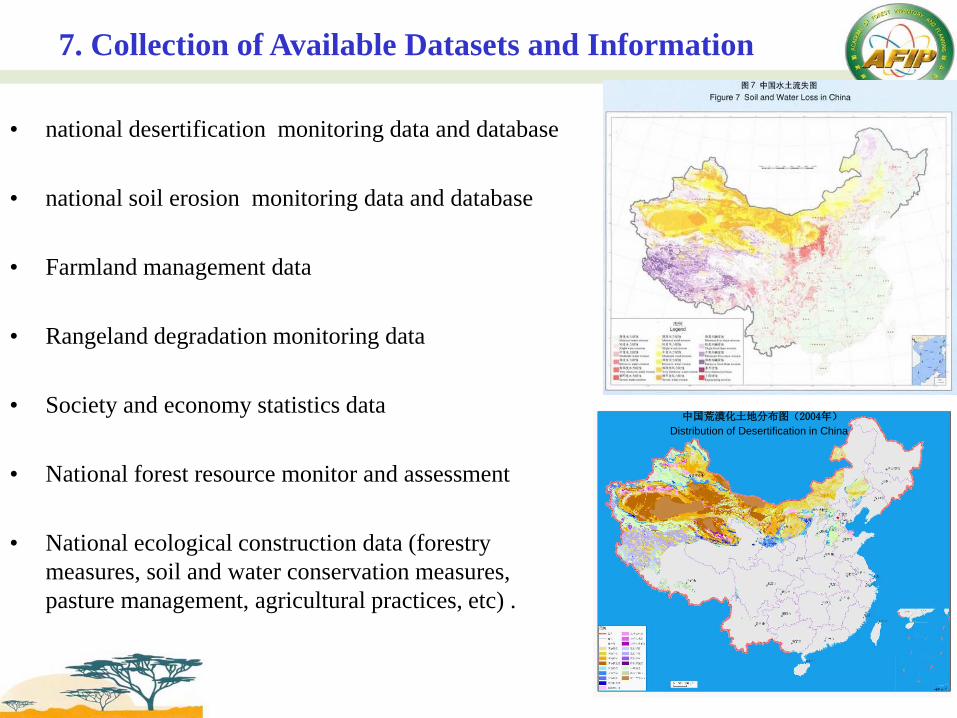
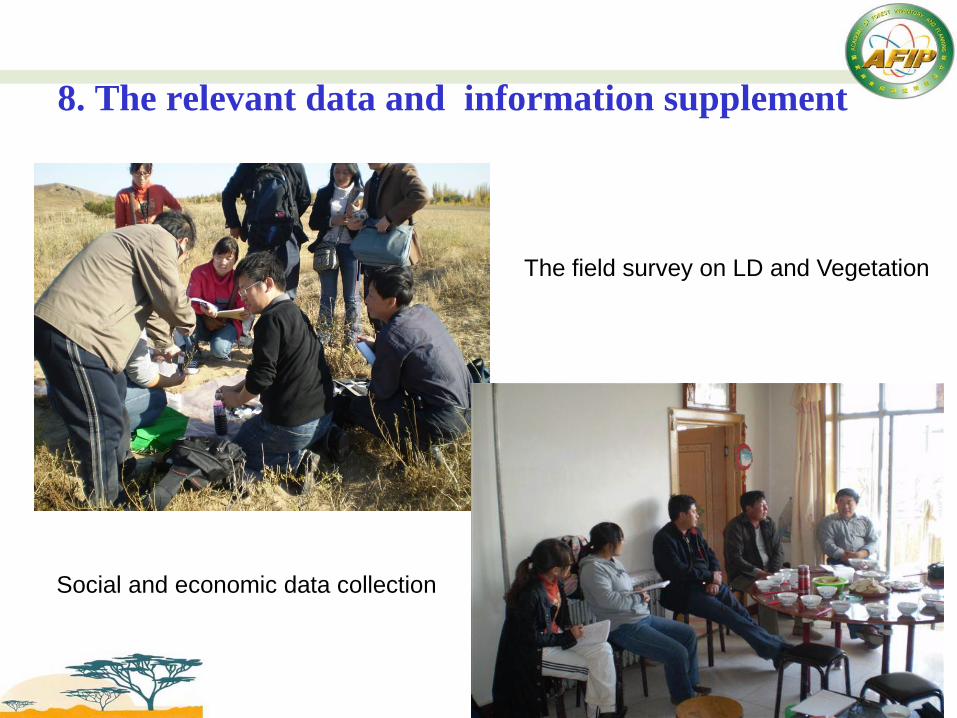
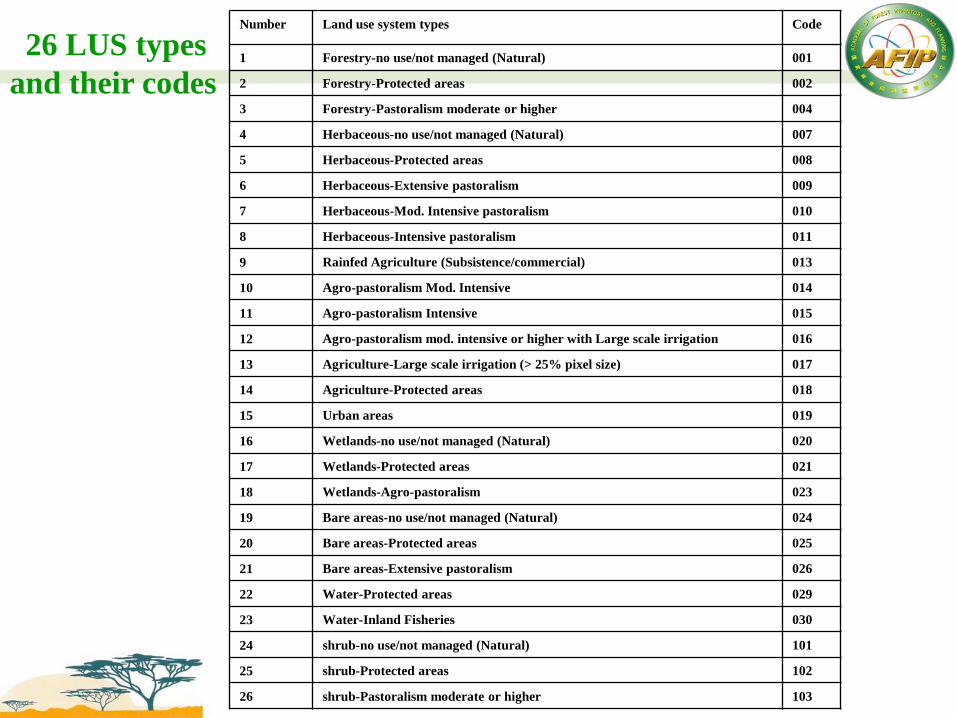
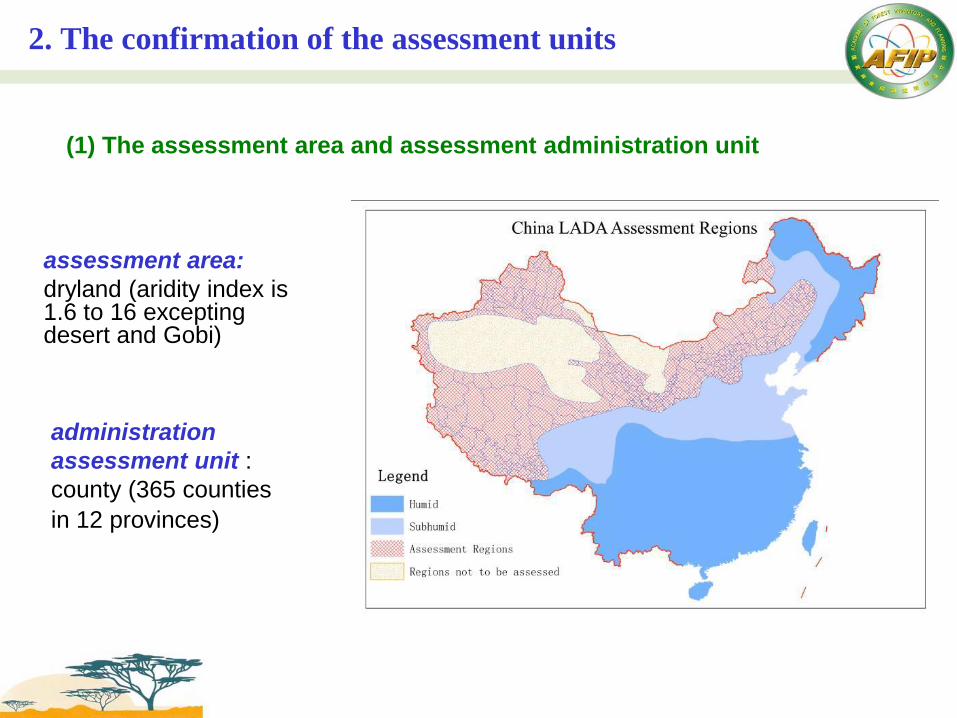
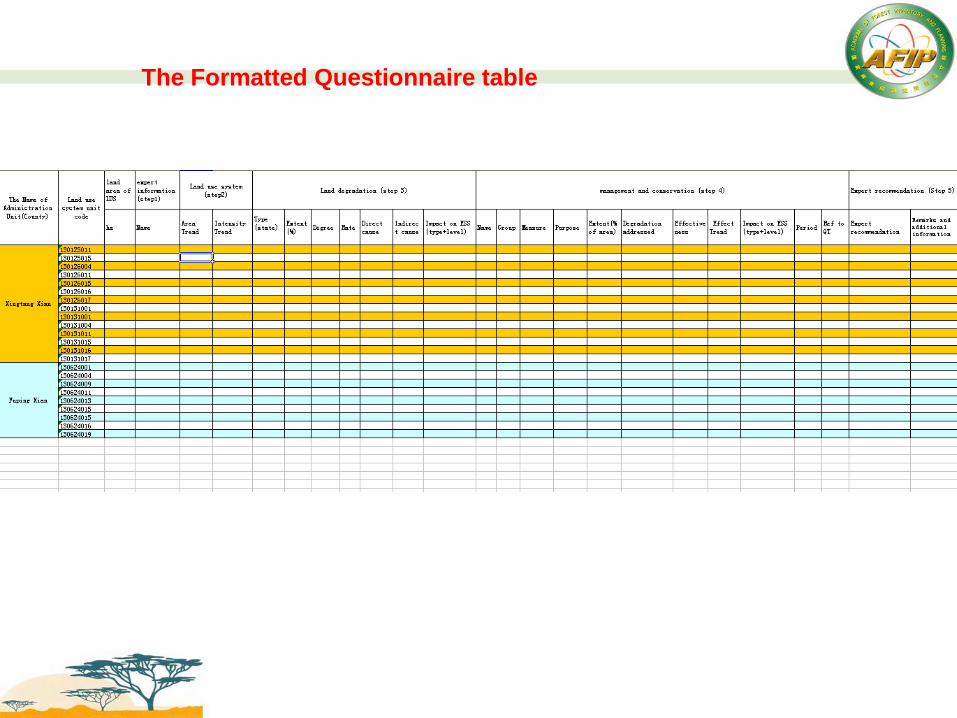
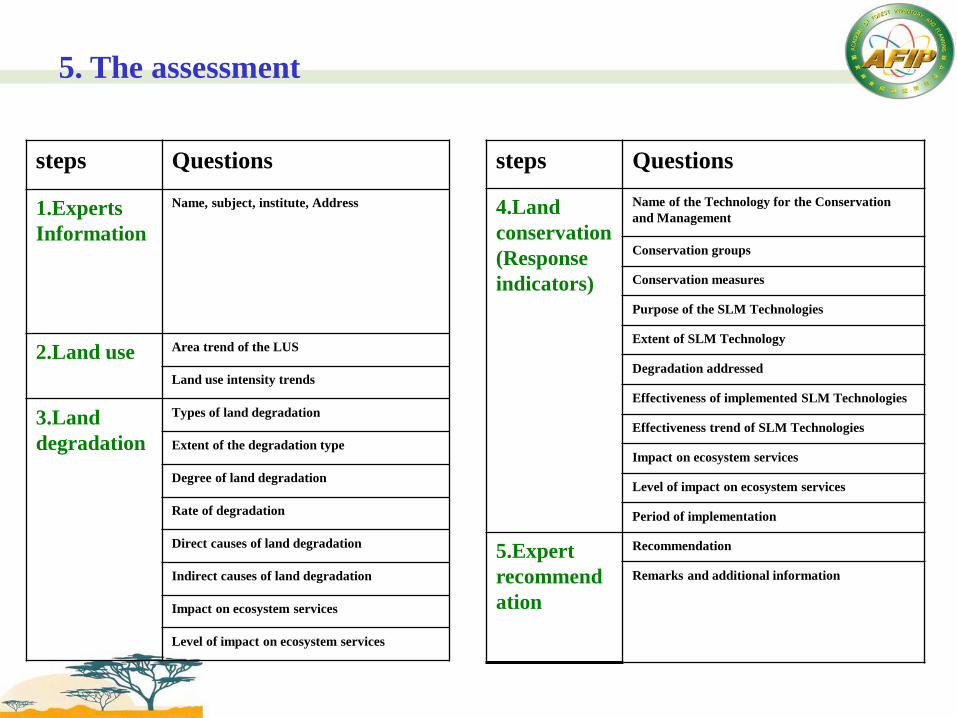
steps Questions
1Experts
Information
Name subject institute Address
2Land use Area trend of the LUS
Land use intensity trends
3Land
degradation
Types of land degradation
Extent of the degradation type
Degree of land degradation
Rate of degradation
Direct causes of land degradation
Indirect causes of land degradation
Impact on ecosystem services
Level of impact on ecosystem services
5 The assessment
steps Questions
4Land
conservation
(Response
indicators)
Name of the Technology for the Conservation
and Management
Conservation groups
Conservation measures
Purpose of the SLM Technologies
Extent of SLM Technology
Degradation addressed
Effectiveness of implemented SLM Technologies
Effectiveness trend of SLM Technologies
Impact on ecosystem services
Level of impact on ecosystem services
Period of implementation
5Expert
recommend
ation
Recommendation
Remarks and additional information
Step1 Experts Information
Step2 Assessment on Land use system (LUS)
(3 items)
Item1 The area trend of LUS unit
(the are changed in last 10 years)
bull2 rapidly increasing ie extended gt 10
bull1 slowly increasing ie extended lt 10
bull0 remains stable ie no changed
bull -1 slowly decreasing ie reducedlt 10
bull -2 rapidly decreasing ie reduced gt 10
Item2 The intensity of LUS unit
bull2 major increase
bull1 moderate increase
bull0 No major changes
bull-1 moderate decrease
bull -2 major decrease
Indicators and value (increase is negative- decrease is positive+)
farmlandMachinery use amount of pesticide and
chemical fertilizer use irrigation organic manure use etc
forest landcutting grazing conservation afforestation etc
Rangeland Amount of livestock overload (overgrazing) livestock
intensity conservation etc
Wetland cultivation drainage grazing conservation management etc
Bareland overgrazing management method livestock intensity
increase or decrease etc
water pollution fishing (pisciculture) conservation etc
The reasons of each LUS for
Area Change
Intensity Change
Item3 Remarks
LUS Type Area Trend Intensity Trend Remark
Forestry-Protected
areas
0 -1 Conservation and
afforestation
Rainfed Agriculture 2 0 Reclamation of
rangeland
The result of Step2
Step2 Land degradation for per land use system unit
bullType of land degradation
bull Extent()
bull Degree
bull Rate
bull Driver
bull Pressure
bull Effect on ecosystem service
bullRemarks
mdashmdash8 items
1 O No degradation
2 W Soil erosion by water bull Wt Loss of topsoil surface erosion
bull Wg Gully erosion gullying
bull Wm Mass movements landslides
bull Wr Riverbank erosion
bull Wc Coastal erosion
bull Wo Offsite degradation effects
3 E Soil erosion by wind bull Et Loss of topsoil
bull Ed Deflation and deposition
bull Eo Offsite degradation effects
4 C Chemical soil deterioration bull Cn Fertility decline and reduced organic matter content
bull Ca Acidification
bull Cp Soil pollution
bull Cs Salinisation alkalinisation
bull C Chemical soil deterioration
bull Cn Fertility decline and reduced organic matter content
Item1 Types of land degradation (multinomial selection)
(7 types and 36 subtypes)
5 P Physical soil deterioration bullPc Compaction
bullPk Sealing and crusting
bullPw Waterlogging
bullPs Subsidence of organic soils settling of soil
bullPu Loss of bio-productive function due to other activities
6 H Water degradation bullHa Aridification
bullHs Change in quantity of surface water
bullHg Change in groundwater aquifer level
bullHp Decline of surface water quality
bullHq Decline of groundwater quality
bullHw Reduction of the buffering capacity of wetland areas
7 B Biological degradation bullBc Reduction of vegetation cover
bullBh Loss of habitats
bullBq Quantity biomass decline
bullBf Detrimental effects of fires
bullBs Quality and species composition diversity decline
bullBl Loss of soil life
bullBp Increase of pests diseases loss of predators
Chemical soil deterioration
(Salinisationalkalinisation)
Wind erosion
Water erosion Biological degradation
Range land degradation
Item2 Extent() of LDThe percentage of each type of land degradation in the assessment unit(LUS)
Item3 Degree of LD (for each type of land degradation)
0 no degradation
1 Light
2 Moderate
3 Strong
4 Extreme
Degree Quantity of Soil Erosion
no degradation lt200
Light 200-2500
Moderate 2500-5000
Strong 5000-8000
Extreme 8000
Wind and Water Erosion
(Theoretic values Unit Soil Erosion Modulus(tkm2a))
The LD Degree of a land plot
bullwater-erosion of Rangeland Woodland Bare land
indicator standard score importance
Slope
degree
le 5 1 1
6-15 2
16-25 3
gt25 4
Erosion
gully area
ratio
le 5 15 15
6-15 3
16-25 45
gt25 6
Vegetation
Coverage
gt60 2 2
60-41 4
40-21 6
le 20 8
degree Total Score
no degradation(0) 45-6
Light(1) 7-9
Moderate(2) 10-12
Strong(3) 13-15
Extreme(4) 16-18
Index of indicators
degree of degradation
The Degree of a LUS Unit
Degree Total Score Degree No
no degradation 45-6 0
Light 7-9 1
Moderate 10-12 2
Strong 13-15 3
Extreme 16-18 4
The Degree of a LUS Unit
bull Use the method of the
weighted average
sumAiDi
D=
sumAi
Ai is the area of the ith land plot
Di is the Degree of ith land plot (Di value is from 0 to 4)
degree Degree value
Light 1
Moderate 2
Strong 3
Extreme 4
Plot No 1-1 1-2 1-3 total
LD area (ha) 158 216 183 557
LD Degree 2 3 1
Extend of LD area 28 65 51 50
LUS The Forestry-no usenot management (water erosion)
Average degree Degree value
Light 10-17
Moderate 18-25
Strong 26-33
Extreme 34-40
sumAiDi
D= =(158times2+216times3+183times1) (158+216+183)=188
sumAi
Item4 Rate of degradation
3 rapidly increasing
2 moderately increasing
1 slowly increasing
0 no change in degradation
-1 slowly decreasing
-2 moderately decreasing
-3 rapidly decreasing
Indicators (The rate of the land degradation is due to the
changes of degree and area of each degraded LUS)
bullThe area of the degradation land
bullThe degree of the degradation land
The change rate of the area of the degradation land
in the last 10 years (X=)
The change rate of the higher degree area (Y=)
score score
Xgt10 3 Xgt20 3
5ltXle10 2 10ltXle20 2
1ltX le5 1 1ltX le10 1
-1 leXle1 0 -1 leXle1 0
-1ltX le-5 -1 -1ltX le-10 -1
-5ltXle-10 -2 -10ltXle-20 -2
Xlt-10 -3 Xlt-20 -3
The assessment method of degradation Rate
Rate Value (x+y)
3 rapidly increasing 5-6
2 moderately increasing 3-4
1 slowly increasing 1-2
0 no change in degradation 0
-1 slowly decreasing 1-(-2)
-2 moderately decreasing -3-(-4)
-3 rapidly decreasing -5-(-6)
Item5 Direct causes (12 drivers)
s Soil management improper management of the soil
1048707 (s1) cultivation of unsuitable soils
1048707 (s2) missing or insufficient soil conservation measures
1048707 (s3) heavy machinery
1048707 (s4) tillage practice (ploughing harrowing etc)
1048707 (s5) others
c Crop management improper management of grass shrub and tree crops
1048707 (c1) reduction of plant cover and residues
1048707 (c2) inappropriate application of manure fertilizer herbicides pesticides and other agrochemicals
1048707 (c3) nutrient mining excessive removal without appropriate replacement of nutrients
1048707 (c4) shortening of the fallow period in shifting cultivation
1048707 (c5) inappropriate irrigation
1048707 (c6) inappropriate use of water in rainfed agriculture 1048707
(c7) others
f Deforestation and removal of natural vegetation extensive removal of natural vegetation
1048707 (f1) large-scale commercial forestry
1048707 (f2) expansion of urban settlement areas and industry
1048707 (f3) conversion to agriculture
1048707 (f4) forest grassland fires
1048707 (f5) road construction
1048707 (f6) others
e Over-exploitation of vegetation for domestic use
1048707 (e1) excessive gathering of fuel wood (local) timber fencing materials
1048707 (e2) removal of fodder
1048707 (e3) others
g Overgrazing
1048707 (g1) excessive numbers of livestock
1048707 (g2) trampling along animal paths
1048707 (g3) others
i Industrial activities and mining
1048707 (i1) industry
1048707 (i2) mining
1048707 (i3) waste deposition
1048707 (i4) others
u Urbanisation and infrastructure development
1048707 (u1) settlements and roads
1048707 (u2) (urban) recreation
1048707 (u3) others
p Discharges leading to point contamination of surface and ground water resources
1048707 (p1) sanitary sewage disposal
1048707 (p2) waste water discharge
1048707 (p3) others
q Release of airborne pollutants from industrial activities and urbanisation
1048707 (q1) contamination of vegetation crops and soil
1048707 (q2) contamination of surface and ground water resources
1048707 (q3) others
w Disturbance of the water cycle
1048707 (w1) lower infiltration rates increased surface runoff
1048707 (w2) others
o Over-abstraction excessive withdrawal of water 1048707 (o1) irrigation
1048707 (o2) industrial use
1048707 (o3) domestic use
1048707 (o4) decreasing water use efficiency
1048707 (o5) others
n Natural causes
1048707 (n1) change in temperature
1048707 (n2) change of seasonal rainfall
1048707 (n3) heavyextreme rainfall (intensity and amounts)
1048707 (n4) windstorms dust storms
1048707 (n5) floods
1048707 (n6) droughts
1048707 (n7) other natural causes
p Population Pressure
t Land Tenure(使用期限)
h Poverty wealth
l Labour Availability
r Inputs and infrastructure
e Education access to knowledge and support services
w War and conflict
g Governance institutional
o Others (specify)
Item6 Indirect causes (pressures)
(multinomial selection)
Item7Impact on ecosystem services (Impact indicator)
P Productive Services (P1) production and risk
(P2) water for human animal and plant
consumption
(P3) land availability
S Socio-cultural services and human
well-being (S1) spiritual aesthetic cultural landscape and
heritage values recreation and tourism
(S2) education and knowledge (including
indigenous knowledge)
(S3) conflicts
(S4) food security health and poverty
(S5) net income
(S6) private and public infrastructure (buildings
roads dams etc)
(1)Type of impact
E Ecological services (E1) water cycle floods storms excessive rains
(E2) water cycle drought dry season flow availability of
water
(E3) organic matter status
(E4) soil cover (vegetation mulch etc)
(E5) soil structure surface (eg sealing and crusting) and
subsoil affecting infiltration water and nutrient holding
capacity salinity
(E6) nutrient cycle (N P K) and the carbon cycle
(E7) soil formation (including wind-deposited soils)
(E8) biodiversity
(E9) greenhouse gas emission
(E10) (micro)-climate (wind shade temperature humidity)
(multinomial selection)
The Impact of LD on ES should be Negative(-1-2-3)
(2)Level of impact
county LUS code Type (state)
Extent() Degree Rate Remarks
Horqin Youyi Zhongqi
152222002
E 2 1 0 protected since 2000
W 26 1 -1
152222008 E 56 2 0 communal grazing area
152222009
E 2 1 0
deep slope farmland
W 31 1 1
152222010
E 32 1 0
Sandy rainfed farmland
W 15 2 0
Item8 Remarks
The result of Step3
Step4 Land Conservation and Management (LSM technology)
bullName
bullConservation groups
bullConservation measures
bullPurpose
bullExtent of SLM Technology
bullDegradation addressed
bullEffectiveness of implemented SLM Technologies
bullEffectiveness trend of SLM Technologies
bullImpact on ecosystem services(ESS )and Level
bullPeriod of implementation
bullUsing The Best SLM Technologies (QT)
bullRemark
mdashmdash12 Items
The sustainable
management (SLM)
Technologies (QT) and
Approaches (QA) with a
detailed information on
conservation activities will
be provided in this step
Item1 Name of SLM
There are 94 cases of SLM technology in China
Provide a common name for the most widespread technologies applied within
each land use system unit
English Name Chinese Name definition Code
Closing rangeland to Facilitate
Vegetation Restoration
草原封禁植被恢复
The use of fences will be
degraded grassland fenced
off to prohibit grazing that
interference Natural
vegetation restoration
1
Returning farmland to forest 退耕还林 Planting trees in farmland
and building the forest 2
Bench Terraces Construction
for farmland 农田梯田建设
The sloping land erosion
has occurred by
mechanical or manual
terracing
3
Returning farmland to forest
Fixing mobile sand dunes by
Straw square barriers
1 CA Conservation agriculture mulching (mainly agronomic measures)
2 NM Manuring composting nutrient management (mainly agronomic
measures)
3 RO Rotational system shifting cultivation fallow slash and burn
4 VS Vegetative strips cover (mainly vegetative measures)
5 AF Agroforestry (mainly vegetative combined with agronomic)
6 AP Afforestation and forest protection
7 RH Gully control rehabilitation (structural combined with vegetative)
8 TR Terraces (structural but often combined with vegetative and
agronomic measures)
Item2 SLM groups(19groups)
(According the characters and functions of technology)
9 GR Grazing land management (management practices with associated vegetative
and agronomic measures)
bull WH Water harvesting (structural but also combined)
bull SA Groundwater salinity regulation water use efficiency
bull WQ Water quality improvements (structural management and vegetative)
bull SD Sand dune stabilization (vegetative structural and management)
bull CB Coastal bank protection (vegetative structural and management)
bull PR Protection against natural hazards (floods storms earth quake etc)
bull SC Storm water control road runoff (structural vegetative management)
bull WM Water Management
bull Co Conservation of natural biodiversity
bull OT Other (specify)
A Agronomic soil management
A1 Vegetation soil cover
A2 Organic matter soil fertility
A3 Soil surface treatment
A4 Subsurface treatment
A5 Others
V Vegetative
V1 Tree and shrub cover
V2 Grasses and perennial herbaceous plants
V3 Clearing of vegetation
V4 Others
Item3 Conservation measures
(According the measure of technology)
bull S Structural
bull S1 Bench terraces (lt6)
bull S2 Forward sloping terraces (gt6)
bull S3 Bunds banks
bull S4 Graded ditches waterways
bull S5 Level ditches pits
bull S6 Dams pans store excessive water
bull S7 Reshaping surface
bull S8 Walls barriers palisades
bull S9 Others
bull M Management
bull M1 Change of land use type
bull M2 Change of management intensity level
bull M3 Layout according to natural and human environment
bull M4 Major change in timing of activities
bull M5 Control change of species composition
bull M6 Others
bull CB Combinations
bull Any combinations of the above measures are possible
Item4 Purposes of the SLM Technologies
P Prevention implies the use of conservation measures that maintain natural
resources and their environmental and productive function on land that may be prone
to degradation The implication is that good land management practice is already in
place it is effectively the antithesis of human-induced land degradation
M Mitigation is intervention intended to reduce ongoing degradation This comes in at
a stage when degradation has already begun The main aim here is to halt further
degradation and to start improving resources and their functions Mitigation impacts
tend to be noticeable in the short to medium term this then provides a strong
incentive for further efforts The word lsquomitigationrsquo is also sometimes used to describe
reducing the impacts of degradation
R Rehabilitation is required when the land is already degraded to such an extent that
the original use is no longer possible and land has become practically unproductive
Here longer-term and more costly investments are needed to show any impact
Item5 Extent of SLM Technology The area percentage of mapping unit(each LUS unit) of the SLM
technology
Item6 Degradation addressed Specify the degradation type addressed by the SLM Technology
The degradation types are same with Step3
Item7 Effectiveness of implemented SLM Technologies
4 Very high
3 High
2 Moderate
1 Low
Item8 Effectiveness trend of SLM Technologies
1 increase in effectiveness
0 no change in effectiveness
-1 decrease in effectiveness
Item9 Impact on ecosystem services (Impact indicator)
P Productive Services
(P1) production and risk
(P2) water for human animal and plant
consumption
(P3) land availability
S Socio-cultural services and human
well-being
(S1) spiritual aesthetic cultural
landscape and heritage values
recreation and tourism
(S2) education and knowledge
(S3) conflicts
(S4) food security health and poverty
(S5) net income
(S6) private and public infrastructure
(1)Type of impact
E Ecological services
(E1) water cycle floods storms
excessive rains
(E2) water cycle drought dry season
flow availability of water
(E3) organic matter status
(E4) soil cover
(E5) soil structure surface and subsoil
affecting infiltration water and
nutrient holding capacity salinity
(E6) nutrient cycle (N P K) and the
carbon cycle
(E7) soil formation
(E8) biodiversity
(E9) greenhouse gas emission
(E10) (micro)-climate
(2)Level of impact
bull -3 high negative impact (more than 50)
bull -2 negative impact (10-50)
bull -1 low negative impact (0mdash10)
bull 1 low positive impact (0mdash10)
bull 2 positive impact (10mdash50)
bull 3 high positive impact (more than 50)
The Impact of LSM on ES should be Positive(123)
Item10 Period of implementation
Indicate since what year the technology has been implemented
Item11 Reference to QT (best technology practices)
Summary a series of best technologies and to identify whether this technology is one of them
Add the reference number of best SLM Technologies
Bench Terraces
Construction for farmland Grass Grid Sand Barrier High Vertical Live
Sand Barriers
51
The best technology practices(51 types in China)
The book of The
best practices for
LD Control in
China has been
published
helliphelliphelliphelliphelliphelliphelliphelliphelliphelliphelliphelliphelliphelliphelliphelliphelliphelliphelliphelliphelliphelliphelliphelliphelliphelliphellip
Item11 Remark
county LUS code LD Type (state)
Name of SLM Remarks
Horqin Youyi Zhongqi
152222002
E Returning the
Cultivated Land
to Forestland
National project since 2000
152222009 W Bench Terraces
Construction for
farmland
Great potential for large scale
The result of the Step4
The assessment unit shrub-pastoralism moderate or higher in Yangyuan County hebei Province
Step5 Expert recommendation
Item1 Recommendation
A Adaptation the degradation is either too serious to deal with
or it is not worthwhile the effort to invest in
P prevention the use of conservation measures where some
degradation has already occurred
M Mitigation intervention intended to reduce ongoing
degradation
R Rehabilitation It is the intervention when the land is already
degraded to such an extent need longer-term and more costly
investments
Item2 Remarks and additional information
Comments and Suggestions
mdashmdash2 Itemas
The result of the Step5
Ⅲ Conclusion
1 The practical methodology LADA method has integrated available data and collected information expertrsquos
knowledge and experiences to assess land degradation and sustainable management
in an economical mode
2 The adoptive DPSIR framework The State-drivers-pressures-impact-reaction Analyses System is available
3 Practical results and a lot of information
Through the LADA project a lot of information related to the land degradation and sustainable conservation were got
4 Gaps (1)Indicators and Their assessment standards should be more in detail and quantified
bull LU Intensity
bull LD Degree
bull LD Rate
bull Impact Level
(2)Experts from different fields with the different background knowledge and understanding there will be a little differences in evaluation results on the same land
assessment
Thank you
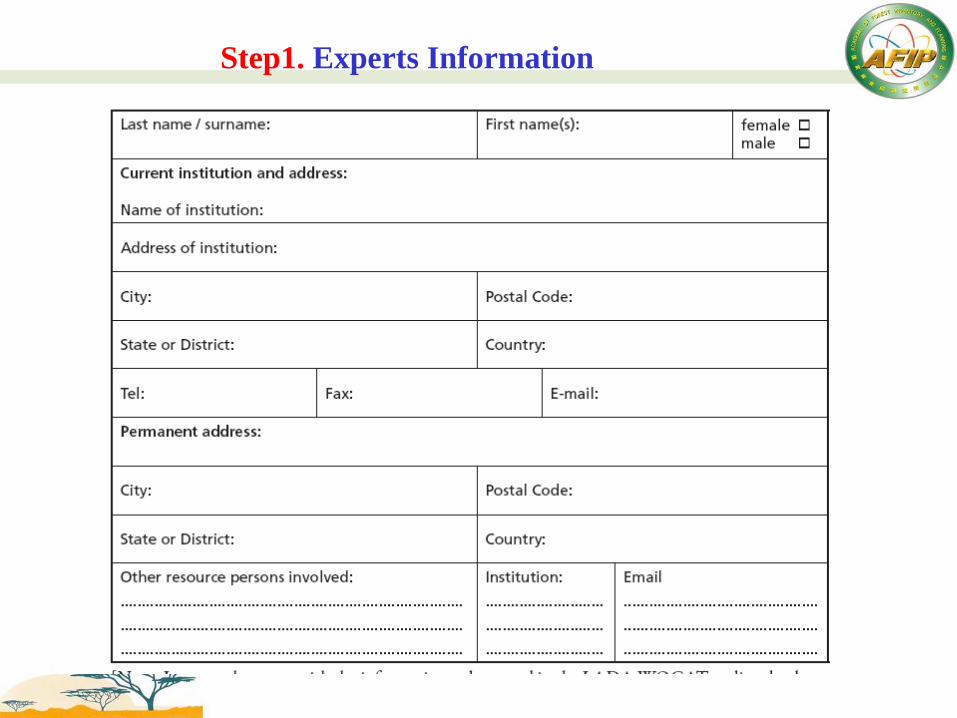
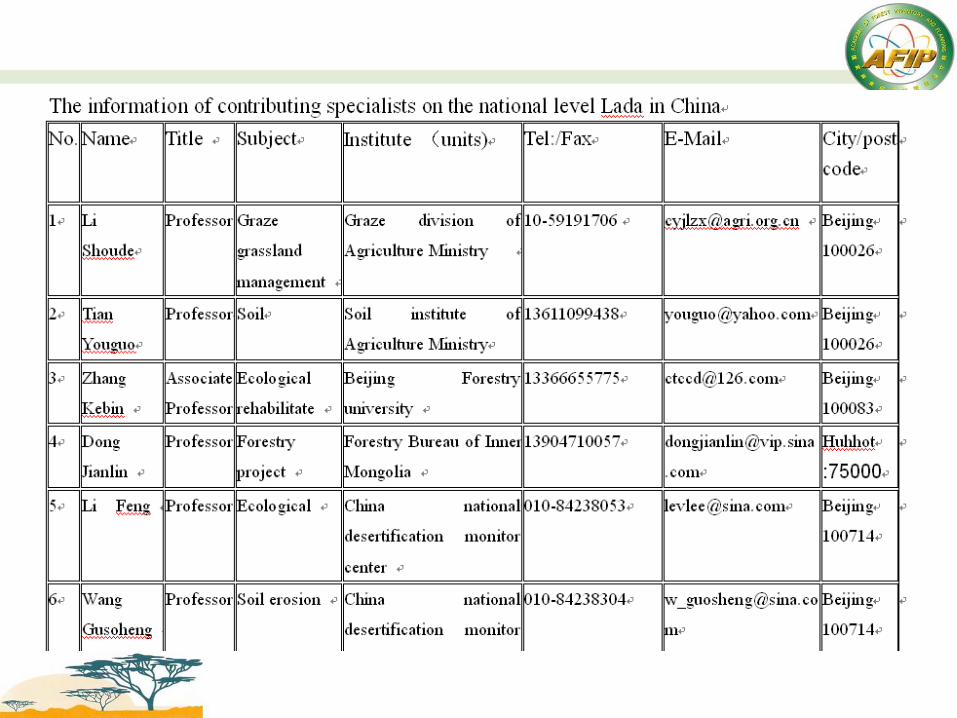
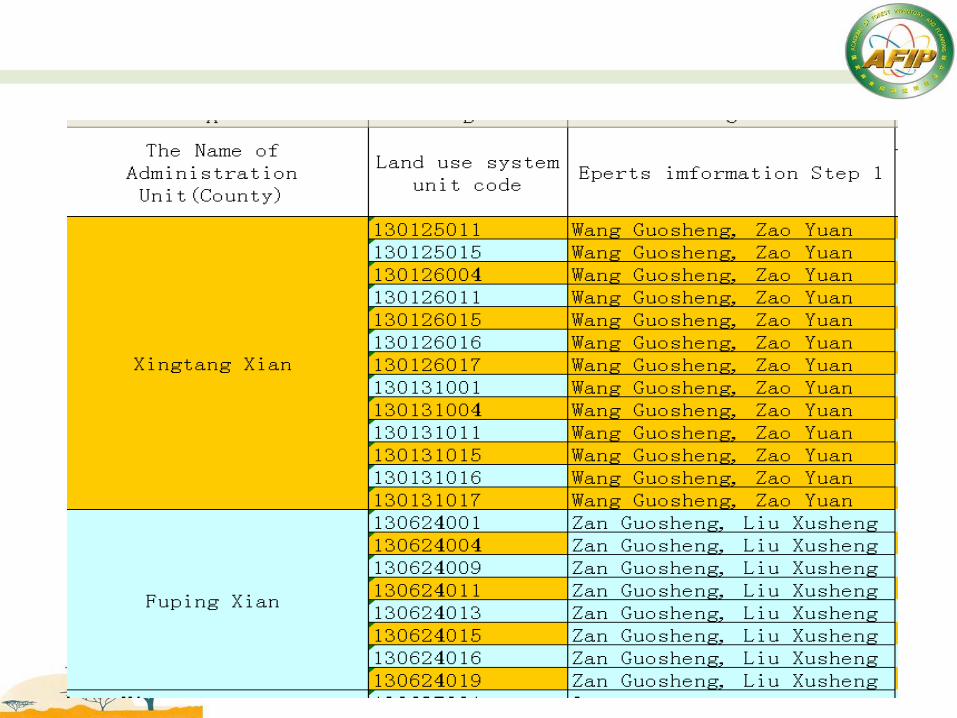
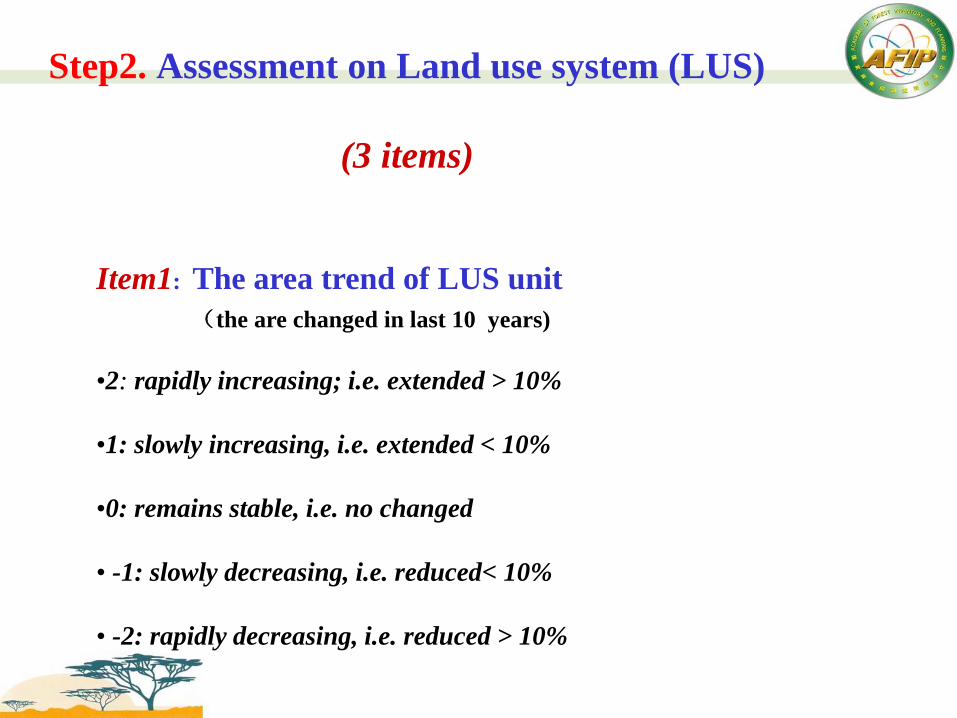
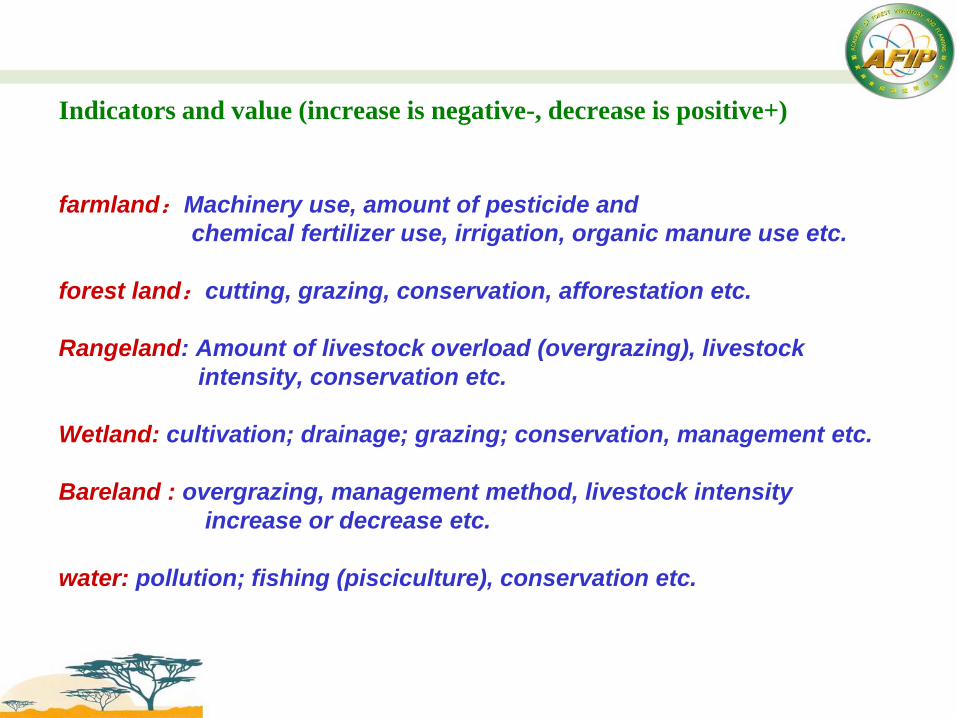
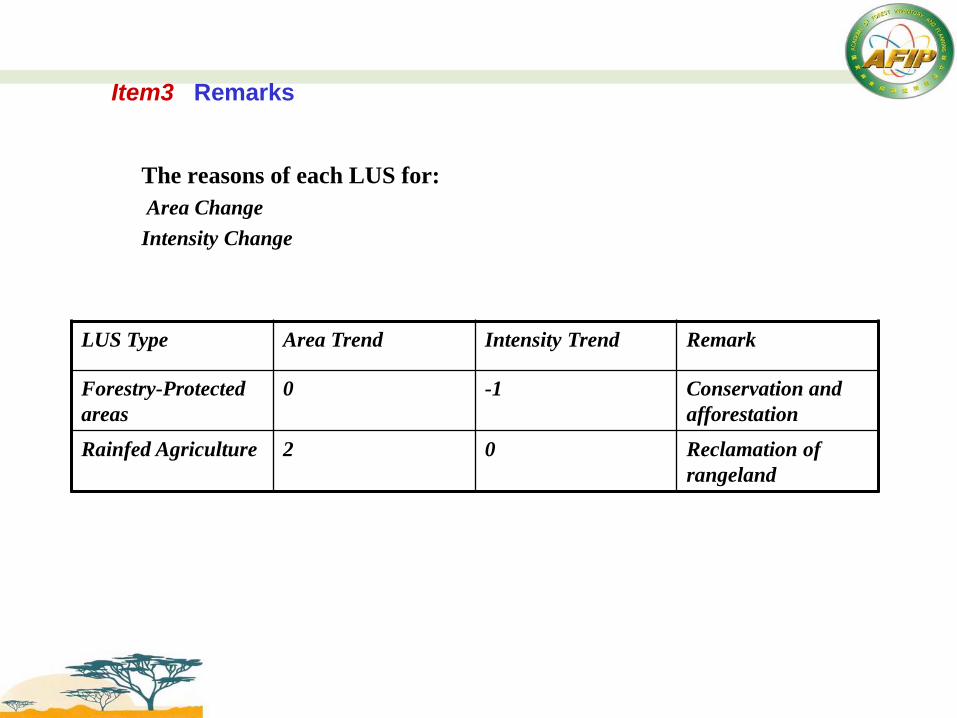
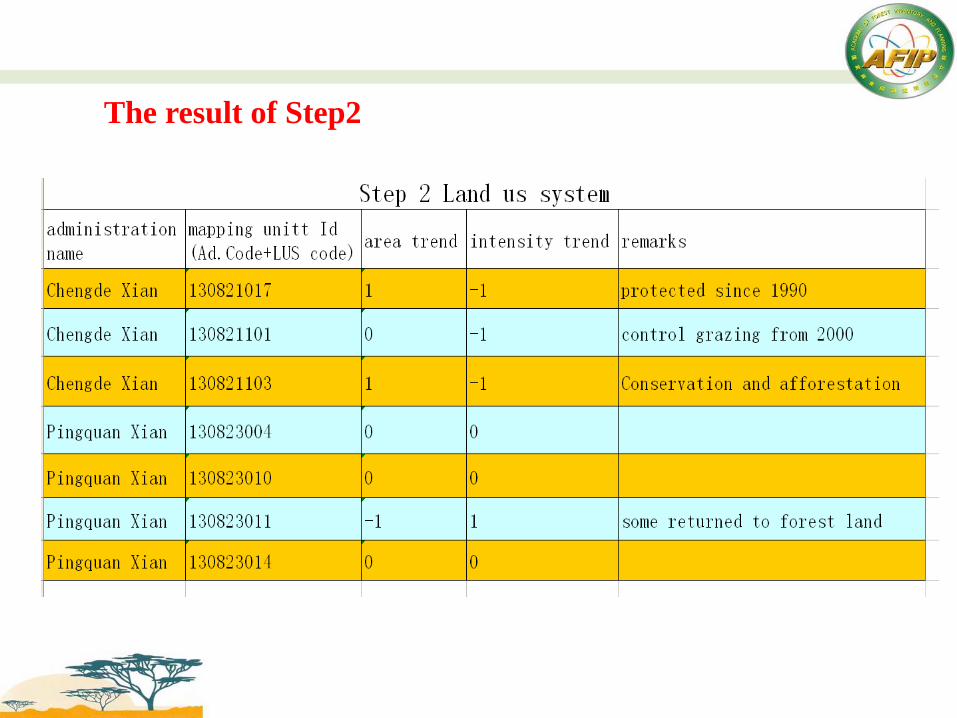
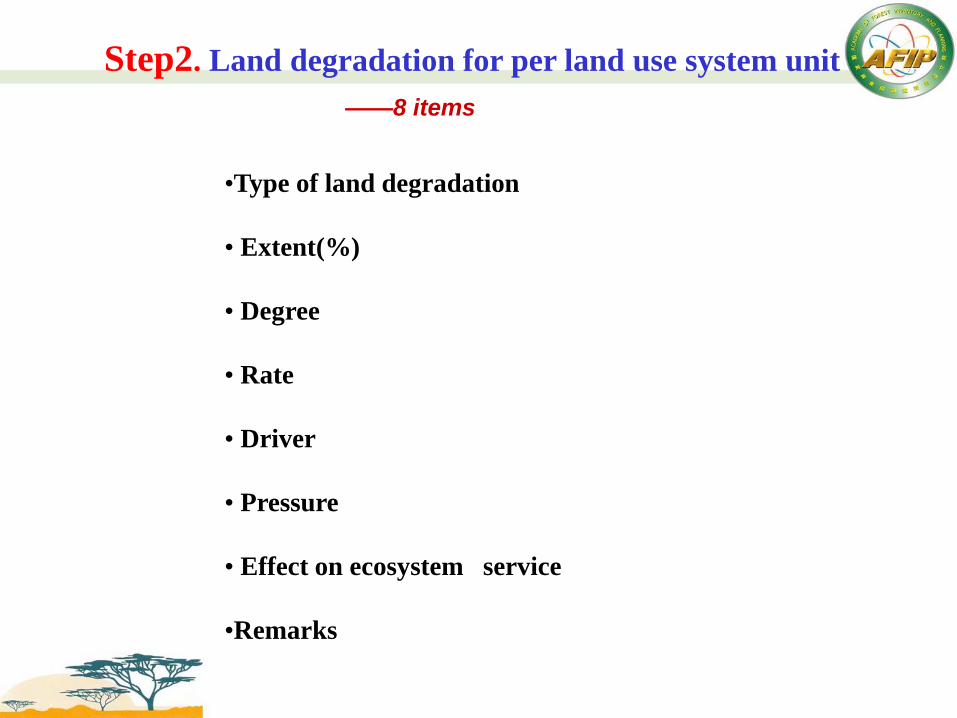
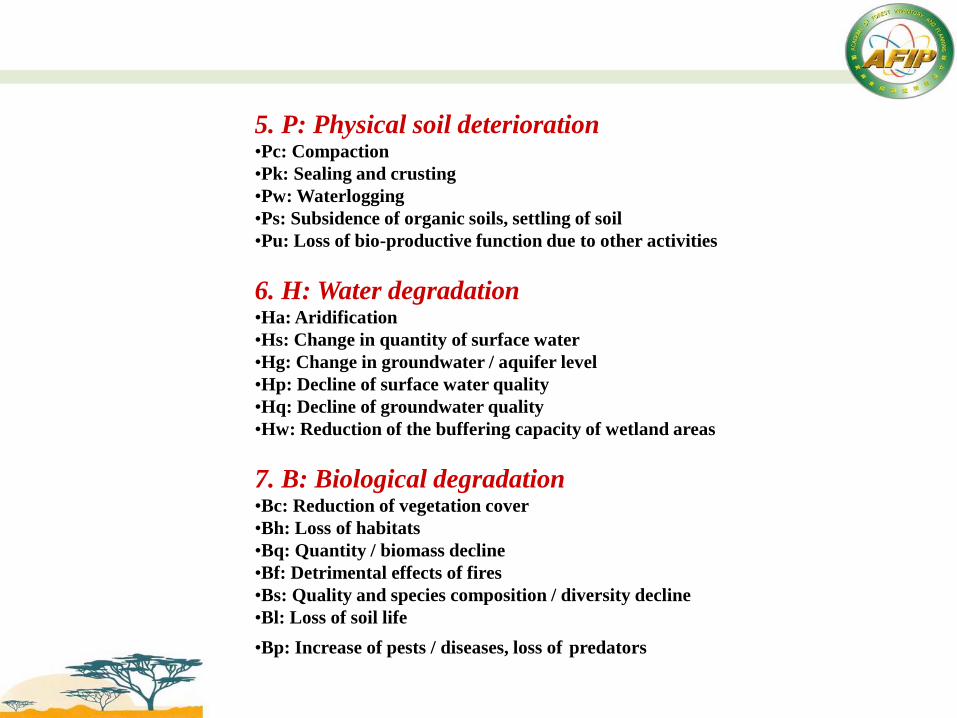
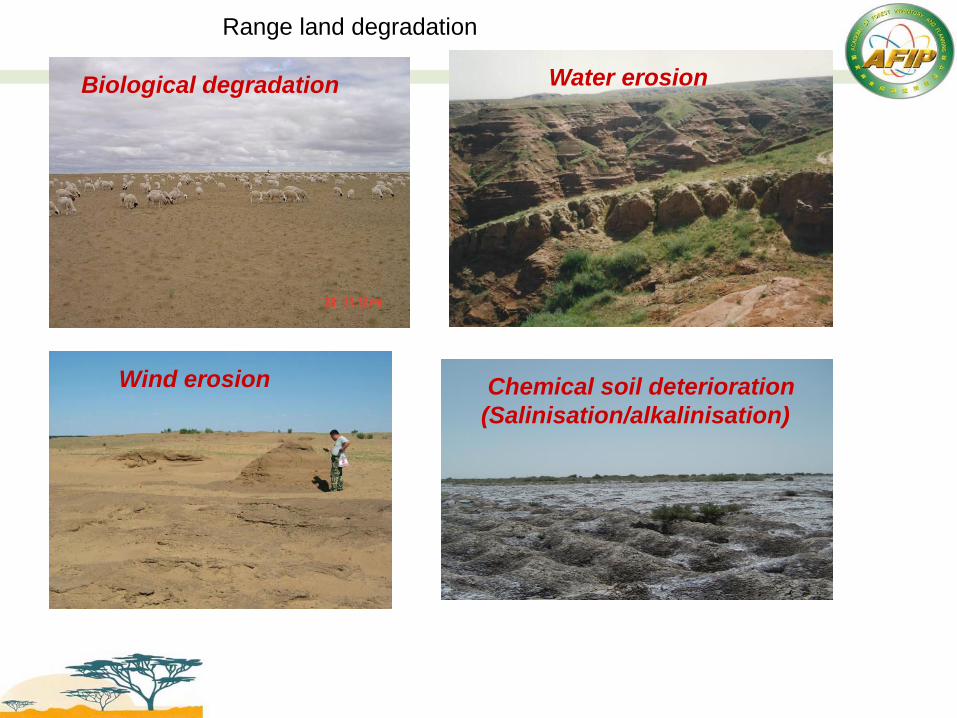

The Degree of a LUS Unit
bull Use the method of the
weighted average
sumAiDi
D=
sumAi
Ai is the area of the ith land plot
Di is the Degree of ith land plot (Di value is from 0 to 4)
degree Degree value
Light 1
Moderate 2
Strong 3
Extreme 4
Plot No 1-1 1-2 1-3 total
LD area (ha) 158 216 183 557
LD Degree 2 3 1
Extend of LD area 28 65 51 50
LUS The Forestry-no usenot management (water erosion)
Average degree Degree value
Light 10-17
Moderate 18-25
Strong 26-33
Extreme 34-40
sumAiDi
D= =(158times2+216times3+183times1) (158+216+183)=188
sumAi
Item4 Rate of degradation
3 rapidly increasing
2 moderately increasing
1 slowly increasing
0 no change in degradation
-1 slowly decreasing
-2 moderately decreasing
-3 rapidly decreasing
Indicators (The rate of the land degradation is due to the
changes of degree and area of each degraded LUS)
bullThe area of the degradation land
bullThe degree of the degradation land
The change rate of the area of the degradation land
in the last 10 years (X=)
The change rate of the higher degree area (Y=)
score score
Xgt10 3 Xgt20 3
5ltXle10 2 10ltXle20 2
1ltX le5 1 1ltX le10 1
-1 leXle1 0 -1 leXle1 0
-1ltX le-5 -1 -1ltX le-10 -1
-5ltXle-10 -2 -10ltXle-20 -2
Xlt-10 -3 Xlt-20 -3
The assessment method of degradation Rate
Rate Value (x+y)
3 rapidly increasing 5-6
2 moderately increasing 3-4
1 slowly increasing 1-2
0 no change in degradation 0
-1 slowly decreasing 1-(-2)
-2 moderately decreasing -3-(-4)
-3 rapidly decreasing -5-(-6)
Item5 Direct causes (12 drivers)
s Soil management improper management of the soil
1048707 (s1) cultivation of unsuitable soils
1048707 (s2) missing or insufficient soil conservation measures
1048707 (s3) heavy machinery
1048707 (s4) tillage practice (ploughing harrowing etc)
1048707 (s5) others
c Crop management improper management of grass shrub and tree crops
1048707 (c1) reduction of plant cover and residues
1048707 (c2) inappropriate application of manure fertilizer herbicides pesticides and other agrochemicals
1048707 (c3) nutrient mining excessive removal without appropriate replacement of nutrients
1048707 (c4) shortening of the fallow period in shifting cultivation
1048707 (c5) inappropriate irrigation
1048707 (c6) inappropriate use of water in rainfed agriculture 1048707
(c7) others
f Deforestation and removal of natural vegetation extensive removal of natural vegetation
1048707 (f1) large-scale commercial forestry
1048707 (f2) expansion of urban settlement areas and industry
1048707 (f3) conversion to agriculture
1048707 (f4) forest grassland fires
1048707 (f5) road construction
1048707 (f6) others
e Over-exploitation of vegetation for domestic use
1048707 (e1) excessive gathering of fuel wood (local) timber fencing materials
1048707 (e2) removal of fodder
1048707 (e3) others
g Overgrazing
1048707 (g1) excessive numbers of livestock
1048707 (g2) trampling along animal paths
1048707 (g3) others
i Industrial activities and mining
1048707 (i1) industry
1048707 (i2) mining
1048707 (i3) waste deposition
1048707 (i4) others
u Urbanisation and infrastructure development
1048707 (u1) settlements and roads
1048707 (u2) (urban) recreation
1048707 (u3) others
p Discharges leading to point contamination of surface and ground water resources
1048707 (p1) sanitary sewage disposal
1048707 (p2) waste water discharge
1048707 (p3) others
q Release of airborne pollutants from industrial activities and urbanisation
1048707 (q1) contamination of vegetation crops and soil
1048707 (q2) contamination of surface and ground water resources
1048707 (q3) others
w Disturbance of the water cycle
1048707 (w1) lower infiltration rates increased surface runoff
1048707 (w2) others
o Over-abstraction excessive withdrawal of water 1048707 (o1) irrigation
1048707 (o2) industrial use
1048707 (o3) domestic use
1048707 (o4) decreasing water use efficiency
1048707 (o5) others
n Natural causes
1048707 (n1) change in temperature
1048707 (n2) change of seasonal rainfall
1048707 (n3) heavyextreme rainfall (intensity and amounts)
1048707 (n4) windstorms dust storms
1048707 (n5) floods
1048707 (n6) droughts
1048707 (n7) other natural causes
p Population Pressure
t Land Tenure(使用期限)
h Poverty wealth
l Labour Availability
r Inputs and infrastructure
e Education access to knowledge and support services
w War and conflict
g Governance institutional
o Others (specify)
Item6 Indirect causes (pressures)
(multinomial selection)
Item7Impact on ecosystem services (Impact indicator)
P Productive Services (P1) production and risk
(P2) water for human animal and plant
consumption
(P3) land availability
S Socio-cultural services and human
well-being (S1) spiritual aesthetic cultural landscape and
heritage values recreation and tourism
(S2) education and knowledge (including
indigenous knowledge)
(S3) conflicts
(S4) food security health and poverty
(S5) net income
(S6) private and public infrastructure (buildings
roads dams etc)
(1)Type of impact
E Ecological services (E1) water cycle floods storms excessive rains
(E2) water cycle drought dry season flow availability of
water
(E3) organic matter status
(E4) soil cover (vegetation mulch etc)
(E5) soil structure surface (eg sealing and crusting) and
subsoil affecting infiltration water and nutrient holding
capacity salinity
(E6) nutrient cycle (N P K) and the carbon cycle
(E7) soil formation (including wind-deposited soils)
(E8) biodiversity
(E9) greenhouse gas emission
(E10) (micro)-climate (wind shade temperature humidity)
(multinomial selection)
The Impact of LD on ES should be Negative(-1-2-3)
(2)Level of impact
county LUS code Type (state)
Extent() Degree Rate Remarks
Horqin Youyi Zhongqi
152222002
E 2 1 0 protected since 2000
W 26 1 -1
152222008 E 56 2 0 communal grazing area
152222009
E 2 1 0
deep slope farmland
W 31 1 1
152222010
E 32 1 0
Sandy rainfed farmland
W 15 2 0
Item8 Remarks
The result of Step3
Step4 Land Conservation and Management (LSM technology)
bullName
bullConservation groups
bullConservation measures
bullPurpose
bullExtent of SLM Technology
bullDegradation addressed
bullEffectiveness of implemented SLM Technologies
bullEffectiveness trend of SLM Technologies
bullImpact on ecosystem services(ESS )and Level
bullPeriod of implementation
bullUsing The Best SLM Technologies (QT)
bullRemark
mdashmdash12 Items
The sustainable
management (SLM)
Technologies (QT) and
Approaches (QA) with a
detailed information on
conservation activities will
be provided in this step
Item1 Name of SLM
There are 94 cases of SLM technology in China
Provide a common name for the most widespread technologies applied within
each land use system unit
English Name Chinese Name definition Code
Closing rangeland to Facilitate
Vegetation Restoration
草原封禁植被恢复
The use of fences will be
degraded grassland fenced
off to prohibit grazing that
interference Natural
vegetation restoration
1
Returning farmland to forest 退耕还林 Planting trees in farmland
and building the forest 2
Bench Terraces Construction
for farmland 农田梯田建设
The sloping land erosion
has occurred by
mechanical or manual
terracing
3
Returning farmland to forest
Fixing mobile sand dunes by
Straw square barriers
1 CA Conservation agriculture mulching (mainly agronomic measures)
2 NM Manuring composting nutrient management (mainly agronomic
measures)
3 RO Rotational system shifting cultivation fallow slash and burn
4 VS Vegetative strips cover (mainly vegetative measures)
5 AF Agroforestry (mainly vegetative combined with agronomic)
6 AP Afforestation and forest protection
7 RH Gully control rehabilitation (structural combined with vegetative)
8 TR Terraces (structural but often combined with vegetative and
agronomic measures)
Item2 SLM groups(19groups)
(According the characters and functions of technology)
9 GR Grazing land management (management practices with associated vegetative
and agronomic measures)
bull WH Water harvesting (structural but also combined)
bull SA Groundwater salinity regulation water use efficiency
bull WQ Water quality improvements (structural management and vegetative)
bull SD Sand dune stabilization (vegetative structural and management)
bull CB Coastal bank protection (vegetative structural and management)
bull PR Protection against natural hazards (floods storms earth quake etc)
bull SC Storm water control road runoff (structural vegetative management)
bull WM Water Management
bull Co Conservation of natural biodiversity
bull OT Other (specify)
A Agronomic soil management
A1 Vegetation soil cover
A2 Organic matter soil fertility
A3 Soil surface treatment
A4 Subsurface treatment
A5 Others
V Vegetative
V1 Tree and shrub cover
V2 Grasses and perennial herbaceous plants
V3 Clearing of vegetation
V4 Others
Item3 Conservation measures
(According the measure of technology)
bull S Structural
bull S1 Bench terraces (lt6)
bull S2 Forward sloping terraces (gt6)
bull S3 Bunds banks
bull S4 Graded ditches waterways
bull S5 Level ditches pits
bull S6 Dams pans store excessive water
bull S7 Reshaping surface
bull S8 Walls barriers palisades
bull S9 Others
bull M Management
bull M1 Change of land use type
bull M2 Change of management intensity level
bull M3 Layout according to natural and human environment
bull M4 Major change in timing of activities
bull M5 Control change of species composition
bull M6 Others
bull CB Combinations
bull Any combinations of the above measures are possible
Item4 Purposes of the SLM Technologies
P Prevention implies the use of conservation measures that maintain natural
resources and their environmental and productive function on land that may be prone
to degradation The implication is that good land management practice is already in
place it is effectively the antithesis of human-induced land degradation
M Mitigation is intervention intended to reduce ongoing degradation This comes in at
a stage when degradation has already begun The main aim here is to halt further
degradation and to start improving resources and their functions Mitigation impacts
tend to be noticeable in the short to medium term this then provides a strong
incentive for further efforts The word lsquomitigationrsquo is also sometimes used to describe
reducing the impacts of degradation
R Rehabilitation is required when the land is already degraded to such an extent that
the original use is no longer possible and land has become practically unproductive
Here longer-term and more costly investments are needed to show any impact
Item5 Extent of SLM Technology The area percentage of mapping unit(each LUS unit) of the SLM
technology
Item6 Degradation addressed Specify the degradation type addressed by the SLM Technology
The degradation types are same with Step3
Item7 Effectiveness of implemented SLM Technologies
4 Very high
3 High
2 Moderate
1 Low
Item8 Effectiveness trend of SLM Technologies
1 increase in effectiveness
0 no change in effectiveness
-1 decrease in effectiveness
Item9 Impact on ecosystem services (Impact indicator)
P Productive Services
(P1) production and risk
(P2) water for human animal and plant
consumption
(P3) land availability
S Socio-cultural services and human
well-being
(S1) spiritual aesthetic cultural
landscape and heritage values
recreation and tourism
(S2) education and knowledge
(S3) conflicts
(S4) food security health and poverty
(S5) net income
(S6) private and public infrastructure
(1)Type of impact
E Ecological services
(E1) water cycle floods storms
excessive rains
(E2) water cycle drought dry season
flow availability of water
(E3) organic matter status
(E4) soil cover
(E5) soil structure surface and subsoil
affecting infiltration water and
nutrient holding capacity salinity
(E6) nutrient cycle (N P K) and the
carbon cycle
(E7) soil formation
(E8) biodiversity
(E9) greenhouse gas emission
(E10) (micro)-climate
(2)Level of impact
bull -3 high negative impact (more than 50)
bull -2 negative impact (10-50)
bull -1 low negative impact (0mdash10)
bull 1 low positive impact (0mdash10)
bull 2 positive impact (10mdash50)
bull 3 high positive impact (more than 50)
The Impact of LSM on ES should be Positive(123)
Item10 Period of implementation
Indicate since what year the technology has been implemented
Item11 Reference to QT (best technology practices)
Summary a series of best technologies and to identify whether this technology is one of them
Add the reference number of best SLM Technologies
Bench Terraces
Construction for farmland Grass Grid Sand Barrier High Vertical Live
Sand Barriers
51
The best technology practices(51 types in China)
The book of The
best practices for
LD Control in
China has been
published
helliphelliphelliphelliphelliphelliphelliphelliphelliphelliphelliphelliphelliphelliphelliphelliphelliphelliphelliphelliphelliphelliphelliphelliphelliphelliphellip
Item11 Remark
county LUS code LD Type (state)
Name of SLM Remarks
Horqin Youyi Zhongqi
152222002
E Returning the
Cultivated Land
to Forestland
National project since 2000
152222009 W Bench Terraces
Construction for
farmland
Great potential for large scale
The result of the Step4
The assessment unit shrub-pastoralism moderate or higher in Yangyuan County hebei Province
Step5 Expert recommendation
Item1 Recommendation
A Adaptation the degradation is either too serious to deal with
or it is not worthwhile the effort to invest in
P prevention the use of conservation measures where some
degradation has already occurred
M Mitigation intervention intended to reduce ongoing
degradation
R Rehabilitation It is the intervention when the land is already
degraded to such an extent need longer-term and more costly
investments
Item2 Remarks and additional information
Comments and Suggestions
mdashmdash2 Itemas
The result of the Step5
Ⅲ Conclusion
1 The practical methodology LADA method has integrated available data and collected information expertrsquos
knowledge and experiences to assess land degradation and sustainable management
in an economical mode
2 The adoptive DPSIR framework The State-drivers-pressures-impact-reaction Analyses System is available
3 Practical results and a lot of information
Through the LADA project a lot of information related to the land degradation and sustainable conservation were got
4 Gaps (1)Indicators and Their assessment standards should be more in detail and quantified
bull LU Intensity
bull LD Degree
bull LD Rate
bull Impact Level
(2)Experts from different fields with the different background knowledge and understanding there will be a little differences in evaluation results on the same land
assessment
Thank you
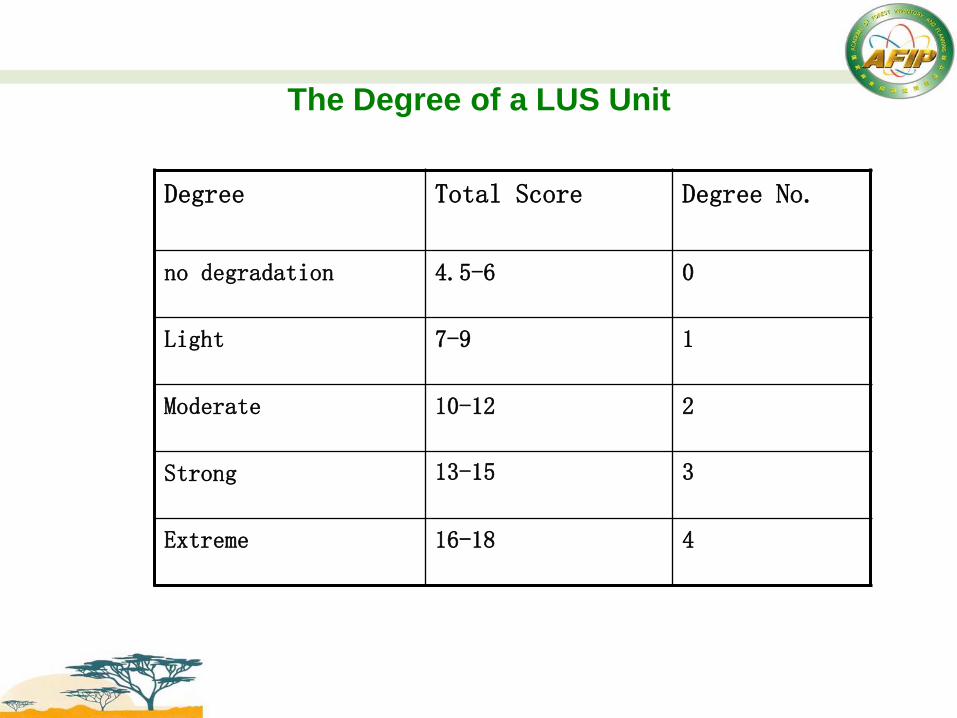
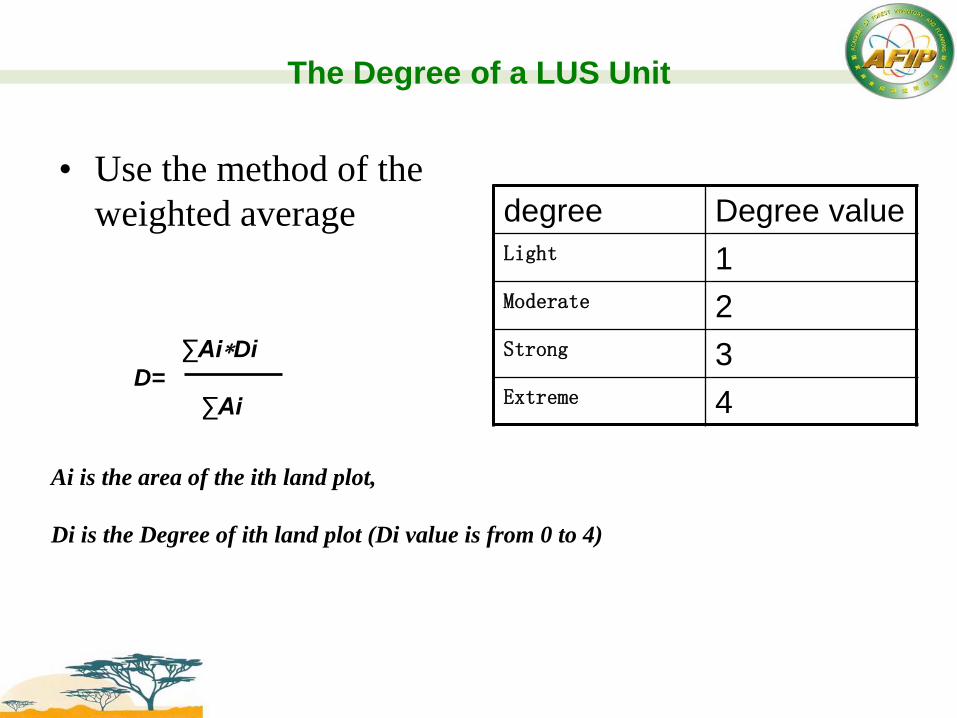
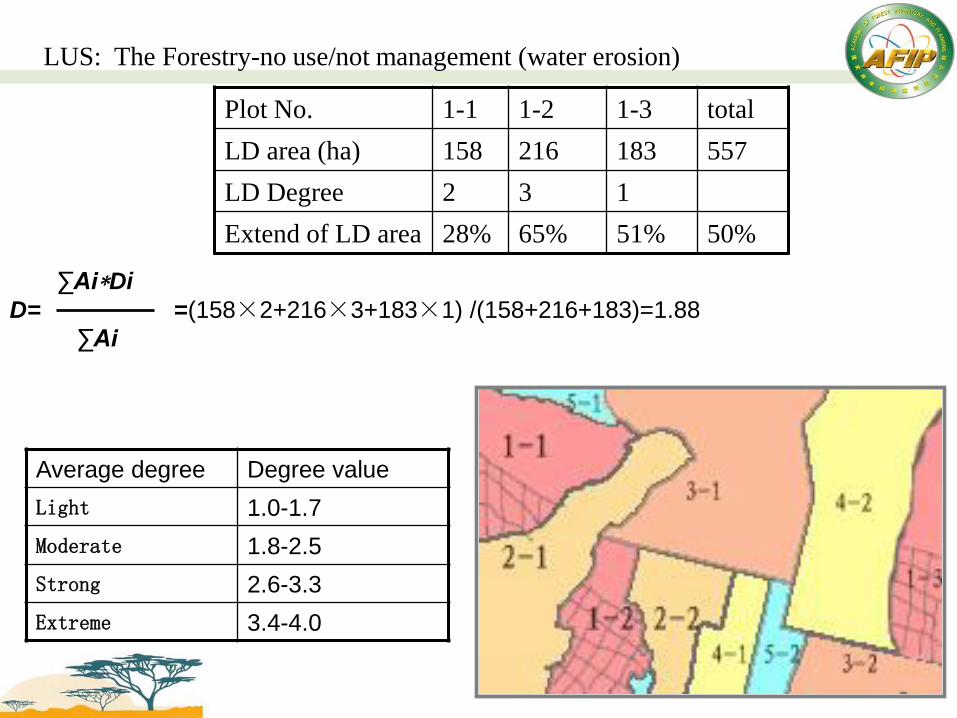
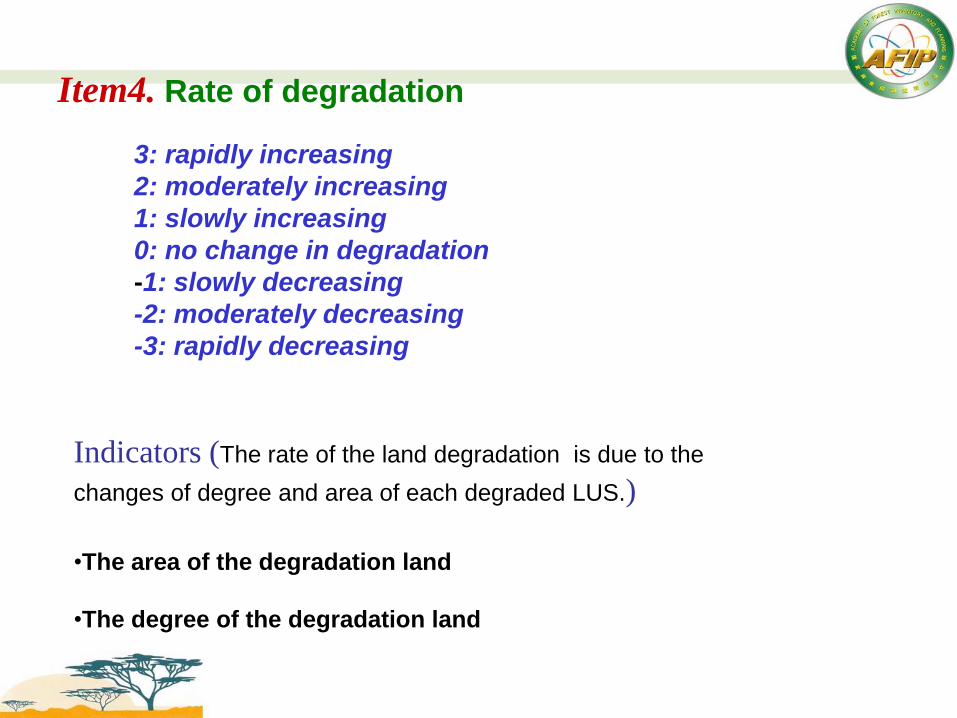
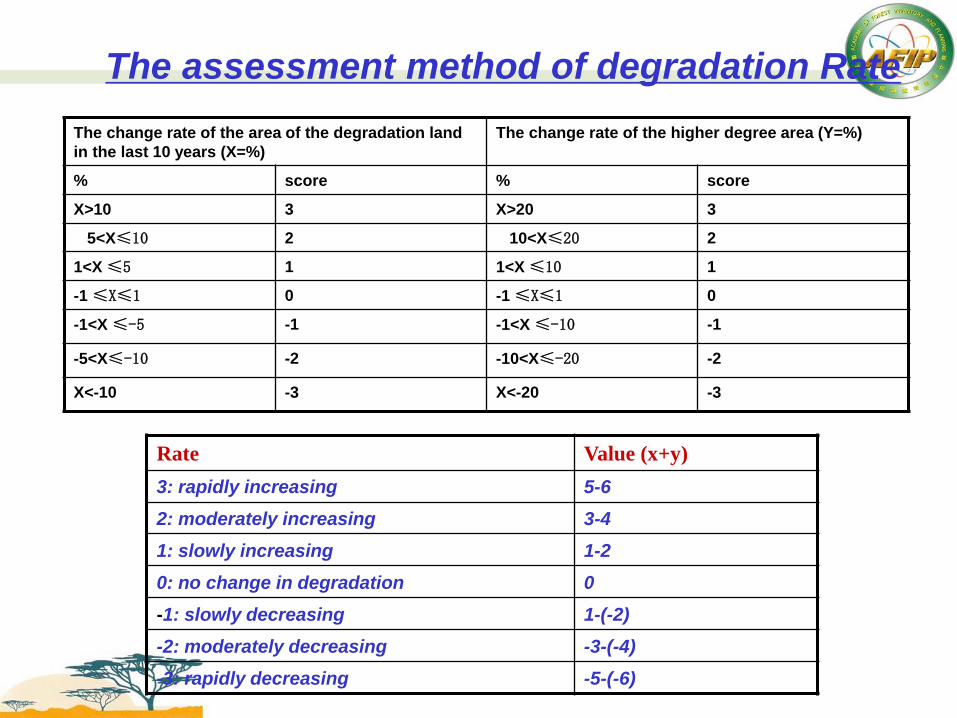
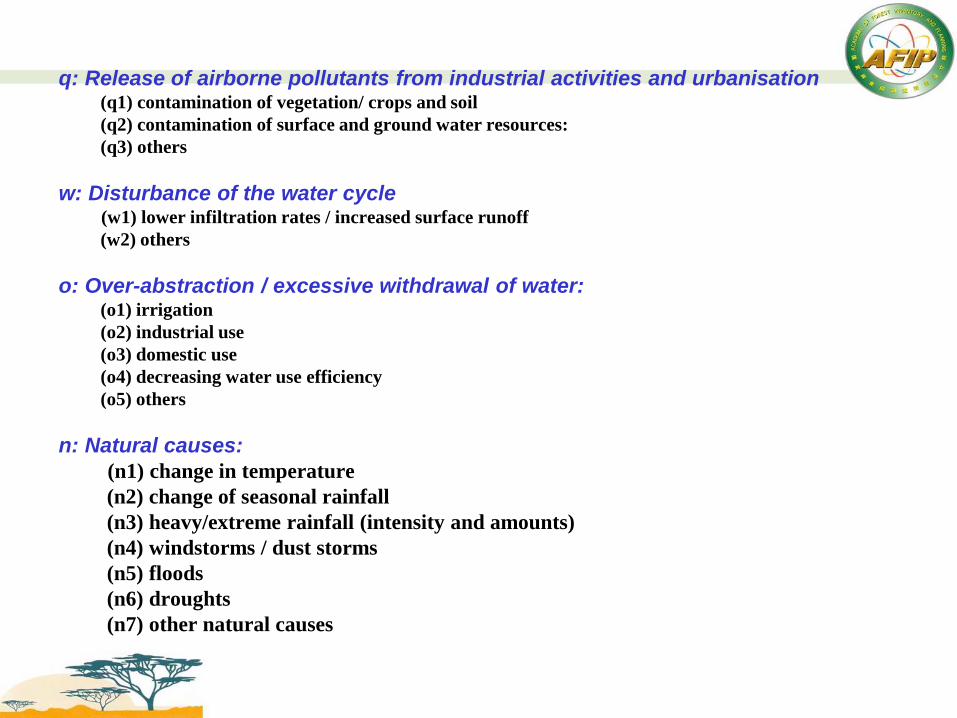
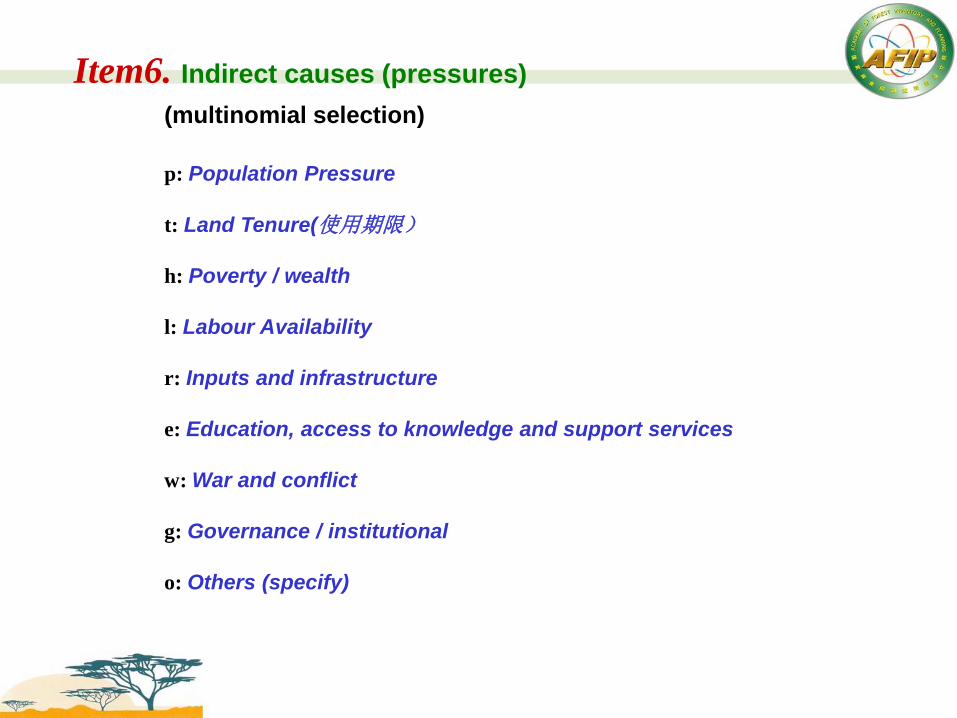
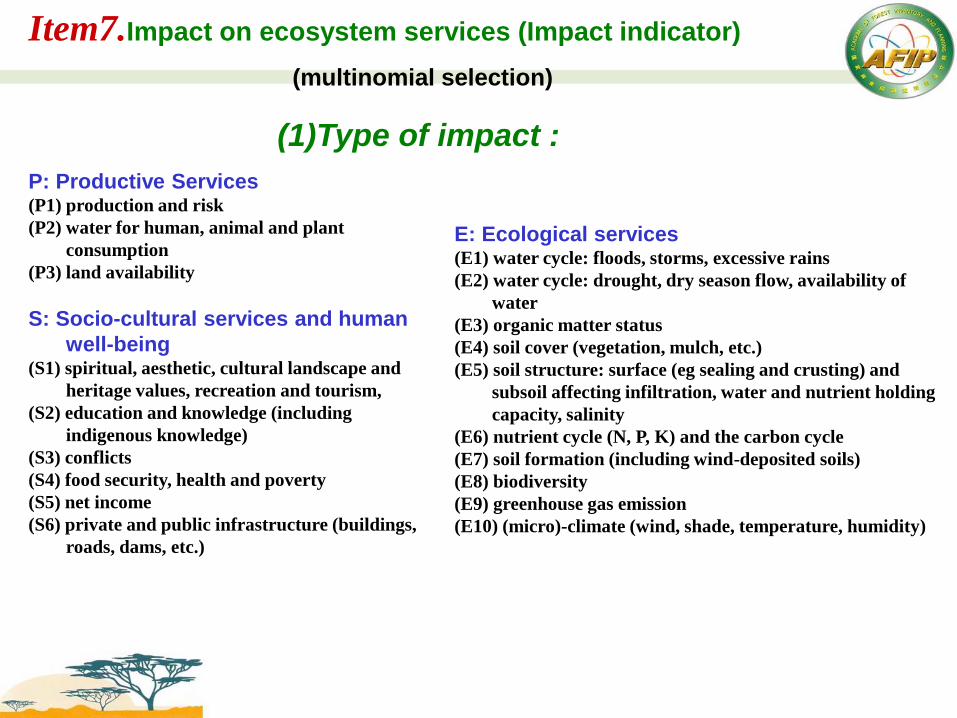
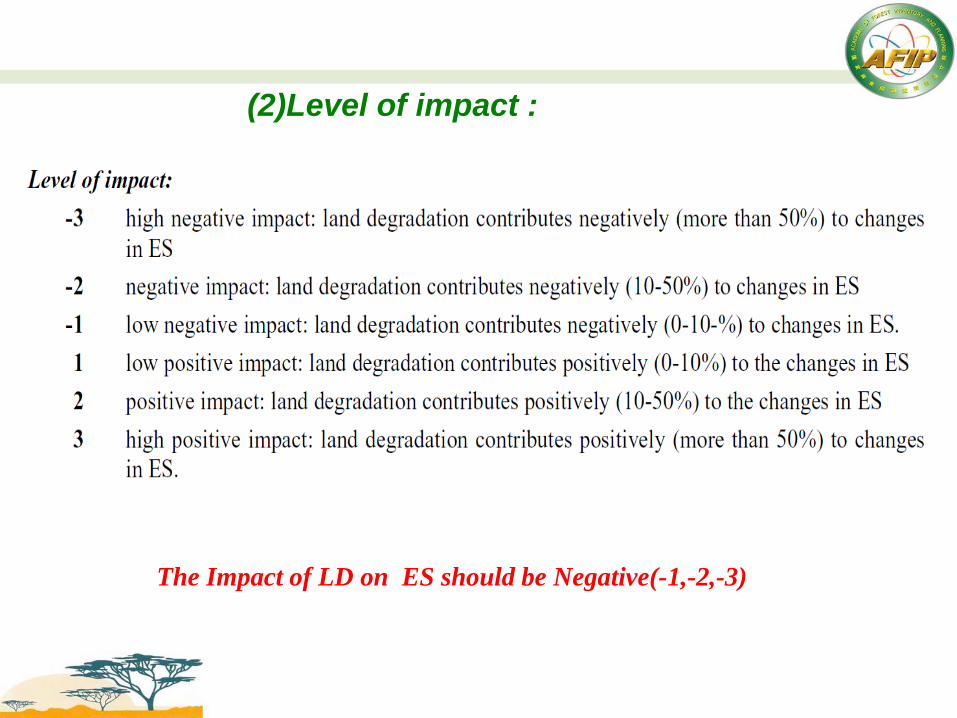
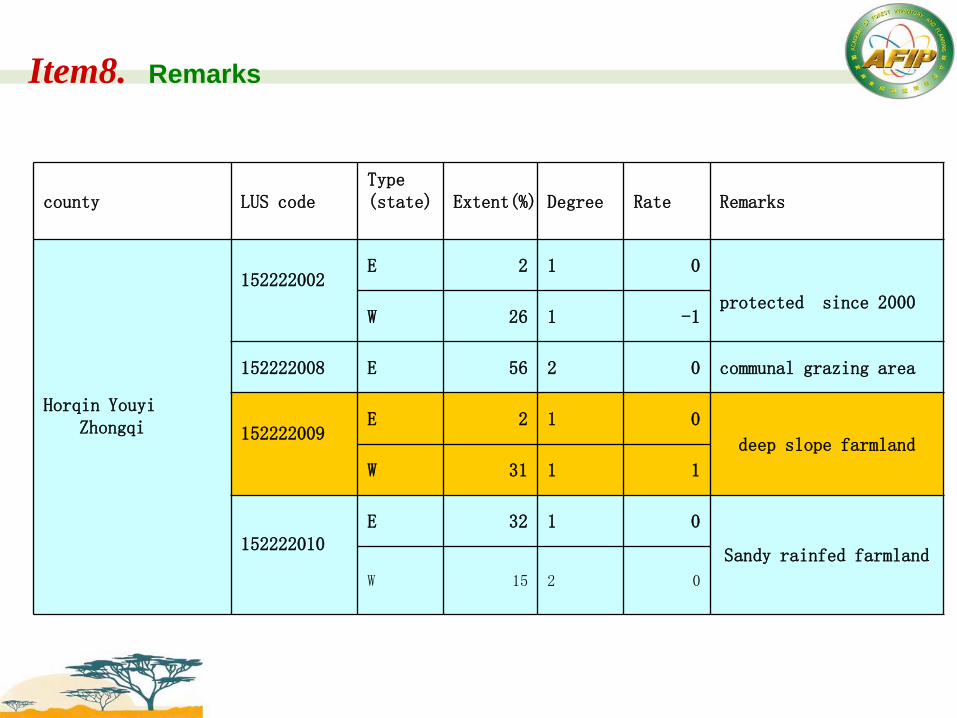
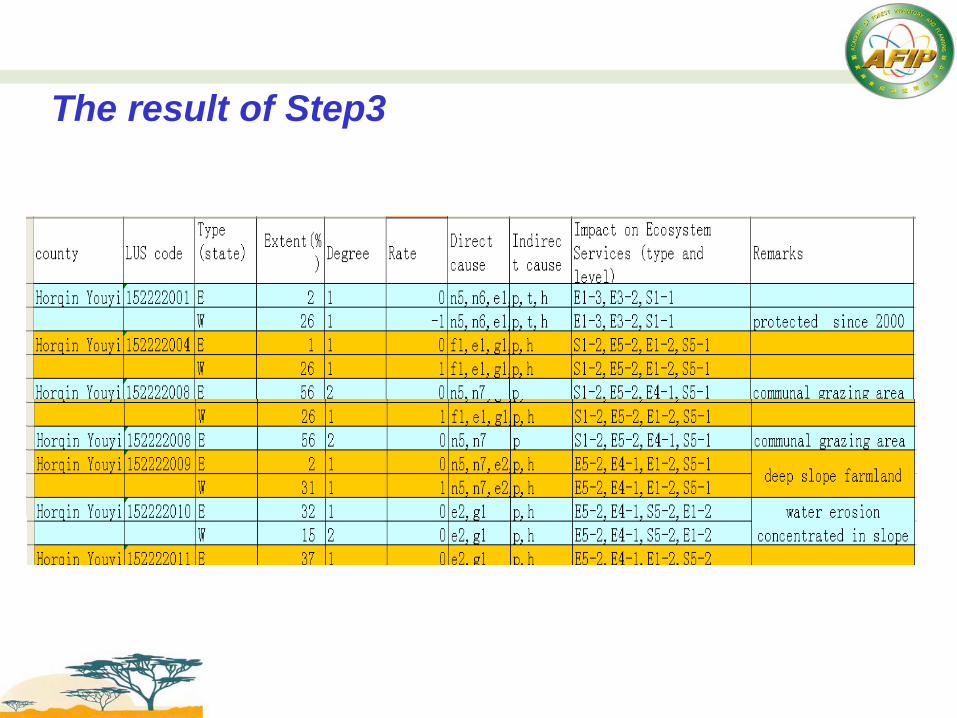
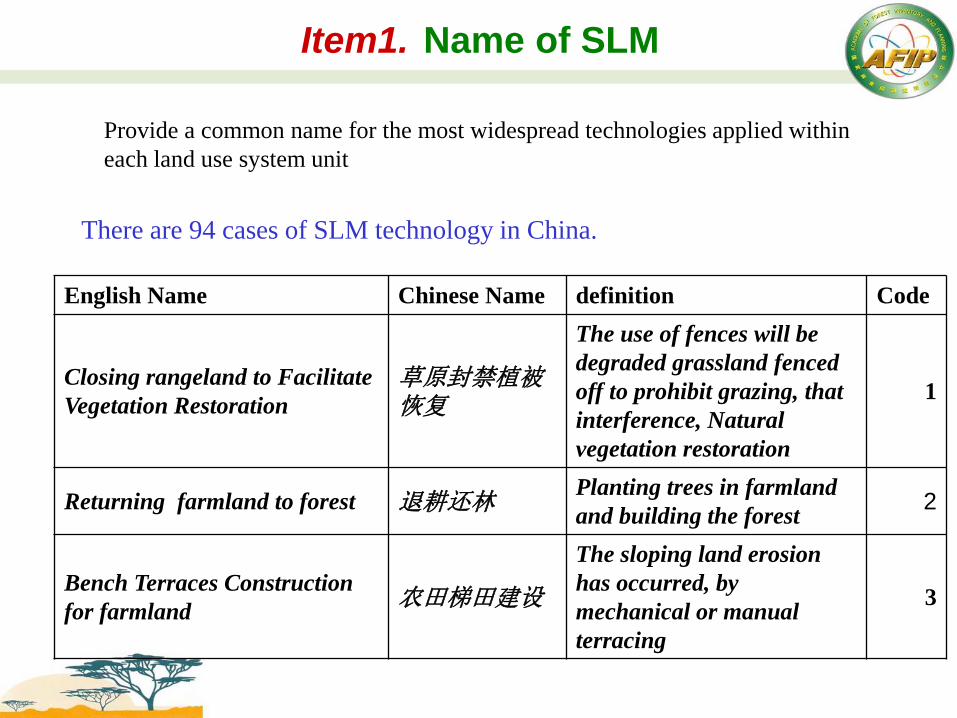
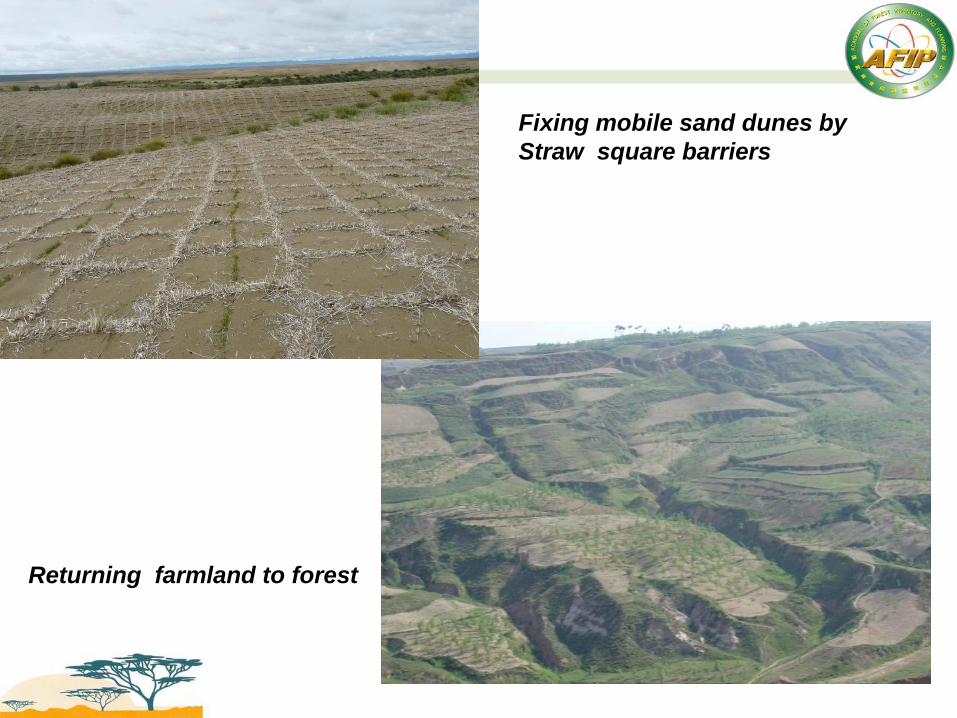
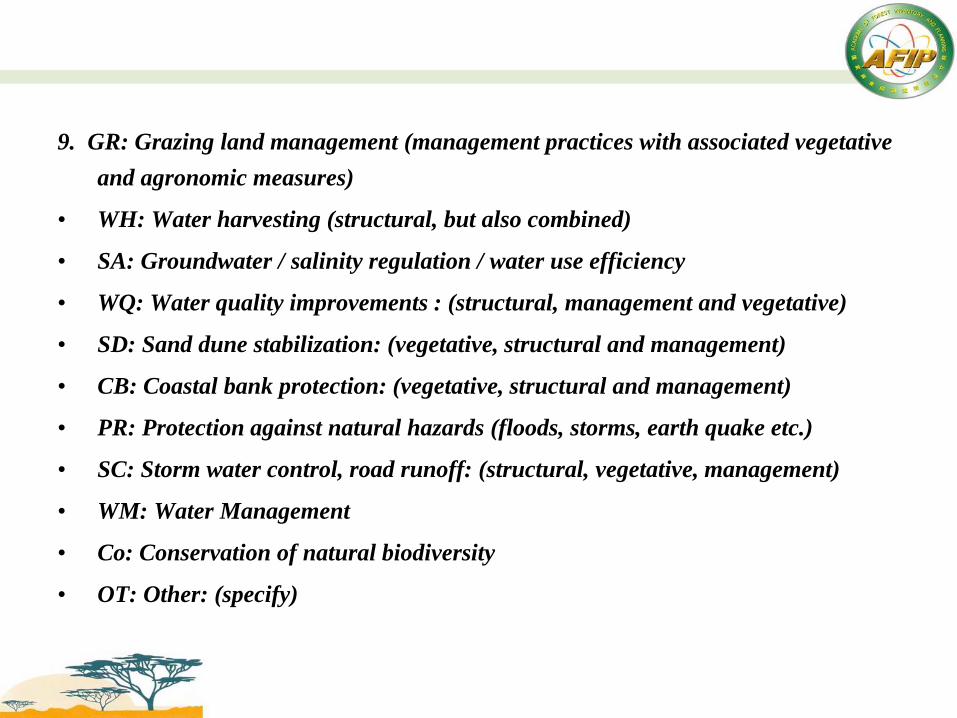
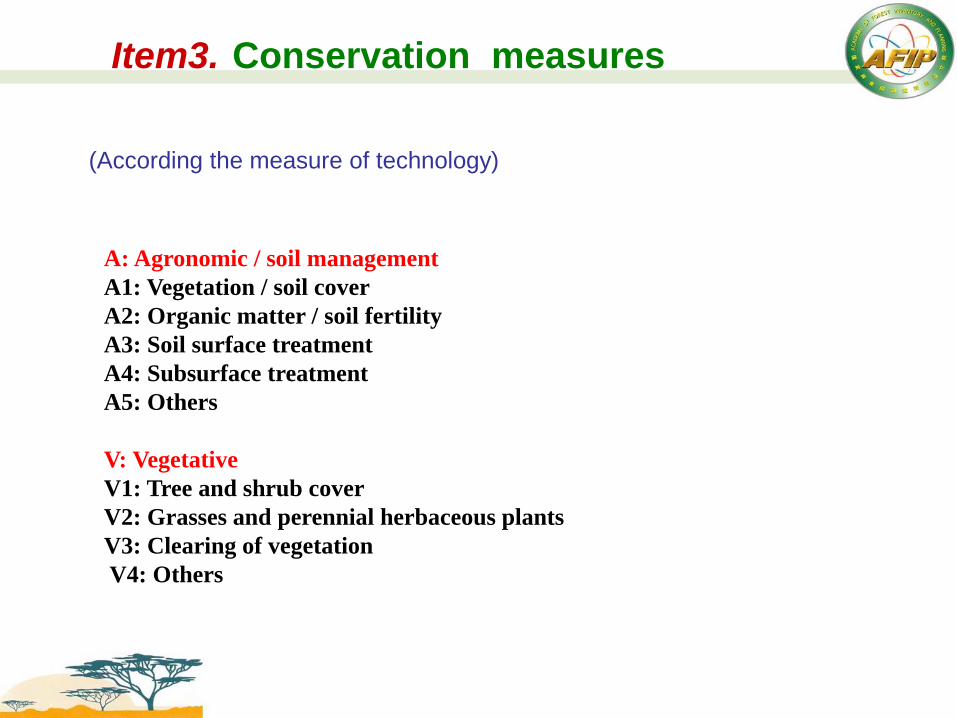
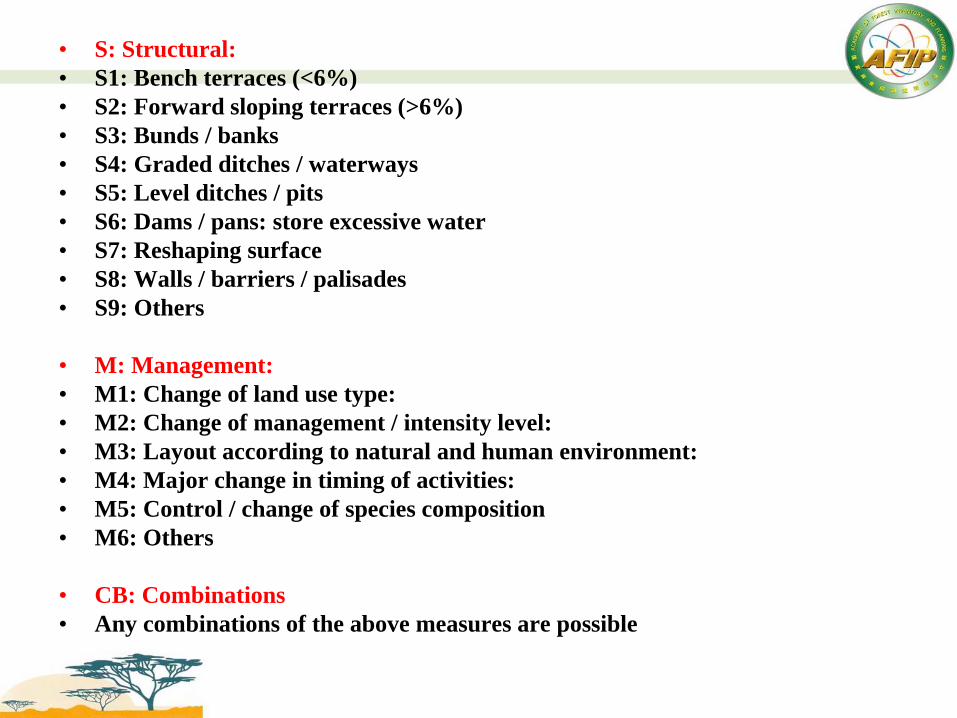
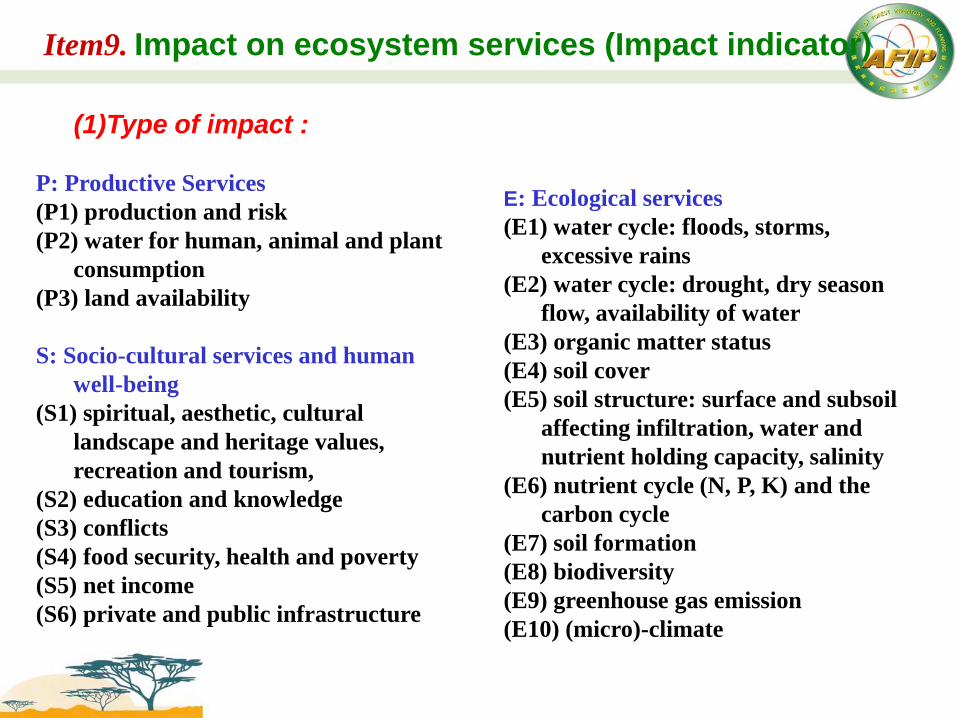
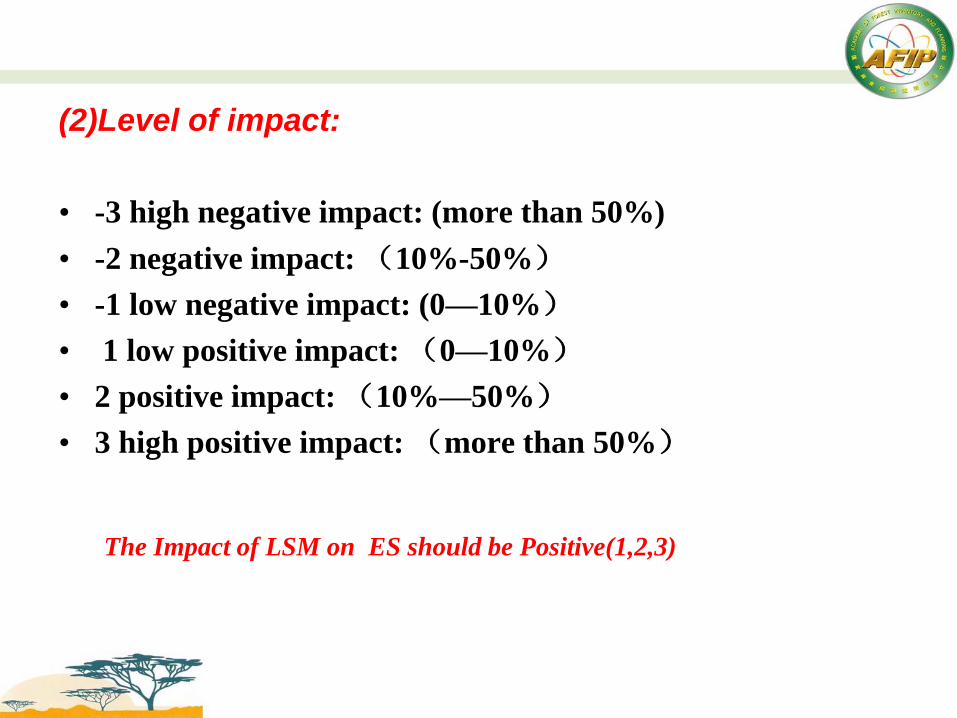
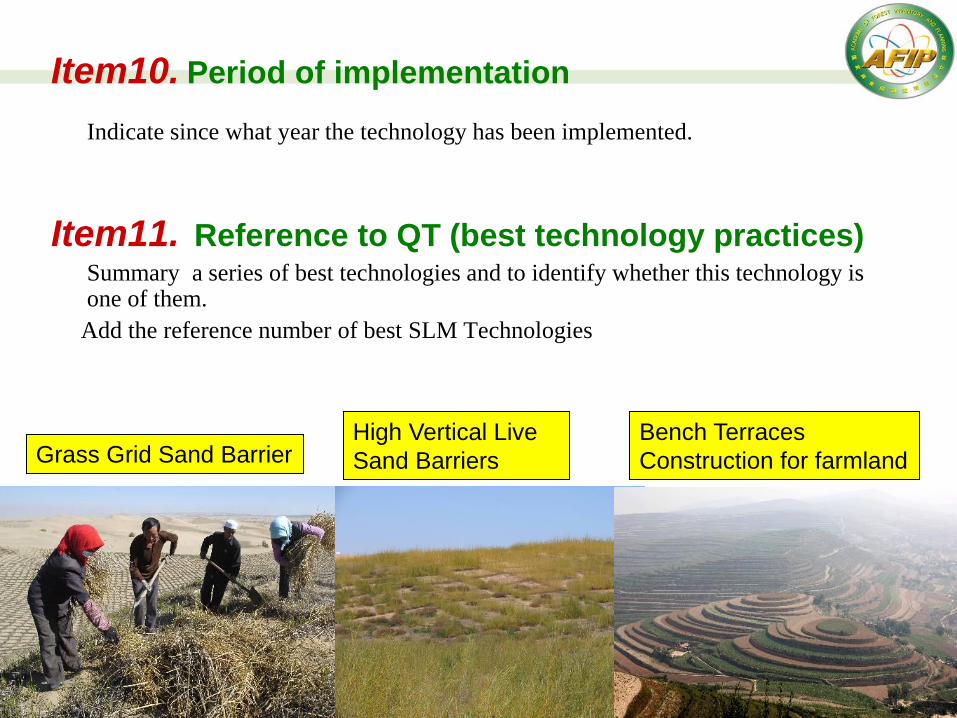
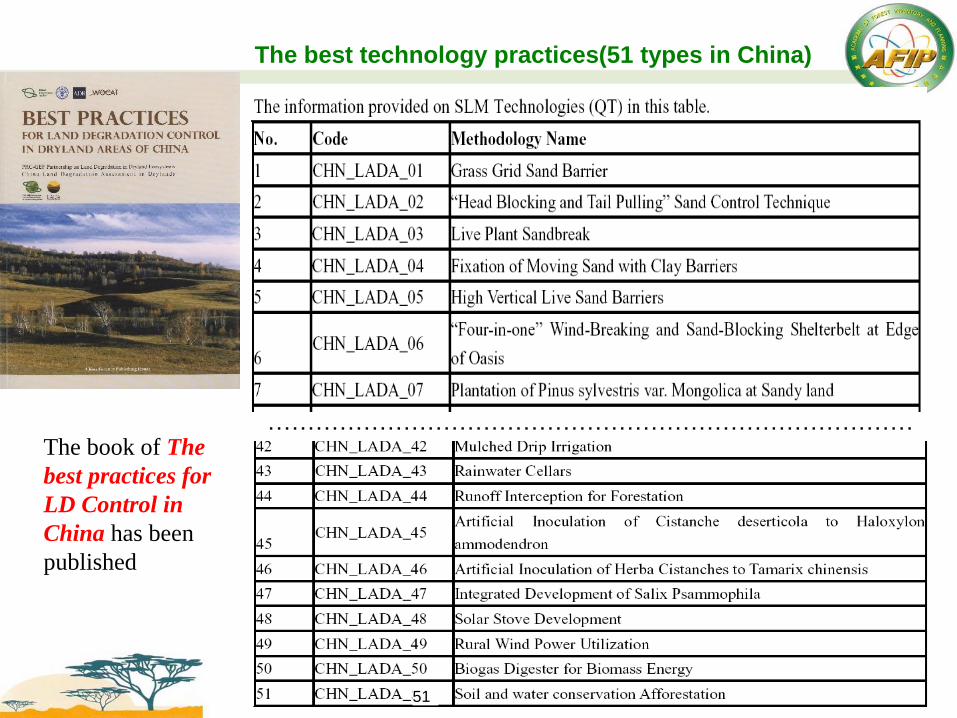
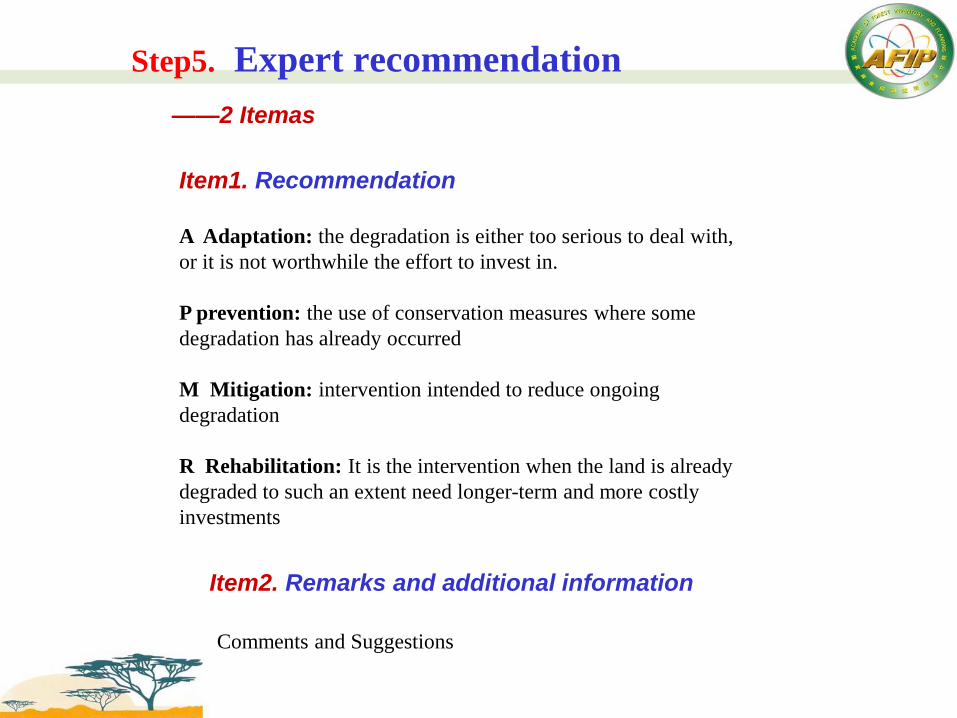
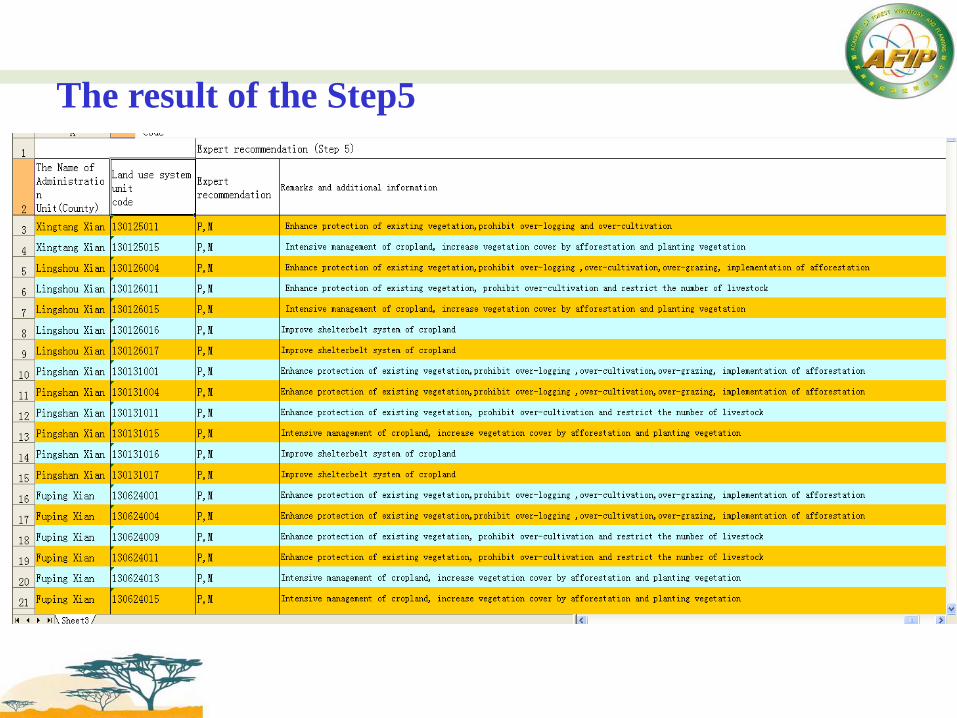
Thank you


