
DO
NG
KU
K
ST
EE
L2
01
1 A
NN
UA
L R
EP
OR
T
The More
The More Value
2 0 1 1 A N N U A L R E P O R T
DONGKUK STEEL MILL CO., LTD.Ferrum Tower 66 Suha-dong, Jung-gu, SeoulTel 82-2-317-1114
www.dongkuk.co.kr/eng/
ValueD O N G K U K S T E E L
D O N G K U K S T E E L

The More Value
CONTENTS
Financial Highlights
02/ Message From Chairman
04/ Message From President
06/ Board of Directors
08/ Vision 2015
10/ About Dongkuksteel
12/ 2011 Overview and Outlook for 2012
14/ Affiliated Companies
16/ Business Activities
18/ Social Responsibility
20/ History
21/ Financial Statements
60/ Global Network 2 0 1 1 A N N U A L R E P O R T
Financial Highlights
Individual
Consolidated
Revenue
Revenue
5,909.48,841.9
181.9267.1
5,2
71
.48
,15
4.8
24
3.2
34
6.4
4,5
65
.27
,01
6.1
15
3.7
4
17
.0
2011
2011
2011
2011
2010
2010
2010
2010
2009
2009
2009
2009
Operating Income
Operating Income
Assets
Assets
7,8
80
.21
0,1
52
.9
7,4
57
.39
,67
0.3
6,5
56
.88
,77
2.5
2011
2011
2010
2010
2009
2009
Liabilities
Liabilities
5,0
42
.0
7,0
05
.2
4,5
46
.86
,46
2.9
3,7
53
.95
,61
6.8
2011
2011
2010
2010
2009
2009
※ According to K-GAAP standards for FYE 2009,K-IFRS standards for FYE 2010, 2011
(unit :1 bi l l ion KRW)
(unit :1 bi l l ion KRW)
D O N G K U K S T E E L
2 0 1 1 A N N U A L R E P O R T

CONTENTS
01/ Financial Highlights
01/ Message From Chairman
01/ Message From President
01/ Board of Directors
01/ Vision 2015
01/ About Dongkuksteel
01/ 2011 Overview and Outlook for 2012
01/ Affiliated Companies
01/ Business Activities
01/ Social Responsibility
01/ History
01/ Financial Statements
01/ Global Network
The More Value02
2011 ANNUAL REPORT
DONGKUK STEEL 03
Message from Chairman
CONTENTS
01/ Financial Highlights
01/ Message From Chairman
01/ Message From President
01/ Board of Directors
01/ Vision 2015
01/ About Dongkuksteel
01/ 2011 Overview and Outlook for 2012
01/ Affiliated Companies
01/ Business Activities
01/ Social Responsibility
01/ History
01/ Financial Statements
01/ Global Network
I would like to express my deepest gratitude to our shareholders for their unwavering trust and support, and to our
employees for their dedicated hard work.
The financial crisis in Europe has delayed the expected recovery of the global economy. Due to increase of raw material
prices including iron ores and the stagnation of various industries, the steel industry has experienced many difficulties as we
were not able to reflect increasing raw material prices in our product pricing.
To strengthen management with a strong sense of determination for success within the constant skirmishes for survival, I
have chosen “Systemized Risk Management,” “Creative Reestablishment of Business Fundamentals,” and “Strengthening
Adaption to Changes and Maintaining Core Competitiveness,” as the management principles of our company.
By establishing a system of survival within the most difficult business environments, and by achieving success with the integrated
steel mill in Brazil, which we have prepared over the past decade, we are ready for the upcoming 100 years.
In all instances, everything depends on the people. A masterpiece sword can only be as powerful as the person who wields its blade.
we promise to communicate and corporate in creating a masterpiece sword which will be worthwhile.
I would like to ask for unchanging support and encouragement from our shareholders as Dongkuk Steel will become a
global masterpiece steel company in the future.
2012 is the known as the year of the black dragon. I hope all of our shareholders and employees achieve their goals and
soar to greater heights.
Thank you.
Sae Joo Chang Chairman and CEO
Dongkuk Steel Group
The More Value02 DONGKUK STEEL 03
Message from Chairman
By achieving
success with the
integrated steel
mil l in Brazil,
which we have
prepared over
the past decade,
we are ready for
the upcoming
100 years.

CONTENTS
01/ Financial Highlights
01/ Message From Chairman
01/ Message From President
01/ Board of Directors
01/ Vision 2015
01/ About Dongkuksteel
01/ 2011 Overview and Outlook for 2012
01/ Affiliated Companies
01/ Business Activities
01/ Social Responsibility
01/ History
01/ Financial Statements
01/ Global Network
The More Value02
2011 ANNUAL REPORT
DONGKUK STEEL 03
Message from Chairman
CONTENTS
01/ Financial Highlights
01/ Message From Chairman
01/ Message From President
01/ Board of Directors
01/ Vision 2015
01/ About Dongkuksteel
01/ 2011 Overview and Outlook for 2012
01/ Affiliated Companies
01/ Business Activities
01/ Social Responsibility
01/ History
01/ Financial Statements
01/ Global Network
Fur thermore,
we ensure that
we a lways
pract ice
t ransparent
management
and put our
shareholders
in terests
foremost.
The More Value04
2011 ANNUAL REPORT
DONGKUK STEEL 05
Message from President
Last year, Dongkuk Steel successfully stabilized Dangjin Mill and the Eco-arc electric furnace in Incheon, establishing its
position as a next-generation production plant.
By developing various new products and steel grades, we strengthened our technologies. We also established an innovative
steel business model for sustainable and eco-friendly development, as we constructed new reinforcing bar rolling plant in
Incheon. With the construction of an integrated steel mill in Brazil, we have now declared a new era of global business.
I would like to thank all of our shareholders and employees for making these accomplishments possible.
However, current business conditions are constantly threatening our growth.
Due to signs of low economic growth, stagnation in various industries,and the excessive supply of steel along with intense
competition, upholding a strong foothold within the market has become our top priority for 2012.
Peter Druckeronce said “Trying to predict the future is like trying to drive down a country road at night with no lights while
looking out the back window. The best way to predict the future is to create it.”
Although our future is unpredictable more than ever before, we cannot cease advancing forward because of fear alone. By
creating new opportunities within the changes and innovating ourselves, we cope with the challenging business environment
through communication.
As we advancing forward with our pride and confidence in Dongkuk and with our 58-year history, we will become a global
masterpiece steel company, as we promise to repay our shareholders for their support and trust.
Furthermore, we ensure that we always practice transparent management and put our shareholders interests foremost.
I would like to wish you the best of health and fortune.
Thank you.
Young Chul Kim President and CEO
Dongkuk Steel
The More Value06
2011 ANNUAL REPORT
DONGKUK STEEL 07
Board of Directors
The More Value
2011 ANNUAL REPORT
DONGKUK STEEL
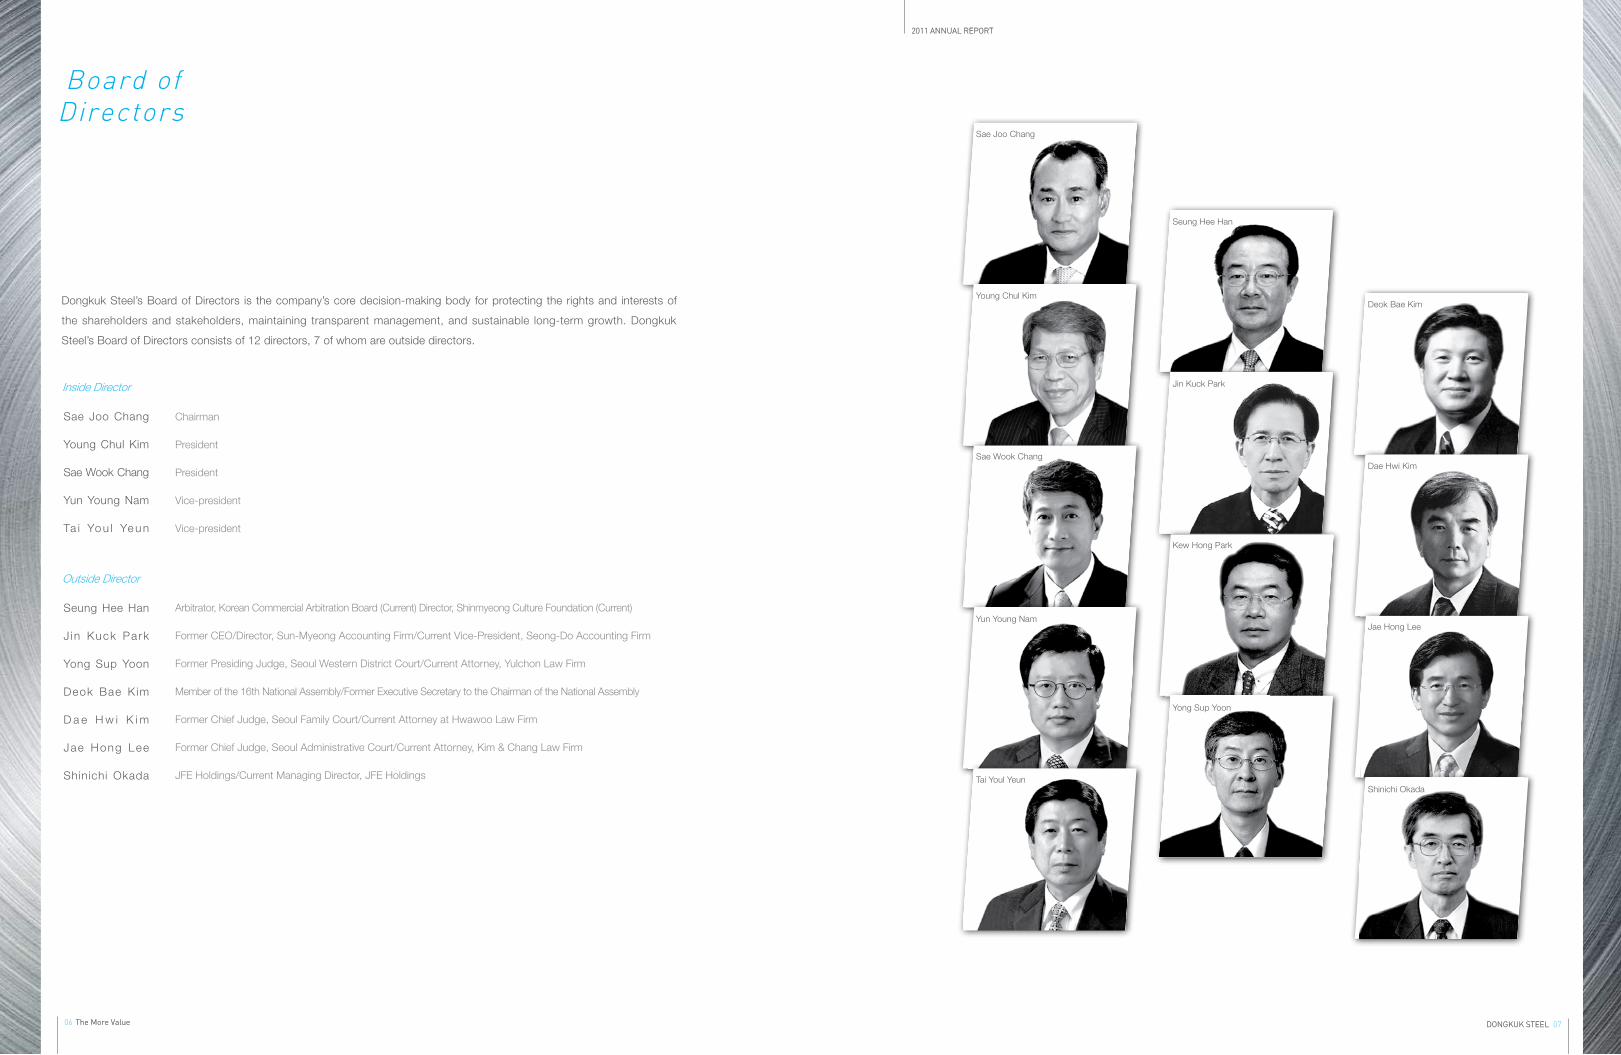
Dongkuk Steel’s Board of Directors is the company’s core decision-making body for protecting the rights and interests of
the shareholders and stakeholders, maintaining transparent management, and sustainable long-term growth. Dongkuk
Steel’s Board of Directors consists of 12 directors, 7 of whom are outside directors.
Deok Bae Kim
Dae Hwi Kim
Jae Hong Lee
Shinichi Okada
Seung Hee Han
Jin Kuck Park
Kew Hong Park
Yong Sup Yoon
Sae Joo Chang
Inside Director
Sae Joo Chang
Young Chul Kim
Sae Wook Chang
Yun Young Nam
Ta i Yo u l Ye u n
Outside Director
Seung Hee Han
J in Kuck Park
Yong Sup Yoon
Deok Bae K im
D a e H w i K i m
Jae Hong Lee
Shinichi Okada
Chairman
President
President
Vice-president
Vice-president
Arbitrator, Korean Commercial Arbitration Board (Current) Director, Shinmyeong Culture Foundation (Current)
Former CEO/Director, Sun-Myeong Accounting Firm/Current Vice-President, Seong-Do Accounting Firm
Former Presiding Judge, Seoul Western District Court/Current Attorney, Yulchon Law Firm
Member of the 16th National Assembly/Former Executive Secretary to the Chairman of the National Assembly
Former Chief Judge, Seoul Family Court/Current Attorney at Hwawoo Law Firm
Former Chief Judge, Seoul Administrative Court/Current Attorney, Kim & Chang Law Firm
JFE Holdings/Current Managing Director, JFE Holdings
Young Chul Kim
Sae Wook Chang
Yun Young Nam
Tai Youl Yeun

The More Value08
2011 ANNUAL REPORT
DONGKUK STEEL 09
Vision 2015
CHANGE & GROWTH
Global Production
Customer-oriented sales and technologyMarketing
Strengthen product competitiveness based on technology
Secure highest level of raw material prices competitiveness
Reinforce ourstanding inthe global market
Operating Profit Revenue
10 million tons
600 billion won7 trillion won
Global
Integrated Steel
Manufacturer
Having achieved continuous growth as Korea’s first privately-owned steel company, Dongkuk
Steel is preparing to continue its growth to become global integrated steel manufacturer under
the company’s motto “Change & Growth.”
While pursuing customer-oriented technology sales and marketing, Dongkuk Steel will secure the
highest level of cost competitiveness, product competitiveness based on technology leadership,
while securing a strong foothold within the global market. By doing so, it will achieve 10 million tons
in production, 7 trillion won in revenue, and 600 billion won in operating profit by 2015.

The More Value10
2011 ANNUAL REPORT
DONGKUK STEEL 11
About Dongkuk steel
Dangjin Works, which began commercial
production in 2010, is a state-of-the-art steel
plate factory. It is responsible for producing
various high-value-added steel products, such
as TMCP and normalized steel plates.
Busan Works manufactures various small size
sections to meet a wide range of customer’s
demands.
Incheon Works specializes in manufacturing reinforcing bars. It is equipped with a state-of-the-art eco-friendly electric : ECO-Arc
electric furnace and other steel production facilities. The construction of a new reinforcing bars rolling plant is underway with the
goal of a hot-run in mid-2012, commencing commercial production for the 4th quarter of 2012. Therefore, the competitiveness of
Incheon Works as Dongkuk’s primary reinforcing bars plant is expected to increase significantly.
DongkukSteel, established in 1954 as a small
company that manufactured nails and steel
wires, has now grown into a global steel
company that manufactures steel plates,
reinforcing bars, and sections.
By manufacturing steel plates for the first time
in Korea, Dongkuk Steel created a growth
foundation for Korea’s shipbuilding industry to
become the world’s number 1. And through the
bold investments in the Eco-Arc electric furnace
sector, it has strengthened its leadership as
an eco-friendly electric furnace manufacturer
with global competitiveness. It is expanding its
business area to blast furnaces by constructing
a steel mill in Brazil, as it prepares to become a
global, integrated steel manufacturer.
With its headquarters in Seoul, Dongkuk Steel
operates 4 sites in Pohang, Incheon, Dangjin,
and Busan.
Pohang Works is Dongkuk’s main production
plant that produce crude steel, steel plates,
sections, and re-bars. To cope with changes
within the steel plates market and to strengthen
the company’s competitiveness, the No. 1
Plate Factory, an outdated facility that has been
operating since October of 1990, will be shut
down in June 10, 2012.
Pohang Incheon Dangjin Busan TotalCrude Steel 1,400 2,200 0 0 3,600
Products 4,450 1,410 1,500 200 7,560
Steel plates 2,900 0 1,500 0 4,400
Reinforcing Bars 550 1,410 0 0 1,960
Sections 1,000 0 0 200 1,200
Pohang Incheon Dangjin Busan TotalCrude Steel 1,400 2,200 0 0 3,600
Products 3,450 1,930 1,500 200 7,080
Steel plates 1,900 0 1,500 0 3,400
Reinforcing Bars 550 1,930 0 0 2,480
Sections 1,000 0 0 200 1,200
(Unit: 1,000tons)
2012
2011
Dongkuk Steel Site &
Production Capacity

Steel Plates Reinforcing Bars & Sections
2011 Overview
Thanks to the global economic recovery, increasing number of new ships commissions, and shipyards’ stocking demand we have experienced increasing sales volume and favorable pricing conditions As shipyards began destocking and shipbuilding volume decreased in 2nd half domestic sales volume and price fell sharply. Increase in slab input price caused by time lag between contract and input as well as depreciating KRW were also main reasons for lower profit rate.
As Korean steel plate manufacturers increased their production capacities by over 5 million tons in 2010 and shipyards imported more steel plates from overseas, steel plate manufacturers’ leverage in price negotiations weakened significantly.
2011 Overview
The construction industry index of 2011 showed a 4% increase (Construction 10.9%↑, Civil works 6.6%↓) in total amount of constructions commissioned, a 10.1% increase (Residential 10.4%↑, Commercial 27.7%↑) in area approved for construction, and a 19.8% increase (Residential 54.2%↑, Commercial 16.8%↑) in area where construction has begun, which resulted in increased sales of reinforcing bars and sections.
Increasing demands for officetels and commercial buildings, civil engineering constructions such as subways, and the growth of residential real-estate markets such as apartment housing in the suburbs were the main causes of growth.
Annual sales of H-beams showed the highest production and sales in the company’s history, and the quarterly sales of reinforcing bars also reached the highest ever in the 4th quarter.
Outlook for 20112
As shipyards are building ships at lower commission rates, this will lead to higher pressure to lower the price of steel plates, and the overall profitability of 2012 is expected to be low as compared to 2011.
However, profitabilify in steel industry has hit the bottom during the 1st quarter and will gradually improve. The drop in slab input price and appreciating KRW will have a positive effect in recovering our profitability.
The overall demand of steel plates is expected to decrease from the previous year, due to less demands from shipyards. On the other hand, orders for offshore plants, offshore structures, and LNG carriers are expected to increase due to high oil prices. Demand for steel plates for oil well pipes and oil pipelines are expected to increase. If the global economy improves and orders of merchant ships recover, the demand for steel plates during the 2nd half may be much stronger than we expect.
Outlook for 20112
The approval and construction of residential buildings show continuous increase since 2010. The increasing demands for housing constructions suburban regions and public corporations such as LH and SH Corporation will likely result in gradual recovery in the housing sector. Furthermore, demands for reinforcing bars and sections will gradually increase as government organizations begin construction for relocation and large infrastructure investments increase.
The profitability of reinforcing bars is expected to improve thanks to the stabilization of the Eco-Arc electric furnace in Incheon and the new reinforcing bars pressure rolling plant, which completed in June, 2012. On the other hand, profitability of sections is expected to see a slight decrease, as more imported products are being introduced into the market. However, it will still be higher than steel plates and reinforcing bars.
(Unit: 1,000 tons)
(Unit: 1,000 tons)
The More Value12
2011 ANNUAL REPORT
DONGKUK STEEL 13
2009 2010 2011Domestic 2,296 3,004 2,746
Export 264 481 579Total 2,560 3,485 3,325
2009 2010 2011Domestic 2,728 2,636 2,773
Export 181 183 188Total 2,910 2,819 2,961
Annual Sales Volume
3,3
25
3,4
85
2,5
60
2011 2010 2009
Total
Annual Sales Volume
2,9
61
2,8
19
2,9
10
2011 2010 2009
Total

The More Value14
2011 ANNUAL REPORT
DONGKUK STEEL 15
Affil iated Companies
Dongkuk Steel Group consists of 18 companies in Korea, including Dongkuk Steel, and 16 corporations overseas.
Dongkuk Steel Group’s steel business consists of Dongkuk Steel, which manufactures steel plates and long products,
and Union Steel, which manufactures cold-rolled coated plates and color coated plates. Dongkuk Steel Group’s
logistics business utilizes an integrated system that includes land and maritime transportation, port stevedoring, and
management. And Dongkuk Steel Group also operates businesses in machinery production and IT sectors.
By creating synergy through the collaboration of affiliated companies, and making continuous investment and growth,
all affiliated companies of Dongkuk Steel Group are steadily becoming global enterprises.
18 companies in Korea + 16 companies overseas
Dec.31, 2011. standard
Organization Chart
ANHUI KUKJE
JINGTIAN
MACHINERY
BRANSON
MACHINERY
DONGKUK STEEL
40.37% 34.82%
27.6%
5%
21.35% 90%
16.67%
100% 100%
100%100%
84.85%
5%
60% 40%
10.23% 35.4%44.8%
14.68%
100%1.46%
100% 100%
51%
70.94% 100% 100%
25%
75%
100%
55.56% 44.44%
100%
50%
50%
73.33% 43.84% 65.11% 51.9% 98.55% 55% 63.59% 51.08% 30%
DK AZTEC DK UILILSIN U & VENTURE CAPITAL
INTERGIS
DK S&
UNION
COATING
UNION STEEL
FERRUM INFRA
Dangjin Kodae-port Operating
DONGKUK
INT’L
DONGKUK
CORP.CSP
DKC.S.A
AIMSTEK CO., LTD
Intergis Logistics Center
DKLC
BGCT
I&K Newport
DK TECHDK UIL H.K
DK UIL TIANJIN
DK UIL VIETNAM
UNION LOGISTICS JIANGYIN
BLUE MINE
DK UNC
UNION STEEL CHINA
UNION STEEL MEXICO
WUXI
CHANGJIANG
STEEL METAL
UNION STEEL
PROCESSING
CENTER
USI SERVICE
CENTER P.L
KUKJE
MACHINERY

The More Value16
2011 ANNUAL REPORT
DONGKUK STEEL 17
Business Activities
Resolution to Investments in the Blast Furnace Steel Mill in Brazil
On December 9, 2011, Dongkuk Steel’s Board of Directors reached a resolution to invest in the blast furnace steel mill in Brazil with
Vale and POSCO. As a result, CSP, a joint venture of Dongkuk Steel, Vale, and POSCO, will acquire 30, 50, and 20 percent shares
respectively, and begin the joint venture.
During stage 1 of the project, CSP will invest 4.868 billion
dollars to construct a 3 million-ton class steel mill by
2015. 50 percent of the budget will be acquired from
outside loans and the remaining 50 percent will be paid
by equities of the 3 companies. Dongkuk Steel will be
investing 730 million dollars.
Pile driving and groundbreaking construction will begin
in the second half of 2012 and a hot run is expected to
take place during the second half of 2015. As a result of
this joint venture, Dongkuk Steel has acquired the rights
to receive a stable supply of a minimum of 1.6 million
tons of high-quality slabs.
Construction of New Reinforcing bar Pressure Rolling Line in Incheon
In April 2011, Dongkuk Steel began the construction of the new
reinforcing bar rolling line, which is a downstream process of the
1.2 million ton capacity Eco-Arc electric furnace, which began
commercial production in January 2011.
The new pressure rolling line uses advanced technologies such
as hot-direct rolling and no-twist rolling to dramatically improve
quality and productivity. It is also an eco-friendly, low-carbon
facility that maximizes energy consumption. The new facility will
be capable of manufacturing high-value-added reinforcing bars of
every specification, including ultra high-strength reinforcing bars
(SD800) with 57mm in diameter and tensile strength of 800MPa. The new line is planned to begin a hot run in June, 2012, and the
preexisting pressure rolling line (annual production capacity of 680,000 tons) is due to be shut down.
INTERGIS IPO
INTERGIS is a general logistic company that operates port
stevedoring, transportation of steel products and import/export
containers and cargo transportation with business sites in
Busan, Pohang, Dangin and Incheon. And through its IPO in
December 2011, it was successfully enlisted in the KOSPI.
Union Steel begins commercial production in No. 6 and No. 7 CCL
In January 2012, Union Steel began commercial production in No. 6 and
No. 7 CCL which began construction in March 2011.
The No.6 CCL is specialized equipment for printed steel sheets, and the
No.7 CCL is specialized for film-laminated steel sheets. These two lines
combined will have an annual production capacity of 120,000 tons.
Union Steel color coated sheets uphold the top plates market share in
Korea and it is aiming to become No.1 product. After acquiring recognition
for its excellent quality, Union Steel color coated sheets are supplied to world-leading appliance manufacturers, such as Whirlpool,
Mitsubishi, Samsung, and LG. Union Steel aims to achieve a 1 million ton production capacity of color coated sheets by 2015.
By establishing a coiling center in Thailand, following overseas plants in China and Mexico, Union Steel will continue to its global
expansion.
Acquisition of DK AZTEC
Dongkuk Steel has acquired ASTEK(changed name to DK AZTEC), which manufactures sapphire ingots, in May 2011 by acquiring
38.1 percent of its shares, making Dongkuk the largest shareholder with management rights. Sapphire ingots are core materials used
in the circuit boards of LEDs, and DK AZTEC is a prominent venture company that possesses the technology to manufacture large
sapphire ingots and also has the ability to develop its own equipment. In December of last year,
DK AZTEC became Korea’s first company to successfully manufacture 6-inch sapphire ingots,
and maintains excellent technological leadership compared to its competition. By continuously
supporting investments towards DK AZTEC, Dongkuk Steel will nurture the company to occupy
a dominant share of the sapphire ingot market, which only a few companies in the world are
able to provide large supplies.

The More Value18
2011 ANNUAL REPORT
DONGKUK STEEL 19
Social Responsibility
Volunteer Activities
Under the mission of “Make the World a Heart-warming Place,” Dongkuk Steel carries out up-close volunteer activities from
each business site to support the local community, which is the foundation of our growth, and to expand the corporate culture of
sharing and volunteering.
Scholarships for Engineering Students
In collaboration with the Songwon Cultural Foundation, Dongkuk Steel provides scholarships to outstanding engineering major
undergraduate and graduate students of 13 universities since 2004.
Dongkuk’s scholarship program began in hopes to support the developments of engineering in the local communities, and the
number of beneficiary students and schools are increasing. Furthermore, scholarship beneficiaries are also given added points if
they wish to work with Dongkuk Steel upon graduation.
Cultural Activities
Based on the management philosophy of “Contributing to Cultural Developments
through Steel” Dongkuk Steel actively participates in corporate “Mecenat” activities,
including supporting cultural and arts events such as exhibitions and performances.
Since 2004, Dongkuk Steel has been supporting the cultural and arts society, including
classical music performances and musicals as well as operas by the National Opera
Company. Furthermore, it also operates Songwon Arts Center to helping discover and
support young, talented artists.
Songwon Cultural Foundation
Songwon Cultural Foundation was established in December of 1996 through a
donation of 10 billion won to support talented human resources, and to help our
neighbors in need by creating a brighter society, as it was the wishes of the late
Chairman Sang Tae Chang, who founded the company.
Today, it collaborates with Dongkuk Steel to support scholarships, donations
for self-support, and research and development in academic and scientific
technologies.
Scholarships
Academic/Research Programs
Donations
Culture Programs
(unit: million won)
(unit: million won)
(unit: million won) (unit: million won)
535
552
4,319 1,633
1998~2011

22 Report of Independent Auditors
24 Statement of Financial Position
26 Statement of Income
28 Separate Statement of Comprehensive Income
29 Separate Statement Changes in Equity
30 Statement of Cash Flows
32 Notes to the Separate Financial Statements
C O N T E N T S
Financial StatementsDecember 31, 2011 and 2010, and January 1, 2010
The More Value20
2011 ANNUAL REPORT
DONGKUK STEEL 21
History
Jul. 1954
May 1963
Mar. 1965
Oct. 1966
Feb. 1971
Feb. 1972
Feb. 1985
May 1986
Jun. 1991
Apr. 1993
Feb. 1994
Dec. 1997
Feb. 1999
Ju l . 2004
Oct. 2009
May 2010
Jun. 2010
Oct. 2010
Jul . 2012
Jun. 2012
Dongkuk Steel established
Construction of large-scale steel works begins, first private steel company (Busan)
Blast furnace completed (50 tons/day), a first in Korea
Electric furnace completed (15 tons/day), a first in Korea
Completed plate mill, a first in Korea (150,000 tons/year)
Merges with Hankuk Steel and Hankuk Steel Ind. (Incheon Works)
Merges with Yeonhap Steel (Union Steel), Kukje Machinery, & Kukje Transportation
Incheon Works breaks world record in steel production per hour
No.1 Plate Mill in Pohang Works completed (1 mil. tons/year)
2nd Incheon Works completed; DC electric furnace (1million ton), a first in Korea
Permanent no-strike declared, a first in Korea
No.2 Plate Mill (1.5 mil. tons/year) & Section Mill (720,000 tons / year) in Pohang Works completed
Rebar Mill in Pohang Works completed (400,000 tons/year)
New corporate vision and new CI declared on 50th anniversary
Completed new R&D Center
Opening ceremony for Plate Mill in Dangjin Works (1.5mil. tons/year)
Completed new head office “Ferrum Tower”
Completed ‘Eco Arc’ Electric Furnace(1.2million ton) in Incheon Works
Established joint venture with POSCO and Vale, CSP in Brazil
Completed new rebar will in Incheon(1.2mil. tons/year)

The More Value22
2011 ANNUAL REPORT
DONGKUK STEEL 23
Samil PricewaterhouseCoopers, LS Yongsan Tower, 191, Hangangno 2-ga, Yongsan-gu, Seoul 140-702, Korea (Yongsan P.O Box 266, 140-600), www.samil.com
This report is effective as of March 7, 2012, the audit report date. Certain subsequent events or circumstances, which may occur
between the audit report date and the time of reading this report, could have a material impact on the accompanying separate
financial statements and notes thereto. Accordingly, the readers of the audit report should understand that there is a possibility that
the above audit report may have to be revised to reflect the impact of such subsequent events or circumstances, if any.
Seoul, Korea
March 7, 2012
financial statements. An audit also includes assessing the accounting principles
used and significant estimates made by management, as well as evaluating the
overall financial statement presentation. We believe that our audit provides a
reasonable basis
In our opinion, based on our audit, the separate financial statements, referred to
above, present fairly, in all material respects, the financial position of DONGKUK
STEEL MILL CO., LTD. as of December 31, 2011, and its financial performance
and cash flows for the year then ended in accordance with Korean-IFRS.
Auditing standards and their application in practice vary among countries. The
procedures and practices used in the Republic of Korea to audit such financial
statements may differ from those generally accepted and applied in other
countries. Accordingly, this report is for use by those who are informed about
Korean auditing standards and their application in practice.
for our opinion.
To the Board of Directors and Shareholders of
DONGKUK STEEL MILL CO., LTD.
We have audited the accompanying separate statement of financial position of DONGKUK STEEL
MILL CO., LTD. (the “Company”) as of December 31, 2011, and the related separate statement
of income, comprehensive income, changes in equity and cash flows for the year then ended,
expressed in Korean won. These separated financial statements are the responsibility of the
Company’s management. Our responsibility is to express an opinion on these separate financial
statements based on our audit. The financial statements of the Company as of and for the year
ended December 31, 2010, were audited by us as per our audit report dated March 1, 2011, where
we expressed an unqualified opinion on those statements. The financial statements on which we
expressed an unqualified opinion do not reflect the adjustments as described in Note 39 as required
by the International Financial Reporting Standards adopted by the Republic of Korea (“Korean-
IFRS”). However, the financial statements presented herein for comparative purposes reflect such
adjustments in accordance with Korean-IFRS.
We conducted our audit in accordance with auditing standards generally accepted in the Republic
of Korea. Those standards require that we plan and perform the audit to obtain reasonable
assurance about whether the financial statements are free of material misstatement. An audit
includes examining, on a test basis, evidence supporting the amounts and disclosures in the
Report of Independent Auditors

The More Value24
2011 ANNUAL REPORT
DONGKUK STEEL 25
Separate Statements of Financial PositionYears Ended December 31, 2011 and 2010, january1, 2010
Consolidated Statements of Financial PositionYears Ended December 31, 2011 and 2010, january1, 2010
AssetsCurrent assets
Cash and cash equivalents
Financial deposits
Trade receivables
Other receivables
Other financial assets
Inventories
Other current assets
Total current assets
Non-current assetsFinancial deposits
Other receivables
Other financial assets
Property, plant and equipment
Intangible assets
Investment Property
Investments in subsidiaries, joint ventures and associates
Other non-current assets
Total non-current assets
Total assets
Liabilities and EquityLiabilities Current liabilities
Trade payables
Borrowings
Other payables
Other current liabilities
Total current liabilities
Non-current liabilitiesBorrowings
Defined benefit liabilities
Deferred income tax liabilities
Other payables
Provisions
Total non-current liabilities
Total liabilities
EquityCapital stock
Capital surplus
Retained earnings
Accumulated other comprehensive income
Other components of equityTotal equityTotal liabilities and equity
(in thousands of Korean won)
4,5
4,5
4,6,37
4,6,37
4,7
8
9
4,5
4,6
4,7
10
11
13
12
9
4,15,37
4,14,36
4,15,37
4,7,19
4,14,36
17
16
4,15
18,35
1,20
21
22
20,22
663,307,649
590,352,901
853,885,047
4,330,481
4,294,053
1,385,573,181
40,669,451
3,542,412,763
30,300
1,672,064
121,142,981
3,066,675,245
56,853,425
154,938,614
935,473,099
1,034,915
4,337,820,643
7,880,233,406
1,641,784,804
1,512,564,343
128,647,179
14,498,091
3,297,494,417
1,663,875,512
20,780,393
45,780,674
14,091,200
-
1,744,527,779
5,042,022,196
421,185,800
83,097,849
1,722,317,810
-39,255,276
650,865,027
2,838,211,210
7,880,233,406
30,300
1,273,375
170,396,799
3,067,927,282
65,381,299
93,524,136
787,785,025
1,040,867
4,187,359,083
7,457,313,816
1,813,397,762
1,246,251,913
110,446,887
15,974,620
3,186,071,182
1,257,478,549
23,270,537
39,804,626
10,076,300
30,101,127
1,360,731,139
4,546,802,321
421,185,800
83,097,849
1,756,808,586
-1,445,767
650,865,027
2,910,511,495
7,457,313,816
28,300
9,512,499
206,570,392
2,799,722,629
66,838,856
-
654,755,576
10,585,833
3,748,014,085
6,524,289,524
1,380,024,768
964,490,491
112,384,799
25,205,221
2,482,105,279
1,163,735,181
19,135,214
7,258,212
7,832,075
-
1,197,960,682
3,680,065,961
421,185,800
83,097,849
1,656,943,238
26,922,133
656,074,543
2,844,223,563
6,524,289,524
598,114,510
549,132,411
801,497,067
13,361,134
44,062,974
1,222,282,841
41,503,796
3,269,954,733
948,051,761
306,064,346
653,563,432
17,410,636
4,096,665
813,968,660
33,119,939
2,776,275,439
Notes December 31,2011
December 31,2010
January 1,2010
The accompanying notes are an integral part of these separate financial statements.
AssetsCurrent assets
Cash and cash equivalents
Financial deposits
Trade receivables
Other receivables
Other financial assets
Inventories
Other current assets
Non-current assets classified as held for sale
Total current assets
Non-current assetsFinancial deposits
Trade receivables
Other receivables
Other financial assets
Property, plant and equipment
Intangible assets
Investment Property
Investments in joint ventures and associates
Deferred income tax assets
Other non-current assets
Total non-current assets
Total assets
Liabilities and EquityLiabilities Current liabilities
Trade payables
Current income tax liabilities
Borrowings
Other payables
Provisions
Other current liabilities
Total current liabilities
Non-current liabilitiesBorrowings
Defined benefit liabilities
Deferred income tax liabilities
Other payables
Provisions
Other non-current liabilities
Total non-current liabilities
Total liabilities
EquityEquity attributable to owners of the Parent
Capital stock
Capital surplus
Retained earnings
Accumulated other comprehensive income
Other components of equity
Non-controlling interestsTotal equityTotal liabilities and equity
(in thousands of Korean won)
4,5
4,5
4,6,37
4,6,37
4,7
8
9
10
4,5
4,6
4,6
4,7
10
11
13
12
16
9
4,15,37
4,14,36
4,15,37
18,35
4,7,19
4,14,36
17
16
4,15
18,35
4,7,19
1,20
21
22
20,22
821,421,405
658,677,480
1,378,721,874
59,696,680
37,475,716
1,785,715,551
95,714,010
1,737,290
4,839,160,006
3,400,100
2,869,864
27,682,338
142,850,048
4,506,163,808
91,757,066
238,630,249
275,991,527
9,511,647
15,050,521
5,313,725,168
10,152,885,174
1,135,945,100
4,785,173
3,165,485,152
175,988,255
47,434
41,522,168
4,523,733,282
2,288,691,391
59,223,424
101,312,956
27,003,494
3,578,865
1,593,699
2,481,403,8297,005,177,111
421,185,800
83,097,849
1,693,916,283
(42,756,012)
642,646,864
2,798,090,784
349,617,279
3,147,708,06310,152,885,174
2,475,600
2,021,735
27,012,254
252,957,155
4,384,147,229
101,804,661
202,043,194
39,472,782
9,890,796
12,698,269
5,034,523,675
9,670,304,752
1,496,032,786
5,819,350
2,873,340,842
164,087,738
-
44,438,944
4,583,719,660
1,656,830,154
70,259,443
95,705,491
20,988,011
35,312,842
110,000
1,879,205,9416,462,925,601
421,185,800
83,097,849
1,729,407,076
21,220,620
665,368,335
2,920,279,680
287,099,471
3,207,379,1519,670,304,752
623,500
1,137,253
30,622,248
277,104,325
4,208,498,570
105,614,983
71,967,208
54,962,323
6,146,599
10,909,407
4,767,586,416
8,643,597,504
1,260,306,322
6,829,908
2,162,836,479
188,760,854
1,409,608
54,691,348
3,674,834,519
1,724,348,124
54,468,713
67,192,830
20,567,703
5,259,102
107,000
1,871,943,4725,546,777,991
421,185,800
83,097,849
1,611,221,347
50,797,156
662,450,359
2,828,752,511
268,067,002
3,096,819,5138,643,597,504
883,636,402
625,426,174
1,273,115,791
28,314,312
87,227,234
1,642,466,140
94,797,794
797,230
4,635,781,077
1,192,243,877
373,216,666
1,058,955,284
26,899,367
13,262,243
1,123,064,634
88,369,017
-
3,876,011,088
Notes December 31,2011
December 31,2010
January 1,2010
The accompanying notes are an integral part of these separate financial statements.

The More Value26
2011 ANNUAL REPORT
DONGKUK STEEL 27
Revenue
Cost of sales
Gross profit
Selling, general and administrative expenses
Other operating income
Other operating expenses
Operating profit
Financial income
Financial expenses
Share of profit (loss) of joint ventures and associates
Profit before Income tax
Income tax expense
Profit for the year
Profit attributable to:
Owners of the parent
Non-controlling interests
Earnings per share for profit attributable to owners of the parent (in Korean won)
Basic earnings per share
(in thousands of Korean won, except per share amounts)
23,37
8,24,37
24,26,37
27
24,28
29
30
12
34
31
32
8,841,939,944
8,213,649,287
628,290,657
349,711,533
151,423,480
162,933,001
267,069,603
130,176,869
310,395,850
-8,043,395
78,807,254
72,297,826
6,504,428
7,485,482
-976,054
124
8,154,799,191
7,366,209,535
788,589,656
360,537,909
120,524,212
202,145,544
346,430,415
129,439,357
244,003,935
-3,486,260
228,379,577
49,614,359
178,765,218
162,546,621
16,218,597
2,681
Notes 2011 2010
Separate Statements of IncomeYears Ended December 31, 2011 and 2010
Consolidated Statements of IncomeYears Ended December 31, 2011 and 2010
Revenue
Cost of salesGross profit
Selling, general and administrative expenses
Other operating income
Other operating expenses
Operating profit
Financial income
Financial expenses
Profit before Income tax
Income tax expense
Profit for the year
Earnings per share for profit(In Korean Won)
Basic earnings per share
(in thousands of Korean won, except per share amounts)
23,37
8,24,37
24,26,37
27
24,28
29
30
34
31
32
5,909,399,295
5,482,854,258
426,545,037
217,485,116
97,869,680
125,022,918
181,906,683
84,952,763
203,572,903
63,286,543
52,334,511
10,952,032
181
5,271,376,417
4,772,382,721
498,993,696
195,999,953
90,543,980
150,343,667
243,194,056
85,374,664
147,533,719
181,035,001
42,319,641
138,715,360
2,288
Notes 2011 2010
The accompanying notes are an integral part of these separate financial statements. The accompanying notes are an integral part of these separate financial statements.
The More Value28
2011 ANNUAL REPORT
DONGKUK STEEL 29
7
17
(in thousands of Korean won)
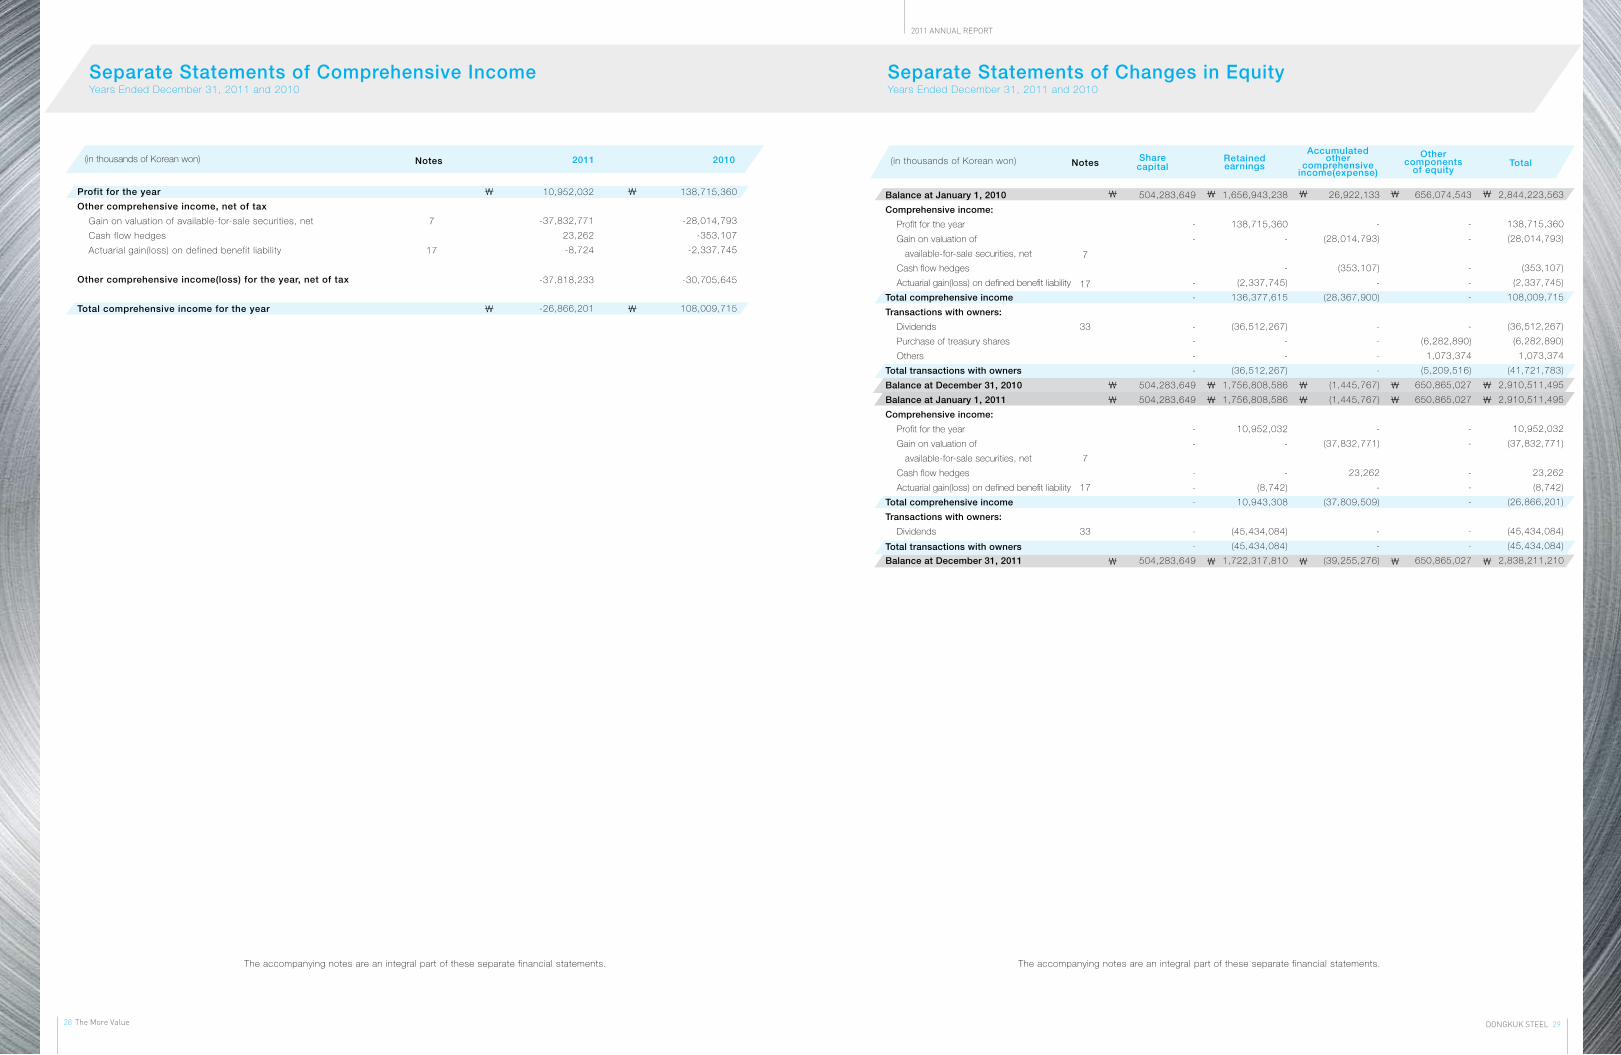
Separate Statements of Comprehensive IncomeYears Ended December 31, 2011 and 2010
Separate Statements of Changes in EquityYears Ended December 31, 2011 and 2010
(in thousands of Korean won) Notes 2011 2010
The accompanying notes are an integral part of these separate financial statements. The accompanying notes are an integral part of these separate financial statements.
Profit for the year
Other comprehensive income, net of tax
Gain on valuation of available-for-sale securities, net
Cash flow hedges
Actuarial gain(loss) on defined benefit liability
Other comprehensive income(loss) for the year, net of tax
Total comprehensive income for the year
10,952,032
-37,832,771
23,262
-8,724
-37,818,233
-26,866,201
138,715,360
-28,014,793
-353,107
-2,337,745
-30,705,645
108,009,715
Balance at January 1, 2010
Comprehensive income:
Profit for the year
Gain on valuation of
available-for-sale securities, net
Cash flow hedges
Actuarial gain(loss) on defined benefit liability
Total comprehensive income
Transactions with owners:
Dividends
Purchase of treasury shares
Others
Total transactions with owners
Balance at December 31, 2010
Balance at January 1, 2011
Comprehensive income:
Profit for the year
Gain on valuation of
available-for-sale securities, net
Cash flow hedges
Actuarial gain(loss) on defined benefit liability
Total comprehensive income
Transactions with owners:
Dividends
Total transactions with owners
Balance at December 31, 2011
7
17
33
7
17
33
504,283,649
-
-
-
-
-
-
-
-
504,283,649
504,283,649
-
-
-
-
-
-
-
504,283,649
1,656,943,238
138,715,360
-
-
(2,337,745)
136,377,615
(36,512,267)
-
-
(36,512,267)
1,756,808,586
1,756,808,586
10,952,032
-
-
(8,742)
10,943,308
(45,434,084)
(45,434,084)
1,722,317,810
26,922,133
-
(28,014,793)
(353,107)
-
(28,367,900)
-
-
-
-
(1,445,767)
(1,445,767)
-
(37,832,771)
23,262
-
(37,809,509)
-
-
(39,255,276)
656,074,543
-
-
-
-
-
-
(6,282,890)
1,073,374
(5,209,516)
650,865,027
650,865,027
-
-
-
-
-
-
-
650,865,027
2,844,223,563
138,715,360
(28,014,793)
(353,107)
(2,337,745)
108,009,715
(36,512,267)
(6,282,890)
1,073,374
(41,721,783)
2,910,511,495
2,910,511,495
10,952,032
(37,832,771)
23,262
(8,742)
(26,866,201)
(45,434,084)
(45,434,084)
2,838,211,210
Notes Sharecapital
Retainedearnings
Accumulatedother
comprehensiveincome(expense)
Othercomponents
of equityTotal

The More Value30
2011 ANNUAL REPORT
DONGKUK STEEL 31
Cash flows from operating activities
Cash generated from operations
Interest received
Interest paid
Dividends received
Income tax paid
Net cash generated from operating activities
Cash flows from investing activities
Decrease in financial deposits
Decrease in other receivables
Decrease in other financial assets
Proceeds from disposal of property, plant and equipment
Proceeds from disposal of intangible assets
Inflow from changes in consolidated subsidiaries
Decrease in other non-current assets
Increase in financial deposits
Increase in other receivables
Increase in other financial assets
Purchases of property, plant and equipment
Purchases of intangible assets
Acquisition of subsidiary, net of cash acquired
Acquisition of investments in joint ventures and associates
Outflow from changes in consolidated subsidiaries
Increase in other assets
Net cash used in investing activities
Cash flows from financing activities
Proceeds from borrowings
Issuance of capital stock
Capital increase from non-controlling interests
Repayments of borrowings
Purchase of treasury shares
Dividends paid
Capital decrease from non-controlling interests
Net cash provided by financing activities
Net decrease in cash and cash equivalents
Cash and cash equivalents at beginning of year
Exchange gains on cash and cash equivalents
Cash and cash equivalents at the end of year
34
5
5
16,676,592
39,242,933
(209,561,463)
3,581,116
(68,088,686)
(218,149,508)
1,441,786,735
47,435,584
91,818,768
1,347,960
456,490
-
21,704
(1,472,841,154)
(47,076,114)
(69,587,643)
(439,609,362)
(1,479,830)
(9,327,396)
(203,750,242)
(23,561,243)
(70,483)
(684,436,226)
5,059,368,139
51,615,039
13,780,042
(4,235,745,647)
-
(45,436,107)
(5,871,324)
837,710,142
(64,875,592)
883,636,402
2,660,595
821,421,405
61,749,514
38,097,480
(172,916,526)
4,140,957
(12,533,897)
(81,462,472)
981,402,765
46,479,679
11,794,987
40,458,546
266,728
981,307
13,585,210
(1,231,811,971)
(38,061,418)
(108,208,788)
(496,455,999)
(2,467,289)
-
-
-
(459,237)
(782,495,480)
3,713,584,274
16,082,320
-
(3,131,428,178)
(6,282,890)
(36,511,297)
(2,128,273)
553,315,956
(310,641,996)
1,192,243,877
2,034,521
883,636,402
(in thousands of Korean won) Notes 2011 2010
Separate Statements of Cash FlowsYears Ended December 31, 2011 and 2010
Consolidated Statements of Cash FlowsYears Ended December 31, 2011 and 2010
(in thousands of Korean won) Notes 2011 2010
Cash flows from operating activities
Cash generated from operations
Interest received
Interest paid
Dividends received
Income tax paid
Net cash generated from operating activities
Cash flows from investing activities
Decrease in financial deposits
Decrease in other receivables
Decrease in other financial assets
Proceeds from disposal of property, plant and equipment
Proceeds from disposal of intangible assets
Proceeds from disposal of investments in
subsidiaries, joint ventures and associates
Decrease in other assets
Increase in financial deposits
Increase in other receivables
Increase in other financial assets
Purchases of property, plant and equipment
Purchases of intangible assets
Acquisition of investments in
subsidiaries, joint ventures and associates
Increase in other assets
Net cash used in investing activities
Cash flows from financing activities
Proceeds from borrowings
Repayments of borrowings
Purchase of treasury shares
Dividends paid
Net cash provided by financing activities
Net increase(decrease) in cash and cash equivalents
Cash and cash equivalents at beginning of year
Cash and cash equivalents at the end of year
34
5
5
86,199,649
26,176,545
(142,133,036)
6,717,535
(52,888,937)
(75,928,244)
1,400,593,998
1,146,628
106,205
663,997
318,182
76,007,682
314,062
(1,439,814,488)
(734,127)
(1,138,795)
(274,069,490)
(495,670)
(214,595,117)
(705,601)
(452,402,534)
2,529,349,715
(1,890,389,691)
-
(45,436,107)
593,523,917
65,193,139
598,114,510
663,307,649
310,736,399
28,170,323
(109,899,145)
3,582,143
362,437
232,952,157
916,863,848
4,423,968
127,635
10,357,229
130,000
-
14,686,686
(1,159,939,914)
(4,433,488)
(168,540)
(441,248,863)
(1,471,242)
(144,209,947)
(2,633,390)
(807,510,018)
1,746,897,838
(1,479,483,042)
(6,282,890)
(36,511,296)
224,620,610
(349,937,251)
948,051,761
598,114,510
The accompanying notes are an integral part of these separate financial statements. The accompanying notes are an integral part of these separate financial statements.

The More Value32
2011 ANNUAL REPORT
DONGKUK STEEL 33
Notes to the Separate Financial StatementsDecember 31, 2011 and 2010, and January 1, 2010
15.39
10.21
14.88
57.51
97.99
2.01
100.00
Percentage ofownership(%)
1. General information
DONGKUK STEEL MILL CO., LTD. (the “Company”) was incorporated on July 7, 1954, under the Commercial Code of the Republic of Korea
to engage in manufacturing and marketing of steel plates, reformed bars and H-beams. The Company’s head office is located in Suha-dong,
Jung-gu, Seoul, and its main manufacturing facilities are located in Incheon, Pohang, Busan, and Dangjin in the Republic of Korea. In addition,
the Company has invested in Union Steel Co., Ltd., Intergis Co., Ltd., Donkuk Int’l Inc, Dongkuk Corp, Union Coating Co., Ltd., DKUIL and
several local and international companies.
The Company’s shares were listed on the Korea Exchange in April 1988. As of December 31, 2011, the Company has outstanding capital
stock amounting to \421,186 million, including preferred stock of \36,781 million. The Company’s shareholders and their respective ownership
as of December 31, 2011, are as follows:
9,512,765
6,314,398
9,199,317
35,552,298
60,578,778
1,245,512
61,824,290
Sae Joo Chang
Sae Wook Chang
JFE Steel
Others
Treasury stock
Number ofshares
2. Summary of significant accounting policies
The principal accounting policies applied in the preparation of these consolidated financial statements are set out below. These policies have
been consistently applied to all the periods presented, unless otherwise stated
2.1 Basis of Preparation
The Company maintains its accounting records in Korean won and prepares statutory financial statements in the Korean language (Hangul)
in conformity with the International Financial Reporting Standards as adopted by the Republic of Korea (“Korean-IFRS”). The accompanying
financial statements have been condensed, restructured and translated into English from the Korean language financial statements.
The Company’s financial statements for the annual period beginning on January 1, 2011, have been prepared in accordance with Korean-IFRS.
These are the standards, subsequent amendments and related interpretations issued by the International Accounting Standards Board (“IASB”)
that have been adopted by the Republic of Korea.
The financial statements of the Company were prepared in accordance with Korean-IFRS and are subject to Korean-IFRS1101, ‘First-time
Adoption of Korean-IFRS’. The transition date, according to Korean-IFRS1101, from the previous accounting principles generally accepted in
the Republic of Korea (“Previous K-GAAP”) to Korean-IFRS is January 1, 2010. Reconciliations and descriptions of the effect of the transition
from previous K-GAAP to Korean-IFRS on the Company’s equity, comprehensive income and cash flows are described in Note 39.
The preparation of financial statements requires the use of certain critical accounting estimates. It also requires management to exercise
judgment in the process of applying the Company’s accounting policies. The areas involving a higher degree of judgment or complexity, or
areas where assumptions and estimates are significant to the financial statements are disclosed in Note 3.
3. Critical Accounting Estimates and Judgments
The Company makes estimates and assumptions concerning the future. The resulting accounting estimates will, by definition, seldom equal
the related actual results. Estimations and assumptions are continuously evaluated with consideration to factors such as events reasonably
predictable in the foreseeable future within the present circumstance according to historical experience. The estimates and assumptions
that have a significant risk of causing a material adjustment to the carrying amounts of assets and liabilities within the next financial year are
addressed below.
(1) Income taxes
The Company recorded, based on its best estimate, current taxes and deferred taxes that the Company will be liable in the future for the
operating results as of the financial year end. However, the final tax outcome in the future may be different from the amounts that were initially
recorded. Such differences will impact the current and deferred income tax assets and liabilities in the period in which such determination is
made.
(2) Fair value of financial instruments
The fair value of financial instruments that are not traded in an active market is determined by using valuation techniques. The Company uses
its judgment to select a variety of methods and make assumptions that are mainly based on market conditions existing at the end of each
reporting period.
(3) Provisions
As described in Note 18, the Company recognizes provisions for litigations as of the reporting date. The amounts are estimated based on
historical data.
(4) Defined benefit liability
The present value of the defined benefit liability depends on a number of factors that are determined on an actuarial basis using a number
of assumptions. The assumptions used in determining the net cost (income) for pensions include the discount rate. Any changes in these
assumptions will impact the carrying amount of the defined benefit liability. The Company determines the appropriate discount rate at the end
of each year. This is the interest rate that is used to determine the present value of estimated future cash outflows expected to be required
to settle the defined benefit liability. In determining the appropriate discount rate, the Company considers the interest rates of high-quality
corporate bonds that are denominated in the currency in which the pension benefits will be paid, and that have terms to maturity approximating
to the terms of the related pension liability. Other key assumptions for defined benefit liability are based in part on current market conditions.
Additional information is disclosed in Note 17.

The More Value34
2011 ANNUAL REPORT
DONGKUK STEEL 35
4. Financial Instruments by Category
Income and loss of financial instruments by category for the years ended December 31, 2011 and 2010, are as follows:
5. Cash and Cash Equivalents
Cash and Cash Equivalents
The cash and cash equivalents in consolidated statements of financial position equal to cash in consolidated statements of cash flows.
Financial deposits
The following amounts of financial deposits are restricted in connection with maintaining checking accounts as of December 31, 2011
and 2010, and January 1, 2010, are as follows:
(in millions of Korean won)
(in millions of Korean won)
(in millions of Korean won)
2011
2010.12.31
2010.12.31
2011.12.31
2011.12.31
2010
2010.1.1
2010.1.1
Available-for-sale financial assets
Gain(Loss) on valuation(Other comprehensive income(loss))
Dividend income
Loans and receivables
Interest income
Gain(Loss) on foreign exchange
Bad debt expense
Held-to-maturity financial assets
Interest income
Derivative financial instruments
Gain(Loss) on valuation (Other comprehensive income(loss))
Gain(Loss) on valuation/disposal (Profit or loss)
Financial liabilities measured at amortized cost
Interest expense
Gain(Loss) on foreign exchange
Cash on hand
Bank deposits and other
Total
Restricted financial deposits
(37,833)
2,962
26,720
(2,375)
-
141
23
-
143,115
(31,721)
1
598,114
598,115
191
1
663,307
663,308
30
(28,015)
2,962
31,179
(2,727)
(5,903)
129
(353)
633
122,240
26,127
1
948,501
948,502
191
6. Trade and Other Receivables
The aging analysis of trade and other receivables as of December 31, 2011 and 2010, and January 1, 2010, is as follows:
(in millions of Korean won)
(in millions of Korean won)
Other receivables (non-current)
Other receivables (non-current)
Other receivables (current)
Other receivables (current)
Trade receivables
Trade receivables
Receivables not past due
Past due but not impaired¹
Less than 3 months
3 to 6 months
6 to 12 months
Over 12 months
Impaired
Less than 3 months
1,672
1,672
-
-
-
-
-
-
-
1,672
4,330
4,330
-
-
-
-
-
-
-
4,330
761,787
761,787
82,664
5,618
579
3,237
92,098
-
-
853,885
2011.12.31
Receivables not past due
Past due but not impaired¹
Less than 3 months
3 to 6 months
6 to 12 months
Over 12 months
Impaired
Less than 3 months
1,273
1,273
-
-
-
-
-
-
-
1,273
13,361
13,361
-
-
-
-
-
-
-
13,361
759,198
759,198
37,542
1,552
-
3,205
42,209
-
-
801,497
2010.12.31
(in millions of Korean won) Other receivables (non-current)
Other receivables (current)
Trade receivables
Receivables not past due
Past due but not impaired¹
Less than 3 months
3 to 6 months
6 to 12 months
Over 12 months
Impaired
Less than 3 months
9,512
9,512
-
-
-
-
-
-
-
9,512
17,411
17,411
-
-
-
-
-
5,903
5,903
23,314
546,689
546,689
103,244
55
1
3,574
106,874
-
-
653,563
2010.1.1
1 Trade receivables past due but not impaired relate to a number of independent who has no recent history of default.

The More Value36
2011 ANNUAL REPORT
DONGKUK STEEL 37
The details of other financial assets and liabilities as of December 31, 2011 and 2010, and January 1, 2010, are as follows:
¹ Other financial liabilities are included in other liabilities of the financial position (Note 19).
7. Other financial assets and liabilities
(in millions of Korean won) 2011.12.31 2010.12.31 2010.1.1
Other financial assets
Financial assets at fair value through profit or loss
Available-for-sale financial assets
Held-to-maturity financial assets
Derivatives
Less: current
Other financial liabilities¹
Derivatives
Financial guarantee liabilities
Less: current
-
120,094
5,343
-
125,437
(4,294)
121,143
-
495
495
(495)
-
40,091
170,058
4,311
-
214,460
(44,063)
170,397
31
472
503
(503)
-
-
205,975
4,269
423
210,667
(4,097)
206,570
-
413
413
(413)
-
The details of inventories as of December 31, 2011 and 2010, and January 1, 2010, are as follows:
The cost of inventories recognised as expense and included in ‘cost of sales’ amounted to ₩4,702,666 million (2010: ₩4,145,892 million) including ‘losses
on valuation of inventories’ of ₩7,360 million and ‘reversal of allowance for losses on valuation of inventories’ was not incurred (2010: ₩1,728 million).
8. Inventories
December 31, 2011December 31, 2010December 31, 2011
(in millions of Korean won) Original amount
Original amount
Original amount
9
140,816
89,960
211,455
58,887
304,650
9,920
815,697
562
188,752
148,103
335,408
63,258
474,844
11,356
1,222,283
5
205,220
233,948
447,639
67,291
433,311
5,519
1,392,933
Merchandise
Finished products
Semi-finished products
Raw materials
Supplies
Materials-in-transit
Others
Total
Carrying amount
Carrying amount
Carrying amount
9
139,088
89,960
211,455
58,887
304,650
9,920
813,969
562
188,752
148,103
335,408
63,258
474,844
11,356
1,222,283
5
201,109
231,454
446,884
67,291
433,311
5,519
1,385,573
Valuation allowance
Valuation allowance
Valuation allowance
-
(1,728)
-
-
-
-
-
(1,728)
-
-
-
-
-
-
-
-
-
(4,111)
(2,494)
(755)
-
-
-
(7,360)
The details of other current and non-current assets as of December 31, 2011 and 2010, and January 1, 2010, are as follows:
9. Other assets
(in millions of Korean won) 2011.12.31 2010.12.31 2010.1.1
Current
Advances to suppliers
Prepaid expenses
Prepaid value added tax
Prepaid income taxes
Non-current
Long-term prepaid expenses
Others
7,449
6,747
3,561
22,912
40,669
68
967
1,035
41,704
6,282
5,702
25,206
4,254
41,504
74
967
1,041
42,545
11,423
8,263
8,779
4,655
33,120
70
10,516
10,586
43,706
2011.12.31
2010.12.31
2010.1.1
(in millions of Korean won)
(in millions of Korean won)
(in millions of Korean won)
Acquisition costAccumulated depreciationGovernment grantsNet book amount
Acquisition costAccumulated depreciationGovernment grantsNet book amount
Acquisition costAccumulated depreciationGovernment grantsNet book amount
Total
Total
Total
Financial Lease (Ship)
Financial Lease (Ship)
Financial Lease (Ship)
Construction –in–
progress
Construction –in–
progress
Construction –in–
progress
Machinery and
equipment
Machinery and
equipment
Machinery and
equipment
Buildings
Buildings
Buildings
Others
Others
Others
Structures
Structures
Structures
Land
Land
Land
686,196--
686,196
719,533 --
719,533
752,175--
752,175
500,508(107,560)
-392,948
503,106 (95,049)
- 408,057
332,498(85,190)
- 247,308
140,161(25,633)
-114,528
132,873 (21,424)
- 111,449
56,022(18,241)
-37,781
2,716,569(1,221,347)
(248)1,494,974
2,483,811 (1,086,920)
(273) 1,396,618
1,638,836(991,687)
(299)646,850
116,697(12,326)
-104,371
116,697 (3,571)
-113,126
----
77,051(31,013)
-104,371
75,614 (24,460)
- 51,154
46,355(30,249)
-16,106
227,656--
227,656
267,990 - -
267,990
1,099,503--
1,099,503
4,464,802(1,397,879)
(248)3,066,675
4,299,624 (1,231,424)
(273) 3,067,927
3,925,389(1,125,367)
(299)2,799,723
The details of property, plant and equipment as of December 31, 2011 and 2010, and January 1, 2010, are as follows:
10. Property, plant and equipment
Changes in the carrying amounts of property, plant and equipment for the years ended December 31, 2011 and 2010,are as follows:
2011
2010
(in millions of Korean won)
(in millions of Korean won)
BeginningAcquisitionsTransfer-in(out)DisposalsDepreciationEnding
BeginningAcquisitionsTransfer-in(out)DisposalsDepreciationEnding
Total
Total
Financial Lease (Ship)
Financial Lease (Ship)
Construction –in–
progress
Construction –in–
progress
Machinery and
equipment
Machinery and
equipment
Buildings
Buildings
Others
Others
Structures
Structures
Land
Land
719,943-
(33,337)--
686,196
752,17556
(28,746)(3,952)
-719,533
408,05712
(1,906)(479)
(12,736)392,948
247,308 17
172,598 (528)
(11,338)408,057
111,449279
8,275 (356)
(5,119)114,528
37,781 19
77,661 (234)
(3,778) 111,449
1,396,618 14,569
255,457 (8,421)
(163,249) 1,494,974
646,850 14,063
891,105 (19,693)
(135,707) 1,396,618
113,126 ---
(8,755)104,371
- 116,697
--
(3,571) 113,126
51,1541,2936,153
(27)(12,571) 46,002
16,1064,938
40,898(459)
(10,329) 51,154
267,990 257,916
(298,250)--
227,656
1,099,503422,156
(1,253,669)--
267,990
3,067,927 274,069 (63,608)(9,283)
(202,430)3,066,675
2,799,723 557,946
(100,153)(24,866)
(164,723)3,067,927

The More Value38
2011 ANNUAL REPORT
DONGKUK STEEL 39
Depreciation of property, plant and equipment was classified for the years ended December 31, 2011 and 2010, as follows:
During the year, the Company has capitalized borrowing costs amounting to ₩ 1,746 million (2010: ₩ 29,427 million) on qualifying assets. Borrowing
costs were capitalized at the weighted average rate of its general borrowings of 5.78% (2010: 5.15%)
As of December 31, 2011, certain property, plant and equipment have been pledged as collaterals for certain bank loans for up to a maximum of ₩
1,593,774 million (December 31, 2010: ₩ 1,412,005 million)(Note 14).
As of December 31, 2011, inventories, property, plant and equipment are insured against fire with Meritz Insurance Co., Ltd. for up to ₩ 3,907,225
million (2010: ₩ 3,322,209 million). In addition, the Company carries general loss and comprehensive liability insurance on its vehicles and products.
(in millions of Korean won) 2011 2010
Cost of sales
Selling, general and administrative expenses
Research and development expenses
192,835
6,990
2,605
202,430
156,414
5,789
2,520
164,723
The details of intangible assets as of December 31, 2011 and 2010, and January 1, 2010, are as follows:
11. Intangible Assets
(in millions of Korean won)
(in millions of Korean won)
(in millions of Korean won)
Software
Software
Software
Other Intangible Assets
Other Intangible Assets
Other Intangible Assets
2011.12.31
2010.12.31
2010.1.1
Total
Total
Total
Acquisition cost
Accumulated depreciation and impairment
Government grants
Net book amount
Acquisition cost
Accumulated depreciation and impairment
Government grants
Net book amount
Acquisition cost
Accumulated depreciation and impairment
Government grants
Net book amount
34,243
(32,088)
-
2,155
34,243
(25,239)
-
9,004
32,642
(18,497)
-
14,145
70,132
(1,995)
(13,439)
54,698
78,950
(8,819)
(13,754)
56,377
73,565
(6,801)
(14,070)
52,694
104,375
(34,083)
(13,439)
56,853
113,193
(34,058)
(13,754)
65,381
106,207
(25,298)
(14,070)
66,839
Changes in the carrying amounts of intangible assets in the years ended December 31, 2011 and 2010, are as follows:
(in millions of Korean won)
(in millions of Korean won)
Software
Software
Other Intangible Assets
Other Intangible Assets
2011
2010
Total
Total
Beginning
Acquisition / Transfer
Disposal and others
Amortization
Ending
Beginning
Acquisition / Transfer
Disposal and others
Amortization
Ending
9,004
-
-
(6,849)
2,155
14,145
1,601
-
(6,742)
9,004
56,377
496
(393)
(1,782)
54,698
52,694
5,751
(130)
(1,938)
56,377
65,381
496
(393)
(8,631)
56,853
66,839
7,352
(130)
(8,680)
(65,381)
Amortization of intangible assets was classified for the years ended December 31, 2011 and 2010, as follows:
The details of significant intangible assets are as follows:
¹ The units of production method is used for depreciation.
² Book value is net of related government grants.
(in millions of Korean won)
(in millions of Korean won)
2011
2011.12.31Description
2010
Residual useful lives
Cost of sales
Selling, general and administrative expenses
5,018
3,613
8,631
599
1,547
27,018
3,923
28,328
Software
Other
Intangible
Assets
ERP
MES
Right to use Pohang Hoahn Wharf
Right to use Dangjin Wharf
Right to use Incheon North Port Wharf ²
5,067
3,613
8,680
1 year
1 year
¹
¹
42 years
Changes in investments in subsidiaries, joint ventures and associates for the years ended December 31, 2011 and 2010, are as follows:
12. Investments in Subsidiaries, Joint Ventures and Associates
(in millions of Korean won) 2011 2010
Beginning balance
Acquisitions / Transfer in
Disposals
Impairment loss
Ending balance
787,785
226,341
(78,653)
-
935,473
654,756
144,210
-
(11,181)
787,785

The More Value40
2011 ANNUAL REPORT
DONGKUK STEEL 41
The details of investments in subsidiaries, joint ventures and associates as of December 31, 2011 and 2010, and January 1, 2010,are as follows:
(in millions of Korean won) 2011.12.31 2010.12.31 2010.1.1
Subsidiaries
Joint ventures and associates
660,752
274,721
935,473
746,803
40,982
787,785
602,594
52,162
654,756
The details of investments in subsidiaries as of December 31, 2011 and 2010, and January 1, 2010, are as follows:
¹ The Company acquired additional 3.41% of interest in Intergis Co., Ltd. (acquisition cost: ₩4,354 million) during the year ended December 31, 2011.
And Intergis Co., Ltd.’s shares were listed on the Korea Exchange during the year ended December 31, 2011. The ownership interest in Intergis Co., Ltd.
decreased by 35.82% due to shares listed in public and disposal of Intergis Co., Ltd. interests (book value: ₩13,995 million). In addition, Union Steel Co.,
Ltd. has 10.23% interest in Intergis Co., Ltd.
² Union Steel Co., Ltd. and Intergis Co., Ltd. have 70.94% and 1.46% interests, respectively, in Union Coating Co., Ltd..
³ The Company lost control over CSP and classified the investment as an associate since CSP increased its capital stock by issuing new stocks to the third
party only for the year ended December 31, 2011.
4 Dangjin Kodae-port Operating Company Ltd. which was established during the period, became new subsidiaries since the Company has de facto control
due to the acquisition of more than one-half of common shares with voting rights.
5 Reclassified from an associate to a subsidiary since the Company acquired control over DK UNC Co., Ltd. due to additional 51.9% acquisition of DK UNC
Co., Ltd.(acquisition cost: ₩10,738 million) for the year ended December 31, 2011.
(in millions of Korean won)
Union Steel Co., Ltd.
Intergis Co., Ltd.¹
Dong Kuk Int’l Inc.
Dong Kuk Corporation
Union Coating Co., Ltd.²
Ilsin U&Venture Capital
CSP Co., Ltd.³
Ferrum Infra Co., Ltd.
Dangjin Kodae-port
Operating Company., Ltd.
Meritz 2Star Private equity
security KISE-7
Meritz 2Star Private equity
security SEPO-12
Hi Private Securities
Investment trust 3-18
Hi Private Securities
Investment trust 3-19
Heungkuk Safe Private
Securities Investment trust
92 bond
DKUNC Co., Ltd.
4
5
2011.12.31 2010.12.31LocationPercentage of ownership (%) 2010.1.1
455,995
70,712
19,673
15,784
10,815
6,917
-
59,580
550
-
9,988
-
-
-
10,738
660,752
Korea
Korea
U.S.A.
Japan
Korea
Korea
Brazil
Korea
Korea
Korea
Korea
Korea
Korea
Korea
Korea
455,995
80,353
19,673
15,784
10,815
11,139
23,041
59,580
-
10,435
9,988
20,000
20,000
10,000
-
746,803
65.11
43.84
64.27
51.08
27.60
73.33
-
98.55
55.00
-
100.00
-
-
-
51.90
455,995
80,353
19,673
15,784
10,815
11,139
8,435
400
-
-
-
-
-
-
-
602,594
The details of investments in joint ventures and associates as of December 31, 2011 and 2010, and January 1, 2010, are as follows:
¹ Although Intergis Co., Ltd. owns 5.0% and the Company holds less than 20% of the equity shares of investee, the Company exercises significant influence and
hence applied equity method as material transactions exist between the Company and investee, and the Company exercise significant influence.
² Prior to the year ended December 31, 2010, the Company recognized the impairment loss because the net realizable value of investments in IC&IG Holding
(NL) B.V. was below its net book value and was not expected to recover in the near future due to its continuous operating losses and accumulated deficit. In
addition, the liquidation of IC&IG Holding (NL) B.V. is completed for the year ended December 31, 2011.
³ Investment of DK AZTEC was classified as an associate due to the Company’s significant influence as the Company newly acquired the ordinary shares and
redeemable convertible preferred shares with voting right of DK AZTEC Inc. for the year ended December 31, 2011. In addition, all redeemable convertible
preferred shares were converted into ordinary shares for the year ended December 31, 2011.
(in millions of Korean won)
DK UIL Co., Ltd.
DK S& Co., Ltd.¹
IC&IG Holding(NL)²
DK AZTEC Inc.³
CSP Co.,Ltd.
2011.12.31 2010.12.31LocationPercentage of ownership (%)
2010.1.1
40,684
298
-
35,667
198,072
274,721
Korea
Korea
Netherland
Korea
Brazil
40,684
298
-
-
-
40,982
34.82
5.00
-
47.88
30.00
51,864
298
-
-
-
52,162
(in millions of Korean won)
(in millions of Korean won)
(in millions of Korean won)
Market price per share (in Korea won)
Market price per share (in Korea won)
Market price per share (in Korea won)
Number of shares held
Number of shares held
Number of shares held
Fair value
Fair value
Fair value
2011.12.31
2010.12.31
2010.1.1
Book value
Book value
Book value
Union Steel Co., Ltd.
Intergis Co., Ltd.
DK UIL Co., Ltd.
Union Steel Co., Ltd.
DK UIL Co., Ltd.
Union Steel Co., Ltd.
DK UIL Co., Ltd.
16,100
7,590
2,265
28,950
3,860
22,000
5,110
6,680,297
5,759,720
3,967,140
6,680,297
3,967,140
6,680,297
3,967,140
107,553
43,716
8,986
193,395
15,313
146,967
20,272
455,995
70,712
40,684
455,995
40,684
455,995
51,864
Fair values of marketable shares held by subsidiaries, joint ventures and associates as of December 31, 2011 and 2010, and January 1, 2010, are as follows:

The More Value42
2011 ANNUAL REPORT
DONGKUK STEEL 43
88,987
77,490
166,477
50,282
47,425
97,707
-
-
-
-
45,692
(747)
44,945
-
94,271
(747)
93,524
48,579
34,831
-
83,410
44,945
28,777
(2,193)
71,529
93,524
63,608
(2,193)
154,939
Changes in the carrying amounts of investment property for the years ended December 31, 2011 and 2010, are as follows:
Fair value of investment property as of December 31, 2011 and 2010, and January 1, 2010, is as follows:
The Company evaluates the fair value of investment property by using generally accepted method such as applying recent market price among independent
persons, reference to another transaction that is substantially the same and discounted cash flow analysis.
Rental income from investment property recognized in the income statement during the year ended December 31, 2011, is ₩12,344 million (2010:
₩3,154 million), and operating expenses related to investment property is ₩4,628 million (2010: ₩1,290 million).
13. Investment Property
(in millions of Korean won)
(in millions of Korean won)
(in millions of Korean won)
Land
Land
2011.12.31
Buildings
Buildings
2010.12.31
2011
2010
Total
Total
2010.1.1
Beginning balance
Acquisitions / Transfer-in
Depreciation
Ending balance
Beginning balance
Acquisitions / Transfer-in
Depreciation
Ending balance
Land
Buildings
-
48,579
-
48,579
The details of borrowings as of December 31,2011 and 2010, and January 1, 2010, are as follows:
¹ The details of borrowings as of December 31, 2011 and 2010, and January 1, 2010, are as follows:
14. Borrowings
(in millions of Korean won) 2011.12.31 2010.12.31 2010.1.1
Current Short-term borrowings¹
Current maturities long-term borrowings
Deventures
Finance lease liabilities (Note 36)
Non-current long-term borrowings
Deventures
Finance lease liabilities (Note 36)
1,049,079
118,249
334,536
10,700
1,512,564
485,905
1,082,421
95,550
1,663,876
3,176,440
752,345
118,239
363,829
11,839
1,246,252
504,154
648,382
104,943
1,257,479
2,503,731
368,162
43,851
549,849
2,628
964,490
498,302
665,433
-
1,163,735
2,128,225
Short-term borrowings
Long-term borrowings
(in millions of Korean won)
(in millions of Korean won)
Banker's Usance
General loans
Others
Loans for renting house
Loans for
facilities
Less: Current maturities
Creditor
Creditor
Latest maturity
date
Latest maturity
date
Annual interest rate(%)
2011.12.31
Annual interest rate(%)
2011.12.31
Korea Development Bank and Others
Korea Development Bank and Others
HANA Bank
Kookmin Bank
Korea Development Bank
2012.08.06
2012.10.13
-
2025.04.04
2018.07.27
1.03
4.65
-
300
5.16~8.28
2011.12.31
2011.12.31
2010.12.31
2010.12.31
Carrying amount
Carrying amount
2010.1.1
2010.1.1
731,293
300,000
17,786
1,049,079
1,881
602,273
604,154
(118,249)
485,905
720,712
-
31,633
752,345
1,938
620,454
622,393
(118,239)
504,154
338,522
10,000
19,640
368,162
1,985
540,168
542,153
(43,851)
498,302
Debentures
(in millions of Korean won)
Fixed interest rate Korean won debentures
70-2nd Non-guaranteed public bonds
74th public bonds
75st Non-guaranteed public bonds
76-1st Public bonds
76-2nd Public bonds
Variable interest rate foreign currency debentures
77st Foreign Non-guaranteed Privately placed bonds
78st Privately placed bonds
Less : Discounts on debentures
maturity date
interest rate(%) at
2011.12.31
2012.02.27
2013.03.15
2014.02.28
2014.09.23
2016.09.23
2012.10.21
2013.11.22
7.30
5.38
4.54
4.39
4.62
Libor(3 Months)
+3.30
Libor(3 Months)
+3.30
Total Current
2011.12.31
Non-current
300,000
350,000
300,000
250,000
70,000
34,599
115,330
1,419,929
(2,972)
1,416,957
300,000
-
-
-
-
34,599
-
334,599
(63)
334,536
-
350,000
300,000
250,000
70,000
-
115,330
1,085,330
(2,909)
1,082,421

The More Value44
2011 ANNUAL REPORT
DONGKUK STEEL 45
(in millions of Korean won)
Fixed interest rate Korean won debentures
70-1st public bonds
70-2nd Non-guaranteed public bonds
74st public bonds
Variable interest rate korean won debentu-res
71st privately placed bonds
Variable interest rate foreign currency debentures
73-1st Foreign guaranteed Privately placed bonds
73-2nd Foreign guaranteed Privately placed bonds
Less : Discounts on debentures
maturity date
interest rate(%)at
2010.12.31
2011.02.27
2012.02.27
2013.03.15
2011.02.27
2011.09.25
2011.09.25
6.90
7.30
5.38
CD(91days)
+3.50
LIBOR+4.45
LIBOR+4.45
Total Current
2010.12.31
Non-current
200,000
300,000
350,000
50,000
56,945
56,945
1,013,890
(1,679)
1,012,211
200,000
-
-
50,000
56,945
56,945
363,890
(61)
363,829
-
300,000
350,000
-
-
-
650,000
(1,618)
648,382
(in millions of Korean won)
Fixed interest rate Korean won debentures
69st Privately placed bonds
72-1st Privately placed bonds
65-2nd Non-guaranteed public bonds
66st Non-guaranteed public bonds
70-1st Non-guaranteed public bonds
70-2nd Non-guaranteed public bonds
Variable interest rate Korean won debentures
72-2nd Privately placed bonds
71st Privately placed bonds
73-1st Foreign guaranteed Privately placed bonds
73-2nd Foreign guaranteed Privately placed bonds
Less : Discounts on debentures
maturity date
interest rate(%)at2010.1.1
2010.01.23
2010.07.15
2010.01.17
2010.07.28
2011.02.27
2012.02.27
2010.07.15
2011.02.27
2011.09.25
2011.09.25
7.50
5.29
4.83
5.07
6.90
7.30
CD+2.11
CD+3.50
LIBOR+4.45
LIBOR+4.45
Total Current
2010.1.1
Non-current
100,000
100,000
100,000
200,000
200,000
300,000
50,000
50,000
58,380
58,380
1,216,760
(1,478)
1,215,282
100,000
100,000
100,000
200,000
-
-
50,000
-
-
-
550,000
(151)
549,849
-
-
-
-
200,000
300,000
-
50,000
58,380
58,380
666,760
(1,327)
665,433
Carrying amount and fair value of non-current borrowings as of December 31, 2011 and 2010, and January 1, 2010, are as follows:
¹ The fair values is based on the cash flow discounted using the corporate bonds and others rate in the same credit grade with the Company, and no
significant difference exists between the fair value and carrying amount of current borrowings.
2010.1.12010.12.312011.12.31
Carrying amount
Carrying amount
Carrying amount
(in millions of Korean won)
Long-term borrowings
Debentures
Finance lease liability
498,302
665,433
-
1,163,735
504,154
648,382
104,943
1,257,479
485,905
1,082,421
95,550
1,663,876
Fair value¹Fair value¹Fair value¹
524,189
666,715
-
1,190,904
528,010
655,048
90,901
1,273,959
508,488
1,088,851
84,257
1,681,596
The payment schedule of borrowing as of the year ended December 31, 2011, is as follows:
Less than(in millions of Korean won)
Short-term borrowings
Current maturities of Long-term borrowings
Current maturities of Deventures
Long-term borrowings
Deventures
-
-
-
322,460
550,000
872,460
1,049,079
118,249
334,599
-
-
1,501,927
Over
5year2 year 5 year1 yearTotal
-
-
-
45,185
70,000
115,185
-
-
-
118,260
465,330
583,590
1,049,079
118,249
334,599
485,905
1,085,330
3,073,162
The analysis of deferred tax assets and deferred tax liabilities as of December 31, 2011 and 2010, and January 1, 2010, is as follows:
15. Trade Payables and Other payables
16. Deferred Income Tax
(in millions of Korean won)
(in millions of Korean won)
2011.12.31
2011.12.31
2010.12.31
2010.12.31
2010.1.1
2010.1.1
Current
Trade payables
Non-trade payables
Accrued expenses
Dividend payable
Deposits received
Non-current
Deposits received
Non-trade payables
Deferred tax assets
Deferred tax asset to be recovered within 12 months
Deferred tax asset to be recovered after more than 12 months
Deferred tax liabilities
Deferred tax liability to be recovered after more than 12 months
Deferred tax liability to be recovered after more than 12 months
Deferred tax assets(liabilities),net
1,641,785
1,641,785
85,587
42,964
6
90
128,647
14,091
-
14,091
1,784,523
14,239
92,085
106,324
(552)
(151,553)
(152,105)
(45,781)
1,813,398
1,813,398
65,431
44,918
8
90
110,447
10,076
-
10,076
1,933,921
32,840
80,736
113,576
(12,655)
(140,726)
(153,381)
(39,805)
1,380,025
1,380,025
75,609
36,679
7
90
112,385
3,605
4,227
7,832
1,500,242
55,810
95,400
151,210
(17,812)
(140,656)
(158,468)
(7,258)

The More Value46
2011 ANNUAL REPORT
DONGKUK STEEL 47
Defined benefit liability recognized on the statements of finance position as of December 31, 2011 and 2010, and January 1, 2010, is as follows:
17. Defined Benefit Liability
(in millions of Korean won) 2011.12.31
2011.12.31
2010.12.31
2010.12.31
2010.1.1
2010.1.1
Present value of funded defined benefit liability
Fair value of plan assets
Liability on the statement of financial position
82,576
(61,796)
20,780
78,197
(54,926)
23,271
69,278
(50,143)
19,135
The principal actuarial assumptions as of December 31, 2011 and 2010, and January 1, 2010, were as follows:
Discount rate (%)
Expected return on plan assets (%)
Future salary increases Office (%)
Production (%)
4.40
4.00
4.50
4.00
4.95
4.58
5.61
5.65
5.77
4.23
5.00
5.22
(in millions of Korean won) 2011.12.31 2010.12.31 2010.1.1
Current
Unearned from customers
Withholding
Other financial liabilities(Notes 4 and 7)
9,366
4,637
495
14,498
10,294
5,178
503
15,975
21,698
3,094
413
25,205
Changes of provisions for the years ended December 31, 2011 and 2010, are as follows:
¹ Payments of compensation were confirmed and were provided, and the actual difference of payments of compensation and reserves for anticipated
litigation losses, which are \ 6,360 millions, were recognized as other operating income(miscellaneous gain) in the year ended December 31,2011.
18. Provisions
19. Other liabilities
2011
2010
(in millions of Korean won)
(in millions of Korean won)
Litigation losses
Litigation losses
Unused amounts reversed¹
Unused amounts reversed¹
Beginningbalance
Beginningbalance
Usedamounts
Usedamounts
Additional provisions adjustment
Additional provisions adjustment
Ending balance
Ending balance
30,101
-
-
30,101
(6,360)
-
(23,741)
-
-
30,101
The Company is authorized to issue 200,000,000 shares with a ₩5,000 par value per share, of which 76,881,000 ordinary shares and 7,356,160
preferred shares have been issued as of December 31, 2011.
The Company redeemed 7,356,160 shares of redeemable preferred shares from Kawasaki Steel Co., Ltd. for ₩36,563 million in 2003 and retired them
through an appropriation of retained earnings, as approved by the Board of Directors. As a result no outstanding redeemable preferred shares, remains
as of December 31, 2011.
In 2003, 2004 and 2006, the Company retired 10,000,000 treasury shares amounting to ₩40,855 million, 2,300,000 shares amounting to ₩22,420
million and 2,756,710 shares amounting to ₩13,523 million, respectively, through appropriation of retained earnings according to the resolutions of the
board of directors. As a result, capital stock amount as of December 31, 2011, is not equal to the total par value of the ordinary shares issued, which is
₩309,121 million
On June 1, 1998, the Company revalued its property, plant and equipment in accordance with Asset Revaluation Law. Revaluation gain amounted
to ₩340,328 million and was transferred to reserve for asset revaluation (other components of equity) after deduction of related taxes amounting to
₩7,078 million. On December 31, 1998, the reserve for asset revaluation of ₩35,100 million was converted to capital.
In 2006, the Company recognized a gain of ₩139,463 million from the disposal of 7,336,674 treasury shares and recorded ₩₩30,096 million, net of
related tax effect of ₩38,352 million, as other components of equity.
¹ The Commercial Code of the Republic of Korea requires the Company to appropriate, as a legal reserve, an amount equal to a minimum of 10% of
cash dividends paid until such reserve equals 50% of its issued capital stock. The reserve is not available for the payment of cash dividends, but may be
transferred to capital stock or used to reduce accumulated deficit, if any, with the ratification of the Company’s majority shareholders.
² These reserves may be distributed as dividends after the shareholders approval.
Changes in retained earnings for the years ended December 31, 2011 and 2010, are as follows:
(in millions of Korean won) 2011.12.31 2010.12.31 2010.1.1
Legal reserves¹
Discretionary reserves²
Reserve for business rationalization
Reserve for improvement of financial structure
Reserve for facilities
Severance indemnities for directors
Voluntary reserve
Unappropriated retained earnings
75,410
14,452
59,000
20,000
2,000
1,154,146
397,310
1,722,318
70,810
14,452
59,000
20,000
2,000
1,077,146
513,401
1,756,809
67,150
14,452
59,000
20,000
2,000
1,067,146
427,195
1,656,943
Retained earnings as of December 31, 2011 and 2010, and January 1, 2010, consist of:
21. Retained earnings
20. Paid-in Capital Stock
(in millions of Korean won) 2011 2010
Beginning balance
Profit(loss) for the year
Dividends
Actuarial gains and losses
Ending balance
1,756,809
10,952
(45,434)
(9)
1,722,318
1,656,943
138,715
(36,511)
(2,338)
1,756,809

The More Value48
2011 ANNUAL REPORT
DONGKUK STEEL 49
4,600
347,000
45,434
397,034
276
4,600
77,000
45,434
127,034
386,367
Appropriation of retained earnings
The statements of appropriation of retained earnings for the years ended December 31, 2011 and 2010, are as follows:
Appropriation of Retained Earnings
Years Ended December 31, 2011 and 2010
(Date of Appropriation: March 16, 2012 and March 11, 2011
for the years ended December 31, 2011 and 2010, respectively)
(in millions of Korean won) 20102011
Retained earnings before appropriation
Unappropriated retained earnings carried over from prior year
Changes in retained earnings of equity-method investees, net
Effects of Korean IFRS adoption
Actuarial gains and losses
Profit for the year
Appropriation of retained earnings
Legal reserve
Discretionary reserve
Dividends
Dividends(ratio) per share
Common stock :
₩750 (15%) in 2011
₩750 (15%) in 2010
Unappropriated retained earnings to be carried forward to subsequent year
841
(9,188)
385,371
(2,338)
138,715
513,401
386,367
-
-
(9)
10,952
397,310
Accumulated other comprehensive income as of December 31, 2011 and 2010, and January 1, 2010, consists of:
22. Accumulated other comprehensive income and other components of equity
(in millions of Korean won) 2011.12.31 2010.12.31 2010.1.1
Change in valuation of available-for-sale securities
Change in valuation of derivative financial assets
Total
(39,255)
-
(39,255)
(1,423)
(23)
(1,446)
26,592
330
26,922
Other components of equity as of December 31, 2011 and 2010, and January 1, 2010, are as follows:
¹ The Company has retained 1,245,512 shares of treasury shares (2010: 1,245,512 shares) as
of December 31, 2011. The Company intends to sell or retire the treasury shares in the future.
23. Revenue
(in millions of Korean won)
(in millions of Korean won)
2011.12.31 2010.12.31 2010.1.1
Treasury Shares¹
Revenue of merchandise
Others
21,472 21,472
2011
2011
2010
2010
5,788,475
120,924
5,909,399
5,209,489
61,887
5,271,376
15,189
24. Expenses by nature
25. Employee benefit expense
26. Selling, general and administrative expenses
(in millions of Korean won)
(in millions of Korean won)
(in millions of Korean won)
Changes in inventories
Purchase of Raw materials and merchandise
Employee benefit expense(Note 25)
Depreciation, amortization and depreciation
relating to investment property
Transportation expenses
Commission expenses and Service fees
Supplies expenses
Repairs expenses
Other expenses
Total¹
Wages and salaries
Welfare expenses
Post-employment benefits(Note 17)
Others
Wages and salariesPost-employment benefitsWelfare expensesTravel expenseTransportation expensesRental expensesSupplies expensesDepreciationAmortizationTaxes and duesEntertainment expensesInsurance expensesResearch & development expensesAdvertising expensesService feesTraining expensesExport expensesCommission expensesMiscellaneous expensesOthers
2011
2011
2010
2010
(93,347)
4,796,013
156,073
213,254
68,210
182,232
103,046
72,696
327,185
5,825,362
120,204
23,492
10,633
1,744
156,073
31,699 3,676 6,047 1,775
64,064 1,768 1,231 6,990 3,613 4,539 3,586 2,033 8,098 1,345
25,731 3,356
16,017 22,758
5,755 3,404
217,485
(114,167)
4,260,059
151,466
174,150
63,084
171,075
93,789
57,264
262,006
5,118,726
120,603
19,954
10,150
759
151,466
30,184 1,407 4,862 1,782
59,761 3,578 1,315 5,789 3,613 2,582 3,379 1,667 6,915 1,902
19,725 3,080
12,610 23,146
5,465 3,238
196,000
¹ Expenses that are recorded by nature as cost of sales, selling, general and administrative expenses and other operating expenses in the income statements.

The More Value50
2011 ANNUAL REPORT
DONGKUK STEEL 51
128,779
59,437
65,845
3,497
76,540
205,319
(1,746)
203,573
132,116
70,393
60,370
1,353
44,845
176,961
(29,427)
147,534
28. Other operating expenses
29. Financial Income
(in millions of Korean won)
(in millions of Korean won)
Interest expenses
Loss on foreign exchange
Loss on disposal of plant, property and equipment
Loss on disposal of intangible assets
Loss on disposal of investments in associates
Provision for anticipated litigation loss
Other bad debt expenses
Others
Interest income
Cash equivalents and financial deposits
Held-to-maturity financial assets
Dividend income
Gain on foreign exchange
Financial guarantee income
2011
2011
2010
2010
16,082
86,686
8,791
75
2,645
-
-
10,744
125,023
26,861
26,720
141
6,718
50,579
795
84,953
19,551
54,930
18,071
-
-
30,101
5,903
21,788
150,344
31,308
31,179
129
3,582
49,719
766
85,375
27. Other operating income
(in millions of Korean won)
Gain on foreign exchange
Gain on disposal of property, plant and equipment
Miscellaneous expenses
Gain on transactions of financial assets at fair value through profit or loss
Others
2011 2010
78,551
172
19,147
-
-
97,870
73,456
3,562
12,366
633
527
90,544
Under the former accounting standards, operating profit (loss) was calculated as gross profit net of selling, general and administrative expenses. Under
Korean-IFRS, selling, general and administrative expenses, and other operating profit (expenses) are deducted. Therefore, operating profit (loss) amount
differs between previous K-GAAP to Korean-IFRS by the amount of other operating income (expenses) (Note 27).
30. Financial Expenses
(in millions of Korean won)
Interest expense
Borrowings
Debentures
Finance lease liabilities
Loss on foreign exchange
Less: Amounts capitalized on qualifying assets
2011 2010
-
38
38
(4,939)
47,221
-
42,282
42,320
181,035
43,811
-
623
(7,775)
38
5,623
-
42,320
(in millions of Korean won)
(in millions of Korean won)
Current tax Current tax on profits for the year
Adjustments in respect of prior years
Total current tax
Deferred tax (Note 16) Origination and reversal of temporary differences
Changes in deferred income tax from tax loss
carryforwards, others
Impact of change in tax rate
Total deferred tax
Income tax expense
Profit before income tax
Tax expense based on applicable tax rate1
Tax effects of: Income not subject to tax
Expenses not deductible for tax purposes
Tax loss and credit carryforwards
Adjustment in respect of prior years
Others
Re-measurement of deferred tax – change in tax rate
Income tax expense
2011
2011
2010
2010
7,258
26,973
34,231
(5,431)
15,444
8,091
18,104
52,335
63,287
15,315
(1,558)
1,956
(6,815)
26,973
8,373
8,091
52,335
The details of income tax expense for the years ended December 31, 2011 and 2010, are as follows:
The reconciliation between profit before income tax and income tax expense for the years ended December 31, 2011 and 2010, are as follows:
During the year, as a result of the change in the Korean corporate tax rate that was substantively enacted on December 31, 2011, the relevant deferred tax
balances have been re-measured.
31. Income tax expense
138,715,359,554
60,619,819
2,288
60,853,778 (233,959)
60,619,819
(in Korean won)
Profit attributable to equity holders of the Company
Weighted average number of ordinary shares in issue¹
Basic earnings per share
BeginningPurchase of treasury sharesWeighted average number of ordinary shares
2011
2011
2010
2010
10,952,032,304
60,578,778
181
60,578,778 -
60,578,778
Basic earnings per share is calculated by dividing the profit by the weighted average number of ordinary shares in issue during the year excluding ordinary shares purchased
by the Company and held as treasury shares. As there are no diluted securities outstanding, diluted earnings per share is identical to basic earnings per share.
¹ Weighted average number of ordinary shares for the years ended December 31, 2011 and 2010, is calculated as follows:
32. Earnings per Share
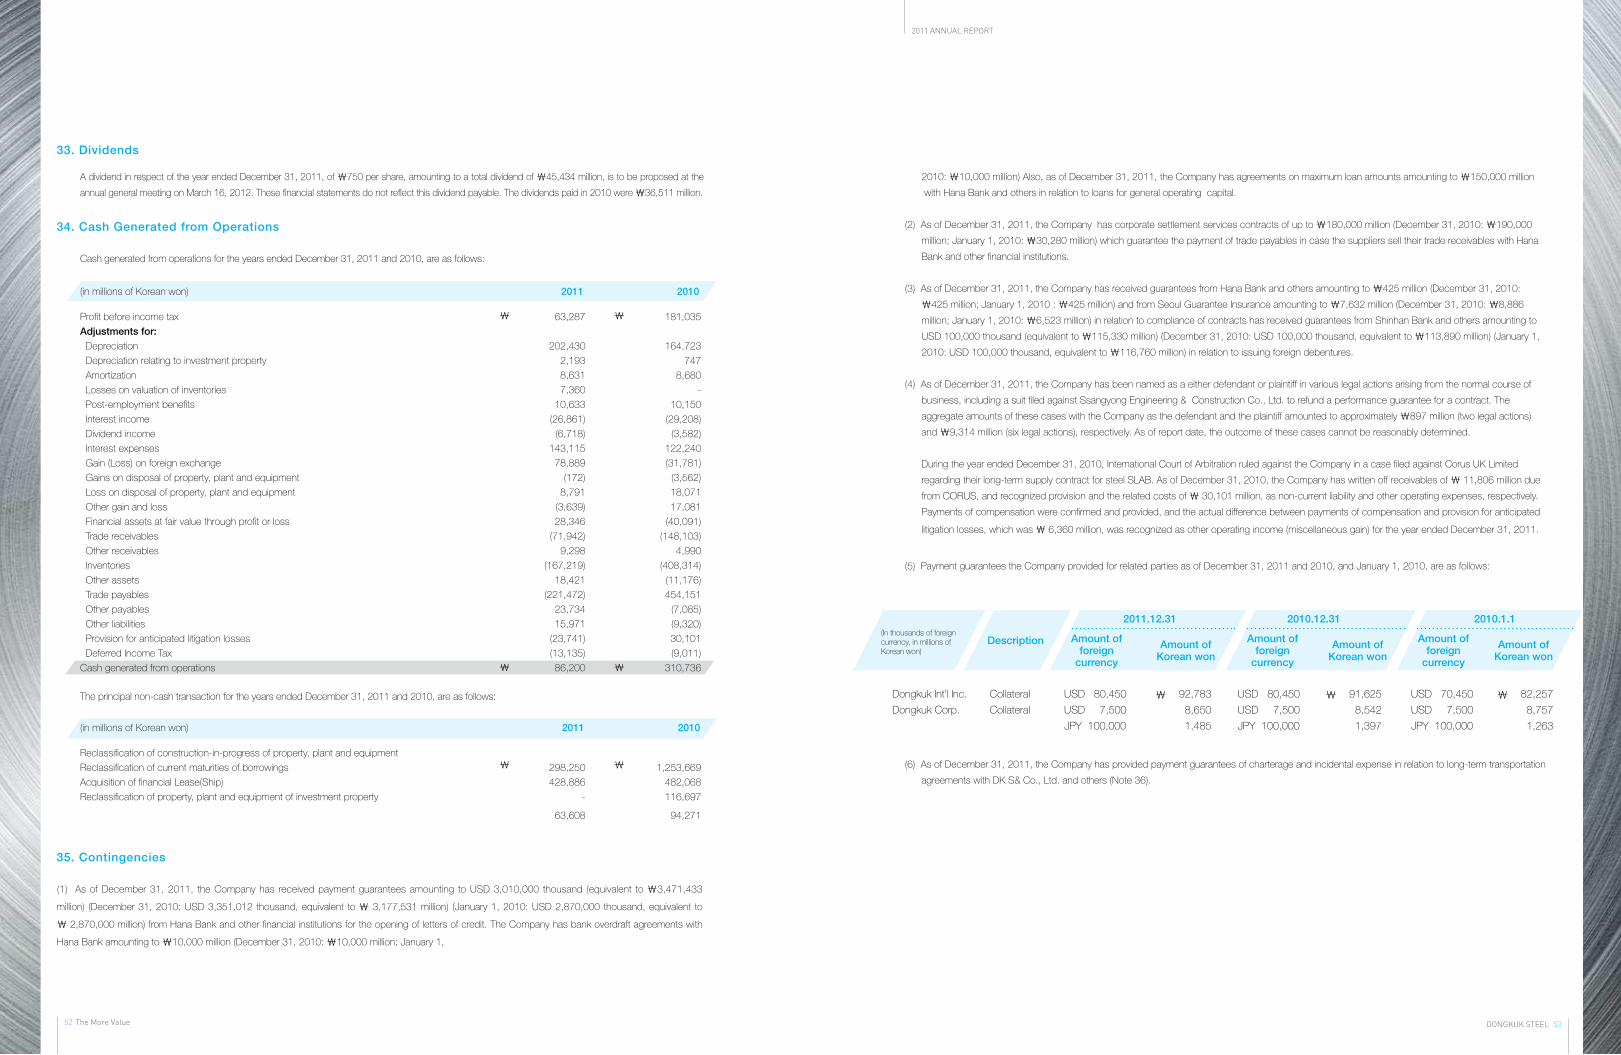
The More Value52
2011 ANNUAL REPORT
DONGKUK STEEL 53
A dividend in respect of the year ended December 31, 2011, of ₩750 per share, amounting to a total dividend of ₩45,434 million, is to be proposed at the
annual general meeting on March 16, 2012. These financial statements do not reflect this dividend payable. The dividends paid in 2010 were ₩36,511 million.
33. Dividends
34. Cash Generated from Operations
Cash generated from operations for the years ended December 31, 2011 and 2010, are as follows:
The principal non-cash transaction for the years ended December 31, 2011 and 2010, are as follows:
181,035
164,723
747
8,680
-
10,150
(29,208)
(3,582)
122,240
(31,781)
(3,562)
18,071
17,081
(40,091)
(148,103)
4,990
(408,314)
(11,176)
454,151
(7,085)
(9,320)
30,101
(9,011)
310,736
(in millions of Korean won)
Profit before income tax
Adjustments for: Depreciation
Depreciation relating to investment property
Amortization
Losses on valuation of inventories
Post-employment benefits
Interest income
Dividend income
Interest expenses
Gain (Loss) on foreign exchange
Gains on disposal of property, plant and equipment
Loss on disposal of property, plant and equipment
Other gain and loss
Financial assets at fair value through profit or loss
Trade receivables
Other receivables
Inventories
Other assets
Trade payables
Other payables
Other liabilities
Provision for anticipated litigation losses
Deferred Income Tax
Cash generated from operations
2011 2010
63,287
202,430
2,193
8,631
7,360
10,633
(26,861)
(6,718)
143,115
78,889
(172)
8,791
(3,639)
28,346
(71,942)
9,298
(167,219)
18,421
(221,472)
23,734
15,971
(23,741)
(13,135)
86,200
1,253,669
482,068
116,697
94,271
(in millions of Korean won)
Reclassification of construction-in-progress of property, plant and equipment
Reclassification of current maturities of borrowings
Acquisition of financial Lease(Ship)
Reclassification of property, plant and equipment of investment property
2011 2010
298,250
428,886
-
63,608
(1) As of December 31, 2011, the Company has received payment guarantees amounting to USD 3,010,000 thousand (equivalent to ₩3,471,433
million) (December 31, 2010: USD 3,351,012 thousand, equivalent to ₩ 3,177,531 million) (January 1, 2010: USD 2,870,000 thousand, equivalent to
₩ 2,870,000 million) from Hana Bank and other financial institutions for the opening of letters of credit. The Company has bank overdraft agreements with
Hana Bank amounting to ₩10,000 million (December 31, 2010: ₩10,000 million; January 1,
35. Contingencies
2010: ₩10,000 million) Also, as of December 31, 2011, the Company has agreements on maximum loan amounts amounting to ₩150,000 million
with Hana Bank and others in relation to loans for general operating capital.
(2) As of December 31, 2011, the Company has corporate settlement services contracts of up to ₩180,000 million (December 31, 2010: ₩190,000
million; January 1, 2010: ₩30,280 million) which guarantee the payment of trade payables in case the suppliers sell their trade receivables with Hana
Bank and other financial institutions.
(3) As of December 31, 2011, the Company has received guarantees from Hana Bank and others amounting to ₩425 million (December 31, 2010:
₩425 million; January 1, 2010 : ₩425 million) and from Seoul Guarantee Insurance amounting to ₩7,632 million (December 31, 2010: ₩8,886
million; January 1, 2010: ₩6,523 million) in relation to compliance of contracts has received guarantees from Shinhan Bank and others amounting to
USD 100,000 thousand (equivalent to ₩115,330 million) (December 31, 2010: USD 100,000 thousand, equivalent to ₩113,890 million) (January 1,
2010: USD 100,000 thousand, equivalent to ₩116,760 million) in relation to issuing foreign debentures.
(4) As of December 31, 2011, the Company has been named as a either defendant or plaintiff in various legal actions arising from the normal course of
business, including a suit filed against Ssangyong Engineering & Construction Co., Ltd. to refund a performance guarantee for a contract. The
aggregate amounts of these cases with the Company as the defendant and the plaintiff amounted to approximately ₩897 million (two legal actions)
and ₩9,314 million (six legal actions), respectively. As of report date, the outcome of these cases cannot be reasonably determined.
During the year ended December 31, 2010, International Court of Arbitration ruled against the Company in a case filed against Corus UK Limited
regarding their long-term supply contract for steel SLAB. As of December 31, 2010, the Company has written off receivables of ₩ 11,806 million due
from CORUS, and recognized provision and the related costs of ₩ 30,101 million, as non-current liability and other operating expenses, respectively.
Payments of compensation were confirmed and provided, and the actual difference between payments of compensation and provision for anticipated
litigation losses, which was ₩ 6,360 million, was recognized as other operating income (miscellaneous gain) for the year ended December 31, 2011.
(5) Payment guarantees the Company provided for related parties as of December 31, 2011 and 2010, and January 1, 2010, are as follows:
(6) As of December 31, 2011, the Company has provided payment guarantees of charterage and incidental expense in relation to long-term transportation
agreements with DK S& Co., Ltd. and others (Note 36).
2010.1.12010.12.312011.12.31
Description(In thousands of foreign currency, in millions of Korean won)
Collateral
Collateral
Dongkuk Int’l Inc.
Dongkuk Corp.
Amount of foreign
currency
Amount of Korean won
USD 80,450
USD 7,500
JPY 100,000
92,783
8,650
1,485
Amount of foreign
currency
Amount of Korean won
USD 80,450
USD 7,500
JPY 100,000
91,625
8,542
1,397
Amount of foreign
currency
Amount of Korean won
USD 70,450
USD 7,500
JPY 100,000
82,257
8,757
1,263

The More Value54
2011 ANNUAL REPORT
DONGKUK STEEL 55
(1) As of December 31, 2011, the Company has cross investment, technical assistance and license agreements with JFE Steel Corporation. According
to these agreements, the Company is required to hold the shares of JFE Holdings, Inc., amounting to ¥10,000 million. The Company purchased
1,000,000 shares of JFE Holdings, Inc., for ¥6,300 million (equivalent to ₩51,184 million). The remaining agreed shares are to be purchased through
mutual consent. Also, according to the agreement, the Company can withdraw the said investment in case the agreement is not fulfilled.
(2) As of December 31, 2011, the Company entered into strategic alliance contract with POSCO. Also the Company is holding the 588,000 shares of
POSCO Coated & Color Steel Co., Ltd., POSCO’s subsidiary (book value: ₩10,261 million), and the 62,000 shares of POSCO (book value: ₩23,560
million). Under the terms of agreements, the held shares have sale restrictions.
(3) As of December 31, 2011, the Company has entered into long-term procurement agreements with ArcelorMittal and other many suppliers for securing
stable procurement of high quality raw materials and competitive costs.
(4) As of the end of the reporting period, the Company has an agreement that grants the Company the right to acquire additional shares of CSP, an
associate, and VALE S.A., the largest shareholder of CSP(up to 25% of the total shares owned by the largest shareholder).
(5) As of December 31, 2011, the Company utilizes IT equipment through sales and lease back offered by HP Financial Service Ltd. The future minimum
lease payments are as follows:
36. Commitments
(in millions of Korean won) Principal Interest Minimum lease payment
Less than 1 year
Less: Current maturities¹
Finance lease liabilities¹
1,448
(1,448)
-
30 1,478
¹ Included in borrowings in financial statements (Note 14).
3,115
2,796
2,454
1,980
8,239
18,584
As of December 31, 2011, the book value of financial Lease asset is ₩1,963 million and the depreciation expense recognized for the year is ₩3,017 million.
(6) As of December 31, 2011, the Company has long-term transportation agreements with the Associates, DK S& Co., Ltd. in order to guarantee the
stable transportation of finished products and semi-finished products.
As of December 31, 2011, the future minimum lease payments are as follows:
(in millions of Korean won) Principal InterestMinimum lease
payment
Less than 1 year
1 to 2 years
2 to 3 years
3 to 4 years
Over 5 years
Less: Current maturities¹
Finance lease liabilities¹
9,252
9,352
11,803
8,344
66,051
104,802
(9,252)
95,550
12,367
12,148
14,257
10,324
74,290
123,386
¹ Included in borrowings in financial statements (Note 14)
(7) Expenditures contracted for acquiring property, plant and equipment, but not yet incurred as of December 31,
2011 and 2010, are as follows:
As of December 31, 2011, book value and recognized depreciation of financial lease assets are ₩ 104,371 million and ₩ 8,755 million,
respectively, and the Company provides ship financial lease assets as a collateral in connection with borrowings for the legal owner of lease
assets.
Also, in relation to the agreement, the Company guarantees the payment of charterage of USD 67,499 thousand (equivalent to ₩ 77,846
million), and other incidental expenses.
40,618
(in millions of Korean won)
Property, plant and equipment
2011.12.31 2010.12.31
115,040
37. Related Parties
The Company’s subsidiaries in the year ended December 31, 2011, are as follows:
The Company’s associates are DK UIL Co., Ltd. and DK S& Co., Ltd. and others. In addition, other related parties is BGCT and others as of
December 31, 2011.
Subsidiaries Major operations
Union Steel Co., Ltd.
Wuxi Chang-jiang Steel Metal Co., Ltd.
Union Steel China Co.,Ltd.
Union Steel Mexico Co.,Ltd.
USI SERVICE CENTER
UNIONSTEEL PROCESSING CENTER
Intergis Co.,Ltd.¹
Union Logistics Jiangyin Co.,Ltd.
DK LC
Intergis Logistic Center Co.,Ltd.
Ilsin U&Venture Capital
Ferrum Infra Co., Ltd.
Dongkuk Int’l Inc.
Dongkuk Corp.
DKC S.A.
DKUNC Co., Ltd.
Union Coating Co., Ltd.
Kukje Machinery Co., Ltd.
Branson Machinery LLC.
Anhui Kukje Jingtian Machinery Co.,Ltd.
Dangjin Kodae-port Operating Company., Ltd.
Meritz 2 Star Private Investment trust SEPO-12
Manufacturing and marketing of cold-rolled steel sheets
Manufacturing and marketing of cold-rolled steel sheets
Manufacturing and marketing of cold-rolled steel sheets
Manufacturing and marketing of cold-rolled steel sheets
Trading
Trading
Stevedoring, transportation and service related transportation
Stevedoring, transportation and service related transportation
Stevedoring, service related transportation
Stevedoring, service related transportation
Union of investment
Facility maintenance and management
Trading
Trading
Service related transportation
Distributing computer equipment and maintenance on it device
Manufacturing of cold-rolled steel sheets
Manufacturing and marketing of agricultural machinery
Trading
Manufacturing and marketing of agricultural machinery
Port operation and management
Private equity Fund

The More Value56
2011 ANNUAL REPORT
DONGKUK STEEL 57
160,632
75,703
52,794
289,129
143,722
55,388
22,292
221,402
138,313
453
292
139,058
74,051
182
86
74,319
(in millions of Korean won)
(in millions of Korean won)
Sales SalesPurchases Purchases
2011 2010
Subsidiaries
Joint ventures
Other related Parties
Subsidiaries
Joint ventures
Other related Parties
896,518
18,253
-
914,771
778,748
15,558
5,273
799,579
13,233
76
28
13,337
8,244
29
19
8,292
Receivables ReceivablesPayables Payables
2011.12.31 2010.12.31
10,407
2,776
13,183
Key management¹ compensation
¹ Key management refers to the directors who have significant control and responsibilities on the Company’s business plans, operations and controls.
The Company recognized dividend income amounting to ₩3,736 million (2010: ₩595 million) from subsidiaries and ₩20 million (2010: ₩25
million) from associates for the year ended December 31, 2011.
The Company has not recognized allowance for doubtful accounts against the related parties as of December 31, 2011 and 2010, and January 1, 2010.
The details of the guarantees provided by the Company for related parties for the year ended December 31, 2011 are disclosed in Note 35.
(in millions of Korean won)
Wages and salaries
Post-employment benefits
2011.12.31 2010.12.31
11,195
1,470
12,665
38.1 Financial Risk Factors
(1) Market risk
1) Foreign exchange risk
As of December 31, 2011 and 2010, if the foreign exchange rate of the Korean won fluctuated by 10% while other variables were fixed, the effects
on profit (loss) before income tax would be as follows:
38. Financial Risk Management
(in millions of Korean won)
USD/KRW
JPY/ KRW
EUR/KRW
197,710
10,229
2,053
202,771
8,774
445
(197,710)
(10,229)
(2,053)
(202,771)
(8,774)
(445)
10% increase 10% increase 10% decrease 10% decrease
2011.12.31 2010.12.31
The Company’s financial instruments denominated in major foreign currencies as of December 31, 2011 and 2010, are as follows:
2) Price risk
The Company’s investments in equity of other entities that are publicly traded are included in one of the following two equity indexes: KOSPI equity index and
NIKKEI equity index.
The table below summarizes the impact of increases/decreases of the two equity indexes on the Company’s post-tax profit for the year and on equity. The
analysis is based on the assumption that the equity indexes had increased/decreased by 10% with all other variables held constant and all the Company’s
equity instruments moved according to the historical correlation with the index:
(in millions of Korean won)
(In foreign currency: in thousands Korean won: in millions )
KOSPI
NIKKEI
Cash and cash equivalents
Trade receivables
Available-for-sale financial assets
Trade payables
Debentures
Borrowings
Finance lease liabilities
-
-
10,474
3,805
-
-
9,285
2,855
2011.12.31 2011.12.312010.12.31 2010.12.31
Impact on post-tax profit Impact on equity
Amount of foreign currencyCurrencies
Amount of Korean won
11,996
-
71,019
450,096
1,394,000
1,051,108
160,289
130,000
523,207
7,227,978
13,742
-
92,128
USD
JPY
USD
JPY
JPY
USD
JPY
USD
USD
JPY
EUR
GBP
USD
13,835
-
81,906
6,685
20,703
1,212,243
2,381
149,929
603,414
107,347
20,531
-
106,251
2011.12.31 2011.12.31
16,733
-
5,697
-
1,394,000
858,280
558,547
100,000
202,872
7,818,841
1,739
-
2,251
19,538
-
6,652
-
17,604
1,002,127
3,527
116,760
236,874
98,738
2,911
-
2,628
2010.1.1 2010.1.1
31,865
166,986
54,019
366,220
1,394,000
1,186,416
2,820,484
100,000
579,881
3,993,236
2,938
28
102,539
36,291
2,333
61,522
5,116
19,475
1,351,210
39,404
113,890
660,426
55,789
4,447
50
116,781
2010.12.31 2010.12.31
3) Interest rate risk
As of December 31, 2011 and 2010, if interest rates of borrowings with variable interest rates fluctuate by 100bp without other variables changing, the
effects on interest expenses related to borrowings with variable interest rates are as follows:
(in millions of Korean won)
Interest expenses
(1,499)
(1,639)
1,499
1,639
100bpincrease
100bpincrease
100bpdecrease
100bpdecrease
2011.12.31 2010.12.31
Significant transactions and balances with related parties for the years ended December 31, 2011 and 2010, are as follows:

The More Value58
2011 ANNUAL REPORT
DONGKUK STEEL 59
The credit quality of financial assets that are neither past due nor impaired can be assessed by reference to external credit ratings (if available) or to
historical information about counterparty default rates as of December 31, 2011 and 2010, and January 1, 2010, are as follows:
Group 1 - new customers/related parties (less than 6 months)
Group 2 - existing customers/related parties (more than 6 months) with no defaults in the past.
Some trade receivables are provided with collaterals or payment guarantees and trade receivables are due from many customers.
¹ Credit rating is from Korea Enterprise Data Co., Ltd. Certain cash and cash equivalents deposited in financial institutions, and financial deposits are included.
(in millions of Korean won)
(in millions of Korean won)
2011.12.31
2010.1.1
2010.1.1
2010.12.31
2010.12.31
2011.12.31
2011.12.31
2010.12.31 2010.1.1
Trade receivablesCounterparties with external credit rating
AA
AA-
A+
A
A-
BBB+
BBB
BBB-
BB+
BB
BB-
B+
B
B-
Counterparties without external credit rating
Group 1
Group 2
Held-to-maturity financial assets
Government and public bonds
Cash at bank and short-term bank deposits¹
AAA
AA+
AABB+
31,113
50,127
39,451
2,729
95,916
35,936
39,678
99,963
117,905
53,507
59,031
38,691
21,458
9,975
695,480
12,774
53,533
66,307
761,787
5,343
134,967
113,715
259,211
746,250
1,254,143
174,550
208,303
346,143
418,280
1,147,276
162,860
143,581
462,560
484,689
1,253,690
24,447
56,017
40,935
1,043
92,057
47,100
56,410
95,422
101,048
53,819
81,144
30,104
20,104
10,687
710,337
7,300
41,561
48,861
759,198
4,311
18,821
40,097
30,134
2,943
67,285
41,323
22,896
51,606
74,228
40,865
64,449
25,480
15,976
6,199
502,302
4,867
39,520
44,387
546,689
4,269
(3) Liquidity Risk
The Company is able to source funds any time in domestic and international financial markets since it has a A+ credit rating from Korea Investor Service, Inc.
and Korea Ratings Corporation, respectively.
Undiscounted cash flows analysis for financial liabilities, including interest, according to their remaining contractual maturity as of December 31, 2011
and 2010, and January 1, 2010, are as follows:
2011.12.31(in millions of Korean won)
Trade payables
Other payables
Borrowings(Except for Finance lease liabilities)
Finance lease liabilities
Financial guarantee contracts
-
-
368,900
24,580
-
393,480
1,641,785
128,647
1,498,749
13,817
180,764
3,463,762
Over5year2 to 5 year1 to 2 yearLess than 1
yearTotal
-
-
47,374
74,290
-
121,664
-
14,091
1,263,012
12,148
-
1,289,251
1,641,785
142,738
3,178,035
124,835
180,764
5,268,157
2010.12.31
2010.1.1
(in millions of Korean won)
(in millions of Korean won)
Trade payables
Other payables
Borrowings(Except for Finance lease liabilities)
Finance lease liabilities
Financial guarantee contracts
Trade payables
Other payables
Borrowings(Except for Finance lease liabilities)
Finance lease liabilities
Financial guarantee contracts
-
-
771,061
26,241
-
797,302
-
-
373,148
-
-
373,148
1,813,398
110,447
1,335,295
15,313
185,216
3,459,669
1,380,025
112,385
1,518,113
2,628
195,753
3,208,904
Over5year
Over5year
2 to 5 year
2 to 5 year
1 to 2 year
1 to 2 year
Less than 1year
Less than 1year
Total
Total
-
-
18,774
84,016
-
102,790
-
-
7,399
-
-
7,399
-
10,076
478,826
13,752
-
502,654
-
7,832
456,320
-
-
464,152
1,813,398
120,523
2,603,956
139,322
185,216
4,862,415
1,380,025
120,217
2,354,980
2,628
195,753
4,053,603
38.2 Capital Management
The gearing ratios at the end of reporting period were as follows:
(in millions of Korean won) 2010.1.12010.12.312011.12.31
Total Borrowings
Less: Cash and cash equivalents
Net debt
Total equity
Total capital
Gearing ratio
2,128,225
(948,052)
1,180,173
2,844,224
4,024,397
29.33%
2,503,731
(598,115)
1,905,616
2,910,511
4,816,127
39.57%
3,176,440
(663,308)
2,513,132
2,838,211
5,351,343
46.96%
(2) Credit Risk
No credit limits were exceeded during the reporting period, and management does not expect any losses from nonperformance by these counterparties.
In addition, none of normal financial assets was readjusted during the years 2011 and 2010.

The More Value60
2011 ANNUAL REPORT
DONGKUK STEEL 61
Global NetworkDOMESTIC
HEAD OFFICEFerrum Tower 66 Suha-dong, Jung-gu, SeoulTel: 82-2-317-1114
POHANG WORKS880, Songdong-ri, Daesong-myun, Nam-gu, PohangTel: 82-54-278-6111
INCHEON WORKS1 Songhyeon-dong, Dong-gu, IncheonTel: 82-32-830-6216
DANGJIN WORKS400, Hanjin-ri, Songak-eup, Dangjin-si, ChungnamTel: 82-41-351-4984
BUSAN WORKS370-97 Shinpyeong-dong, Saha-gu, BusanTel: 82-51-294-2133
R&D CENTER440 Songdong-ri, Daesong-myeon, Nam-gu, PohangTel: 82-54-271-2710
OVERSEAS
LOS ANGELES BRANCHDONGKUK INTERNATIONAL, INC.19750 Magellan Drive Torrance, CA. 90502, USATel: 1-310-523-9595, Fax: 1-310-523-9599
NEW YORK OFFICEDONGKUK INTERNATIONAL, INC.400 Kelby Street, 11th Floor, Fort Lee, NJ. 07024, USATel: 1-201-592-8600, Fax: 1-201-947-3999
TOKYO BRANCHDONGKUK CORPORATION7Floor, Seika Building 2-7-6, Kayaba-cho,Nihonbashi Chuo-Ku, Tokyo 103-0025, JapanTel: 81-3-5623-5723, Fax: 81-3-5623-5722
SHANGHAI REPRESENTATIVE OFFICEDONGKUK STEEL MILL CO., Ltd.Room 2306, Sheng Gao International Builing, No. 317,Xian-xia Road, Chang-ning District, Shanghai, ChinaTel: 86-21-6229-0114, Fax: 86-21-6229-0221
CSP (Companhia Siderúrgica do Pecém)Av. Dom Luis 807, 9o andar, Meireles, Fortaleza, CE, Brazil (CEP 60160-230)Tel: 55-85-3033-3800, Fax: 55-85-3033-3899
UAE BRANCH DONKUK STEEL MILL CO.,Ltd.#3305, Jumeirrah Business Center No. 1, JLT, Dubai, UAETel: 971-4-435-7305, FAX : 971-4-435-7306
Dongkuk Steel, a traditional company
in Korean steel industry, can do the
best in nothing but steel.
LOS ANGELE NS EW YORKTOKYO
SHANGHAI
FORTALEZA
HEAD OFFICE
INCHEON WORKS
DANGJIN WORKS
POHANG WORKS
BUSAN WORKS
DUBAI


