
The original version of the report is in French

Morocco’s GrowthDiagnostic
Identifying Morocco’s Binding Constraints to Broad-Based Growth

African DevelopmentBank
Government of theKingdom of Morocco
MCC
Members of the analytical and editorial team:
Vincent Castel
Samia Mansour
Kaouther Abderrahim
Gilles Nancy
Marion Dovis
Ishac Diwan
For their special contributions,we thank:
Patricia Augier
Emmanuel Diarra
Ashraf Tarsim
Management – Regional Department(North Africa) & Representation inMorocco:Jacob Kolster
Yacine Fal
Management – Economic Complex, Research Department: Steve Kayizzi-Mugerwa
Shimeles Abebe
With the contribution of:
Driss Charrier
Amine Mouaffak
Olivier Breteche
Adama Moussa
Driss Khiati
Leila Jaafor-Kilani
Laurence Lannes
Mohamed El Arkoubi
Mohamed El Ouahabi
Pierre More Ndong
Belgacem Ben Sassi
Mouhamed Gueye
Mamadou Yaro
Rafaa Marouki
William Dakpo
Wadii Rais
Coordination:
Presidency of the Government
Team members:
Head of the Government(SCG)
Abdelghni Lakhdar, Team Leader, Economic Advisor
Abdelkader El Ghrib, Economist
Mohamed Mahroug, Economist
Abdelatif Naanaa,Statistician-Economist
High Commission for
Planning
Ayache Khellaf, Director
Abdelaziz Nihou,Director
Other contributors (SCG):
Essaid Azzouzi
Thami Elmaaroufi
Mohamed Hammoumi
Salah Eddine Laissaoui
Sara Chajae
Ikrame El houdali
Members of the analysis teameconomic:
John UnderwoodChief Economist
Stefan OsborneEconomist
Guyslain NgelezaEconomist
Brad CunninghamEconomist
With contributions from:
Ariane GauchatCountry Team Lead
Dana BinnendijkProgram Officer
Melissa AdamsSocial and Gender Assessment
Jason BauerFinance, Investment and Trade
M O R O C C O ’ S G R OW T H D I A G N O S T I C4
Contributors
5M O R O C C O ’ S G R OW T H D I A G N O S T I C
Table of Contents
5 TABLE OF CONTENTS
11 LIST OF FIGURES
17 LIST OF TABLES
19 LIST OF BOXES
20 LIST OF ACRONYMS
23 PREFACE
25 CONSULTATIVE PROCESS
28 EXECUTIVE SUMMARY
28 Introduction30 Methodology33 Major Constraints to Growth in Morocco
37 CHAPTER 1: OVERVIEW OF THE MOROCCAN ECONOMY
40 Introduction
40 1.1 ECONOMIC POLICIES IN SUPPORT OF GROWTH40 1.1.1 Stabilization of Macroeconomic Balances
42 1.1.2 Openness of the Economy
44 1.1.3 Facilitation of Access to Financing
45 1.1.4 Growth and Employment-Oriented Industrial Policy
46 1.1.5 Improvement of Physical Investment Environmemt
46 1.1.6 Improvement of Social Cohesion
47 1.2 A MODEL INDUCING RELATIVELY SUSTAINED GROWTH BUT WITH SERIOUS LIMITATIONS
50 1.2.1 Volatile Economic Growth
50 1.2.2 A Fairly Static Production Structure
51 1.2.3 Domestic Demand-driven Growth
54 1.2.4 Limited Private Sector Dynamism
57 1.2.5 Weak Export Competitiveness Impacting Negatively on the External Balances
59 1.2.6 Low Factor Productivity Contribution
61 1.2.7 Weak Employment-Generating Growth, especially among Young People
64 1.2.8 Largely Non-Inclusive Growth
67 CHAPTER 2: COST OF FINANCING
70 Introduction
71 2.1 THE MOROCCAN ECONOMY’S FINANCING REQUIREMENTS71 2.1.1 Counter-cyclical Trend of Financing Requirements
71 2.1.2 Insufficient National Savings
73 2.1.3 Savings-Investment Balance
5

M O R O C C O ’ S G R OW T H D I A G N O S T I C6
74 2.1.4 Unbalanced Financing Needs Among Institutional Sectors
76 2.2 THE MOROCCAN ECONOMY’S FINANCING ARRANGEMENTS76 2.2.1 Public Sector Financing
76 2.2.2 Bank Credit and Private Sector Financing
77 2.2.3 Capital Market
78 2.2.4 Micro-finance
79 2.3 COST OF FINANCING
79 2.3.1 Cost of Public Sector Financing
80 2.3.2 High Cost of Private Sector Financing
82 2.4 GROWTH DIAGNOSTIC TESTS
82 2.4.1 Type 1 Test : Correlation between Real Interest Rate and GDP per capita
83 2.4.2 Type 2 Test : Correlation between the Real Interest Rate and Private Investment
83 2.4.3 Type 2 Test : Causal Relationship between Bank Credit to the Private Sector and GDP per capita
85 2.4.4 Type 3 & 4 Tests : Bypassing of the Financing Constraint by Firms
87 2.5 SECOND-ROUND EFFECTS88 2.5.1 Crowding-Out Effects
88 2.5.2 Price Distortions
91 CHAPTER 3: HUMAN CAPITAL
94 Introduction
95 3.1 DEMOGRAPHIC CONTEXT
97 3.2 HEALTH ENVIRONMENT
99 3.3 EDUCATION AND TRAINING
100 3.3.1 Enrolment Rate
102 3.3.2 Length of Schooling
103 3.3.3 Education Quality
104 3.3.4 Vocational Training in Morocco
104 3.4 GROWTH DIAGNOSTIC TESTS
104 3.4.1 Type 1Test : Education and Training Performance
105 3.4.2 Type 2 Test : Correlation between Level of Education and GDP per capita
106 3.4.3 Type 3 Test : Bypassing the Constraint
108 3.4.4 Type 4 Test : Camels & Hippos
110 3.5 SECOND-ROUND EFFECTS
113 CHAPTER 4: INFRASTRUCTURE
115 Introduction
115 4.1 THE MOROCCAN ECONOMY’S INFRASTRUCTURE SUPPLY115 4.1.1 Quantitative and Qualitative Improvement of Transport in Morocco
123 4.1.2 Significant Electricity Development
125 4.1.3 Persistent Disparities in Water and Sanitation Facilities
127 4.1.4 Telecommunications
129 4.2 GROWTH DIAGNOSTIC TESTS
129 4.2.1 Infrastructure Quality Comparison
130 4.2.2 Type 2 Test : Estimate of the Correlation Between an Infrastructure Quality Indicator and GDP per capita
131 4.2.3 Type 3 Test : How Firms Bypass the Constraint?
132 4.2.4 Type 4 Test : Does Limited Infrastructure Impede the Development of Firms?
132 4.3 SECOND-ROUND EFFECTS
135 CHAPTER 5: NATURAL CAPITAL
137 Introduction
137 5.1 BASIC RESOURCES
137 5.1.1 Geographical Position
137 5.1.2 Land
138 5.1.3 Water
139 5.2 EXTRACTIVE RESOURCES
139 5.2.1 Fossil Fuels
140 5.2.2 Phosphate, an Exceptional Endowment
140 5.3 RESOURCES DEVELOPMENT
140 5.3.1 Capitalizing on Geographical Proximity
141 5.3.2 Land Development
142 5.3.3 Water Development
143 5.3.4 Alternative Energy Development
144 5.3.5 Phosphate Development
144 5.4 GROWTH DIAGNOSTIC TESTS
144 5.4.1 Comparison of Water and Land Availability
145 5.4.2 Type 2 Test : Estimate of the Correlation Between (Water and Land) and Resources Level of Economic Development
146 5.4.3 Type 3 Test : Are Firms Obliged to Bypass the Constraint?
146 5.4.4 Type 4 Test : Are Firms Requiring more Water and/or Land Impeded in their Development?
147 5.4.5 Cross Testing between Natural Resources and Infrastructure
148 5.5 SECOND-ROUND EFFECTS
151 CHAPTER 6: MACROECONOMIC RISKS
153 Introduction
153 6.1 BALANCE OF PAYMENTS CURRENT ACCOUNT IMBALANCES
154 6.1.1 External Macroeconomic Rrisk Factors
154 6.1.2 Current Account Balance Trend and Financing Gap
7M O R O C C O ’ S G R OW T H D I A G N O S T I C 7

156 6.1.3 Trend of Net Foreign Assets
157 6.1.4 Sustainability of the Current Account Deficit
157 6.2 SOUND PUBLIC FINANCES
157 6.2.1 Public Debt Sustainability
158 6.2.2 Assessment by Markets
160 6.3 THE BANKING SECTOR
160 6.3.1 Bank Capitalization
161 6.3.2 Return on Capital
161 6.3.3 Risk Management
163 CHAPTER 7: MICROECONOMIC RISKS
167 Introduction
167 7.1 THE JUDICIAL SYSTEM
167 7.1.1 Situation and Challenges
169 7.1.2 Type 1Test : High Cost of Justice
171 7.1.3 Type 2 Test : Relationship Between Judicial System Quality and GDP per capita
171 7.1.4 Type 3 Test : By-passing the Constraints
172 7.2 LAND TENURE
172 7.2.1 Situation and Challenges
175 7.2.2 High Cost and Perception of Firms
177 7.2.3 Type 3 Test : By-passing the Constraint
179 7.2.4 Type 4 Test : Camels & Hippos
181 7.3 THE TAX SYSTEM
181 7.3.1 Situation and Challenges
184 7.3.2 Type 1 Test : High Cost
187 7.3.3 Type 2 Test : Relationship between Tax System Indicators and GDP per capita
188 7.3.4 Type 3 Test : By-passing the Constraint
189 7.3.5 Type 4 Test : Camels & Hippos
190 7.3.6 Second-Round Effects
191 7.4 THE LABOR MARKET: FINANCIAL AND REGULATORY COST OF LABOR191 7.4.1 Situation and Challenges
192 7.4.2 Type 1 Test : High Cost of Labor
194 7.4.3 Type 3 Test : By-passing the Constraint
196 7.4.4 Type 4 Test : Camels & Hippos
196 7.5 GOVERNANCE, CORRUPTION AND TRANSPARENCY196 7.5.1 Situation and Challenges
199 7.5.2 Type 1 Test : High Cost of Corruption
200 7.6 TRADE BARRIERS
200 7.6.1 Introduction
200 7.6.2 Situation and Challenges
M O R O C C O ’ S G R OW T H D I A G N O S T I C8
206 7.6.3 Trade Freedom Comparison
207 7.6.4 Type 2 Test : Estimate of the Correlation Between Trade Openness and the Level of Economic Development
208 7.6.5 Type 3 Test : Are Firms Able to Trade?208 7.6.6 Type 4 Test : Import Trend by Major Sectors
211 CHAPTER 8: INNOVATION
213 Introduction
214 8.1 TRANSFORMATION AND DIVERSIFICATION PERFORMANCE
217 8.1.1 Type 1 Test : Level of Complexity in Relation to GDP per capita
218 8.1.2 Type 2 Test : Relationship Between Private Investment in Percentage of GDP and Export Sophistication
219 8.2 GOVERNMENT POLICIES TO ADDRESS MARKET FAILURES IN INNOVATION
220 8.2.1 Industrial Policies and Strategies
223 8.2.2 Industrial Parks – A Key Factor in Sector Policy
224 8.3 OTHER EXPLANATORY FACTORS OF MOROCCO’S MIXED PERFORMANCE IN INNOVATION AND
SOPHISTICATION
9M O R O C C O ’ S G R OW T H D I A G N O S T I C

228 ANNEX 1.1: LIST OF PARTICIPANTS IN THE CONSULTATIONS TO ECONOMIC GROWTH IN MOROCCO
228 Moroccan Public Administration and Institutions
229 Financial Organizations and Banks
230 Technical and Financial Partners and Other International Organizations
230 Private Sector
231 Civil Society Organizations
231 Representatives of Trade Union Bodies
231 Academic Staff
231 Several Resource Persons
232 ANNEX 2.1: PRESIMO MODEL: FORECASTING SCENARIOS FOR THE MOROCCAN ECONOMY
232 ANNEX 2.2: CORRELATION TEST BETWEEN REAL INTEREST RATE AND GDP PER CAPITA
233 ANNEX 2.3: CORRELATION TEST BETWEEN REAL INTEREST RATE AND PRIVATE INVESTMENT
233 ANNEX 2.4: GRANGER CAUSALITY TEST
234 ANNEX 3.1: RANKING ON EDUCATIONAL SYSTEM QUALITY, THE GLOBAL COMPETITIVENESS REPORT2013 - 2014
234 ANNEX 4.1: STATIONARITY TEST OF CERTAIN TYPES OF INFRASTRUCTURE AND INCOME PER CAPITA
236 ANNEX 6.1: EXTERNAL SOURCES OF MACROECONOMIC RISK
239 ANNEX 6.2: BALANCE OF PAYMENTS CURRENT ACCOUNT DEFICIT SUSTAINABILITY
243 ANNEX 6.3: JOHANSEN CO-INTEGRATION TEST, REAL EXCHANGE RATE
244 ANNEX 7.1: LAND TENURE SYSTEMS
245 ANNEX 8.1: COMPOSITION OF THE EXPORT BASKET, 1995 AND 2010
247 REFERENCES
Appendices
M O R O C C O ’ S G R OW T H D I A G N O S T I C10
List of FiguresTrend of the minimum wage and consumption prices
State revenue structure
Public debt as percentage of GDP
Trend of the economy’s openness level
Net external position chart
Origin of imports
Destination of exports
Trend of lending rates
Population growth rate 1980-2012, Morocco and comparable countries
GDP index/per capita, Morocco and comparable countries (1980-2012)
GDP growth per capita (1960-2011)
The Moroccan economy’s annual growth rate (1960-2012)
Economic growth volatility between 2000 and 2011
GDP sector breakdown (1980-2012)
Value added breakdown by sector in percentage
Contribution of demand components to growth in percentage (2001-2012)
Average export growth rate
Export volatility
Exports and imports as percentage of GDP
Total investment as percentage of GDP
Private investment and public investment as percentage of GDP (2001-2012)
Foreign Direct Investments as percentage of GDP (2000-2011)
Export innovation and sophistication index
Export price trend of Morocco and comparable countries
World export breakdown in 2012 (percentage total)
Cover rate trend of Morocco and and comparable countries
Factor productivity growth rate
Total factor productivity by sector
Labour productivity trend in Morocco (USD 1990) and comparable countries
(1980-2011)
Return on investment
Unemployment-growth relationship in Morocco and comparable countries
Growth-university graduate unemployment relationship
Trend of vocational training numbers
Employment by sector in percentage
Figure 1.1
Figure 1.2
Figure 1.3
Figure 1.4
Figure 1.5
Figure 1.6
Figure 1.7
Figure 1.8
Figure 1.9
Figure 1.10
Figure 1.11
Figure 1.12
Figure 1.13
Figure 1.14
Figure 1.15
Figure 1.16
Figure 1.17
Figure 1.18
Figure 1.19
Figure 1.20
Figure 1.21
Figure 1.22
Figure 1.23
Figure 1.24
Figure 1.25
Figure 1.26
Figure 1.27
Figure 1.28
Figure 1.29
Figure 1.30
Figure 1.31
Figure 1.32
Figure 1.33
Figure 1.34
11M O R O C C O ’ S G R OW T H D I A G N O S T I C
Unemployment rate of Morocco and comparable countries in percentage
Unemployment rate by age bracket
Poor population ratio depending on the national poverty threshold in 2007 (percentage
of the population)
Financial freedom
Investment rate and GDP/per capita
Finance capacity/Need as percentage of GDP
Gross domestic savings rate in percentage of GDP
Migrant remittances as percentage of GDP
Gross fixed capital formation in percentage of GDP
FDI as percentage of GDP (2000-2010)
Trend of outstanding Treasury debt 1983-2012 in percentage of GDP
Financing need/capacity by institutional sector
Trend of Bank loans in percentage of GDP
Market capitalization of listed firms in percentage of GDP
Loans per 1000 DH in 2009
Sovereign debt spread vis-à-vis US Treasury bonds
Morocco’s outstanding foreign debt Millions USD
Yield curve
Real interest rate in Morocco and comparable countries
Finance cost/Nominal interest rates
Collateral value
Interest rate and GDP/pc relationship (2000)
Interest rate and GDP/pc relationship (2010)
GDP/pc and real interest rate relationship (1990-2010)
Relationship between private investment (in percentage of GDP) – Real interest rate (1990-2012)
Domestic credit and GDP/pc relationship
Share of self-financed investments
Share of investments financed by banks
Domestic debt financing and national savings
Gross fixed capita formation, private sector in percentage of GDP
Non-traded goods and traded goods relationship
Fertility index trend, Morocco and comparable countries (1960-2012)
Trend of population growth rate (1960-2012)
Child mortality rate in Morocco, by area
Figure 1.35
Figure 1.36
Figure 1.37
Figure 2.1
Figure 2.2
Figure 2.3
Figure 2.4
Figure 2.5
Figure 2.6
Figure 2.7
Figure 2.8
Figure 2.9
Figure 2.10
Figure 2.11
Figure 2.12
Figure 2.13
Figure 2.14
Figure 2.15
Figure 2.16
Figure 2.17
Figure 2.18
Figure 2.19
Figure 2.20
Figure 2.21
Figure 2.22
Figure 2.23
Figure 2.24
Figure 2.25
Figure 2.26
Figure 2.27
Figure 2.28
Figure 3.1
Figure 3.2
Figure 3.3
M O R O C C O ’ S G R OW T H D I A G N O S T I C12

Maternal mortality rate (for 100000 live births), Morocco and comparable countries
(2011-2012)
Public health expenditure relative to GDP per capita (2012)
Public education expenditure, total (percentage of State budget)
Literacy rate (% of persons aged 15 years and above), Morocco 2011
Gross enrollment rate in pre-primary education by country in 2010
Trend of the net primary school enrollment rate
Higher education enrollment rate (2011-2012)
Labour force structure according to level of education
Results of TIMSS tests
Education and training performance in Morocco (in percentage)
Correction between the secondary enrollment rate and GDP per capita
University graduate emigration rate (in percentage)
University graduate emigration rate ratio and total emigration rate relative to GDP
per capita (2005)
Comparison of value added (% GDP) by sector, Morocco 1980 and 2012
Road density in Morocco and comparable countries (for 100 inhabitants) in 2011
Density trend
Railway transport, transported goods (millions of tonnes-kilometres)
Railway transport, transported passengers (millions-kilometres)
Maritime transport of goods (in millions of tonnes)
Container traffic in ports (2000 and 2012)
Transborder trade costs
Electricity access (percentage of population) in 2010
Time frame needed to have electricity (number of days) in 2012
Population rate of access (%) to improved water sources
Population rate of access to improved sanitation facilities in 2011
Fixed telephone lines (for 100 inhabitants) in 2012
Mobile telephone lines (for 100 inhabitants) in 2012
High-speed internet subscriptions (for 100 inhabitants) in 2012
Number of internet users (for 100 inhabitants) in 2012
Infrastructure quality and GDP per capita
Trade and transport infrastructure quality and GDP per capita
Obstacles raised by firms
Transport infrastructure and land acquisition (level of severity)
State of roads and land acquisition (degree of severity)
Figure 3.4
Figure 3.5
Figure 3.6
Figure 3.7
Figure 3.8
Figure 3.9
Figure 3.10
Figure 3.11
Figure 3.12
Figure 3.13
Figure 3.14
Figure 3.15
Figure 3.16
Figure 3.17
Figure 4.1
Figure 4.2
Figure 4.3
Figure 4.4
Figure 4.5
Figure 4.6
Figure 4.7
Figure 4.8
Figure 4.9
Figure 4.10
Figure 4.11
Figure 4.12
Figure 4.13
Figure 4.14
Figure 4.15
Figure 4.16
Figure 4.17
Figure 4.18
Figure 4.19
Figure 4.20
13M O R O C C O ’ S G R OW T H D I A G N O S T I C
Arable land (percentage of territory)
Rainfall in Morocco
Renewable water resources per capita (in m3)
Groundwater tables
Energy production (thousands of TOE "Tonnes Oil Equivalent")
Energy consumption (thousands of TOE)
Energy imports (thousands of TOE)
Phosphate mining and production
Tourism trend in Morocco
Useful agricultural surface area per capita
Renewable water resources and wealth level (log of GDP/capita in PPA, 2005
constant USD)
Arable land and agricultural value added (log/per capita, 2005 constant USD)
Number of water shortages (per month) declared by firms
Agricultural value added (2005 constant USD)
Electricity generation from oil, gas and coal (percentage of total) in 2011
Energy consumption and wealth level (log of GDP in PPA, 2005 constant USD)
Oil imports (in percentage of imported goods)
Current account as percentage of GDP (1983-1996)
Current account as percentage of GDP (1997-2012)
Investment (percentage of GDP) relative to GDP per capita
Current account balance as percentage of GDP
Compared trends of net foreign assets and trade balance of goods and services
Budget deficits and public debts
Gross public debts (in percentage of GDP)
Sovereign Risk Premium and Debt late 2012
Sovereign debt premium and GDP per capita
Bank capitalization
Bankarization rate
Number of inhabitants per bank counter and by region
Return on bank assets
Percentage of firms identifying the judicial system as a binding constraint, Morocco
and comparable countries
Percentage of Moroccan firms identifying the judicial system as a binding constraint
Property right index and GDP per capita
Rule of law and GDP per capita
Figure 5.1
Figure 5.2
Figure 5.3
Figure 5.4
Figure 5.5
Figure 5.6
Figure 5.7
Figure 5.8
Figure 5.9
Figure 5.10
Figure 5.11
Figure 5.12
Figure 5.13
Figure 5.14
Figure 5.15
Figure 5.16
Figure 5.17
Figure 6.1
Figure 6.2
Figure 6.3
Figure 6.4
Figure 6.5
Figure 6.6
Figure 6.7
Figure 6.8
Figure 6.9
Figure 6.10
Figure 6.11
Figure 6.12
Figure 6.13
Figure 7.1.1
Figure 7.1.2
Figure 7.1.3
Figure 7.1.4
M O R O C C O ’ S G R OW T H D I A G N O S T I C14
Proportion of loans requiring a guarantee
Guarantee value necessary for a loan (percentage of loan amount)
Level of land access difficulty by region
Level of land access difficulty (Morocco 2007)
Industrial land access constraint: international comparisons
Trend of prices per square meter
Cereal yields in Morocco (1961-2012)
Investment and joint ownership
Obtaining a building permit: Cost (percentage of income per capita)
Time to lease land (private and public) in number of days
Manufacturing sector value added (percentage of GDP)
Arable land under cereal cultivation
Arable land under cereal cultivation and GDP per capita
Tax revenue as percentage of GDP relative to GDP per capita (PPA, USD international)
Tax revenue by source (2012)
Level of difficulty represented by the tax administration for business operations
Taxes on profits relative to GDP per capita (2012)
Labour taxation and welfare costs (percentage profit) vs GDP per capita (2012)
Level of difficulty represented by the taxation rate for business operations
Relationship between taxation rates and GDP per capita in Morocco
Percentage of firms suffering from informal sector competition by business size
Correlation between tax burden ratio and weight of the informal economy
Country ranking in labour market efficiency
Major obstacles to the conduct of business operations
Wage breakdown in the industrial sector (2007)
Informality and GDP per capita (2007)
Relationship between the informal sector labour force and minimum wage/average
productivity per worker (2007)
Value of additional amounts necessary for the execution of a public contract (percentage
of contract value)
Customs duty trend, effectively applied rate (simple average)
Customs duty trend by category of goods, effectively applied rate (simple average)
Frequency index trend between 2001 and 2010
Figure 7.1.5
Figure 7.1.6
Figure 7.2.1
Figure 7.2.2
Figure 7.2.3
Figure 7.2.4
Figure 7.2.5
Figure 7.2.6
Figure 7.2.7
Figure 7.2.8
Figure 7.2.9
Figure 7.2.10
Figure 7.2.11
Figure 7.3.1
Figure 7.3.2
Figure 7.3.3
Figure 7.3.4
Figure 7.3.5
Figure 7.3.6
Figure 7.3.7
Figure 7.3.8
Figure 7.3.9
Figure 7.4.1
Figure 7.4.2
Figure 7.4.3
Figure 7.4.4
Figure 7.4.5
Figure 7.5.1
Figure 7.6.1
Figure 7.6.2
Figure 7.6.3
15M O R O C C O ’ S G R OW T H D I A G N O S T I C

Trade freedom index in 2012
Correlation between real income per capita in 2012 and trade freedom index
Proportion of exporting and importing firms
Import breakdown trend
Sophistication index trend (1960-2012)
Morocco in the product space (1980 et 2010)
High-technology content exported products (percentage of exported manufactured
products)
Product diversification index (2012)
Export sophistication and income per capita (2008)
Diversification and omnipresence (2012)
Complexity index and income per capita (2011)
Private investment rate (percentage of GDP) - Sophistication Index (1980-2010)
Trend of patent registration applications since 2005
Openness level
Export index of goods and services
Main exported products
Main imported products
Foreign trade cover rate
Index of terms of trade 2000=100
Export energy cost trend
Forecasts of growth rates of real GDP in percentage
Inflation, consumption price (annual percentage)
Real exchange rate 2005=100
Real effective exchange rate equilibrium
Figure 7.6.4
Figure 7.6.5
Figure 7.6.6
Figure 7.6.7
Figure 8.1
Figure 8.2
Figure 8.3
Figure 8.4
Figure 8.5
Figure 8.6
Figure 8.7
Figure 8.8
Figure 8.9
Figure A6.1
Figure A6.2
Figure A6.3
Figure A6.4
Figure A6.5
Figure A6.6
Figure A6.7
Figure A6.8
Figure A6.9
Figure A6.10
Figure A6.11
M O R O C C O ’ S G R OW T H D I A G N O S T I C16

Table 1.1
Table 2.1
Table 2.2
Table 2.3
Table 2.4
Table 3.1
Table 3.2
Table 3.3
Table 3.4
Table 3.5
Table 3.6
Table 3.7
Table 4.1
Table 4.2
Table 4.3
Table 4.4
Table 4.5
Table 4.6
Table 4.7
Table 5.1
Table 5.2
Table 5.3
Table 5.4
Table 7.1.1
Table 7.1.2
Table 7.1.3
Table 7.2.1
Table 7.3.1
Table 7.3.2
Table 7.3.3
Macroeconomic balances 2000-2007 (as percentage of GDP)
Finance need in Morocco
Financing need/capacity in millions of DH
The stock market in Morocco and comparable countries
Average domestic debt/foreign debt cost
Life expectancy trend by gender and by area (1980 - 2012)
Population structure trend (1960-2013)
Trend of the school-age population by age group, in thousand
Internal primary and secondary education efficiency
Average duration of schooling by country (2010)
Unemployment level according to diplomas and areas of residence (in percentage)
Moroccan population projection by age group
Road network quality trend
Port capacities (million tonnes/year)
Characteristics of the 3 main ports
Infrastructure quality
World ranking and electricity access procedures
Electricity outages
Use of a generator
Surface and underground water quality level
Agricultural balance cover rate (in percentage)
Various types of irrigation
New installed capacities in 2012
Global Integrity note on anti-corruption and the Rule of law
Execution of contracts: number of procedures, cost and time frame
Settlement of outstanding debts: time frame, cost and recovery rate
Level of land access difficulty by business size
Ordinary revenue trend (in M MAD)
Tax payment: Time frame (hours per year) and number (per year), Morocco and
comparable countries
Perception by Moroccan firms of taxation rates and the tax administration
List of Tables
17M O R O C C O ’ S G R OW T H D I A G N O S T I C

Table 7.3.4
Table 7.4.1
Table 7.4.2
Table 7.5.1
Table 7.5.2
Table 7.6.1
Table 7.6.2
Table A6.1
Transition matrix relative to business size
Country labour market efficiency ranking
Optimum business size in number of employees desired, expressed in percentage of
number of current employees
“Fondation Heritage” economic freedom indicator (Morocco and comparable
countries, 2013)
Governance indicators (2013)
Morocco’s trade agreements
Morocco’s tariff profile
Reduction of the current balance of payment deficit
M O R O C C O ’ S G R OW T H D I A G N O S T I C18

List of BoxesBox 4.1
Box 4.2
Box 4.3
Box 7.2.1
Box 7.3.1
Box 8.1
Ongoing transport infrastructure projects
Main electricity sector projects since 1990
Objectives of the PNA
Typology of Public Land in Morocco
Main Tax Reforms in Morocco
Tanger Free Zone: A Zone of the Future
19M O R O C C O ’ S G R OW T H D I A G N O S T I C

M O R O C C O ’ S G R OW T H D I A G N O S T I C20
List of Acronyms
AfDBAMDI ANPME ANRTATMBPW CDGCDSCEREDCGEM CILCCCMI CNEFCNSSCPCCTDCFTADCTDEPFMADDWSEBAEFTASUTEUIDFFDIGAFTAGATTGDPGFCFHCPUMICHSTICTIMFITLMIC
African Development Bank Moroccan Investment Development Agency National SME Promotion AgencyNational Telecommunications Regulatory AgencyAsynchronous Transfer Mode Building and Public WorksDeposit and Management FundCredit Default SwapCentre for Demographic Studies and Research General Confederation of Moroccan Enterprises Inter-ministerial Anti-Corruption CommissionMoroccan Innovation CentreNational Education and Training CharterNational Social Security Fund Civil Procedure CodeCorporate taxDeep and Comprehensive Free Trade AgreementDomestic Consumption TaxDirectorate of Studies and Financial ForecastsMoroccan DirhamDrinking Water SupplyExternal Balance AssessmentEuropean Free Trade AssociationSupply and Use TablesEuropean UnionIndustrial Development FundForeign Direct InvestmentsGreater Arab Free Trade AreaGeneral Agreement on Tariffs and TradeGross Domestic ProductGross Fixed Capital FormationHigh Commission for PlanningUpper Middle-Income CountryHigh-Speed TrainInformation and Communication TechnologiesInternational Monetary Fund Income Tax Lower Middle-Income Country

21M O R O C C O ’ S G R OW T H D I A G N O S T I C
MCCMEDAMENAMMEIMRAMSCINTMOCPOECDOHIONEE
PEIPIRLSPISAPMNPNAPNAZI PNEIPPP PRESIMO
RAMEDSMAEX
SMETFPTIMMSTOEAME UNCTADUNDPUSAVATVSEWAEMUWDIWTOTFZ
Millennium Challenge CorporationSME Modernization ProgrammeMiddle East and North Africa Metallurgical, Mechanical and Electromechanical IndustriesMoroccans Residing AbroadMorgan Stanley Capital International IndexNon-Tariff MeasuresMoroccan Phosphates Authority (Office Chérifien des Phosphates)Organization for Economic Cooperation and DevelopmentObligatory Health InsuranceNational Electricity and Drinking Water Authority (Office National del’Electricité et de l’Eau Potable)Public Enterprises and InstitutionsProgress in International Reading Literacy StudyProgramme for International Student AssessmentUpgrading ProgrammeNational Liquid Sanitation and Wastewater Treatment Programme National Industrial Zone Development ProgrammeNational Pact for Industrial EmergencePublic Private PartnershipMacroeconomic Forecast and Simulation Model (Modèle macro-économique de Prévision et simulation modèle)Medical Assistance SchemeMoroccan Export Insurance Company (Société Marocaine d'Assuranceà l'Exportation)Small and Medium-sized EnterprisesTotal Factor ProductivityTrends in International Mathematics and Science StudyTonnes-Oil-EquivalentArab Maghreb UnionUnited Nations Conference on Trade and DevelopmentUnited Nations Development ProgrammeUnited States of America Value Added TaxVery Small EnterpriseWest African Economic and Monetary UnionWorld Development IndicatorsWorld Trade OrganizationTangier Free Zone

23M O R O C C O ’ S G R OW T H D I A G N O S T I C
This work is the result of the joint commitment of the Government of the Kingdom of Morocco,
the African Development Bank (AfDB) and the Millennium Challenge Corporation (MCC).
The Government expressed the wish to have an objective diagnostic analysis of economic
growth focused on the main constraints preventing it from being as strong, sustainable and
inclusive as desired, with a view to adjusting its economic policies accordingly and introducing
the necessary reforms aimed at removing or, at least, alleviating these constraints.
The AfDB, one of Morocco’s leading donors, responded to the Government’s request by
conducting this diagnostic prior to the launching of preparatory works for the second program
of cooperation with the MCC (Compact II). This will consolidate its financial commitment
to Morocco through a high quality scientific contribution which will also help to inform the
direction of its own operations in the country as well as those of other donors by identifying
the areas in which it would be most appropriate and most opportune to intervene.
The MCC, which advocates poverty reduction through economic growth, has learnt lessons
from the first generation of assistance programs (Compact) that it financed in Morocco and
other countries. In the Second Compact for which Morocco is eligible, it intends to act, in
partnership with the Government, based on a comprehensive analysis of the major constraints
to growth, where its intervention could have the most significant positive spin-off benefits for
growth and the reduction of poverty and inequalities.
In light of the foregoing, the three partners collaborated in the preparation of the growth
diagnostic for Morocco by using a recognized empirical method, the HRV, from its authors
Haussmann, Rodrik and Velasco of Harvard University. This methodology makes a systemic
analysis of production factors and business climate conditions to identify the key obstacles
to private investment and growth. This approach results in the identification of the main
existing constraints, which should first be tackled in order to boost investment and growth.
It should be indicated that, in addition to applying the above-mentioned method, broad-based
consultations were conducted with the Ministerial Departments and public institutions concerned,
the private sector, academia and civil society.
Preface

M O R O C C O ’ S G R OW T H D I A G N O S T I C24
While taking part actively in the consultations and providing the team responsible for drafting
the report with the required data, the Government, with its two partners, wanted the report
to be drafted with maximum objectivity and scientific rigor.
This report, even before its publication, achieved one of the first objectives, namely
determining the potential sectors in which MCC support could be focused under Compact II.
However, much more is still expected from it, namely serving as a platform for broad-based
discussion on the report’s different themes. All stakeholders (universities, private sector,
public sector, civil society, mass media, etc.) should assimilate the contents of this work,
criticize it, enrich it and make proposals that can help to fulfill the conditions for strong,
sustainable and inclusive growth, that is, at the service of all social classes and categories
from all the regions of the country, especially the least privileged ones.
25M O R O C C O ’ S G R OW T H D I A G N O S T I C
Consultative Process
Broad-based consultations: a participatory process which enriched the analysis of constraintsto growth and confirmed its conclusions
The study of constraints to growth in Morocco is the result of a detailed analysis conducted
according to the HRV growth diagnostic approach, complemented by a process of
broad-based consultations with the parties concerned at the central, regional and local
levels. This approach sought to ensure, from the parties consulted, that the issues likely to be
an obstacle to growth were duly taken into account, provide useful clarifications on various
points of view in the analysis and encourage dynamic interaction with the team in charge of
the study throughout its preparation so that the relevant conclusions could be widely shared,
as the best way of ultimately guaranteeing their collective ownership.
Consequently, immediately after setting up the team responsible for working on the report,
several workshops were organized in Rabat from 18 to 22 September 2013. These work-
shops laid the groundwork by immediately raising relevant issues that could help to identify
the constraints to growth in particular, in the areas of infrastructure, investment financing,
human capital and micro and macroeconomic distortions, etc. These workshops were
facilitated by representatives from the Ministries concerned, certain important public institutions
and establishments, the private sector and academia as well as representatives of the
Presidency of the Government, the MCC and the AfDB.
This stage also provided an opportunity to identify and mobilize information sources that
would make available all the necessary documents and data to the report preparation team.
It enabled the team to conduct in-depth empirical investigation work that, starting from
November, resulted in the report’s first conclusions identifying major constraints to economic
growth in Morocco.
It was, therefore, necessary to organize a second consultation in order to subject these
conclusions to a critical examination by experts and high-ranking officials representing the
administration and relevant public and private institutions as well as renowned academics. This
was done on 13 and 14 November 2013. The high-level debates that took place on this
occasion helped to enrich the reflection on the various constraints to growth by presenting

M O R O C C O ’ S G R OW T H D I A G N O S T I C26
tangible facts drawn from the experience of participants, qualifying certain conclusions and
helping the team to incorporate data that had not been adequately taken into account, in
order to reflect reality and then make better justified conclusions.
Thus, the November consultations helped the team to gather considerable information and
guidelines to be able to complete the work, which contributed to facilitating the finalization of
the first draft of the report towards early January 2014.
A new phase of consultations then began from 20 to 29 January 2014, and was expanded
to include other key stakeholders such as civil society organizations, employers’ organizations,
certain decentralized public institutions, technical and financial partners and resource
persons known for their expertise in the various areas covered by the report. The goal was
to compare the findings of the study conducted with the points of view expressed by the
different interlocutors at the national, regional and local levels in order to validate, reject or
qualify them.
Despite the local and sector differences expressed during these consultations that laid
emphasis, at times, on certain difficulties that are specific to a particular region or sector, it was
observed that the report’s conclusions were widely confirmed by most interlocutors, who
even reinforced them by mentioning concrete examples of obstacles affecting investment
and, therefore, growth.
Furthermore, alongside the analysis of constraints to growth, a study was conducted on
social and gender constraints in Morocco and gave rise to a seminar held in Rabat on 20
and 21 January 2014. This event provided an opportunity as it brought together various
stakeholders, including, in particular, the Ministries concerned and civil society organizations
to discuss various themes related to this specific report. Since there are close links between
social and gender issues and the various factors determining the trend of economic growth
such as human capital, justice and infrastructure. Consultations on the above-mentioned
report also contributed, to a large extent, to enhancing and enriching the analysis of the
constraints to growth.
Even though the report on the analysis of constraints does not claim to reflect all the
richness and diversity of the discussions that arose from these broad-based consultations, it
may be stated that the essence of the ideas expressed is reflected in the contents of this
document.

27M O R O C C O ’ S G R OW T H D I A G N O S T I C
It is also worth pointing out that the interactive process of consultations between the AfDB,
MCC and Presidency of the Government teams and, through the latter, the various Moroccan
Ministries concerned, continued even after the submission of the pre-final draft of the report,
reviewed in light of the above-mentioned consultations. This stage was useful in providing
the final clarifications and details required to finalize the document based on reliable data and
meeting the requirements of rigorous analysis.
The consultative process had two essential outcomes: first, it helped to ensure that the analysis
of constraints to growth was not a simple intellectual exercise carried out in a vacuum by
experts, but rather it is a transparent interactive process between the team responsible for the
work and economic and social actors and the institutions responsible for regular monitoring
of economic activity in the country, making it possible to validate and give more weight to the
results of the analysis; second, these consultations fostered real ownership of the study and
its results by all participants, including the public administration. This ownership will certainly
have a positive effect on the design and implementation of the subsequent policies and measures
aimed at removing, or at least alleviating the main constraints to growth.
A non-exhaustive list of organizations consulted is attached in annex (Annex 1.1) in order to
provide a more accurate idea of the extent of the consultations held throughout the report’s
preparation.
M O R O C C O ’ S G R OW T H D I A G N O S T I C28
Executive Summary
Introduction
Over the last decade, Morocco embarked
on an important reform process in order
to ensure an in-depth transformation of
its economic and social model. Taking into
account the challenges to be addressed,
these reforms successfully tackled macro-
economic stability, institutional efficiency,
international integration of the economy,
industrial development, youth and women’s
employment, social cohesion and poverty
reduction.
These reforms helped to generate
sustained growth rates (5% on average
over the last ten years). During the first
decade of 2000, Morocco’s economic
growth volatility decreased, indicating a
convergence of macroeconomic dynamics
towards sustainable growth paths. This period
was marked by a substantial reduction in
public debt and a low inflation rate (1.9% in
2013). Thus, the slow growth observed in
the 1990s was largely offset.
This growth has contributed to a significant
drop in absolute poverty and unemployment
in Morocco. Thus, the poverty rate fell
from 15.3% in 2001 to 9% in 2007. The
unemployment rate dropped from 13.4% in
2000 to 9% in 2013. There was a marked
improvement in access to educational services,
health services, drinking water and rural
roads, contributing to the improvement of
human capital and the population’s living
standards.
This progress was made in a context
of economic openness in Morocco. The
country signed agreements with the EU
in 2000 and the USA and Turkey in 2006
and with many countries of the sub-region
(AMU, Agadir Agreements, GAFTA). Morocco
became the only country in the region to
have signed an advanced status agreement
with the European Union and actively forged
closer economic ties with Sub-Saharan
Africa. Nevertheless, foreign trade remains
a weak point of the Moroccan economy.
Exports are geographically concentrated
and show a lower than-expected growth.
Due to commodity price trends, the growth
in energy imports since 2009 and resumption
of food imports since 2007 negatively impact
on the trade balance.
One of the paradoxes of the Moroccan
economic model is the fact that, although
the country has one of the highest
investment rates in the world (31.7% of
GDP in 2012), the growth rate remains
below expectations and is driven by private
and public consumption. In the last ten

29M O R O C C O ’ S G R OW T H D I A G N O S T I C
years, Morocco has become one of the
main destinations of foreign direct investment
in the MENA region. Nevertheless, foreign
direct investment inflow remains structurally
limited compared to those received by
comparator countries. This paradox can be
explained by the fact that the increase in
total factor labor productivity increased
at a relatively lower pace and that the
investments have been undertaken in sectors
known for low value added.
Ensuing from this first paradox, the second
paradox is the economy’s lack of structural
transformation and low industrialization.
Regarding production, the breakdown of
value added by sector shifted slightly
towards services but has not evolved
significantly since the nineteen eighties;
agriculture still occupies an important
position in wealth creation. Investments
are undiversified and are increasingly
concentrated in mechanical and electrical
industries, as well as in the building and
construction sector, which are high importers
of intermediate consumption. Value chains
are consequently undeveloped and the
innovation process has slowed down.
The third paradox is the fact that the
private sector is not sufficiently dynamic
and lacks small and medium-sized
enterprises (“missing middle”), which is the
private sector component that tends to show
the greatest innovation in other countries.
The rest of the economy is made of suboptimal
firms with unproductive activities (often in the
informal sector) and characterized by low
profits.
Despite the progress made, significant
development challenges remain and
only stronger private sector-driven
growth will be able to address them.
Absolute poverty has dropped sharply, but
economic vulnerability is still a concern. Youth
unemployment is relatively high and social
protection coverage is limited. Access to
education has increased remarkably, but the
illiteracy rate (39% of the total population
aged 10 years and above, 50% of rural
people and 65% of rural women) and gender
disparities in secondary education are still
highly significant. The results in terms of
education and learning quality are far behind
those of countries with similar income and
the mismatch between labor market supply
and demand is increasingly significant.
In this regard, this study seeks to define
the obstacles hampering private investment
in Morocco and blocking its economy’s
structural transformation, despite the
reforms undertaken. It is based on the
assumption that private sector investment
and entrepreneurship are, generally, the
sources of sustainable and inclusive
economic growth.
The methodology adopted in this report
has the advantage of clearly identifying
the major constraints to private investment

M O R O C C O ’ S G R OW T H D I A G N O S T I C30
in Morocco and emphasizing the priority
obstacles to be overcome within the
framework of a more efficient medium and
long-term development strategy. The results
of this study will be very useful in light of the
present context of the Moroccan economy
(an economy experiencing major economic
and institutional reforms) and will help to
define the key reform thrusts that will help to
achieve steady and higher growth rates and
greater social inclusion.
Methodology
This study is based on the growth diagnostic
methodology proposed in 2005 by Ricardo
Hausmann, Dani Rodrik and Andrès
Velasco (HRV). This methodology assumes
that all countries must face a wide range of
economic and development challenges.
Reforms and investments are constrained
by a) the government’s implementation
capacities, b) the policy space and c)
available financial resources. The most
efficient method of boosting growth
consists then in the prior alleviation of the
difficulties which limit it the most. Since it is
impossible to quantify all the direct and
indirect effects linked to overcoming
a given growth constraint, the fact of
surmounting the seemingly most restrictive
obstacles could be the simplest way of
maximizing the impact of public action
on growth.

31M O R O C C O ’ S G R OW T H D I A G N O S T I C
Growth Diagnostic Tree According to HRV
Natural Capital
Human Capital
Infrastructures
Low Savings
Costly Intermediation
What Constrains Private Investment and Entrepreneurship?
Low private Returns to EconomicActivities
Marco Risks
Micro Risks
Low SocialReturns
High Coast of Finance
Costly LocalFinance
Costly ForeignFinance
Market Failures
Low PrivateAppropriability
Source: HRV (2005)
In order to identify the “constraints
to growth” which decision-makers
must first address, the authors prepared
a “diagnostic tree”. The diagnosis is based
on two simple and fairly uncontroversial
proposals.
First, it is assumed that private investment
and entrepreneurship – the process
of identifying profitable trade outlets,
improvements in productivity and innovation,
as well as the use of resources to create
value, are the main engines of sustained
economic growth. The level and type of
investments depend mainly on the prospect
of adequate returns for the investor, in
light of the financing risks and costs. To
understand the reasons for inadequate
growth and private investment, it is, therefore,
necessary to analyze the factors affecting
returns and the difficulties faced by private
entrepreneurs.
The second fundamental aspect taken
into account in this empirical method
is that poor economic performance – for
instance, low levels of investment,
consumption, employment or credit can
arise from limited supply or demand
for a given factor/good/service.
M O R O C C O ’ S G R OW T H D I A G N O S T I C32
Hausmann, Klinger and Wagner (2008)
propose four “tests” to determine the
existence of a potential obstacle:
Type 1 Test: Ascertain whether the shadow
price of the constraining factor is high1;
Type 2 Test: Ascertain whether changes in
the availability of a constraining factor are
correlated with changes in investment or
growth;
Type 3 Test: Determine whether economic
agents are incurring costs or risks to bypass
the constraint;
Type 4 Test: Determine the number of firms
that do not rely heavily on the constraining
factor. This is known as the “camels and
hippos” test, by analogy to the expectation
that hippos will rarely be observed in an
environment lacking water; rather one
expects to see firms that have adapted
to existing conditions, like camels in the
desert (water being the constraining factor
in this case).
The HRV framework calls for a diagnostic
approach starting at the top of the tree.
Therefore, the first question asked is whether
private investment and entrepreneurship are
primarily limited by (i) a high cost of finance
arising from financial market constraints
accompanied by high investment demand;
or by (ii) weak investment demand by potential
entrepreneurs, who see few opportunities
to earn an adequate return, either because
of a) lack of factors of production (human
capital, national resources, infrastructure)
or b) excessively high macro or micro
economic risks. Depending on the answer
to this question, the diagnostic study then
identifies the source of the problem, i.e. high
financing costs or low returns on private
investments.
In order to assess whether a factor
of production is an impediment often
requires comparing the economy with
those of other countries. To be informative,
the comparison should retain countries
which, from an economic standpoint i) were
comparable to Morocco in 1960, ii) are
comparable to Morocco in 2013 iii) are
sources of inspiration. To this end, Tunisia,
Chile, Indonesia, Romania, Turkey and
Malaysia were chosen as comparators for
Morocco. In some cases, aggregate data
from higher middle-income or lower middle-
income countries were used.
1 A shadow price is the marginal value for the economy of an additional unit of the factor.

33M O R O C C O ’ S G R O W T H D I A G N O S T I C
Major Constraints to Growth inMorocco
The application of the growth diagnostic
methodology framework (HRV), described in
the preceding paragraph, highlighted two
major constraints to private sector-driven
growth:
• Human Capital: access to education
and quality of the educational system
Morocco’s educational and training system
is the weak link in the development of
its human capital. Despite the considerable
efforts being made by the Moroccan
government, secondary and higher education
enrolment rates remain low. The average
length of schooling is lower than the average
of countries with the same income level. This
situation results in a labor force with poor
general and specific skills, as pointed out by
many private sector actors.
These conclusions are drawn from i) low
returns to education; ii) Morocco’s weak
performance in education and training;
and iii) poor results of Moroccan students
in international tests. Indeed, those who
can afford it turn to private education and
enrolment rates in private schools are
increasingly high (especially in secondary
education). This situation negatively impacts
the development of sectors dependent
on skilled labor, whose value added has
declined.
• Microeconomic Risks: a slow legal
system, distortion in the taxation
system, difficult land access and
constraining labor market regulation
The analysis leads to the conclusion that
microeconomic risks are a major constraint
to private investment development in
Morocco. Weak ownership of the return on
economic activity often arises from the failure
of government policies and institutions which
creates microeconomic risks and distortions,
reduces returns on private investments and
slows down economic growth. In the case of
Morocco, these microeconomic distortions
and weaknesses have become a major
constraint to economic growth and impacted
private investment. Thus, the sluggish judicial
system (especially in the enforcement of
court rulings), increasingly difficult access to
land, distortions in the taxation system and
labor market regulation represent major
challenges to be addressed by the Moroccan
Authorities.
Morocco’s judicial system is constraining
and does not facilitate economic activities.
Despite the reforms undertaken during the
last decade to modernize and strengthen its
institutional framework, the system remains
sluggish in the implementation of procedures
and decisions, which has encouraged
Moroccan and foreign firms to avoid using the
judicial system. Recognizing the importance
of this factor in the development of the country’s
economic activity, the government is now

M O R O C C O ’ S G R O W T H D I A G N O S T I C34
undertaking structural reforms to ensure a
more efficient and modern legal system that
will encourage private investment and build
investor confidence.
The analysis also noted that access to
agricultural and industrial land is a
major constraint to private investment
development in Morocco. Access to land
(industrial and agricultural) is increasingly
difficult, especially because of the complex
land tenure system and the diversity of
land management regulations. The State’s
decreasing land reserves have reduced the
availability of useful land for investment.
In the agricultural sector, the land tenure
issue is responsible for the low yields of
agricultural plots owing to limited land
registration and issues of joint ownership
and fragmentation. In the industrial sector,
the unavailability of adequate industrial land
that meets the needs of firms seems to
be the most constraining factor. This is
due to land development decisions and the
configuration of areas that do not match
the actual needs of investors, the inadequate
capacity of the land administration, and
above all lack of coordination.
The taxation system remains a constraint
and it prevents efficient allocation of
investments despite the efforts made to
simplify and establish a fair, visible and
coherent system. Morocco’s taxation rates
are not excessive and are comparable to
those of comparator countries like Tunisia.
However, Moroccan entrepreneurs still
consider taxation as a very heavy burden
and an obstacle to the development of their
activities. Successive changes and reforms
have left the system subject to multiple
interpretations and it has, therefore, become
less transparent. There are ongoing reforms
which could have a positive impact on the
business environment in Morocco.
Labor regulation and cost appear to be a
major constraint to private investment in
Morocco. According to international rankings,
Morocco is among the countries that have a
particularly rigid labor code. Firms are often
unwilling to comply, which explains the high
number of strikes per year
• Ensuing Risks and Potential Obstacles
In addition to the two main obstacles that
have just been mentioned, the analysis
highlighted the existence of market
innovation and coordination weaknesses.
The sophistication of Moroccan exports
is limited in relation to its level of income
per capita, and structural transformation
results remain relatively modest compared
to those of comparator countries. Government
policies aimed at encouraging innovation
are generous. However, there is still a lack of
coordination between public (agencies and
ministries) and private (within value chains)
sector actors and between the public and
private sectors (e.g. promotion of trade
agreements).

35M O R O C C O ’ S G R OW T H D I A G N O S T I C
Finally, the analysis also highlighted the
need to improve access to various health
services and infrastructure in rural and remote
areas and to improve the management of
scarce resources (water and energy). Indeed,
even though they are not currently constraining,
these problems could worsen and must be
taken into account during the formulation of
a sustainable economic model, from both
a social and environmental standpoint.


Chapter 1
Overview of the Moroccan Economy

Chapter 1: Overview of the Moroccan Economy
Key messages
• The economic policies implemented in Morocco since the end of the structural adjustment
program have to a certain extent succeeded in achieving macroeconomic stability,
institutional efficiency, integration into the international economy, industrial development,
employment, social cohesion and poverty reduction.
• During the first decade of the 2000s, growth accelerated and its volatility decreased,
as in most of the comparator countries, indicating a convergence of macroeconomic
dynamics towards sustainable growth paths. Thus, the slow growth observed before
the 2000s was largely offset.
• The sector distribution of value added since the early eighties shifted slightly towards
services and has not evolved significantly with agriculture still accounting for a relatively
high share of GDP.
• Growth is still driven by private and public consumption, and investments, which were
expected to accelerate growth, have remained concentrated in sectors that create
little value added. Investment in Morocco is characterized by the high share of public
enterprises in capital formation, low level of diversification and its growing concentration
in mechanical and electrical industries and the construction sector.
• Foreign direct investment (FDI) inflows have been fairly low in relation to the comparator
countries. However, in recent years, Morocco has enjoyed relatively strong FDI growth.
• Foreign trade remains one of the Moroccan economy’s weak points. Exports are
geographically concentrated and their growth falls short of their potential. The rise in
imports of energy products since 2009, and the resumption of food product imports
since 2007, are affecting the trade balance as a result of rising raw material prices and,
indirectly, the subsidy policy pursued by the Moroccan government (policy being revised
since mid-2013).
• As far as competitiveness is concerned, growth is characterized by the low contribution
of total factor productivity. By sector, the calculation of total factor productivity (TFP)
between 2000 and 2012 indicates higher productivity in the metallurgical, mechanical
and electromechanical industries (MMEI), a sharp decrease in extractive industries and
stagnation in the other sectors.
• The private sector is sluggish: relatively large size of the informal sector, the absence of
medium-sized enterprises due to the difficulty faced by SMEs in expanding and the low
level of innovation are indicators of the private sector’s sluggishness.
M O R O C C O ’ S G R OW T H D I A G N O S T I C38

• The unemployment rate fell steadily during 2000 – 2012, from 13.4% in 2000 to 9% in
2012. Nevertheless, growth-related job creation did not benefit all the age groups and
could not absorb the influx of new graduates. Thus, the unemployment rate for young
men rose again after 2003 and for young women from 2006. There are also very wide
regional employment disparities which must be taken into consideration in order to
maintain social cohesion.
• Between 2001 and 2007, the poverty rate dropped from 15.3% to 9% and vulnerability
from 22.8% to 17.5%. Despite the significant progress made, the persistence of poverty
and vulnerability is an indicator of the non-inclusive nature of economic growth.
39M O R O C C O ’ S G R OW T H D I A G N O S T I C

M O R O C C O ’ S G R OW T H D I A G N O S T I C40
Introduction
Morocco has experienced relatively
steady growth over the last fifty years,
which has resulted in the tripling of per
capita income. Since the late eighties, per
capita GDP growth has accelerated to an
annual average of 3.2%.
However, while they may be satisfactory
over the long term, the Moroccan economy’s
growth rates are below those of many
emerging countries. The growth rates
recorded also fall far short of the country’s
growth potential. In addition, the growth
model adopted by the country has shown
limitations that need to be identified and
addressed in order to ensure more stable,
qualitative and inclusive growth.
Before examining these limitations in the
second section of this chapter, the first
section will look at the main public policies
that have made a major contribution to the
continuing improvement of the investment
environment and to developing a private
sector that will fully play its role as an engine
for economic growth in Morocco.
1.1 Economic Policies in Support ofGrowth
Since independence, Morocco has
implemented various public policies to
promote economic growth, first by relying
on the public sector, in the absence of a
viable and efficient private sector, and then
by gradually providing the latter with the means
to grow stronger and play a more significant
role in the process of wealth creation.
Ambitious reform programs implemented
since the nineties have sought to reconcile
economic liberalization, poverty reduction
and human capital development. These
reforms were undertaken in the wake of the
economic policies implemented under the
Structural Adjustment Program (1983-1993),
the priority of which was to restore macro-
economic stability. Concomitantly, many
economic, institutional and legal reforms
were implemented. These reforms accelerated
Morocco’s integration into the global economy,
strengthened the country’s attractiveness
to investors and improved the effectiveness
of public interventions.
1.1.1 Stabilization of Macroeconomic Balances
The macroeconomic stability objective
was achieved in the late 90s. The budget
deficit was reduced from 10.1% of GDP in
1980 to 3.5% in 1990. In 1999, public
finances recorded a surplus of 0.9% of GDP.
Inflation was brought down from 3.9% in
1989 to 0.7% in 1999. Overall debt fell from
104.7% of GDP in 1990 to 91% in 1999
and the external debt stock dropped from
77.9% of GDP in 1990 to 51.4% in 1999.
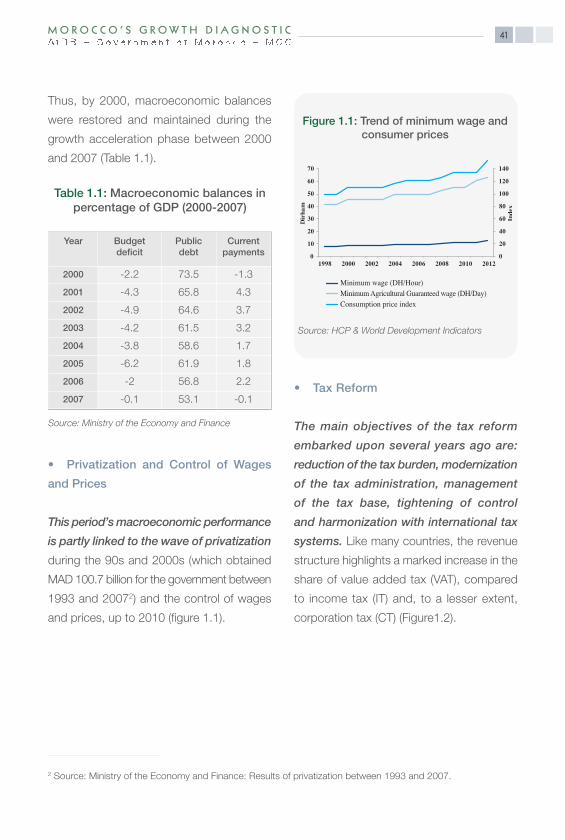
Thus, by 2000, macroeconomic balances
were restored and maintained during the
growth acceleration phase between 2000
and 2007 (Table 1.1).
• Privatization and Control of Wages
and Prices
This period’s macroeconomic performance
is partly linked to the wave of privatization
during the 90s and 2000s (which obtained
MAD 100.7 billion for the government between
1993 and 20072) and the control of wages
and prices, up to 2010 (figure 1.1).
• Tax Reform
The main objectives of the tax reform
embarked upon several years ago are:
reduction of the tax burden, modernization
of the tax administration, management
of the tax base, tightening of control
and harmonization with international tax
systems. Like many countries, the revenue
structure highlights a marked increase in the
share of value added tax (VAT), compared
to income tax (IT) and, to a lesser extent,
corporation tax (CT) (Figure1.2).
41M O R O C C O ’ S G R OW T H D I A G N O S T I C
Year Budgetdeficit
Publicdebt
Currentpayments
2000 -2.2 73.5 -1.3
2001 -4.3 65.8 4.3
2002 -4.9 64.6 3.7
2003 -4.2 61.5 3.2
2004 -3.8 58.6 1.7
2005 -6.2 61.9 1.8
2006 -2 56.8 2.2
2007 -0.1 53.1 -0.1
Table 1.1: Macroeconomic balances inpercentage of GDP (2000-2007)
Source: Ministry of the Economy and Finance
Figure 1.1: Trend of minimum wage andconsumer prices
Source: HCP & World Development Indicators
2 Source: Ministry of the Economy and Finance: Results of privatization between 1993 and 2007.
020406080100120140
010203040506070
1998 2000 2002 2004 2006 2008 2010 2012
Inde
x
Dirh
am
Minimum wage (DH/Hour)Minimum Agricultural Guaranteed wage (DH/Day) Consumption price index
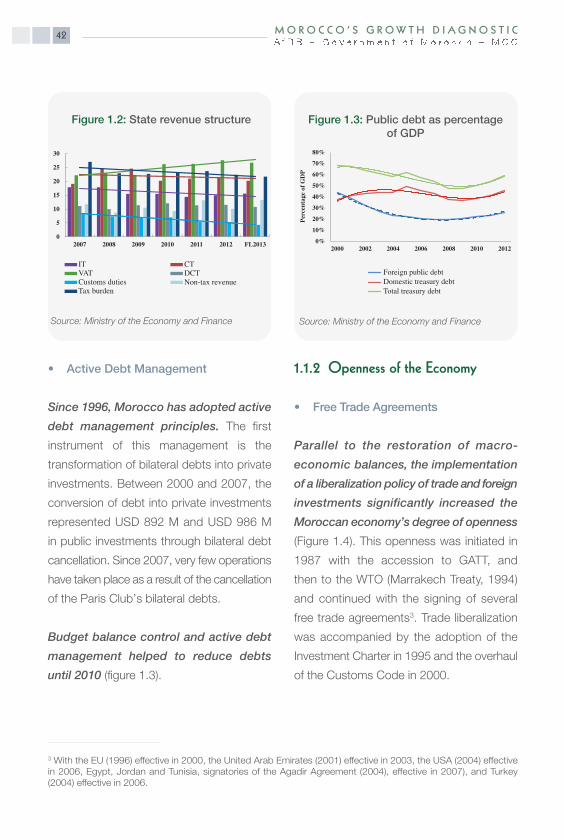
• Active Debt Management
Since 1996, Morocco has adopted active
debt management principles. The first
instrument of this management is the
transformation of bilateral debts into private
investments. Between 2000 and 2007, the
conversion of debt into private investments
represented USD 892 M and USD 986 M
in public investments through bilateral debt
cancellation. Since 2007, very few operations
have taken place as a result of the cancellation
of the Paris Club’s bilateral debts.
Budget balance control and active debt
management helped to reduce debts
until 2010 (figure 1.3).
1.1.2 Openness of the Economy
• Free Trade Agreements
Parallel to the restoration of macro-
economic balances, the implementation
of a liberalization policy of trade and foreign
investments significantly increased the
Moroccan economy’s degree of openness
(Figure 1.4). This openness was initiated in
1987 with the accession to GATT, and
then to the WTO (Marrakech Treaty, 1994)
and continued with the signing of several
free trade agreements3. Trade liberalization
was accompanied by the adoption of the
Investment Charter in 1995 and the overhaul
of the Customs Code in 2000.
M O R O C C O ’ S G R OW T H D I A G N O S T I C42
05
1015202530
2007 2008 2009 2010 2011 2012 FL2013
IT CTVAT DCT
Non-tax revenueCustoms dutiesTax burden
Source: Ministry of the Economy and Finance
0%10%20%30%40%50%60%70%80%
2000 2002 2004 2006 2008 2010 2012
Perc
entag
e of G
DP
Foreign public debtDomestic treasury debtTotal treasury debt
Source: Ministry of the Economy and Finance
Figure 1.3: Public debt as percentageof GDP
Figure 1.2: State revenue structure
3 With the EU (1996) effective in 2000, the United Arab Emirates (2001) effective in 2003, the USA (2004) effectivein 2006, Egypt, Jordan and Tunisia, signatories of the Agadir Agreement (2004), effective in 2007), and Turkey(2004) effective in 2006.

Up to 2007, trade liberalization, privatization
and active debt management accelerated
FDI flows as shown in figure 1.5.
This openness has also resulted in a
change in the market shares of importers
of Moroccan goods and suppliers of
goods and services (Figure 1.6). This
trend, in particular, reduced France’s
market dominance and resulted in a
higher contribution by China to imports. The
same trend is observed for Morocco’s
customers (Figure 1.7).
Openness has also led to an increase
in the volume of trade and in bilateral
trade deficits, showing that the Moroccan
market’s openness has chiefly benefitted
supplier countries and has not yet produced
the expected effects on Moroccan exports.
43M O R O C C O ’ S G R O W T H D I A G N O S T I C
50
55
60
65
70
75
80
85
90
1997 1998 1999 2000 2001 2002 2003 2004 2005 2006 2007 2008 2009 2010 2011 2012
Perc
enta
ge: (
X+M
)/GD
P
Source: World Development Indicators (WDI)
Figure 1.5: Net external position chart
-150
-100
-50
0
50
100
150
2002 2003 2004 2005 2006 2007 2008 2009 2010 2011
Perc
entag
e of t
otal
Direct investments Portfolio investmentsOther investmentsNet external position (% GDP)
Reserve assets
Source: Ministry of the Economy and Finance
Figure 1.4: Trend of the economy’sopenness level
0 5
10 15 20 25 30
2000 2001 2002 2003 2004 2005 2006 2007 2008 2009 2010 2011 2012
Perce
ntage
of im
porta
tions
France Spain ItalyGermany USA China Saudi Arabia
Source: Ministry of the Economy and Finance
Figure 1.6: Origin of imports
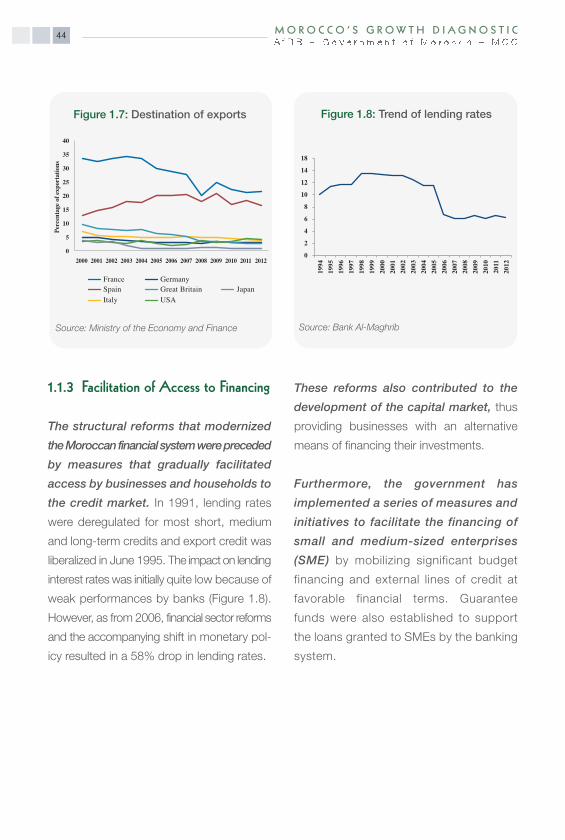
1.1.3 Facilitation of Access to Financing
The structural reforms that modernized
the Moroccan financial system were preceded
by measures that gradually facilitated
access by businesses and households to
the credit market. In 1991, lending rates
were deregulated for most short, medium
and long-term credits and export credit was
liberalized in June 1995. The impact on lending
interest rates was initially quite low because of
weak performances by banks (Figure 1.8).
However, as from 2006, financial sector reforms
and the accompanying shift in monetary pol-
icy resulted in a 58% drop in lending rates.
These reforms also contributed to the
development of the capital market, thus
providing businesses with an alternative
means of financing their investments.
Furthermore, the government has
implemented a series of measures and
initiatives to facilitate the financing of
small and medium-sized enterprises
(SME) by mobilizing significant budget
financing and external lines of credit at
favorable financial terms. Guarantee
funds were also established to support
the loans granted to SMEs by the banking
system.
M O R O C C O ’ S G R OW T H D I A G N O S T I C44
02468
10121418
1994
1995
1996
1997
1998
1999
2000
2001
2002
2003
2004
2005
2006
2007
2008
2009
2010
2011
2012
Source: Bank Al-Maghrib
Figure 1.8: Trend of lending rates
0
5
10
15
20
25
30
35
40
2000 2001 2002 2003 2004 2005 2006 2007 2008 2009 2010 2011 2012
Perce
ntag
e of e
xpor
tation
s
FranceSpainItaly
GermanyGreat BritainUSA
Japan
Source: Ministry of the Economy and Finance
Figure 1.7: Destination of exports

45M O R O C C O ’ S G R OW T H D I A G N O S T I C
Similarly, action was taken to financially
back and support young entrepreneurs,
especially young graduates. Thus, a
microcredit policy was promoted by the
public authorities to provide the rural and
peri-urban poor with access to financing
for small income-generating projects.
1.1.4 Growth and Employment-OrientedIndustrial Policy
To address the private sector’s weakness
in the wake of independence, the Public
Authorities created public enterprises and
assigned them the mission of establishing
an industrial base in sectors as diverse
as phosphates, textiles, cement, tobacco,
agribusiness, oil refining etc.
Throughout the 60s and 70s, the Government,
aware of the need to strengthen the
private sector to enable it to play its
role of engine for growth, implemented
import-substitution, export promotion and
Moroccanization policies aimed at helping
Moroccan entrepreneurs to take control
of various existing enterprises. These
different policies have undoubtedly helped
to strengthen the Moroccan private sector
and create a relatively diversified productive
base, but the results in terms of growth and
job creation have not met expectations.
The debt crisis of the early 80s and the
Structural Adjustment Programs that were
implemented to lift Morocco out of the
crisis provided opportunities for the
country to change economic policy, in
general, and industrial policy, in particular.
To that end, a liberalization process was
adopted and the State disengaged from most
of its industrial enterprises through privatization,
which benefitted not only foreign investors
but also the Moroccan private sector. Thus,
some public services were transferred to the
private sector, especially in the areas of electric
power generation and water and electricity
distribution. The Law on “Moroccanization”
was abolished and foreign investments were
strongly encouraged by a series of tax and
financial incentives.
However, it was not until the late 90s
that there was a major turning point in
Morocco’s industrial and economic
policy, with the formulation of strategic
plans. Many strategies were launched
such as the Emergency Plan for the industrial
sector, the Green Plan for agriculture, the
National Energy Strategy, the “Plan Azur”
and the Vision 2020 for tourism, the
“Morocco Digital Strategy”4, the Halieutis
Plan for fisheries, Vision 2015 for handi-
crafts and, more recently, the 2014-2020
Industrial Acceleration Plan.
4 National Strategy for Information Society and Digital Economy, 2009-2013.

M O R O C C O ’ S G R OW T H D I A G N O S T I C46
These plans underpinned the growth
acceleration that Morocco has experienced
since the year 2000, owing to the visibility
they offered to investors, the general mobilization
of public and private actors to ensure their
success, and a wide range of resources and
measures to facilitate their execution and the
monitoring of their implementation by the
country’s highest authorities.
However, these sector strategies with
undeniable economic and social impacts
raised the issue of the overall soundness
of sector economic policies. Indeed, the
existence of an overall framework to provide the
required consistency of the above-mentioned
policies and other policies implemented by
the Government would have helped to prevent
duplication, increase synergies and facilitate
coordination among the different stakeholders.
This observation was made on several
occasions during consultations with national
actors and external donors during the
preparation of this report.
1.1.5 Improvement of Physical InvestmentEnvironment
Central government plays a predominant
role in improving the general conditions of
economic activity through infrastructure
development in the areas of roads and
motorways, railways, ports, airports, water
and electricity production and distribution,
etc. In addition, it has stepped up its
interventions in industrial zones and logistic
infrastructure development and the public
training system, which are investments aimed
at creating adequate conditions to enable
businesses to maintain an acceptable
profitability level.
Public enterprises and establishments
thus invested MAD 438 billion between
2008 and 20135. The main public investors
in 2012 and 20136 were the Office Chérifien
des Phosphates (MAD 35 billion); the
National Electricity and Drinking Water
Authority (MAD 18.8 billion); the Savings and
Management Fund (Caisse de dépôt et de
gestion) (MAD 17.9 billion); the Al Omrane
Holding Group (MAD 13.7 billion); the
National Railway Authority (MAD 13.5 billion;
the Tangier Mediterranean Special Agency
(MAD 8.3 billion); and the National Motorway
Company of Morocco (MAD 4.3 billion).
1.1.6 Improvement of Social Cohesion
Social cohesion is a key objective of all
government policies, not only because
cohesion is an end in itself, since it contributes
to the well-being of individuals and the
community, but also because, without it, it
would be difficult to develop a sustained and
lasting activity in a sound and peaceful
5 Report on the public establishments and enterprises sector accompanying the 2014 Finance Law.6 Ibid.

47M O R O C C O ’ S G R OW T H D I A G N O S T I C
environment. In this regard, Morocco has for
several years made human development a
top priority and established instruments
to achieve its set objectives. It is the
case, for example, of the National Human
Development Initiative which targets the
least privileged population in the rural and
the peri-urban areas.
This is also the objective of subsidies
granted by the Government to maintain
affordable prices of basic products for
consumers. Thus, from 2009 to 2013, the
share of the general government budget
allocated to cover the compensation cost
(subsidy cost) increased by 236.8%7 from
MAD 12.5 billion to MAD 42.1 billion, peaking
in 2012 at almost MAD 55 billion. Over the
same period, the accumulated amount of
this cost reached a total of MAD 192.1 billion,
comprising 82.5% for oil products, 10% for
sugar and 7.5% for flour.
While the role of compensation in
maintaining social cohesion is clearly
undeniable, the non-targeting of subsidies
remains a major weakness that the
Government is trying to address. Doing so
should ensure greater equity for this public
action and, at the same time, reduce budgetary
expenditure thereby creating new fiscal
spaces for public investments in priority
sectors. Other instruments were developed
to enhance the efficiency of the Government’s
social actions: (i) the gradual generalization
of Mandatory Health Insurance (MHI), (ii)
the Medical Assistance Scheme (RAMED),
and (iii) the establishment of a system of
compensation for loss of employment.
In the area of employment, several
programs were established to reduce the
unemployment rate, especially for young
graduates: Idmaj (Integration), Moukawalati
(My business), Ta’hil (Qualification) etc.
1.2 A Model Inducing Relatively SustainedGrowth but with Serious Limitations
Since Morocco’s independence, economic
growth has witnessed three distinct
phases: a first phase covering the first two
decades of independence with relatively
high growth rates under the impetus of
economic and social development plans.
As a result, throughout the 70s the average
annual growth rate was 5.4%.
The second phase followed the debt crisis
the country experienced in the early 80s
resulting in a sharp decline in economic
activity in the wake of the structural adjustment
programs which initially impacted on demand
and consequently on the growth rate. The
average annual growth rate during the 90s
did not exceed 2.4%.
7 Source: Ministry of the Economy and Finance.

M O R O C C O ’ S G R O W T H D I A G N O S T I C48
The third phase started in the late 90s
with a strong revival of growth due mainly
to the positive impact of the different reforms
implemented in the preceding years, consolidation
of agricultural value added as a result of more
abundant rainfall, and efforts made to improve
water infrastructure and modernize agricultural
production techniques as well as the improvement
of internal and external macroeconomic balances.
The country achieved an average annual growth
rate of almost 5% during the 2000s.
Morocco, over a long period, achieved
sound performances in economic growth
in relation to comparable, oil importing
countries. The country showed strong
resilience in the face of the 2007 financial
crisis and during the period of political and
social instability that has characterized the
region since 2011. Indeed, despite the strong
pressure of these events on macroeconomic
balances, Morocco achieved a 4.2% average
annual growth rate between 2008 and 2012,
which is a significantly better performance than
that achieved by other countries in the region.
However, this performance should not
conceal the fact that the Moroccan growth
model has reached its limits and that it is
becoming critical to reformulate it in order
to take full advantage of its potential
including, in particular, its demographic
dividend, yet insufficiently tapped and its
openness to the world in particular its
geographic location between one of the
world’s biggest markets, Europe, and a
rapidly growing market, Africa.
Indeed, given the demographic trend,
macroeconomic performances achieved
by the Moroccan economy must be put
in perspective. Morocco’s population grew
annually by 0.69% on average between 1980
and 2011, a rate identical to Tunisia’s and
lower than that of Egypt (0.76%) and Malaysia
(1.06%). Despite a moderate population growth
rate (Figure 1.9), per capita GDP growth8 was
lower than that of all lower middle-income
countries (LMIC). Only Jordan and Romania
obtained a lower per capita growth rate. As
a result, the country’s development lagged
behind until the late 1990s.
3.03.23.43.63.84.04.24.44.64.85.0
Popu
lation
Log
arith
m
Bulgaria Egypt JordanMalaysia Morocco RomaniaSouth Africa Tunisia Turkey Linear (Jordan) Linear (Malaysia) Linear (Tunisia) Linear (Turkey)
Linear (Morocco)
1980
1981
1982
1983
1994
1985
1986
1987
1988
1989
1990
1991
1992
1993
1994
1995
1996
1997
1998
1999
2000
2001
2002
2003
2004
2005
2006
2007
2008
2009
2010
2011
2012
Source: WDI
Figure 1.9: Population growth rate ofMorocco and comparable countries
(1980-2012)
8 In constant dollars.
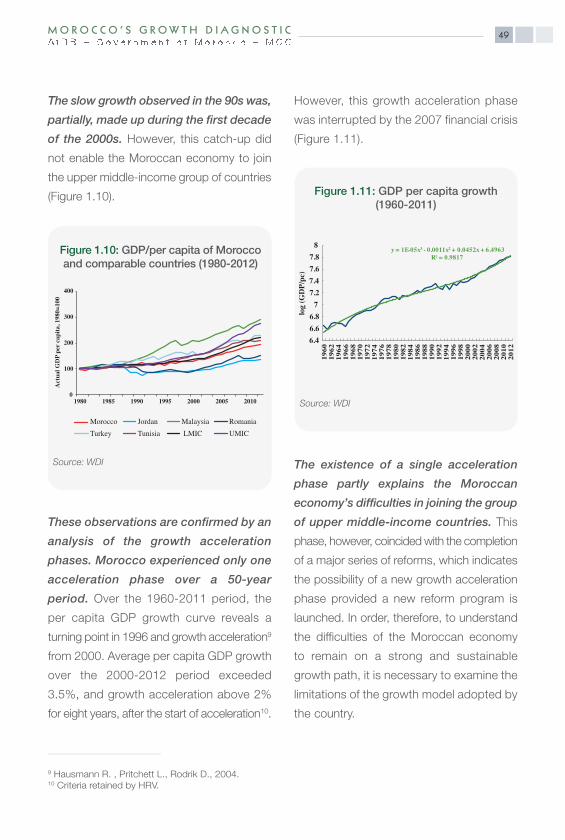
The slow growth observed in the 90s was,
partially, made up during the first decade
of the 2000s. However, this catch-up did
not enable the Moroccan economy to join
the upper middle-income group of countries
(Figure 1.10).
These observations are confirmed by an
analysis of the growth acceleration
phases. Morocco experienced only one
acceleration phase over a 50-year
period. Over the 1960-2011 period, the
per capita GDP growth curve reveals a
turning point in 1996 and growth acceleration9
from 2000. Average per capita GDP growth
over the 2000-2012 period exceeded
3.5%, and growth acceleration above 2%
for eight years, after the start of acceleration10.
However, this growth acceleration phase
was interrupted by the 2007 financial crisis
(Figure 1.11).
The existence of a single acceleration
phase partly explains the Moroccan
economy’s difficulties in joining the group
of upper middle-income countries. This
phase, however, coincided with the completion
of a major series of reforms, which indicates
the possibility of a new growth acceleration
phase provided a new reform program is
launched. In order, therefore, to understand
the difficulties of the Moroccan economy
to remain on a strong and sustainable
growth path, it is necessary to examine the
limitations of the growth model adopted by
the country.
49M O R O C C O ’ S G R O W T H D I A G N O S T I C
Figure 1.10: GDP/per capita of Moroccoand comparable countries (1980-2012)
0
100
200
300
400
1980 1985 1990 1995 2000 2005 2010
Actu
al GD
P per
capit
a, 19
80=1
00
Morocco Jordan Malaysia RomaniaTurkey Tunisia LMIC UMIC
Source: WDI
y = 1E-05x3 - 0.0011x2 + 0.0452x + 6.4963R = 0.9817
6.4 6.6 6.8
7 7.2 7.4 7.6 7.8
8
1960
19
62
1964
19
66
1968
19
70
1972
19
74
1976
19
78
1980
19
82
1984
19
86
1988
19
90
1992
19
94
1996
19
98
2000
20
02
2004
20
06
2008
20
10
2012
log (G
DP/pc
)
Source: WDI
Figure 1.11: GDP per capita growth(1960-2011)
9 Hausmann R. , Pritchett L., Rodrik D., 2004.10 Criteria retained by HRV.
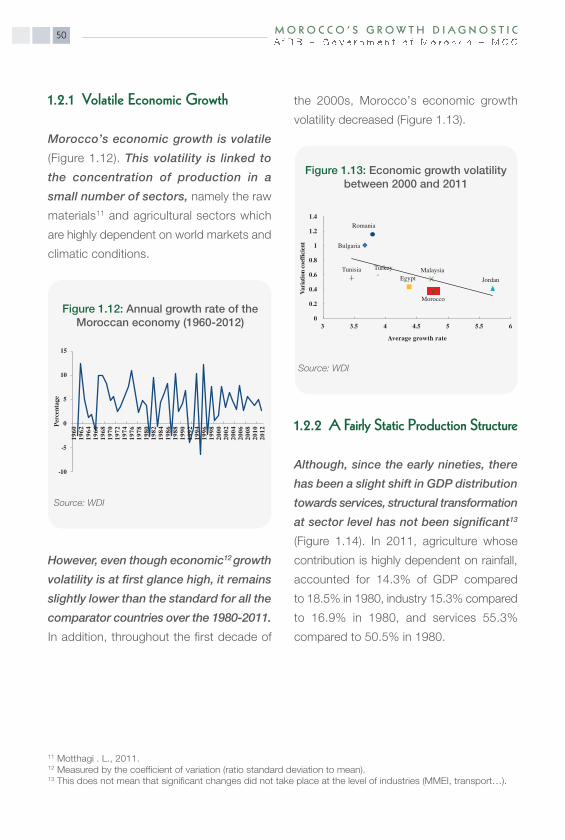
1.2.1 Volatile Economic Growth
Morocco’s economic growth is volatile
(Figure 1.12). This volatility is linked to
the concentration of production in a
small number of sectors, namely the raw
materials11 and agricultural sectors which
are highly dependent on world markets and
climatic conditions.
However, even though economic12 growth
volatility is at first glance high, it remains
slightly lower than the standard for all the
comparator countries over the 1980-2011.
In addition, throughout the first decade of
the 2000s, Morocco’s economic growth
volatility decreased (Figure 1.13).
1.2.2 A Fairly Static Production Structure
Although, since the early nineties, there
has been a slight shift in GDP distribution
towards services, structural transformation
at sector level has not been significant13
(Figure 1.14). In 2011, agriculture whose
contribution is highly dependent on rainfall,
accounted for 14.3% of GDP compared
to 18.5% in 1980, industry 15.3% compared
to 16.9% in 1980, and services 55.3%
compared to 50.5% in 1980.
M O R O C C O ’ S G R OW T H D I A G N O S T I C50
-10
-5
0
5
10
15
1960
1962
1964
1966
1968
1970
1972
1974
1976
1978
1980
1982
1984
1986
1988
1990
1992
1994
1996
1998
2000
2002
2004
2006
2008
2010
2012
Perc
entag
e
Source: WDI
Figure 1.12: Annual growth rate of theMoroccan economy (1960-2012)
Bulgaria
Egypt JordanMalaysia
Morocco
Romania
Tunisia Turkey
0
0.2
0.4
0.6
0.8
1
1.2
1.4
3 3.5 4 4.5 5 5.5 6
Varia
tion c
oeffic
ient
Average growth rate
Source: WDI
Figure 1.13: Economic growth volatilitybetween 2000 and 2011
11 Motthagi . L., 2011.12 Measured by the coefficient of variation (ratio standard deviation to mean).13 This does not mean that significant changes did not take place at the level of industries (MMEI, transport…).
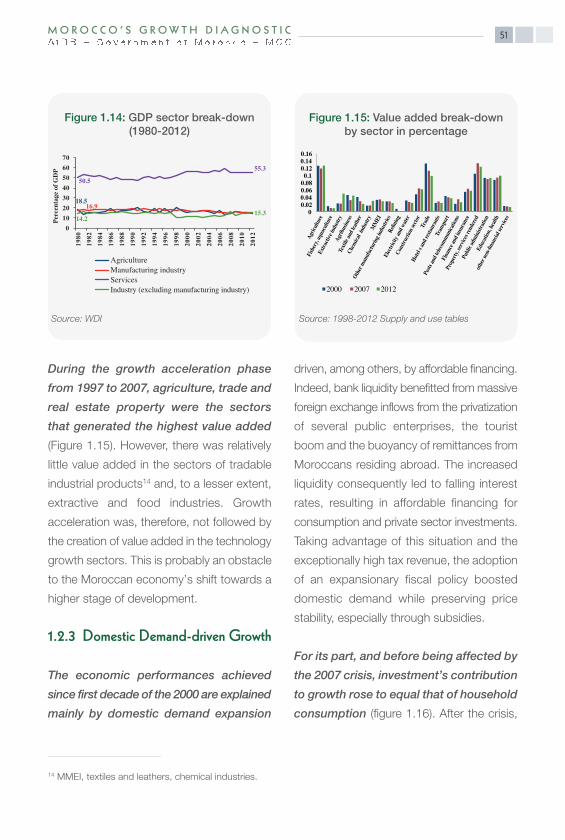
During the growth acceleration phase
from 1997 to 2007, agriculture, trade and
real estate property were the sectors
that generated the highest value added
(Figure 1.15). However, there was relatively
little value added in the sectors of tradable
industrial products14 and, to a lesser extent,
extractive and food industries. Growth
acceleration was, therefore, not followed by
the creation of value added in the technology
growth sectors. This is probably an obstacle
to the Moroccan economy’s shift towards a
higher stage of development.
1.2.3 Domestic Demand-driven Growth
The economic performances achieved
since first decade of the 2000 are explained
mainly by domestic demand expansion
driven, among others, by affordable financing.
Indeed, bank liquidity benefitted from massive
foreign exchange inflows from the privatization
of several public enterprises, the tourist
boom and the buoyancy of remittances from
Moroccans residing abroad. The increased
liquidity consequently led to falling interest
rates, resulting in affordable financing for
consumption and private sector investments.
Taking advantage of this situation and the
exceptionally high tax revenue, the adoption
of an expansionary fiscal policy boosted
domestic demand while preserving price
stability, especially through subsidies.
For its part, and before being affected by
the 2007 crisis, investment’s contribution
to growth rose to equal that of household
consumption (figure 1.16). After the crisis,
51M O R O C C O ’ S G R OW T H D I A G N O S T I C
18.516.9
50.555.3
14.215.3
010203040506070
1980
1982
1984
1986
1988
1990
1992
1994
1996
1998
2000
2002
2004
2006
2008
2010
2012
Perc
entag
e of G
DP
AgricultureManufacturing industryServicesIndustry (excluding manufacturing industry)
Source: WDI
Figure 1.14: GDP sector break-down(1980-2012)
0 0.02 0.04 0.06 0.08 0.1
0.12 0.14 0.16
2000 2007 2012
Fisher
y, aqu
acultu
reEx
tractiv
e indu
stry
Agric
ulture
Textile
and le
ather
Chem
ical in
dustr
y
Agrib
usines
sOthe
r manu
factur
ing ind
ustrie
sRe
fining
MMEI
Const
ructio
n sect
orTra
de
Electr
icity a
nd wa
ter
Transp
ort
Posts
and t
elecom
munica
tions
Hotel s
and re
staura
ntsPro
perty,
servic
es rend
ered
Publi
c adm
inistr
ation
Educa
tion, h
ealth
other
non-fin
ancial
servic
es
Financ
e and
insura
nce
Source: 1998-2012 Supply and use tables
Figure 1.15: Value added break-downby sector in percentage
14 MMEI, textiles and leathers, chemical industries.
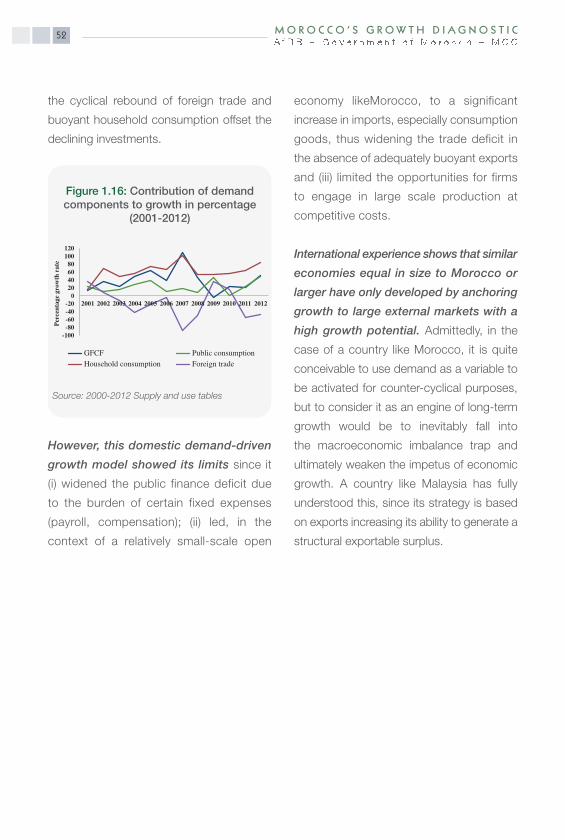
the cyclical rebound of foreign trade and
buoyant household consumption offset the
declining investments.
However, this domestic demand-driven
growth model showed its limits since it
(i) widened the public finance deficit due
to the burden of certain fixed expenses
(payroll, compensation); (ii) led, in the
context of a relatively small-scale open
economy likeMorocco, to a significant
increase in imports, especially consumption
goods, thus widening the trade deficit in
the absence of adequately buoyant exports
and (iii) limited the opportunities for firms
to engage in large scale production at
competitive costs.
International experience shows that similar
economies equal in size to Morocco or
larger have only developed by anchoring
growth to large external markets with a
high growth potential. Admittedly, in the
case of a country like Morocco, it is quite
conceivable to use demand as a variable to
be activated for counter-cyclical purposes,
but to consider it as an engine of long-term
growth would be to inevitably fall into
the macroeconomic imbalance trap and
ultimately weaken the impetus of economic
growth. A country like Malaysia has fully
understood this, since its strategy is based
on exports increasing its ability to generate a
structural exportable surplus.
M O R O C C O ’ S G R O W T H D I A G N O S T I C52
-100-80-60-40-20
020406080
100120
2001 2002 2003 2004 2005 2006 2007 2008 2009 2010 2011 2012
Perc
entag
e gro
wth r
ate
GFCFHousehold consumption
Public consumptionForeign trade
Source: 2000-2012 Supply and use tables
Figure 1.16: Contribution of demandcomponents to growth in percentage
(2001-2012)

53M O R O C C O ’ S G R OW T H D I A G N O S T I C
In Morocco, exports do not play this role
of anchoring economic growth to a large
market with high growth potential. Export
growth rates in current dollars between 1990
and 2000 were lower than those of Asian
emerging countries and Turkey, but higher
than those of countries of the sub-region
(Figure1.17).
From 2000 to 2012, Morocco’s export
growth rate decreased and was, on
average, lower than that of middle-income
countries. The export growth rate was the
fifth highest of the nine comparator countries.
In addition, calculation of dispersion coefficients
reveals a significant increase in export growth
rate volatility between the two sub-periods
(figure 1.18).
Furthermore, Morocco’s net exports
decreased between 2000 and 2010,
indicating adverse international specia-
lization, which strengthens the image of a
consumption-oriented economy (Figure 1.19).
02468
101214
Average 1990-2000 Average 2001-2012
Turk
ey
Tuni
sia
Roma
nia
Mor
occo
Mala
ysia
LMIC
Jord
an
Indo
nesia
Egyp
t
Alge
ria
Source: WDI
Figure 1.17: Average export growth rate
00.51
1.52
2.5
Variation 1990-2000 Variation 2001-2012
Alge
ria
Egyp
t
Indo
nesia
Jord
an
LMIC
Mala
ysia
Mor
occo
Roma
nia
Tuni
sia
Turk
ey
Source: WDI
Figure 1.18: Export volatility
0
20
40
60
80
100
120
2000 2011 2000 2011% of GDP % of GDP
Exports of goods and services Imports of goods and services
Egypt MalaysiaMorocco Tunisia
Turkey
Source: WDI
Figure 1.19: Exports and imports in percentage of GDP

1.2.4 Limited Private Sector Dynamism
Limited private sector dynamism in
Morocco can be seen in (i) the significant
share in the economy of the informal sector,
(ii) importance of SMEs in the economy and
their incapacity to increase their size, (iii)
the private sector’s low share in overall
investment, (iv) low sector investment
diversification, and (v) the limited inflow of
foreign direct investments which embody
modernity and dynamism.
• Informal Sector
While it is difficult to give exact figures
on the extent of the informal sector
in Morocco given its nature, it
undoubtedly represents a very important
share of the country’s economy. The
High Commission for Planning (HCP)
conducted a survey on the non-agricultural
informal sector in 2007. This survey
reveals that this sector contributes 14.3%
to wealth creation and provides 37.7% of
non-agricultural employment.
The scale of this sector15 is often
perceived as a real impediment to the
modernization of Morocco’s economy
since (i) it competes unfairly with the modern
sector, (ii) it does not apply the regulations
in force relating to working and remuneration
conditions for employed staff, and (iii) the
inability of informal firms to gain access to
finance limits their growth. In this regard, the
2007 HCP survey revealed that only 1.1%
of informal sector investment financing is
covered by bank loans.
The sector’s characteristics prevent
it from scaling up businesses into
modern enterprises of varying sizes.
Indeed, according to the same survey,
3/4 of informal production units employ
a single person. It is obvious that the
size of the informal sector is an indication
of serious malfunctions which cause
economic operators to prefer clandestine
activity to declared formal activities. The
tax burden, strict labor legislation, and
high labor taxation and other social
taxes are contributory factors to the slow
progress in modernizing and stimulating
Morocco’s private sector.
The informal sector’s size in the
Moroccan economy is also a sign of
social precariousness, because a high
proportion of informal production units are
established by people who are unable to
find a place in the modern sector as wage
earners, and who are forced to engage
in often very unprofitable independent
activities (57.4% of these units are engaged
in trading).
M O R O C C O ’ S G R O W T H D I A G N O S T I C54
15 Between 1999 and 2007, the number of informal production units increased from 1.233 million to 1.550 million,representing an increase of 40 000 units per year, according to HCP surveys.

• Predominance of Small and
Medium-sized Enterprises
Over 95%16 of Morocco’s productive
fabric comprises of small and medium-
sized enterprises which provide 50% of
employment, 20% of value added, 40%
of production, 30% of exports and 50%
of investment. These enterprises include a
high proportion of small enterprises.
However, their development is limited
by various obstacles including issues of
financing, the quality of human resources
and the predominance of outdated
management. Consequently, small enterprises
in Morocco tend to remain small and large
ones tend to remain large resulting in a
lack of medium-sized enterprises (the
missing middle), the private sector
category which tends to be the most
innovative in other countries. In this regard,
the transition matrix presented in Table
7.3.4 clearly shows that small enterprises
fail to develop since the probability of an
enterprise with fewer than 10 wage earners
to have more than 100 wage earners after
5 years, is negligible (0.4%).
• Limited Private Sector Share in Overall
Investment
Overall investment measured by
Gross Fixed Capital Formation (GFCF)
accounted for 31.4% of GDP in 2012
and averaged 28.5% of GDP between
2000 and 2012. Since 2004, Morocco
also has the highest investment rate
in the sample of comparator countries.
Between 2001 and 2012, total investment
contributed 39.5% to economic growth
(Figure 1.20).
55M O R O C C O ’ S G R OW T H D I A G N O S T I C
05
101520253035404550
In pe
rcen
tage o
f GDP
Morocco Jordan MalaysiaRomania Tunisia Turkey
1980
19
81
1982
19
83
1984
19
85
1986
19
87
1988
19
89
1990
19
91
1992
19
93
1994
19
95
1996
19
97
1998
19
99
2000
20
01
2002
20
03
2004
20
05
2006
20
07
2008
20
09
2010
20
11
2012
Source: WDI
Figure 1.20: Total investment in percentage of GDP
16 Source: General Confederation of Enterprises of Morocco.
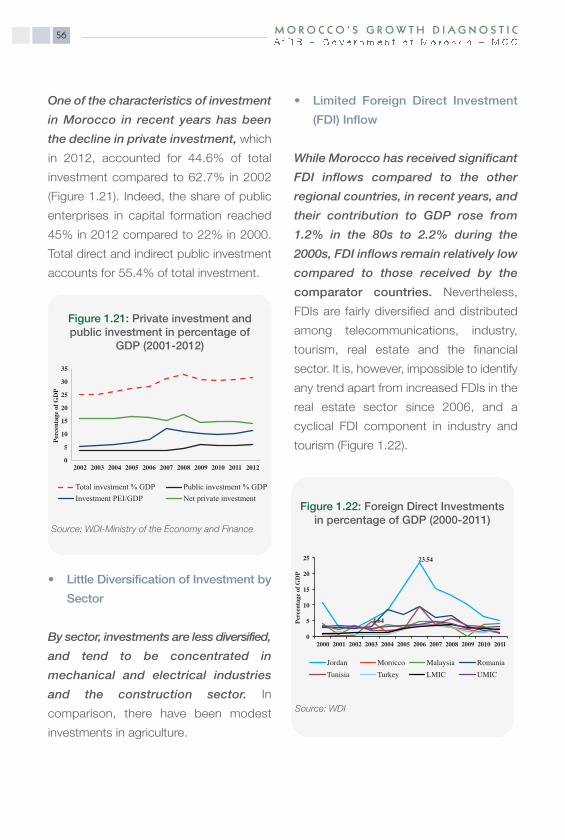
One of the characteristics of investment
in Morocco in recent years has been
the decline in private investment, which
in 2012, accounted for 44.6% of total
investment compared to 62.7% in 2002
(Figure 1.21). Indeed, the share of public
enterprises in capital formation reached
45% in 2012 compared to 22% in 2000.
Total direct and indirect public investment
accounts for 55.4% of total investment.
• Little Diversification of Investment by
Sector
By sector, investments are less diversified,
and tend to be concentrated in
mechanical and electrical industries
and the construction sector. In
comparison, there have been modest
investments in agriculture.
• Limited Foreign Direct Investment
(FDI) Inflow
While Morocco has received significant
FDI inflows compared to the other
regional countries, in recent years, and
their contribution to GDP rose from
1.2% in the 80s to 2.2% during the
2000s, FDI inflows remain relatively low
compared to those received by the
comparator countries. Nevertheless,
FDIs are fairly diversified and distributed
among telecommunications, industry,
tourism, real estate and the financial
sector. It is, however, impossible to identify
any trend apart from increased FDIs in the
real estate sector since 2006, and a
cyclical FDI component in industry and
tourism (Figure 1.22).
M O R O C C O ’ S G R O W T H D I A G N O S T I C56
05
101520253035
2002 2003 2004 2005 2006 2007 2008 2009 2010 2011 2012
Perc
entag
e of G
DP
Total investment % GDP Public investment % GDPInvestment PEI/GDP Net private investment
Source: WDI-Ministry of the Economy and Finance
Figure 1.21: Private investment and public investment in percentage of
GDP (2001-2012)
23.54
4.64
0
5
10
15
20
25
2000 2001 2002 2003 2004 2005 2006 2007 2008 2009 2010 2011
Perc
entag
e of G
DP
Jordan Morocco Malaysia Romania Tunisia Turkey LMIC UMIC
Source: WDI
Figure 1.22: Foreign Direct Investmentsin percentage of GDP (2000-2011)

1.2.5 Weak Export Competitiveness Impacting Negatively on the External Balances
Despite the many free trade agreements
signed and the various export liberalization
and support measures and policies
implemented, Morocco has continued to
suffer from a persistent trade imbalance
for almost three decades mainly as a
result of poor export performances. The
weak performance of exports in the global
market is explained by the fact that exports
are dominated by agricultural, chemical
and textile products. Since the start of
the growth acceleration phase in the late
nineties, the export sophistication level has
not changed significantly (Figure 1.23).
Furthermore, export prices have not
increased more rapidly than those
of the main competing emerging
countries (Figure 1.24). This suggests that
the weak competitiveness of Moroccan
exports is probably more the result of
technology and innovation content (that
would be low) than their price.
An aggravating phenomenon is
the fact that the concentration of
exports towards Europe does not
foster the expansion of Morocco’s
market share in a context of low
growth in the main European client
countries (Figure 1.25).
57M O R O C C O ’ S G R OW T H D I A G N O S T I C
Figure 1.23: Export innovation andsophistication index
2.0
2.5
3.0
3.5
4.0
4.5
5.0
2006 2007 2008 2009 2010 2011
Inde
x
Algeria Egypt MoroccoSouth Africa Tunisia
Source: Data Market, Federal Reserve of St Louis
0.20.40.60.8
11.21.4
1981 1985 1989 1993 1997 2001 2005 2009Relat
ive pr
ice/U
S pric
e 200
5=1
Morocco Egypt Jordan
Malaysia Tunisia Turkey
Source: HCP
Figure 1.24: Trend of prices of exportsfrom Morocco and comparable countries

Morocco, like all the comparator
countries, with the exception of
Malaysia, has witnessed a deterioration
of its foreign trade coverage rate owing
to a drop in the level of activity in
Europe and lack of sophistication of
exported products limiting its ability to
diversify its trading partners (Figure 1.26).
Furthermore, the market share of
Moroccan exports has actually
dropped since 2000. Although the
share of exports in GDP in 2012
exceeded that of all lower middle-income
countries (LMIC), Morocco’s world
market share of exports fell from
0.15% in 1999 to about 0.10% in
2012.
Low value added creation by the
export sector impacts the macro-
economic balances because, in
addition to the export difficulties
observed, there has been a significant
increase in imports in recent years due to
(i) a rise in the oil bill (27% of imports
in 2012), (ii) increased public investments
especially those inducing an increase
in imports, (iii) and the country’s
unprecedented economic openness
since the early 2000s.
Up to 2007, the trade deficit
was offset by the surplus on services
and transfers. However, since then,
these two items have themselves been
affected by the crisis, which has resulted
in the deterioration of the external
accounts. Consequently, the current
account deficit widened to 10% of GDP
in 2012 compared to an average surplus
of 2.4% of GDP between 2001 and
2007.
M O R O C C O ’ S G R OW T H D I A G N O S T I C58
6%
11%
18%
61%
4%
Africa America Asia Europe Oceania
Source: HCP
0
20
40
60
80
100
120
140
2000 2007 2012
Rates
Egypt Jordan Malaysia Morocco Romania Tunisia Turkey
Source: WDI
Figure 1.26: Trend of cover rate forMorocco and comparable countries
Figure 1.25: World export break-downin 2012 (total percentage)

59M O R O C C O ’ S G R OW T H D I A G N O S T I C
The widening current account deficit has
created external financing requirements
averaging 8.64% of GDP since 2008.
Since non-debt generating external flows
(FDIs and grants, in particular) only contributed
up to 36% of external financing requirements,
public and private debt took over and
financed up to 60% of these requirements.
This resulted in a significant increase in
external public debt which represented
26.9%17 of GDP in 2013 compared to
19.4% in 2008. The IMF considers this
external debt level as still sustainable, but
its future trend requires close monitoring.
Consequently, and since external financial
flows are becoming inadequate to
cover net financing requirements, it
was necessary to draw on foreign
exchange reserves for the entire
2008-2012 period with the exception of
2010. As a result, foreign exchange reserves
covered only 4.2 months in December
2013 against 9 months in early 2009.
1.2.6 Low Factor Productivity Contribution
Total factor productivity is the metric
for measuring the efficient use of
economic resources in the production
process. In this regard, the experience
of emerging countries which have
enjoyed strong growth has shown
that high capital accumulation was a
necessary but far from sufficient condition,
since it has to be followed by a sharp
increase in total factor productivity to
produce the expected effects on long-
term growth.
• Low Total Factor Productivity
Analysis of the production function
provides an estimated total factor
productivity growth rate of 0.18% per
year between 1996 and 2007, during
the acceleration phase, and an average
annual decrease of 0.26%, since 2007
(Figure 1.27)18.
17 Source: Ministry of the Economy and Finance.18 However, this analysis must be interpreted prudently given the data quality, the absence of essential variablessuch as the rate of use of production capacities and skilled labour, and given the restriction on coefficients (constantreturns).
Y : value added, L: total employment (source: WDI and Ministry of Employment), K: capital stock(Source: Penn World Tables), A: technical progress. The estimated relationship is as follows: Where y/L is the productivity by worker, K/L the capital by worker and α the labour share in value added.
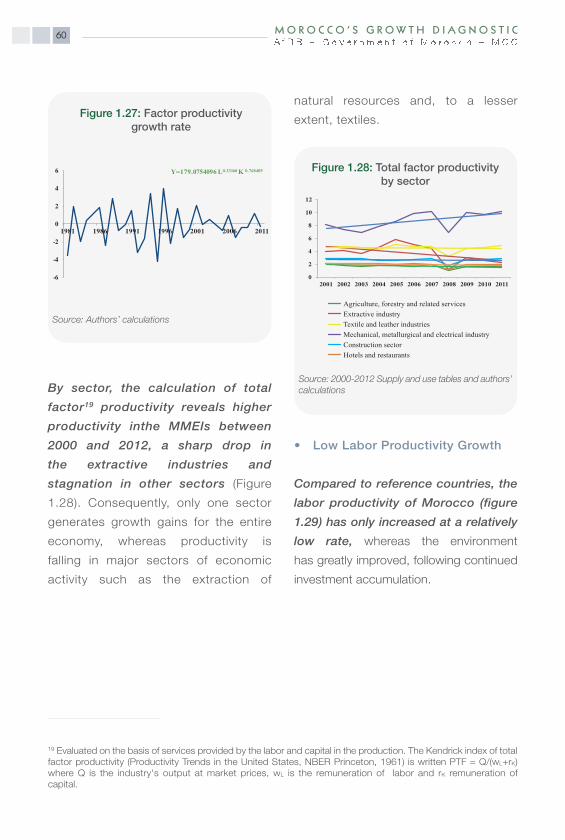
By sector, the calculation of total
factor19 productivity reveals higher
productivity inthe MMEIs between
2000 and 2012, a sharp drop in
the extractive industries and
stagnation in other sectors (Figure
1.28). Consequently, only one sector
generates growth gains for the entire
economy, whereas productivity is
falling in major sectors of economic
activity such as the extraction of
natural resources and, to a lesser
extent, textiles.
• Low Labor Productivity Growth
Compared to reference countries, the
labor productivity of Morocco (figure
1.29) has only increased at a relatively
low rate, whereas the environment
has greatly improved, following continued
investment accumulation.
M O R O C C O ’ S G R OW T H D I A G N O S T I C60
19 Evaluated on the basis of services provided by the labor and capital in the production. The Kendrick index of totalfactor productivity (Productivity Trends in the United States, NBER Princeton, 1961) is written PTF = Q/(wL+rK)where Q is the industry's output at market prices, wL is the remuneration of labor and rK remuneration of capital.
-6
-4
-2
0
2
4
6
1981 1986 1991 1996 2001 2006 2011
Y=179.0754096 L0.23160 K 0.768405
Source: Authors’ calculations
Figure 1.27: Factor productivitygrowth rate
0
2
4
6
8
10
12
2001 2002 2003 2004 2005 2006 2007 2008 2009 2010 2011
Agriculture, forestry and related servicesExtractive industryTextile and leather industriesMechanical, metallurgical and electrical industryConstruction sectorHotels and restaurants
Source: 2000-2012 Supply and use tables and authors’calculations
Figure 1.28: Total factor productivityby sector

• Average Overall Return on
Investment
The marginal return on investment20 is
in line with the averages of the comparator
countries. Macroeconomic stabilization
is accompanied by a decrease in growth
volatility and a convergence of returns
among countries (figure 1.30).
1.2.7 Weak Employment-GeneratingGrowth, especially among Young People
According to the High Commission for
Planning21, economic growth is expected
to be low in terms of job creation. The
employment elasticity with respect to
growth is estimated at between 0.3 and
0.5, which does not factor in the absorption
61M O R O C C O ’ S G R OW T H D I A G N O S T I C
0
10 000
20 000
30 000
40 000
1980 1990 2000 2010
Morocco Jordan Egypt RomaniaTunisia Turkey Malaysia
Source: WDI
Figure 1.29: Trend of labour productivityin Morocco (USD 1990) and comparable
countries, 1980-2011
20 Measured by the reverse of ICOR.21 High Commission for the Plan, The sources of Morocco’s growth, September 2005.
-25
-20
-15
-10
-5
0
5
10
15
20
Jordan Malaysia MoroccoRomania Tunisia Turkey
Source : Authors’ calculations
Figure 1.30: Return on investment

of the influx of young people onto the labor
market. Along with labor market rigidities,
the growing number of youths entering the
market on account of the demographic
transition that the country is experiencing,
and lack of qualifications of some graduates
is a major obstacle to reducing youth
unemployment.
The low employment elasticity in
relation to growth is corroborated by
the fact that the relationship between
economic growth and unemployment
is not linear. Over the period analyzed
(1996-2010), the minimum unemployment
rate was reached at a growth rate close
to 5% (Figure 1.31).
Furthermore, the impact of growth
on graduate unemployment is low.
Over the reference period, a 5.3%
growth rate is associated to a minimum
graduate unemployment rate of 18%
(figure 1.32).
The low correlation between the trend
of young graduate unemployment and
economic growth is explained by the
predominance of sectors such as
agriculture and trading, which mainly
employ unskilled labor. However,
the sectors seeking skilled labor often
face difficulties in finding the required
profiles on the market despite
government efforts in the area of
vocational training (the manpower
trained by the public sector, for
instance, has doubled since 2004). The
private sector, for its part, is not yet
playing a very active role in taking over
from the public sector in the area of
training (Figure 1.33).
M O R O C C O ’ S G R OW T H D I A G N O S T I C62
y = 0.2217x2- 2.1817x + 15.001R = 0.5295
6
7
8
9
10
11
12
13
14
15
0 2 4 6 8 10
Une
mpl
oym
ent r
ate
Growth rate
Source: WDI and authors’ calculations
Figure 1.31: Unemployment-growthrelationship in Morocco and comparable
countries
y = 0.3048x2- 3.2337x + 30.507R = 0.2249
14
16
18
20
22
24
26
28
30
0 2 4 6 8 10
Gra
duat
e un
empl
oym
ent r
ate
Growth rate
Source: WDI and authors’ calculations
Figure 1.32: Growth-university graduateunemployment relationship
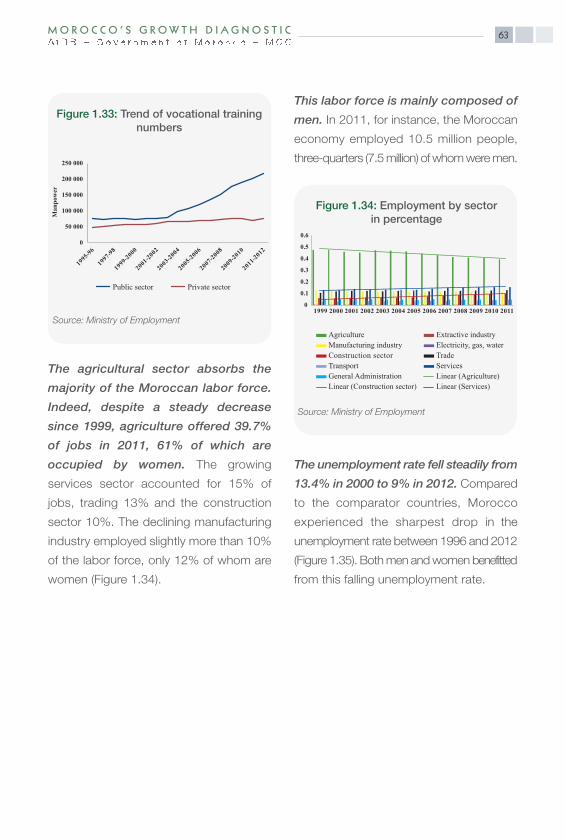
63M O R O C C O ’ S G R OW T H D I A G N O S T I C
The agricultural sector absorbs the
majority of the Moroccan labor force.
Indeed, despite a steady decrease
since 1999, agriculture offered 39.7%
of jobs in 2011, 61% of which are
occupied by women. The growing
services sector accounted for 15% of
jobs, trading 13% and the construction
sector 10%. The declining manufacturing
industry employed slightly more than 10%
of the labor force, only 12% of whom are
women (Figure 1.34).
This labor force is mainly composed of
men. In 2011, for instance, the Moroccan
economy employed 10.5 million people,
three-quarters (7.5 million) of whom were men.
The unemployment rate fell steadily from
13.4% in 2000 to 9% in 2012. Compared
to the comparator countries, Morocco
experienced the sharpest drop in the
unemployment rate between 1996 and 2012
(Figure 1.35). Both men and women benefitted
from this falling unemployment rate.
0
50 000
100 000
150 000
200 000
250 000
Man
pow
er
Public sector Private sector
Source: Ministry of Employment
Figure 1.33: Trend of vocational trainingnumbers
0
0.1
0.2
0.3
0.4
0.5
0.6
1999 2000 2001 2002 2003 2004 2005 2006 2007 2008 2009 2010 2011
Agriculture Extractive industryManufacturing industry Electricity, gas, waterConstruction sector TradeTransport ServicesGeneral Administration Linear (Agriculture)Linear (Construction sector) Linear (Services)
Source: Ministry of Employment
Figure 1.34: Employment by sectorin percentage

However, since 2011, the female
unemployment rate has increased
significantly reaching its 2005 level
(10.2%). Women, in particular, are
employed in sectors of activity that prefer
unskilled labor (agriculture, textile) and/or
offer low wages (hotels, restaurants).
The sluggish unemployment rate
mainly concerns the 15-24 age group,
which includes university graduates
(Figure 1.36). Thus, while the overall
unemployment rate decreased steadily
between 2000 and 2011, the rate rose
again for young men after 2003 and for
young women from 2006.
There are wide regional employment
disparities which must be taken into
consideration if social cohesion is to be
maintained. Thus, the unemployment rate
in the Doukala–Abda region, for instance,
is double (22.2%) that of the neighboring
region of Casablanca (10.6%).
1.2.8 Largely Non-Inclusive Growth
According to household surveys conducted
by the HCP, the overall improvement
in living standards between 2001 and
2007, combined with the stagnation of
inequalities, significantly reduced poverty
and vulnerability22. Poverty dropped from
M O R O C C O ’ S G R OW T H D I A G N O S T I C64
18.1 19.1
13.9 12.5 11.9 11.09.7 9.1 8.9
0
5
10
15
20
25
Activ
e pop
ulati
on pe
rcen
tage
Morocco Jordan Malaysia TunisiaTurkey Romania LMIC
1996 1997 1998 1999 2000 2001 2002 2003 2004 2005 2006 2007 2008 2009 2010 2011 2012
Source: WDI
Figure 1.35: Unemployment rate ofMorocco and comparable countries in
percentage
0
5
10
15
20
25
2000 2002 2004 2006 2008 2010 2012
Unem
ploym
ent r
ate
15 to 24 years 25 to 44 years 45 to59 years
Source: Ministry of Employment
Figure 1.36: Unemployment rate by age group
22 Economic vulnerability is understood in relation to illnesses, disability risk, bad weather or loss of employment.

15.3% to 9% at the national level, from
7.6% to 4.8% in urban areas, and from
25.1% to 14.5% in rural areas (Figure 1.37).
Vulnerability was reduced from 22.8%
to 17.5% at the national level, from
16.6% to 12.7% in urban areas and
from 30.5% to 23.6% in rural areas. In
Morocco, poverty is associated with
illiteracy and, more generally, lack of
training. Despite the progress made, the
persistence of poverty and vulnerability
indicates that growth is still not very
inclusive. Poverty also causes migratory
movements inside and outside the
country.
Despite these results, vulnerability
remains high and there are
considerable inequalities between
regions, within regions, and between
rural and urban areas. In addition,
the fact that unemployment and
precariousness affect a very high number
of young people, including university
graduates, proves that Morocco’s growth
has not been inclusive enough.
65M O R O C C O ’ S G R OW T H D I A G N O S T I C
0
5
10
15
20
25
30
1999 2001 2007
Ratio
Urban Rural Total
Source: HCP
Figure 1.37: Poor population ratio dependingon the national poverty threshold in 2007
(percentage of the population)

Chapter 2
Cost of Financing
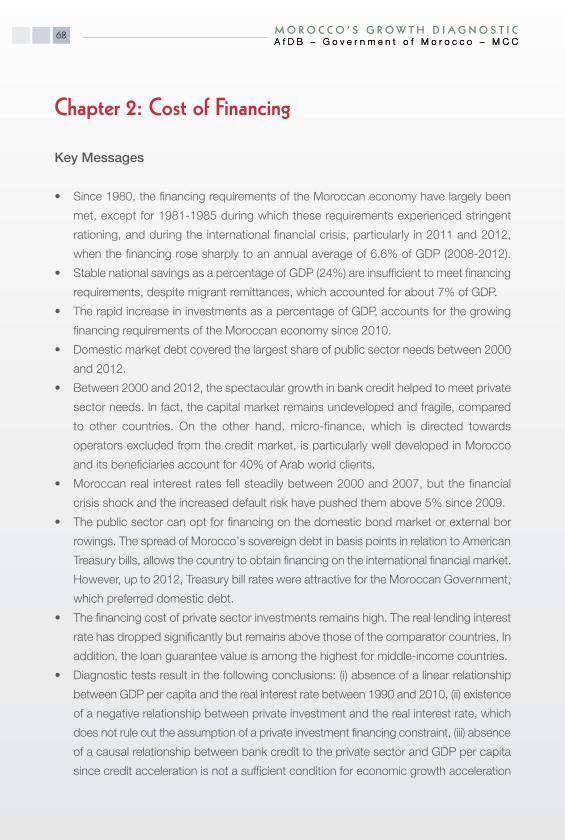
Chapter 2: Cost of Financing
Key Messages
• Since 1980, the financing requirements of the Moroccan economy have largely been
met, except for 1981-1985 during which these requirements experienced stringent
rationing, and during the international financial crisis, particularly in 2011 and 2012,
when the financing rose sharply to an annual average of 6.6% of GDP (2008-2012).
• Stable national savings as a percentage of GDP (24%) are insufficient to meet financing
requirements, despite migrant remittances, which accounted for about 7% of GDP.
• The rapid increase in investments as a percentage of GDP, accounts for the growing
financing requirements of the Moroccan economy since 2010.
• Domestic market debt covered the largest share of public sector needs between 2000
and 2012.
• Between 2000 and 2012, the spectacular growth in bank credit helped to meet private
sector needs. In fact, the capital market remains undeveloped and fragile, compared
to other countries. On the other hand, micro-finance, which is directed towards
operators excluded from the credit market, is particularly well developed in Morocco
and its beneficiaries account for 40% of Arab world clients.
• Moroccan real interest rates fell steadily between 2000 and 2007, but the financial
crisis shock and the increased default risk have pushed them above 5% since 2009.
• The public sector can opt for financing on the domestic bond market or external bor
rowings. The spread of Morocco’s sovereign debt in basis points in relation to American
Treasury bills, allows the country to obtain financing on the international financial market.
However, up to 2012, Treasury bill rates were attractive for the Moroccan Government,
which preferred domestic debt.
• The financing cost of private sector investments remains high. The real lending interest
rate has dropped significantly but remains above those of the comparator countries. In
addition, the loan guarantee value is among the highest for middle-income countries.
• Diagnostic tests result in the following conclusions: (i) absence of a linear relationship
between GDP per capita and the real interest rate between 1990 and 2010, (ii) existence
of a negative relationship between private investment and the real interest rate, which
does not rule out the assumption of a private investment financing constraint, (iii) absence
of a causal relationship between bank credit to the private sector and GDP per capita
since credit acceleration is not a sufficient condition for economic growth acceleration
M O R O C C O ’ S G R OW T H D I A G N O S T I C68
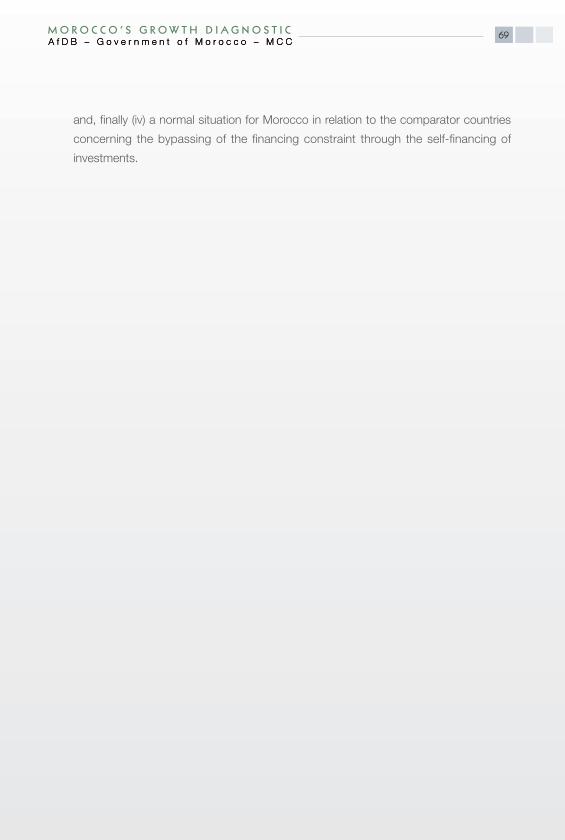
and, finally (iv) a normal situation for Morocco in relation to the comparator countries
concerning the bypassing of the financing constraint through the self-financing of
investments.
69M O R O C C O ’ S G R OW T H D I A G N O S T I C

M O R O C C O ’ S G R OW T H D I A G N O S T I C70
Introduction
The cost of financing could become a
major constraint to growth, if it is consistently
higher than the anticipated return on
investment, to the point of dissuading
investors from embarking on the
development of new projects. The cost of
financing has three dimensions: the real
interest rate, credit period, and the required
collaterals. The explanatory factors of a high
investment cost are generally: i) limited
access by the economy to financial markets,
ii) inadequate financial intermediation and
iii) lack of competition among banks as well
as poor risk management.
In this chapter, the analysis of various
aspects of the cost of financing leads to
the general conclusion that access to
finance is not a major constraint to
Morocco’s growth. According to international
rankings, the Moroccan banking sector
developed satisfactorily in relation to the
comparator countries. While Morocco
was ranked 103rd in economic freedom in
2014 by the Heritage Foundation, the score
obtained by the country in financial freedom
places it above the comparator countries
in absolute value, and in line with them with
respect to GDP per capita (Figure 2.1).
At the same time, the average private
investment rate is high. Morocco has the
highest rate in relation to GDP among the
comparator countries. In terms of GDP per
capita, Morocco exceeds all middle-income
countries (Figure 2.2).
Algeria
Jordan MalaysiaMorocco
Tunisia
Turkey
20
30
40
50
60
70
0 2000 4000 6000 8000 10000 12000
Fina
ncial
free
dom
index
GDP per capita
Egypt
Romania
Source: Heritage Foundation and WDI
Figure 2.1: Financial freedom
AlgeriaEgypt
JordanMalaysia
Morocco TunisiaTurkey
0
5
10
15
20
25
7.5 8 8.5 9 9.5
Priva
te inv
estme
nt / G
DP
GDP per capita
Source: WDI
Figure 2.2: Investment rate andGDP/per capita

71M O R O C C O ’ S G R OW T H D I A G N O S T I C
Nevertheless, persistent secondary
obstacles are likely to slow down the
business investment rate. Real interest
rates are high, despite the liberalization of
lending rates. The collateral required to
obtain loans are also among the highest
for emerging countries. Furthermore, weak
financial sector competition enables banks
to retain significant margins when liquidity is
low in the inter-bank market23.
2.1 The Moroccan Economy’s FinancingRequirements
Since 1980, the financing needs of the
Moroccan economy have generally been
met24. These were covered either i) by
the banking sector and the domestic bond
market, or ii) by the call for external savings25.
2.1.1 Counter-cyclical Trend of FinancingRequirements
Between 1980 and 1995, the structural
adjustment period, average annual financing
needs as a percentage of GDP rose to
5.5%. During the growth acceleration phase
(1996-2006), the economy generated an
average annual financing capacity of 1.4%
of GDP, mainly as a result of privatization.
However, since the international financial crisis,
financing needs have accelerated, especially
in 2011 and 2012, and reached an annual
average of 6.5% of GDP (Figure 2.3).
The gap between savings and investment
accounts for the acceleration of the
economy’s external financing needs. This
was particularly valid at the end of the
period, when national savings fell and the
investment rate increased steadily, driven by
a counter-cyclical policy, whose effects in
terms of growth were not fully felt in 2011
and 2012.
2.1.2 Insufficient National Savings
National savings as a percentage of GDP
(24%) are insufficient to meet financing
needs (Figure 2.4). The savings rate in relation
to income remains below that of countries
with strong growth. National savings increased
23 Accentuated by the current payment deficit and the budget deficit since the 2007 financial crisis.24 Including since the 2008 financial crisis.25 Direct investments and loans on international markets or from bilateral and multilateral donors.
-7 -6 -5 -4 -3 -2 -1 0 1 2
1980-1995
1996-2007
2008-2012
Perc
enta
ge o
f GD
P
1990-1995 1996-2007 2008-2012
Source: Ministry of the Economy and Finance
Figure 2.3: Finance Capacity/Needin percentage of GDP

M O R O C C O ’ S G R OW T H D I A G N O S T I C72
with the growth acceleration in 1996 but
remained vulnerable to the international
transmission of income shocks, since they
were highly dependent on remittances from
migrant workers. The latter accounted for
7.2% of GDP in 2011.
Since 1996, Morocco has been the
sub-regional country that benefits the
most from migrant remittances as a
proportion of GDP. The trend of the two
savings aggregates, national and domestic,
clearly establishes the importance of
migrant savings in ensuring macroeconomic
balance. Remittances from migrant workers
recorded an average annual growth rate of
7.4% over the 2002-2007 period reaching
55 billion dirhams in 2007 (Figure 2.5). The
economic slowdown, which affected the
main host countries of Moroccan migrants,
especially Spain, France and Italy, had a
negative impact on remittances from
Moroccans residing abroad. These
remittances decreased by 3.5% in 2008
and 5.4% in 2009 compared to a 17.4%
increase in 2006 and 15% in 2007. The
remittances resumed at rates of 8.3%,
7.4%, and 0.6%, respectively, in 2010,
2011 and 2012.
Domestic savings, which represent
about 20% of GDP, are insufficient to
finance domestic investment. Moreover,
the financial savings structure is still
dominated by liquid savings resulting in a
preference for short-term credit. This has
prompted the Moroccan public authorities
to take several incentive measures to extend
loan maturity (housing savings plans, company
savings plans, share savings plans, education
savings plans) and to encourage enterprises
to join the stock market.
-20-10
0102030405060
1990 1995 2000 2005 2010Perc
enta
ge of
GDP
Morocco Jordan Malaysia RomaniaTunisia Turkey LMIC PRITSI
Source: WDI
Figure 2.4: Gross domestic savings rate in percentage of GDP
Algeria Egypt Morocco Tunisia
0 2 4 6 8
10 12 14 16
1980 1982 1984 1986 1988 1990 1992 1994 1996 1998 2000 2002 2004 2006 2008 2010
Perc
entag
e of G
DP
Source: WDI
Figure 2.5: Migrant remittancesin percentage of GDP

73M O R O C C O ’ S G R OW T H D I A G N O S T I C
2.1.3 Savings-Investment Balance
The rapid increase in investments as a
percentage of GDP accounts for the
growing financing requirements of the
Moroccan economy since 2010. As a
percentage of GDP, investment was identical in
2012 to that of Romania and Indonesia: 31.7%
of GDP (Figure 2.6). The same year, private
investment and public investment accounted
respectively for 25.8% and 5.9% of GDP. In
the PRESIMO model (Annex 2.1) used to
develop the Moroccan economy’s forecast
scenarios, investment is explained by an
anticipated production trend, capital productivity
modification, the long-term real interest
rate and the profit margin of enterprises.
According to the model, a 1% increase in
the long-term real interest rate would lead
to a 5% drop in long-term investment26.
The temporal instability of foreign direct
investments (FDI) does not guarantee
coverage of the structural investment
financing gap by savings. Between 2004
and 2011, FDI accounted for about 2.8% of
GDP (Figure 2.7). The global financial crisis
and the ensuing stagnation in Europe slowed
down investments in neighboring countries27.
This drop had a significant impact on Morocco’s
main investing countries: France (-26.1%),
Spain (-57.2%) and the United Kingdom
(-47.1%). Morocco’s strong resilience to
the crisis is reflected in increased foreign
investments, which reached USD 2.8 billion
in 2012 compared to USD 1.6 billion in 2010.
Between 2004 and 2011, the average gap
between investment and savings was
5.9% and net external finance needs rose
to an annual average of 3.1% of GDP.
26 For capital stock standardized at the stable state.27 The decline in FDI in 2008 and 2009 was by 26.3% and 29.2% respectively at end-September 2009.
0
10
20
30
40
50
1980 1985 1990 1995 2000 2005 2010
In p
erce
ntag
e of
GD
P
Morocco Jordan MalaysiaRomania Tunisia Turkey
Source: WDI
Figure 2.6: Gross fixed capital formationin percentage of GDP
23.54
4.64
0
5
10
15
20
25
2000 2005 2010
Perc
enta
ge o
f GD
P
Jordan Morocco MalaysiaRomania Tunisia Turkey
Source: WDI
Figure 2.7: FDI in percentage of GDP(2000-2010)

M O R O C C O ’ S G R O W T H D I A G N O S T I C74
However, after 2007, financing needs rose
sharply, reaching 8% of GDP in 2011 and
7.4% in 2012. Between 2010 and 2012, the
financing needs of Moroccan economy rose
from 34.2 billion dirhams to 82.4 billion
dirhams (Table 2.1).
2.1.4 Unbalanced Financing NeedsAmong Institutional Sectors
Between 2000 and 2007, the entire
Moroccan economy generated a
financing capacity that resulted in a
current balance of payments surplus,
despite budget deficits.
After 2007, local currency debt rose,
while the debt/GDP ratio which had been
steadily declining since 1990, rose above
50%, the generally accepted threshold
for emerging countries, in 2012 (58.2%)
(Figure 2.8). Indeed, after the 2007-2008
global crisis, the private non-financial
enterprises used bank loans to meet
their growing financing needs. Concurrently,
the central government’s budget situation
worsened and Moroccan authorities
preferred to seek financing on the domestic
bond market.
The 2012 annual report of the Central
Bank28 emphasizes that the financing
needs of the national economy rose
to 82.4 billion dirhams in 2012 compared
to 64.6 billion dirhams in 2011. This
increase is mainly attributable to the deficit
National Economy CapitalAccount (million Dhs)
2010 2011 2012
Revenues
Gross savings 233 336 223 95420 9931
Net capital transfers -1 -2 1
Total 233 335 223 952209 930
Expenditures
Gross fixed capital formation 234407 246 394259 680
Stock variation 33 251 42 168 32 697
Financing Capacity(+)/need (-) -34 323 -64 610 -82 445
Total 233 335 223 952209 930
Table 2.1: Finance needs in Morocco
Source: 2012 National Accounts (forcasts)
0%10%20%30%40%50%60%70%80%90%
1983
1984
1985
1986
1987
1988
1989
1990
1991
1992
1993
1994
1995
1996
1997
1998
1999
2000
2001
2002
2003
2004
2005
2006
2007
2008
2009
2010
2011
2012
Foreing Debt Domestic Debt Total Debt
Source: Ministry of the Economy and Finance
Figure 2.8: Trend of the Treasury debtstock in percentage of GDP (1983-2012)
28 Banque Al-Maghrib, Annual report, p 72-75, 2012.

75M O R O C C O ’ S G R OW T H D I A G N O S T I C
Non-financial
entreprises
Financialentreprises
PublicAdministration
Households Privatization Entireeconomy
Rest of theworld
1998 -7870 6229 -3612 3870 -1383 1383
1999 -19254 5018 10450 2011 -1775 1775
2000 -6023 7845 -8840 1044 -5974 5974
2001 -4537 8287 -15511 29781 18020 -18020
2002 -3948 6324 -9795 24016 16597 -16597
2003 -11211 5383 -9181 30668 12000 15659 -15659
2004 -18053 5488 -9358 31392 10400 9469 -9469
2005 -11932 6048 -14136 31544 13800 11524 -11524
2006 -18669 7643 6469 19945 4800 15388 -15388
2007 -33521 5686 18001 9145 6100 -689 689
2008 -77797 9775 24800 7334 -35888 35888
2009 -71205 11071 9929 10424 -39781 39781
2010 -53829 10004 1511 8032 -34282 34282
2011 -61000 12500 -20600 4500 -64600 64600
2012 -67900 11500 -30700 3600 -83500 83500
Table 2.2: Financing need/capacity in millions of DH
Source: Ministry of the Economy and Finance
Since funds mobilized on the international
financial market and foreign investment
flows were unable to close the economy’s
financing gap, reserve assets once again
contracted in 2012 by 29.2 billion dirhams
following a 20.3 billion drop in 2011.
accumulated by public administration and
non-financial enterprises. By institutional
sector, the Central Bank data highlights a
widening of the deficit to 30.7 billion dirhams
in public administration and 67.9 billion in
non-financial enterprises. At the same time,
household financing capacity was limited to
3.6 billion dirhams and that of financial
enterprises to 11.5 billion dirhams (Table 2.2
& Figure 2.9).
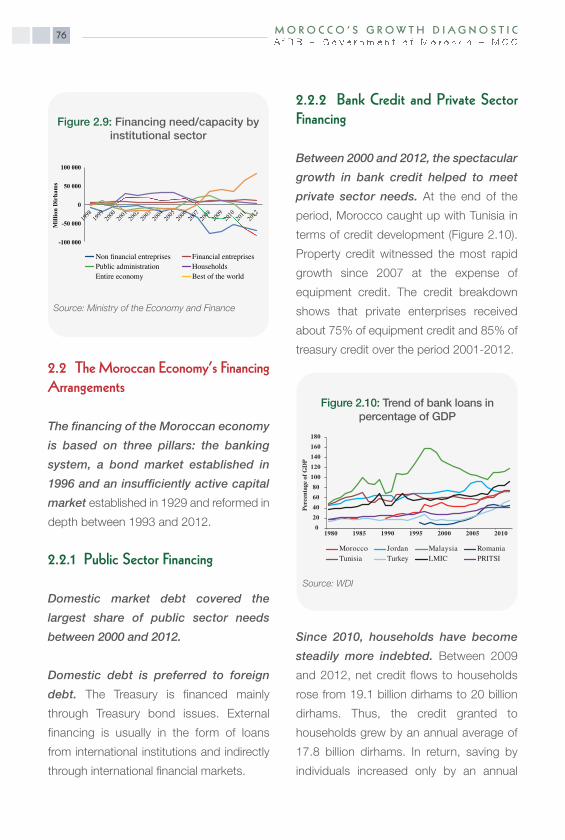
M O R O C C O ’ S G R OW T H D I A G N O S T I C76
2.2 The Moroccan Economy’s FinancingArrangements
The financing of the Moroccan economy
is based on three pillars: the banking
system, a bond market established in
1996 and an insufficiently active capital
market established in 1929 and reformed in
depth between 1993 and 2012.
2.2.1 Public Sector Financing
Domestic market debt covered the
largest share of public sector needs
between 2000 and 2012.
Domestic debt is preferred to foreign
debt. The Treasury is financed mainly
through Treasury bond issues. External
financing is usually in the form of loans
from international institutions and indirectly
through international financial markets.
2.2.2 Bank Credit and Private Sector Financing
Between 2000 and 2012, the spectacular
growth in bank credit helped to meet
private sector needs. At the end of the
period, Morocco caught up with Tunisia in
terms of credit development (Figure 2.10).
Property credit witnessed the most rapid
growth since 2007 at the expense of
equipment credit. The credit breakdown
shows that private enterprises received
about 75% of equipment credit and 85% of
treasury credit over the period 2001-2012.
Since 2010, households have become
steadily more indebted. Between 2009
and 2012, net credit flows to households
rose from 19.1 billion dirhams to 20 billion
dirhams. Thus, the credit granted to
households grew by an annual average of
17.8 billion dirhams. In return, saving by
individuals increased only by an annual
Non financial entreprises Financial entreprisesPublic administration HouseholdsEntire economy Best of the world
-100 000
-50 000
0
50 000
100 000
Mill
ion
Dir
ham
s
Source: Ministry of the Economy and Finance
Figure 2.9: Financing need/capacity byinstitutional sector
020406080
100120140160180
1980 1985 1990 1995 2000 2005 2010
Perc
entag
e of G
DP
Morocco Jordan Malaysia RomaniaTunisia Turkey LMIC PRITSI
Source: WDI
Figure 2.10: Trend of bank loans in percentage of GDP

77M O R O C C O ’ S G R OW T H D I A G N O S T I C
average of about 1.1 billion dirhams over the
same period from 45.1 billion dirhams in
2009 to 48.5 billion dirhams in 2012.
The financing needs of non-financial
enterprises were met by bank credit and
the issuance of shares. In 2012, the credit
amount was 50 billion dirhams and stock
issues stood at 48 billion dirhams. On the
other hand, financial enterprises recorded
a financing capacity of 12.5 billion dirhams
in 2011, by increasing their share of debt
security issues to 17.3 billion dirhams to
meet increased credit demand.
Nevertheless, faced with a sluggish stock
market and a decline in credit growth
since 2008, the use of the private debt
market has increased significantly and
seems to be an alternative choice for
the economy’s financing requirements.
As proof, this market showed an average
annual growth of 33% between 2006 and
2012 and the volume of issues rose from
MAD 17 billion in 2006 to 78 billion in 2012.
Overall, banking intermediation was
strengthened and helped to improve net
banking income. At the same time, the
steady drop in bad and doubtful debts
(BDD) up to 2012 helped to mitigate the
risk of a banking crisis. The rate of doubtful
debts out of total bank credit allocated to
the economy stabilized overall at around
5%, a fairly moderate level and especially far
from the 20% peak recorded in the middle
of the past decade.
2.2.3 Capital Market
The capital market established in 1929
has witnessed many reforms aimed
at modernizing the stock market,
e.g. securing transactions by ensuring
information transparency and the successful
completion of transactions in securities and
integrating the Moroccan capital market
into the global financial market. However,
market capitalization as a percentage of
GDP, after developing rapidly between 2002
and 2007, has declined since 2011 (Figure
2.11), mainly on account of the financial
crisis shock.
0
100
200
300
400
1990 1995 2000 2005 2010
Perc
entag
e of G
DP
Morocco Jordan MalaysiaRomania Tunisia Turkey
Source: WDI
Figure 2.11: Market capitalization oflisted enterprises in percentage of GDP

M O R O C C O ’ S G R OW T H D I A G N O S T I C78
Overall, the stock market remains fragile
and undeveloped compared to other
countries (Table 2.3). Because of a lack of
liquidity, the Casablanca Stock Exchange is
no longer represented in the MSCI Emerging
Markets Flagship Index since November
2013 and is reclassified in the MSCI Frontier
Markets29.
The size of market capitalization is
relatively significant in the economy, but
it declined from 76% of GDP in 2010 to
52% in 2013. This significant drop reflects
the scarcity of new stock-exchange listings
and the delisting of some issuers, as well as
lower valuations. Accounting for 6% of the
economy’s financing in 2013, the amount of
funds raised through the Stock Exchange
has remained limited.
In a bid to diversify sources of financing,
venture capital developed rapidly
following the establishment of 28 new
funds since 2006 compared to 8 funds
established over the 2000-2005 period,
thus raising the total number of funds
established to 36 by the end of 2012. Even
though this number is still insufficient, the
process set in motion enabled the sector to
invest more than 2.8 billion dirhams between
2006 and 2012, for an amount of 8 billion
dirhams raised over the same period. With
a penetration rate of 0.04%, Morocco is
within the average of the MENA region.
2.2.4 Micro-Finance
Micro-finance, which is intended for
economic actors excluded from the
credit market, is particularly well
developed in Morocco and accounts for
40% of Arab world clients (Figure 2.12).
After the 2007 micro-finance crisis, the
Moroccan Government developed a new
legal framework to consolidate the sector.
29 Morocco, Egypt and South Africa were the only African countries included in the MSCI index of emerging markets.
Marketcapitalization(% of GDP)
Number of listed
enterprises
Morocco 54.41 76Jordan -86.41 243Malaysia 156.94 921Romania 9.4 77Tunisia 19.46 59Turkey 39.12 405Egypt 22.5 234South Africa 159.3 348
Table 2.3: The stock market in Morocco andcomparable countries
Source: WDI

79M O R O C C O ’ S G R OW T H D I A G N O S T I C
2.3 Cost of Financing
Moroccan real interest rates had
dropped continuously between 2000 and
2007, but the financial crisis shock and
the rising default risk have made them
rise again to above 5% since 2009.
At the same time, significant improvements
were made to the operation of the
money market. The Moroccan interest rate
market has become the most sophisticated
in Africa and among the most developed
in emerging countries. Since 2011, the
Central Bank has published a benchmark
yield curve which helps to i) improve
money market transparency and ii) serve
as a reference to the rapidly developing
bond market for both public and private
debts.
2.3.1 Cost of Public Sector Financing
The public sector can opt for self-
financing through the domestic bond
market and or external borrowings on
markets or from donors.
The ‘spread’ level of Morocco’s sovereign
debt in basis points in relation to American
Treasury bills, allows the country to access
to financing on the international financial
market. Morocco’s sovereign debt spread
(250 basis points) is slightly higher than that
of Tunisia and identical to that of Indonesia
(Figure 2.13). However, it far exceeds the
rating the country was able to obtain during
the period 2004-2006.
Since 2005, international financial
institutions have become Morocco’s
main lenders after the conversion
0 200 400 600 800
2004 2005 2006 2007 2008 2009 2010 2011 2012 2013
Bulgaria Egypt Indonesia LebanonMalaysia Morocco Tunisia Turkey
Figure 2.13: Sovereign debt «spread» relative to US Treasury bonds
Source: WDI
Bangladesh
Botswana Brazil
Ethiopia
Morocco
Nicaragua
Panama
Tunisia
Yemen0
0.2
0.4
0.6
0.8
1
1.2
Figure 2.12: Loans per DH 1000in 2009
Source: Data Market

M O R O C C O ’ S G R OW T H D I A G N O S T I C80
of bilateral debts into investments
(figure 2.14).
The apparent average cost of external
debt has remained quite low since 2005
and below the apparent average cost of
domestic debt. However, the rate differences
must be weighted by the exchange risk,
which can be estimated at about 1.5% per
year, an indication that interest rate parity is
almost confirmed and justifies the choice of
debt in domestic currency in the presence
of low exchange rate volatility (Table 2.4).
The yield curve shows a partial reversal,
10-year rates being lower than 5-year
rates in 2012 and 2013 (Figure 2.15). This
may reflect two factors: i) decreasing
long-term demand for financing or; ii) a
reduction in the long-term inflationary risk
premium.
2.3.2 High Cost of Private Sector Financing
The real lending interest rate has
dropped significantly but remains high
in relation to the comparator countries
(Figure 2.16). After a steady drop in the real
lending interest rate between 2000 and
2008, its increase since 2009, due to rising
lending rates and falling inflation, places
Morocco in an unfavorable position in
relation to the comparator countries.
3.54
3.9
4.17
3.7
4.18
3.94
3.7
4.18
3.94
1 year 5 years 10 years
2010 2012 2013
Figure 2.15: Yield curve
Source: Central Bank
2005 2006 2007 2008 2009 2010 2011Average costof domesticdebt
6.20% 5.90% 5.80% 5.40% 5.12% 5.25% 4.84%
Average costof externaldebt
3.60% 3.60% 3.90% 3.90% 3.60% 3.10% 3.20%
Table 2.4: Average domestic debt/foreigndebt cost
Source: Ministry of the Economy and Finance
0 2 000 4 000 6 000 8 000
10 000 12 000 14 000
1998 1999 2000 2001 2002 2003 2004 2005 2006 2007 2008 2009 2010 2011 2012
BilateralInternational financial marketInternational institutions
Figure 2.14: Morocco’s foreign debt stock(in USD millions)
Source: Ministry of the Economy and Finance
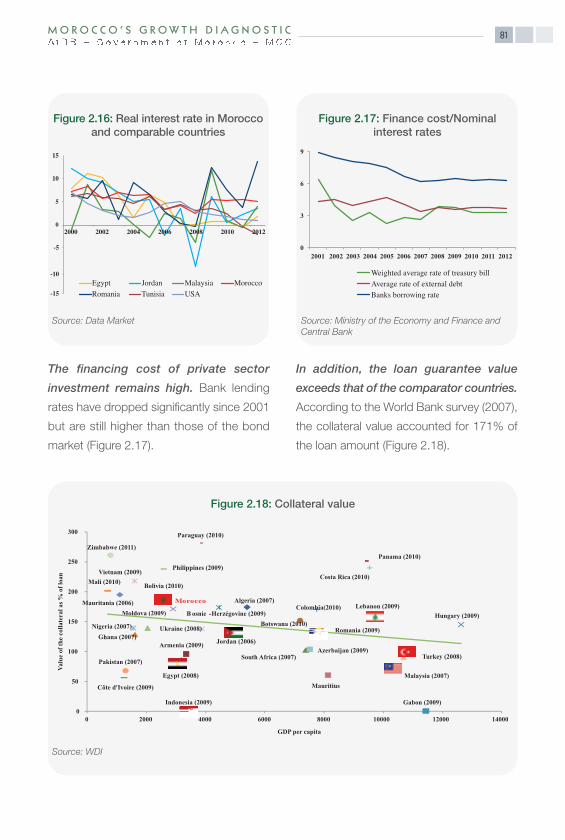
81M O R O C C O ’ S G R OW T H D I A G N O S T I C
The financing cost of private sector
investment remains high. Bank lending
rates have dropped significantly since 2001
but are still higher than those of the bond
market (Figure 2.17).
In addition, the loan guarantee value
exceeds that of the comparator countries.
According to the World Bank survey (2007),
the collateral value accounted for 171% of
the loan amount (Figure 2.18).
-15
-10
-5
0
5
10
15
Egypt Jordan Malaysia MoroccoRomania Tunisia USA
2000 2002 2004 2006 2008 2010 2012
Figure 2.16: Real interest rate in Moroccoand comparable countries
Source: Data Market
0
3
6
9
2001 2002 2003 2004 2005 2006 2007 2008 2009 2010 2011 2012
Weighted average rate of treasury billAverage rate of external debtBanks borrowing rate
Figure 2.17: Finance cost/Nominalinterest rates
Source: Ministry of the Economy and Finance and Central Bank
Algeria (2007)
Armenia (2009)Azerbaijan (2009)
Bolivia (2010)
B osnie -Herzégovine (2009)Botswana (2010)
Colombia(2010)
Costa Rica (2010)
Côte d'Ivoire (2009)
Egypt (2008)
Gabon (2009)
Ghana (2007)
Hungary (2009)
Indonesia (2009)
Jordan (2006)
Lebanon (2009)
Malaysia (2007)
Mali (2010)
Mauritania (2006)
Mauritius
Moldova (2009)
Morocco
Nigeria (2007)
Pakistan (2007)
Panama (2010)
Paraguay (2010)
Philippines (2009)
Romania (2009)
South Africa (2007) Turkey (2008)
Ukraine (2008)
Vietnam (2009)
Zimbabwe (2011)
0
50
100
150
200
250
300
0 2000 4000 6000 8000 10000 12000 14000
Valu
e of
the
colla
tera
l as %
of l
oan
GDP per capita
Figure 2.18: Collateral value
Source: WDI

M O R O C C O ’ S G R OW T H D I A G N O S T I C82
2.4 Growth Diagnostic Tests
2.4.1 Type 1 Test: Correlation betweenReal Interest Rate and GDP per capita
Short-term real interest rates can be
controlled by the Central Bank to
ensure that, through consumption and
investment, real interest rates can have
an impact on growth and the GDP per
capita level. The effects are not, however,
unequivocal and depend on the phase of
the business cycle and production capacity
utilization rate. Long-term monetary policy
is neutral and interest rates are determined
by fiscal policy which sets the yield curve on
the secondary bond market.
The lack of relationship between the real
interest rate and GDP per capita
(horizontal IS curve) would indicate that
investment is not sensitive to interest
rate variation and that, in the overall
balance, it is quantitative monetary
policy that has an impact through
inflation control. Thus, the test measures
the impact of interest rates on growth in
Morocco and situates the country in relation
to comparator countries to answer the
following question: are real interest rates too
high given the GDP per capita level?
In 2000, Morocco had a comparative
advantage over the comparator countries:
its real interest rate (7.19%) was relatively
low considering the level of development
(Figure 2.19).
On the other hand, in 2010, despite the
drop in the real interest rate (5.35%), the
Moroccan economy no longer had any
advantage over the comparator countries,
which sharply reduced their interest rates in order
to revive the economic activity (Figure 2.20).
Jordan
Morocco Romania
Tunisia
-2
0
2
4
6
8
10
12
14
0 2000 4000 6000 8000 10000R
eal i
nter
est r
ate
GDP per capita PPP
Egypt
Malaysia
Figure 2.19: Interest rate and GDP/per capita relationship (2000)
Source: Authors’ calculations
EgyptJordan
Malaysia
Morocco
Romania
012345678
0 2000 4000 6000 8000 10000 12000 14000
Real
intere
st ra
te
GDP per capita PPP
Tunisia
Figure 2.20: Relationship between interestrate and GDP/per capita (2010)
Source: Authors’ calculations
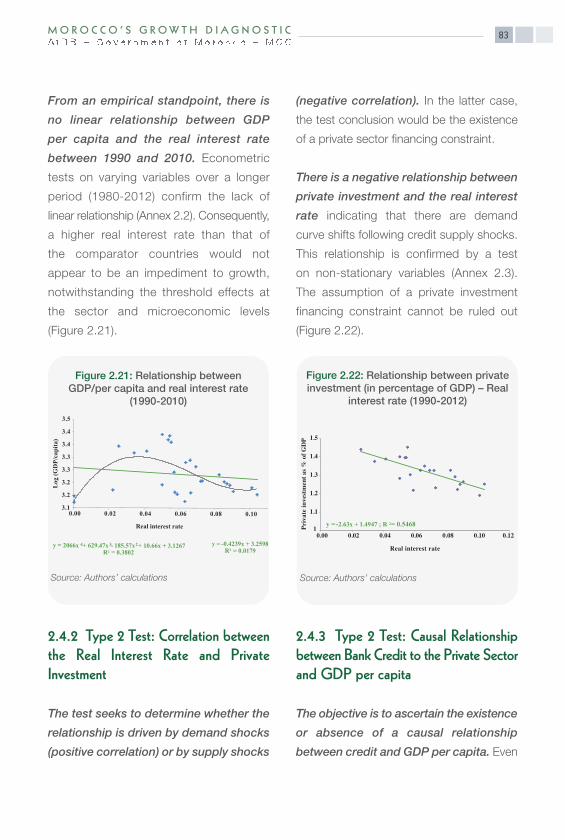
83M O R O C C O ’ S G R OW T H D I A G N O S T I C
From an empirical standpoint, there is
no linear relationship between GDP
per capita and the real interest rate
between 1990 and 2010. Econometric
tests on varying variables over a longer
period (1980-2012) confirm the lack of
linear relationship (Annex 2.2). Consequently,
a higher real interest rate than that of
the comparator countries would not
appear to be an impediment to growth,
notwithstanding the threshold effects at
the sector and microeconomic levels
(Figure 2.21).
2.4.2 Type 2 Test: Correlation betweenthe Real Interest Rate and Private Investment
The test seeks to determine whether the
relationship is driven by demand shocks
(positive correlation) or by supply shocks
(negative correlation). In the latter case,
the test conclusion would be the existence
of a private sector financing constraint.
There is a negative relationship between
private investment and the real interest
rate indicating that there are demand
curve shifts following credit supply shocks.
This relationship is confirmed by a test
on non-stationary variables (Annex 2.3).
The assumption of a private investment
financing constraint cannot be ruled out
(Figure 2.22).
2.4.3 Type 2 Test: Causal Relationshipbetween Bank Credit to the Private Sectorand GDP per capita
The objective is to ascertain the existence
or absence of a causal relationship
between credit and GDP per capita. Even
y = 2066x 4+ 629.47x 3- 185.57x2+ 10.66x + 3.1267R = 0.3802
y = -0.4239x + 3.2598R = 0.0179
3.1
3.2
3.2
3.3
3.3
3.4
3.4
3.5
0.00 0.02 0.04 0.06 0.08 0.10
Log
(GD
P/ca
pita
)
Real interest rate
Figure 2.21: Relationship betweenGDP/per capita and real interest rate
(1990-2010)
Source: Authors’ calculations
y = -2.63x + 1.4947 ; R = 0.54681
1.1
1.2
1.3
1.4
1.5
0.00 0.02 0.04 0.06 0.08 0.10 0.12
Priva
te in
vestm
ent a
s % of
GDP
Real interest rate
Figure 2.22: Relationship between privateinvestment (in percentage of GDP) – Real
interest rate (1990-2012)
Source: Authors’ calculations
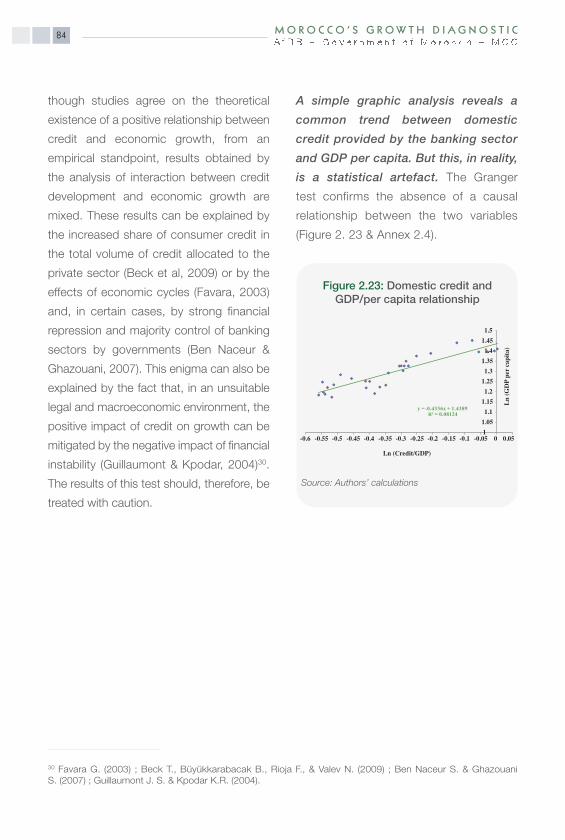
M O R O C C O ’ S G R OW T H D I A G N O S T I C84
though studies agree on the theoretical
existence of a positive relationship between
credit and economic growth, from an
empirical standpoint, results obtained by
the analysis of interaction between credit
development and economic growth are
mixed. These results can be explained by
the increased share of consumer credit in
the total volume of credit allocated to the
private sector (Beck et al, 2009) or by the
effects of economic cycles (Favara, 2003)
and, in certain cases, by strong financial
repression and majority control of banking
sectors by governments (Ben Naceur &
Ghazouani, 2007). This enigma can also be
explained by the fact that, in an unsuitable
legal and macroeconomic environment, the
positive impact of credit on growth can be
mitigated by the negative impact of financial
instability (Guillaumont & Kpodar, 2004)30.
The results of this test should, therefore, be
treated with caution.
A simple graphic analysis reveals a
common trend between domestic
credit provided by the banking sector
and GDP per capita. But this, in reality,
is a statistical artefact. The Granger
test confirms the absence of a causal
relationship between the two variables
(Figure 2. 23 & Annex 2.4).
30 Favara G. (2003) ; Beck T., Büyükkarabacak B., Rioja F., & Valev N. (2009) ; Ben Naceur S. & Ghazouani S. (2007) ; Guillaumont J. S. & Kpodar K.R. (2004).
11.051.1
1.151.2
1.251.3
1.351.4
1.451.5
-0.6 -0.55 -0.5 -0.45 -0.4 -0.35 -0.3 -0.25 -0.2 -0.15 -0.1 -0.05 0 0.05
Ln (Credit/GDP)
Ln (G
DP pe
r cap
ita)
y = -0.4336x + 1.4389R = 0.08124
Figure 2.23: Domestic credit andGDP/per capita relationship
Source: Authors’ calculations
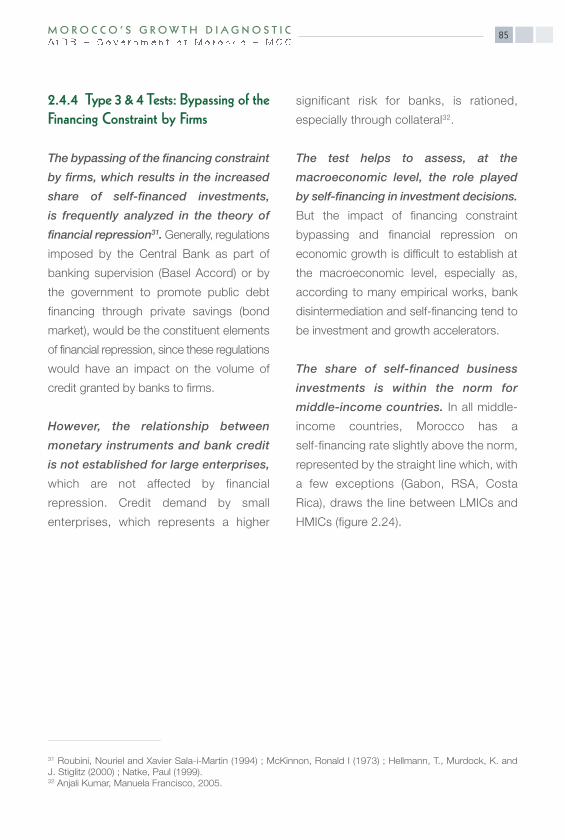
85M O R O C C O ’ S G R OW T H D I A G N O S T I C
2.4.4 Type 3 & 4 Tests: Bypassing of theFinancing Constraint by Firms
The bypassing of the financing constraint
by firms, which results in the increased
share of self-financed investments,
is frequently analyzed in the theory of
financial repression31. Generally, regulations
imposed by the Central Bank as part of
banking supervision (Basel Accord) or by
the government to promote public debt
financing through private savings (bond
market), would be the constituent elements
of financial repression, since these regulations
would have an impact on the volume of
credit granted by banks to firms.
However, the relationship between
monetary instruments and bank credit
is not established for large enterprises,
which are not affected by financial
repression. Credit demand by small
enterprises, which represents a higher
significant risk for banks, is rationed,
especially through collateral32.
The test helps to assess, at the
macroeconomic level, the role played
by self-financing in investment decisions.
But the impact of financing constraint
bypassing and financial repression on
economic growth is difficult to establish at
the macroeconomic level, especially as,
according to many empirical works, bank
disintermediation and self-financing tend to
be investment and growth accelerators.
The share of self-financed business
investments is within the norm for
middle-income countries. In all middle-
income countries, Morocco has a
self-financing rate slightly above the norm,
represented by the straight line which, with
a few exceptions (Gabon, RSA, Costa
Rica), draws the line between LMICs and
HMICs (figure 2.24).
31 Roubini, Nouriel and Xavier Sala-i-Martin (1994) ; McKinnon, Ronald I (1973) ; Hellmann, T., Murdock, K. and J. Stiglitz (2000) ; Natke, Paul (1999).32 Anjali Kumar, Manuela Francisco, 2005.

M O R O C C O ’ S G R OW T H D I A G N O S T I C86
Furthermore, based on recent national
accounting data, self-financing in Morocco
has witnessed a downtrend since 2010.
As shown by the relationship between
the savings of non-financial enterprises and
their investment, the self-financing rate
of non-financial enterprises fell from 73%
in 2010 to 58% in 2012, representing a
15-point decrease.
In addition, the share of bank credit-
financed investments places Morocco
within the norm for all middle-income
countries (Figure 2.25).
Algeria (2007)
Armenia (2009)
Azerbaijan (2009)
Bolivia (2010)
B osnie - Herzégovina (2009)
Botswana (2010)
Colombia (2010)
Costa Rica (2010)
Côte d'Ivoire (2009)
Egypt (2008)
Gabon (2009)
Ghana (2007)
Hungary (2009)
Indonesia (2009) Jordan
Lebanon
Malaysia (2007)
Mali (2010)
Mauritania (2006)
Mauritius (2009)
Moldavie (2009)
Morocco (2007)
Nigeria (2007)
Pakistan (2007)
Panama (2010)
Paraguay (2010)
Philippines (2009)
Romania (2009)
South Africa (2007)
Turkey (2008)Ukraine (2008)
Vietnam (2009)
Zimbabwe (2011)
30
40
50
60
70
80
90
100
0 2000 4000 6000 8000 10000 12000 14000
Perc
enta
ge o
f sel
f-fina
nced
inve
stm
ent
GDP per capita
Figure 2.24: Share of self-financed investments
Source: WDI and Authors’ calculations

2.5 Second-Round Effects
The absence of a constraint to access
to public sector domestic and foreign
finance potentially induces second round
effects.
• Crowding-Out Effect
Rising public investment and the ensuing
deficits can generate a private investment
crowding-out effect. It is, therefore, necessary
to determine the extent to which banks tend
to prefer bond purchases, at the expense of
loan awards to enterprises for investments
in the most productive sectors.
• Price Distortion
A current account deficit can lead to
price distortions between tradable goods
(imports and exports) and non-tradable
goods (agriculture, services, construction),
and thus induce a loss of competitiveness
(increase in the internal real exchange
rate)33.
87M O R O C C O ’ S G R OW T H D I A G N O S T I C
33 The price relationship between non-tradable goods and tradable goods.
Algeria (2007)Azerbaijan (2009)
Bosnia - Herzegovina (2009)
Botswana (2010)
Costa Rica (2010)
Côte d'Ivoire (2009)Egypt (2008)
Gabon (2009)
Hungary (2009)
Indonesia (2009)
Jordan (2006)
Lebanon (2009)
Malaysia (2007)
Mali (2010)
Mauritania (2006)
Mauritius (2009)
Moldova (2009)
Morocco (2007)
Nigeria (2007)
Pakistan (2007)
Panama (2010)
Paraguay (2010)
Philippines (2009)
Romania (2009)
South Africa (2007)
Turkey (2008)
Ukraine (2008)
Vietnam (2009)
0
5
10
15
20
25
30
35
40
45
0 2000 4000 6000 8000 10000 12000 14000
% B
ank-
finan
ced
inve
stm
ent
GDP per capita
Figure 2.25: Share of bank-financed investments
Source: WDI and Authors’ calculations
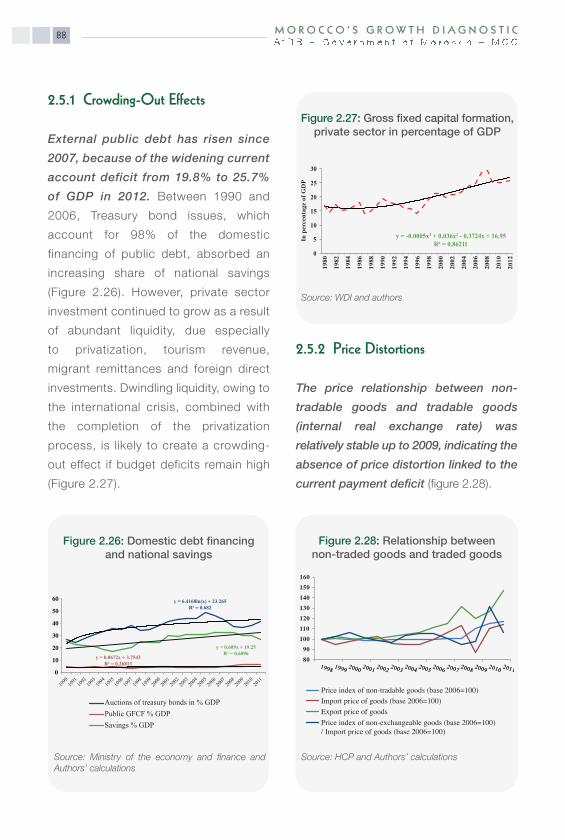
M O R O C C O ’ S G R O W T H D I A G N O S T I C88
2.5.1 Crowding-Out Effects
External public debt has risen since
2007, because of the widening current
account deficit from 19.8% to 25.7%
of GDP in 2012. Between 1990 and
2006, Treasury bond issues, which
account for 98% of the domestic
financing of public debt, absorbed an
increasing share of national savings
(Figure 2.26). However, private sector
investment continued to grow as a result
of abundant liquidity, due especially
to privatization, tourism revenue,
migrant remittances and foreign direct
investments. Dwindling liquidity, owing to
the international crisis, combined with
the completion of the privatization
process, is likely to create a crowding-
out effect if budget deficits remain high
(Figure 2.27).
2.5.2 Price Distortions
The price relationship between non-
tradable goods and tradable goods
(internal real exchange rate) was
relatively stable up to 2009, indicating the
absence of price distortion linked to the
current payment deficit (figure 2.28).
y = -0.0005x3 + 0.036x2 - 0.3724x + 16.95 R = 0.86211
0
5
10
15
20
25
30
1980
1982
1984
1986
1988
1990
1992
1994
1996
1998
2000
2002
2004
2006
2008
2010
2012
In p
erce
ntag
e of
GD
P
Figure 2.27: Gross fixed capital formation,private sector in percentage of GDP
Source: WDI and authors
Auctions of treasury bonds in % GDPPublic GFCF % GDPSavings % GDP
y = 6.4168ln(x) + 23.265 R = 0.682
y = 0.0672x + 3.7543 R = 0.26813
y = 0.609x + 19.25 R = 0.6096
0 10 20 30 40 50 60
Figure 2.26: Domestic debt financingand national savings
Source: Ministry of the economy and finance and Authors’ calculations
8090
100110120130140150160
Price index of non-tradable goods (base 2006=100)Import price of goods (base 2006=100)Export price of goodsPrice index of non-exchangeable goods (base 2006=100) / Import price of goods (base 2006=100)
Figure 2.28: Relationship betweennon-traded goods and traded goods
Source: HCP and Authors’ calculations

Access to external financing does not lead
to an increase in the internal real exchange
rate because of the combined effects of
inflation control by the Central Bank and
the subsidy policy. However, reform of the
compensation system could lead to a drop
in the prices of non-tradable goods and an
improvement in the real exchange rate.
89M O R O C C O ’ S G R OW T H D I A G N O S T I C


Chapter 3
Human Capital

Chapter 3: Human Capital
Key Messages
• The lack of human capital, a very important factor of production for long-term growth,
is a major challenge to private investment.
• Morocco is in a demographic transition phase following improved life expectancy and
declining mortality and fertility rates. This phase is characterized by a transformation of
the population structure by ages (drop in dependence ratio) and the highly significant
phenomenon of urbanization.
• The national health policy, established by the Moroccan Government for some years
now, has helped to improve the population’s health status (longer life expectancy, lower
fertility and mortality rates, reduction in communicable diseases etc...).
• Currently, the Moroccan population’s health situation is not a major obstacle to private
investment. However, the examination of various health indicators by region reveals
significant inequalities in terms of quality and access to various health services.
• Morocco has invested greatly in education in recent years. However, returns on these
investments and the literacy rate remain low in relation to the comparator countries.
The education system is marked by inequalities between men and women and between
urban and rural areas: 36.7% of the total population aged 10 years and above is illiterate,
including 51.2% of rural dwellers and 64.7% of rural women.
• Morocco has made great strides in terms of primary school enrolment (a 97% rate in
2012). On the other hand, enrolment rates in secondary and higher education remain
very low and disparate, reflecting a very wide gap and a very low average schooling
period.
• Vocational training, which has contributed to the employment of more than 64% of its
graduates, has been an important component of the Moroccan educational system for
some years now.
• Results of international assessment tests have revealed that Morocco’s student scores
are relatively low, which is the result of the failure to acquire the necessary elementary
skills to pursue their education.
• Morocco’s educational efficiency and performance in terms of education and training
are very low. This has limited any growth in the availability of trained (having taken a
M O R O C C O ’ S G R OW T H D I A G N O S T I C92
vocational training course) and skilled (having obtained higher education diplomas)
labor. At the same time, Morocco has recorded a very high rate of emigration of higher
education graduates (in relation to the comparator countries).
• The low internal and external efficiency level of the education and training system has
a negative impact on human capital accumulation in Morocco. This weakness is
explained by lack of coordination among the system’s actors (institutional, private,
civil society), the instability of applied programs and policies, the plethora and
heterogeneity of institutional stakeholders and the absence of systematic monitoring-
evaluation of all programs.
• Educational system reform has become a priority and investment in vocational
secondary education would be a necessary condition for the promotion of sustainable
growth.
• In addition to the inadequacy of skilled human capital, the mismatch between training
provided by the education and training system and the needs of enterprises is one of
the factors impacting negatively on economic growth and the employability of young
graduates.
• The test results reveal a complex situation and seem to indicate that a major constraint
to growth concerns the training of secondary and vocational training graduates, which
remain inadequate despite the efforts made.
93M O R O C C O ’ S G R OW T H D I A G N O S T I C
M O R O C C O ’ S G R OW T H D I A G N O S T I C94
Introduction
Human capital, which covers all the skills,
talents, qualifications and experience
accumulated, is a highly important factor
for long-term growth34. Education and
training are at the core of the human capital
development process.
Improvement of the level of education
and skills helps to build firms’ capacity
to create, assimilate and use new
technologies that will ultimately help
to enhance productivity. In addition,
health conditions can have a significant
impact on economic efficiency, particularly
in developing countries. Consequently,
in addition to its direct role as a factor of
production, human capital development
in its health and demographic dimensions
complements other factors such as physical
capital and natural resources.
Lack of human capital can, therefore,
represent a major challenge to growth
and impede private investment, either
from a quantitative standpoint (with an
inadequate number of persons in a fit state
to work or having received specific training),
or from a qualitative standpoint (given the
inadequate quality of training received).
This chapter will confirm that the lack of
skilled human capital is an impediment to
private investment in Morocco. According
to Moroccan firms, the lack of adequately
skilled labor is a major obstacle to the
development of their activities. The two other
dimensions, namely demographic trends and
health, do not seem to be constraints to growth.
Low returns to education in Morocco35
explain the low level of human capital
development and, consequently, the low
levels of economic growth. The analysis
highlights the importance of continuing
the efforts to generalize access to the
educational system and improve its efficiency
in order to capitalize on trade openness
and foreign direct investments. Economic
reforms cannot, on their own, have a positive
impact on the country’s development in the
absence of a real and structural reform of the
education and training systems. It is also
necessary to ensure coordination among the
different parties (public and private sector)
to establish adequate educational policies
and strategies.
34 Gary S. Becker (1964, 1993). Human Capital: A Theoretical and Empirical Analysis, with Special Reference toEducation. University of Chicago Press. 35 Low education performance both from in term of quantity (lateness in the generalization of access to the system)and of quality (retention rate, success rate, match between training and the labour needs of the national economy,etc.).

95M O R O C C O ’ S G R OW T H D I A G N O S T I C
3.1 Demographic Context
As a result of longer life expectancy and
the drop in mortality and fertility rates,
Morocco is currently in a demographic
transition phase. It has moved from a
situation of high fertility and mortality rates
to one where these rates are fairly low.
As life expectancy increased from 48
years in 1960 to 73.7 years in 2013 (Table
3.1), the fertility rate fell from 7.2 children
per woman in 1962 to 2.2 children in
2012, a rate slightly higher than the generation
replacement level (2.05 children per woman)36
(Figure 3.1) and the infant mortality rate
dropped between 1960 and 2011 from
239‰ to 28.8‰. This progress is linked to
the improvement of health services but falls
short of that observed in the comparator
countries.
Due to this demographic transition,
population growth slowed down during
the last decade: while the population grew
by an average of 2.1% per year between
1960 and 2000, its growth rate fell to 1%
between 2001 and 2012 (figure 3.2).
36 These trends were encouraged by a wide range of socio-economic factors, especially a later marriage age,longer schooling for women, better survival rates for newborns and children of lower age and increasing urbanization.
Urban area Rural area
Total Men Women Total Men Women
1990 64 63 65 65.5 55.4 57.6
2000 72.9 70.8 75.1 66.8 65.9 67.8
2007 75.7 73.7 77.7 67 67 68
2010 76.2 74.2 78.3 1.7 70.6 73
2013 76.6 74.6 78.7
Table 3.1: Trend of life expectancy bygender and by area (1980-2012)
Source: HCP
0
2
4
6
8
10
1960 1964 1968 1972 1976 1980 1984 1988 1992 1996 2000 2004 2008 2012
Chile Indonesia Malaysia MoroccoRomania Tunisia Turkey
Source: Ministry of Health, Morocco & DevelopmentIndicators, World Bank
Figure 3.1: Trend of the fertility rate inMorocco and comparable countries
(1960-2012)
0
1
2
3
4
5
1960 1964 1968 1972 1976 1980 1984 1988 1992 1996 2000 2004 2008 2012
Population growth (annuel %)Rural population growth (annuel %)Urban population growth (annuel %)
Source: HCP, Morocco
Figure 3.2: Trend of population growthrate (1960-2012)
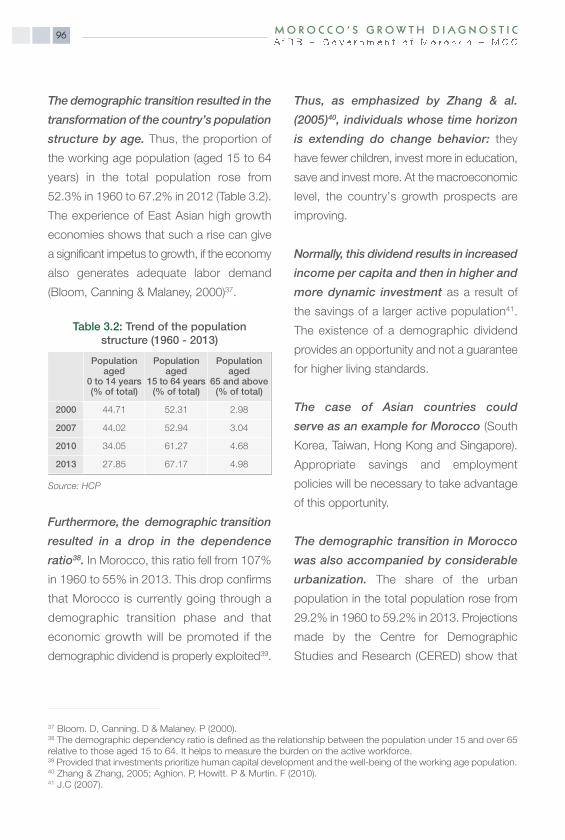
M O R O C C O ’ S G R OW T H D I A G N O S T I C96
The demographic transition resulted in the
transformation of the country’s population
structure by age. Thus, the proportion of
the working age population (aged 15 to 64
years) in the total population rose from
52.3% in 1960 to 67.2% in 2012 (Table 3.2).
The experience of East Asian high growth
economies shows that such a rise can give
a significant impetus to growth, if the economy
also generates adequate labor demand
(Bloom, Canning & Malaney, 2000)37.
Furthermore, the demographic transition
resulted in a drop in the dependence
ratio38. In Morocco, this ratio fell from 107%
in 1960 to 55% in 2013. This drop confirms
that Morocco is currently going through a
demographic transition phase and that
economic growth will be promoted if the
demographic dividend is properly exploited39.
Thus, as emphasized by Zhang & al.
(2005)40, individuals whose time horizon
is extending do change behavior: they
have fewer children, invest more in education,
save and invest more. At the macroeconomic
level, the country’s growth prospects are
improving.
Normally, this dividend results in increased
income per capita and then in higher and
more dynamic investment as a result of
the savings of a larger active population41.
The existence of a demographic dividend
provides an opportunity and not a guarantee
for higher living standards.
The case of Asian countries could
serve as an example for Morocco (South
Korea, Taiwan, Hong Kong and Singapore).
Appropriate savings and employment
policies will be necessary to take advantage
of this opportunity.
The demographic transition in Morocco
was also accompanied by considerable
urbanization. The share of the urban
population in the total population rose from
29.2% in 1960 to 59.2% in 2013. Projections
made by the Centre for Demographic
Studies and Research (CERED) show that
37 Bloom. D, Canning. D & Malaney. P (2000).38 The demographic dependency ratio is defined as the relationship between the population under 15 and over 65relative to those aged 15 to 64. It helps to measure the burden on the active workforce.39 Provided that investments prioritize human capital development and the well-being of the working age population.40 Zhang & Zhang, 2005; Aghion. P, Howitt. P & Murtin. F (2010). 41 J.C (2007).
Populationaged
0 to 14 years (% of total)
Populationaged
15 to 64 years (% of total)
Populationaged
65 and above (% of total)
2000 44.71 52.31 2.98
2007 44.02 52.94 3.04
2010 34.05 61.27 4.68
2013 27.85 67.17 4.98
Table 3.2: Trend of the populationstructure (1960 - 2013)
Source: HCP

97M O R O C C O ’ S G R OW T H D I A G N O S T I C
the urbanization rate will be 69% in 2050.
This situation might create problems in the
long run, if adequate policies and strategies
are not implemented (pressure on land,
unemployment, etc.).
Beyond the demographic dividend,
increased life expectancy, which occurs
during the demographic transition, plays
a decisive role. The school age population
fell slightly during the 2009-2014 period
following a reduction in the number of
children by almost 350 000 between 2009
and 2014, distributed among the three
age groups (Table 3.3). This creates less
demographic pressure on the educational
system.
3.2 Health Environment
Health remains a major pillar of a country’s
economic and social development. Indeed,
a population’s poor health conditions might
reduce its efficiency and productivity.
The Moroccan Government has, for
some years now, established a proactive
policy to improve its population’s health
situation. This strategy aims to ensure
equity in care provision among regions and
between urban and rural areas, facilitate its
access for the poorest and make the health
system credible by improving its responsiveness
and by reducing the cost of healthcare and
drugs. It also seeks to reduce the share
borne by households in health financing to
less than 25% by the year 2015 and to
totally take charge of long-term illnesses.
The health policy implemented has led to
a marked improvement in Morocco’s
health indicators. Indeed, the under-five
mortality rate fell sharply between 1987 and
2011 from 76‰ to 30.5‰. The same
downward trend was observed for infant
mortality over the same period (from 57.4‰
to 28.8‰). This trend results from
progress made in the control of morbidity
specific to this age group, either through
the immunization program (almost 94%
of children received all their mandatory
vaccinations in 2009), or the diarrheal
diseases and acute respiratory infections
control program.
However, despite the efforts made,
wide disparities remain between areas.
Infant and under-five mortality rates remain
high in rural compared to urban areas
(Figure 3.3).
2004 2014 2030
6-11 yearsBoys 1913 1752 1626Girls 1847 1675 1570Total 3760 3427 3196
12-14 years
Boys 1005 897 834
Girls 975 864 809
Total 1980 1761 1643
15-17 years
Boys 956 912 846
Girls 954 882 818
Total 1910 1794 1664
Table 3.3: Trend school-age population byage group, in thousand
Source: HCP

M O R O C C O ’ S G R O W T H D I A G N O S T I C98
These disparities are explained by i) the
socio-economic deficit experienced by
rural disadvantaged areas, ii) cultural
considerations and iii) inadequacies of
the health system in these areas. Areas
like Tangier-Tetouan or Marrakesh and Fez
still have a shortage of doctors (both in the
public and private sector) in relation to their
population size.
Despite the efforts made in this area,
levels of infant mortality in Morocco
remain high in relation to most countries
of the MENA region and reference
countries. Currently, the infant and child
mortality rate (under-five) in Morocco is
30.5‰, a rate significantly higher than those
of the comparator countries (only Indonesia
has a comparable rate).
Regional disparities are also observed at
the level of other health indicators such
as maternal mortality. Indeed, despite a
sharp drop during the last twenty years,
mortality rates in rural areas remain high
(the maternal mortality ratio in rural areas is
double that in urban areas: 148 compared
to 73 deaths per 100 000 live births in
2011)42 (Figure 3.4). This is due to a lack of
antenatal care and the low proportion of
deliveries in a supervised environment. The
situation is compounded by inadequate
hospital capacity, which has not increased at
the same rate as that of the population.
Morocco is expected to intensify its efforts
to achieve the Millennium Development
Goal in 2015, i.e. 83 deaths per 100 000
live births.
25.42 23.56
35.07 33.57
0
10
20
30
40
Under-five mortality(per 1000)
Infant mortality(per 1000)
Urban area Rural area
Source: Ministry of Health, Morocco
Figure 3.3: Child mortality rate in Morocco,by area
25
220
112
29 2756
200
50
100
150
200
250
Chile Indonesia Morocco Malaysia Romania Tunisia Turkey
Source: Ministry of Health, Morocco & DevelopmentIndicators, World Bank
Figure 3.4: Maternal mortality rate(per 100 000 live births) in Morocco and
comparable countries (2011-2012)
42 Ministry of Health, Kingdom of Morocco, “2012- 2016 Plan of action to accelerate the reduction of maternal andneonatal mortality, End of the 2015 countdown”, with the support of UNICEF & UNFPA.
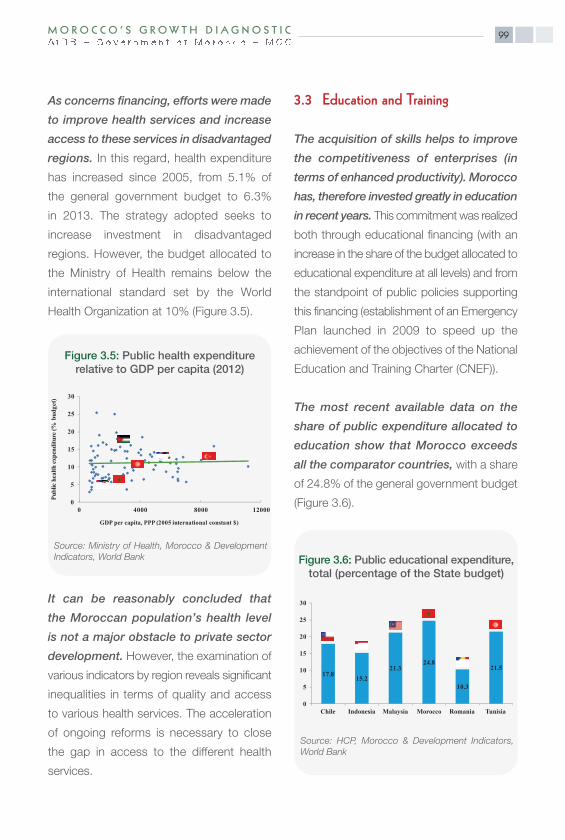
99M O R O C C O ’ S G R OW T H D I A G N O S T I C
As concerns financing, efforts were made
to improve health services and increase
access to these services in disadvantaged
regions. In this regard, health expenditure
has increased since 2005, from 5.1% of
the general government budget to 6.3%
in 2013. The strategy adopted seeks to
increase investment in disadvantaged
regions. However, the budget allocated to
the Ministry of Health remains below the
international standard set by the World
Health Organization at 10% (Figure 3.5).
It can be reasonably concluded that
the Moroccan population’s health level
is not a major obstacle to private sector
development. However, the examination of
various indicators by region reveals significant
inequalities in terms of quality and access
to various health services. The acceleration
of ongoing reforms is necessary to close
the gap in access to the different health
services.
3.3 Education and Training
The acquisition of skills helps to improve
the competitiveness of enterprises (in
terms of enhanced productivity). Morocco
has, therefore invested greatly in education
in recent years. This commitment was realized
both through educational financing (with an
increase in the share of the budget allocated to
educational expenditure at all levels) and from
the standpoint of public policies supporting
this financing (establishment of an Emergency
Plan launched in 2009 to speed up the
achievement of the objectives of the National
Education and Training Charter (CNEF)).
The most recent available data on the
share of public expenditure allocated to
education show that Morocco exceeds
all the comparator countries, with a share
of 24.8% of the general government budget
(Figure 3.6). 0
5
10
15
20
25
30
0 4000 8000 12000
Publ
ic h
ealth
expe
nditu
re (%
bud
get)
GDP per capita, PPP (2005 international constant $)
Source: Ministry of Health, Morocco & DevelopmentIndicators, World Bank
Figure 3.5: Public health expenditurerelative to GDP per capita (2012)
17.815.2
21.324.8
10.3
21.5
0
5
10
15
20
25
30
Chile Indonesia Malaysia Morocco Romania Tunisia
Source: HCP, Morocco & Development Indicators,World Bank
Figure 3.6: Public educational expenditure,total (percentage of the State budget)

M O R O C C O ’ S G R OW T H D I A G N O S T I C100
However, the results of these investments
remain low. Indeed, the efforts made have
undoubtedly helped to improve education
levels, but a wide gap remains to be closed.
Indeed, the literacy rate remains relatively
low in relation to the comparator countries,
which have rates above 90%. In addition,
there are literacy inequalities between men
and women and by area: in 2012, illiteracy
affected 36.7% of the total population aged
10 years and above, 51.2% of rural dwellers
and 64.7% of rural women (figure 3.7). The
overall rate is very high compared to the
reference countries.
3.3.1 Enrolment Rate
Over the period 2007-2012, the specific
enrolment rate increased only marginally
from 59% in 2007-2008 to 63.5% in
2012-2013. In rural areas, the situation is
more worrisome, despite a slight improvement
of this rate from 42% to 45.5% for the same
period.
International comparison in terms of
the gross pre-schooling rate (figure 3.8)
shows that Morocco is well placed
compared to Arab countries and even to
countries with similar economies.
This observation should be qualified due
to the fact that Moroccan pre-schooling
is predominantly traditional and that the
age group targeted by other countries may
range from 3 to 6 years.
Primary education enrolment rates rose
significantly between 2008 and 2012 and
universal enrolment has almost been
achieved (figure 3.9). Morocco has made
great strides in primary education and the
primary net enrolment rate rose from 90.1%
in 2007-2008 to 99.6% in 2012-2013. In
rural areas, it rose from 84.5% in 2007-08 to
97.9% in 2012-13. As concerns girls’ education,
the net enrollment rate rose from 88% in
2007-2008 to 99.1% in 2012-2013.
0
20
40
60
80
100
Adult literacy rate(%), Total
Adult literacy rate (%), Male
Adult literacy rate (%), Female
67 7658
Source: HCP
Figure 3.7: Literacy rate(percentage of person aged 15 years and
above), Morocco 2011
1324 28 32 39 44 51 52 54 55 55 56 63 66 67
77 79 8297 100
109119126
0
20
40
60
80
100
120
140
Sene
gal
Egy
ptC
amer
oon
Jord
anPa
lest
ine
Iran
Phili
ppin
esK
enya
Chi
naIn
daQ
atar
Chi
leM
oroc
coPo
land
Mal
aysia
Alg
eria
Rom
ania
Viet
nam
Ukr
aine
Tha
iland
Fran
ceSo
uth
Kor
eaSp
ain
Source: Collection of world data on education 2012,ISU
Figure 3.8: Gross enrollment rate inpre-primary education by country in 2010
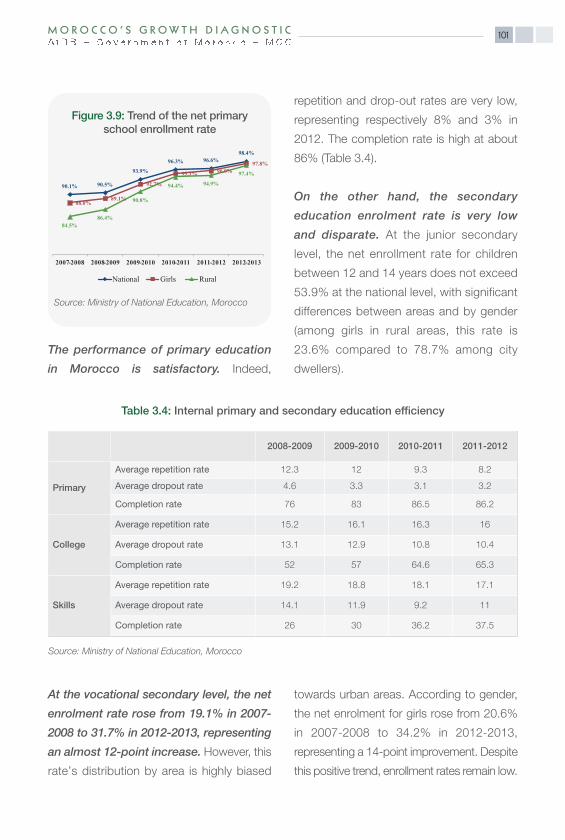
101M O R O C C O ’ S G R OW T H D I A G N O S T I C
The performance of primary education
in Morocco is satisfactory. Indeed,
repetition and drop-out rates are very low,
representing respectively 8% and 3% in
2012. The completion rate is high at about
86% (Table 3.4).
On the other hand, the secondary
education enrolment rate is very low
and disparate. At the junior secondary
level, the net enrollment rate for children
between 12 and 14 years does not exceed
53.9% at the national level, with significant
differences between areas and by gender
(among girls in rural areas, this rate is
23.6% compared to 78.7% among city
dwellers).
90.1% 90.5%
93.9%
96.3% 96.6%98.4%
88.0%89.1%
92.7%
95.3% 96.0%97.8%
84.5%86.4%
90.8%
94.4% 94.9%
97.4%
2007-2008 2008-2009 2009-2010 2010-2011 2011-2012 2012-2013
National Girls Rural
Source: Ministry of National Education, Morocco
Figure 3.9: Trend of the net primaryschool enrollment rate
2008-2009 2009-2010 2010-2011 2011-2012
Primary
Average repetition rate 12.3 12 9.3 8.2
Average dropout rate 4.6 3.3 3.1 3.2
Completion rate 76 83 86.5 86.2
College
Average repetition rate 15.2 16.1 16.3 16
Average dropout rate 13.1 12.9 10.8 10.4
Completion rate 52 57 64.6 65.3
Skills
Average repetition rate 19.2 18.8 18.1 17.1
Average dropout rate 14.1 11.9 9.2 11
Completion rate 26 30 36.2 37.5
Table 3.4: Internal primary and secondary education efficiency
Source: Ministry of National Education, Morocco
At the vocational secondary level, the net
enrolment rate rose from 19.1% in 2007-
2008 to 31.7% in 2012-2013, representing
an almost 12-point increase. However, this
rate’s distribution by area is highly biased
towards urban areas. According to gender,
the net enrolment for girls rose from 20.6%
in 2007-2008 to 34.2% in 2012-2013,
representing a 14-point improvement. Despite
this positive trend, enrollment rates remain low.
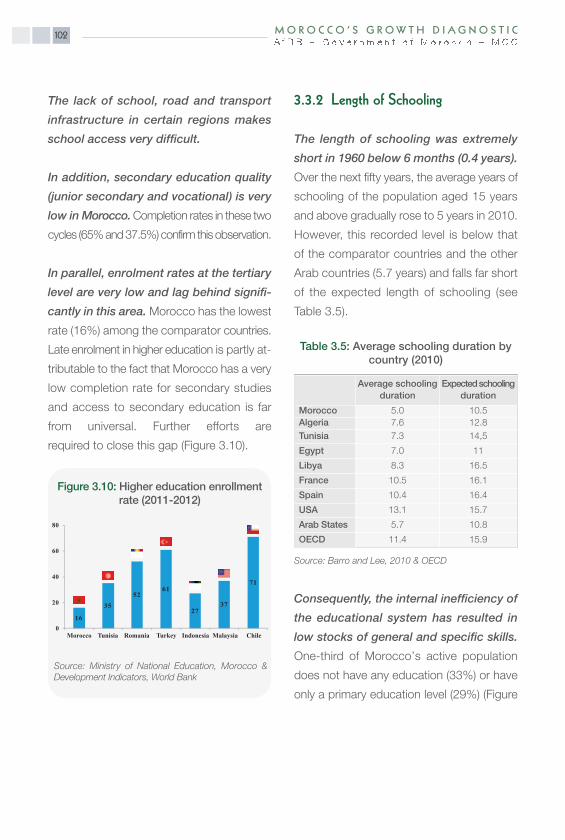
M O R O C C O ’ S G R OW T H D I A G N O S T I C102
The lack of school, road and transport
infrastructure in certain regions makes
school access very difficult.
In addition, secondary education quality
(junior secondary and vocational) is very
low in Morocco.Completion rates in these two
cycles (65% and 37.5%) confirm this observation.
In parallel, enrolment rates at the tertiary
level are very low and lag behind signifi-
cantly in this area. Morocco has the lowest
rate (16%) among the comparator countries.
Late enrolment in higher education is partly at-
tributable to the fact that Morocco has a very
low completion rate for secondary studies
and access to secondary education is far
from universal. Further efforts are
required to close this gap (Figure 3.10).
3.3.2 Length of Schooling
The length of schooling was extremely
short in 1960 below 6 months (0.4 years).
Over the next fifty years, the average years of
schooling of the population aged 15 years
and above gradually rose to 5 years in 2010.
However, this recorded level is below that
of the comparator countries and the other
Arab countries (5.7 years) and falls far short
of the expected length of schooling (see
Table 3.5).
Consequently, the internal inefficiency of
the educational system has resulted in
low stocks of general and specific skills.
One-third of Morocco’s active population
does not have any education (33%) or have
only a primary education level (29%) (Figure
0
20
40
60
80
Morocco Tunisia Romania Turkey Indonesia Malaysia Chile
16
3552
61
2737
71
Source: Ministry of National Education, Morocco & Development Indicators, World Bank
Figure 3.10: Higher education enrollmentrate (2011-2012)
Average schoolingduration
Expected schoolingduration
Morocco 5.0 10.5Algeria 7.6 12.8Tunisia 7.3 14,5
Egypt 7.0 11
Libya 8.3 16.5
France 10.5 16.1
Spain 10.4 16.4
USA 13.1 15.7
Arab States 5.7 10.8
OECD 11.4 15.9
Table 3.5: Average schooling duration bycountry (2010)
Source: Barro and Lee, 2010 & OECD
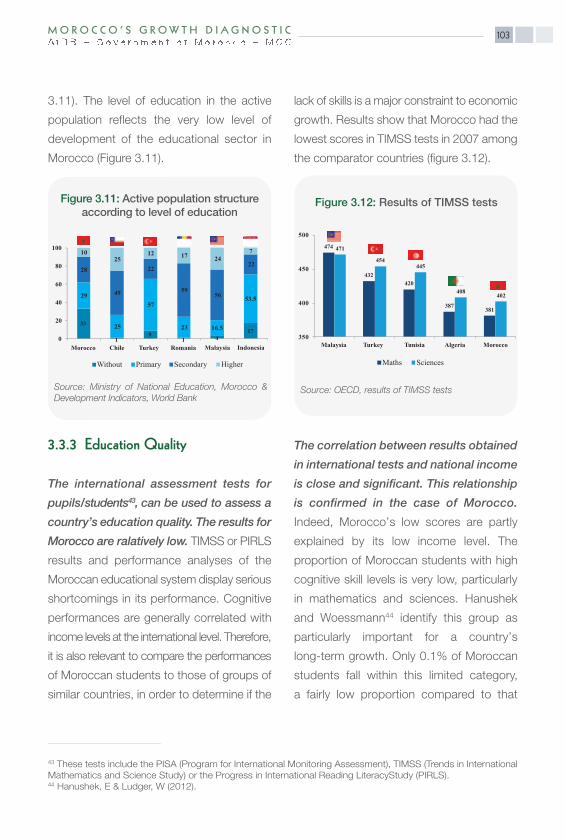
103M O R O C C O ’ S G R OW T H D I A G N O S T I C
3.11). The level of education in the active
population reflects the very low level of
development of the educational sector in
Morocco (Figure 3.11).
3.3.3 Education Quality
The international assessment tests for
pupils/students43, can be used to assess a
country’s education quality. The results for
Morocco are ralatively low. TIMSS or PIRLS
results and performance analyses of the
Moroccan educational system display serious
shortcomings in its performance. Cognitive
performances are generally correlated with
income levels at the international level. Therefore,
it is also relevant to compare the performances
of Moroccan students to those of groups of
similar countries, in order to determine if the
lack of skills is a major constraint to economic
growth. Results show that Morocco had the
lowest scores in TIMSS tests in 2007 among
the comparator countries (figure 3.12).
The correlation between results obtained
in international tests and national income
is close and significant. This relationship
is confirmed in the case of Morocco.
Indeed, Morocco’s low scores are partly
explained by its low income level. The
proportion of Moroccan students with high
cognitive skill levels is very low, particularly
in mathematics and sciences. Hanushek
and Woessmann44 identify this group as
particularly important for a country’s
long-term growth. Only 0.1% of Moroccan
students fall within this limited category,
a fairly low proportion compared to that
29
25
57
23 16.5
53.5
28
49
22
5956
22
1025
12 17 247
0
20
40
60
80
100
Morocco Chile Turkey Romania Malaysia Indonesia
Without Primary Secondary Higher
33
19
1 417
Source: Ministry of National Education, Morocco &Development Indicators, World Bank
Figure 3.11: Active population structureaccording to level of education
474
432420
387381
471
454445
408402
350
400
450
500
Malaysia Turkey Tunisia Algeria Morocco
Maths Sciences
Source: OECD, results of TIMSS tests
Figure 3.12: Results of TIMSS tests
43 These tests include the PISA (Program for International Monitoring Assessment), TIMSS (Trends in InternationalMathematics and Science Study) or the Progress in International Reading LiteracyStudy (PIRLS).44 Hanushek, E & Ludger, W (2012).

M O R O C C O ’ S G R OW T H D I A G N O S T I C104
recorded in Tunisia (0.3%), Turkey (3.9%),
Romania (4.6%) and Malaysia (6.5%).
Generally, the mediocre performance
of Moroccans in international tests
suggests that they have not acquired the
elementary skills necessary to pursue
their education. It also raises concerns
regarding the economic and social benefits
of higher education (for which fees are fully
covered by the Government).
3.3.4 Vocational Training in Morocco
Vocational training has been an important
component of the Moroccan educational
system for several years now. It contributes
to the development of various sectors of
economic activity by making skilled labor
available to them. Thus, the supply of
vocational training increased by 8% per year
between 2001 and 2010.
Having long been considered as a
means of absorbing failing students in
Morocco, vocational training now enjoys a
higher status and has led to the integration
of more than 64% of its graduates into
the labor market since 2000. Unlike university
graduates, those completing vocational
training are monitored and are often more
successful in integrating professional life,
through various youth employment support
programs established by the Government
(Idmaj (Insertion), Taehil (qualification) and
Moukawalati (business creation support
program).
Faced with the difficulties of integrating
higher education graduates into professional
life, vocational training could provide
a solution for Moroccan youths. The
relatively high integration rate shows that
vocational training meets the needs of
private investors fairly well, at least in
some sectors (80% integration rate in the
construction sector, more than 70% of
graduates of the Tetouan/Tangier region).
Of course, the integration rate does not
provide information about the sustainability
and decent nature of the employment
of vocational training beneficiaries. Only
regular monitoring surveys of graduates
some years after their integration can
address this concern. Such tracer studies
are still at the planning stage.
3.4 Growth Diagnostic Tests
3.4.1 Type 1 Test: Education and TrainingPerformance
The return on investment in education
and training is measured by estimating
the wage increase associated with the
number of years of education and training
or seniority in the profession. Thus, a high
educational wage premium that increases
over time reveals strong demand for skilled
labor. Conversely, a low wage premium
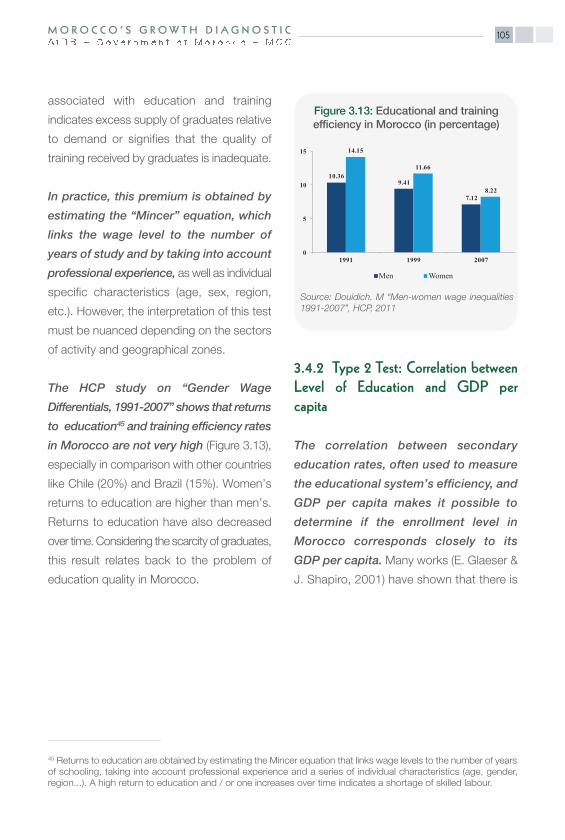
105M O R O C C O ’ S G R OW T H D I A G N O S T I C
associated with education and training
indicates excess supply of graduates relative
to demand or signifies that the quality of
training received by graduates is inadequate.
In practice, this premium is obtained by
estimating the “Mincer” equation, which
links the wage level to the number of
years of study and by taking into account
professional experience, as well as individual
specific characteristics (age, sex, region,
etc.). However, the interpretation of this test
must be nuanced depending on the sectors
of activity and geographical zones.
The HCP study on “Gender Wage
Differentials, 1991-2007” shows that returns
to education45 and training efficiency rates
in Morocco are not very high (Figure 3.13),
especially in comparison with other countries
like Chile (20%) and Brazil (15%). Women’s
returns to education are higher than men’s.
Returns to education have also decreased
over time. Considering the scarcity of graduates,
this result relates back to the problem of
education quality in Morocco.
3.4.2 Type 2 Test: Correlation betweenLevel of Education and GDP per capita
The correlation between secondary
education rates, often used to measure
the educational system’s efficiency, and
GDP per capita makes it possible to
determine if the enrollment level in
Morocco corresponds closely to its
GDP per capita. Many works (E. Glaeser &
J. Shapiro, 2001) have shown that there is
10.369.41
7.12
14.15
11.66
8.22
0
5
10
15
1991 1999 2007
Men Women
Source: Douidich. M “Men-women wage inequalities1991-2007”, HCP, 2011
Figure 3.13: Educational and trainingefficiency in Morocco (in percentage)
45 Returns to education are obtained by estimating the Mincer equation that links wage levels to the number of yearsof schooling, taking into account professional experience and a series of individual characteristics (age, gender,region...). A high return to education and / or one increases over time indicates a shortage of skilled labour.

M O R O C C O ’ S G R OW T H D I A G N O S T I C106
a positive correlation between the average
length of schooling and income per capita
and that high education levels lead to
increased GDP per capita. An educational
level lower than that expected for a given
GDP seems to indicate that further efforts
are required in terms of education, either
to safeguard competitiveness and living
standards or to improve GDP.
Enrolment rates in Morocco are lower
than those of countries with the same
income level. The correlation between
secondary education rates (often used to
measure the educational system’s efficiency)
and GDP per capita shows that Morocco
is a country whose enrolment rates are
significantly lower than they ought to be,
given their GDP per capita (Figure 3.14).
This indicates a problem of education
and training quality, confirmed by the
2013 ranking in the World Economic
Forum’s Global Competitiveness Report
(Annex 3.1).
3.4.3 Type 3 Test: Bypassing the Constraint
This test is analyzed from the standpoints
of both the firm and graduates.
This test first seeks to determine how
firms overcome the lack of skilled
labor. Generally, enterprises turn towards
continuing training to address this problem.
The widespread use of this type of training
indicates the existence of either a quantitative
or qualitative problem in education or training
since new entrants do not have the level or
adequate training to meet private sector
needs.
Second, from the standpoint of job
applicants, the test helps to determine
whether skilled labor can successfully
overcome the obstacles imposed by
insufficient demand for skilled labor.
Thus, faced with insufficient employment
supply for higher education graduates,
graduate immigration rates will be very high.
This test shows that at the higher education
level, the problem is on the demand rather
than the supply side.
0
20
40
60
80
100
120
0 3000 6000 9000
Seco
ndar
y en
rollm
ent
GDP per capita (constant 2005 USD)
Source: HCP data, Morocco & Development Indicators,World Bank
Figure 3.14: Correlation between thesecondary enrollment rate and GDP
per capita
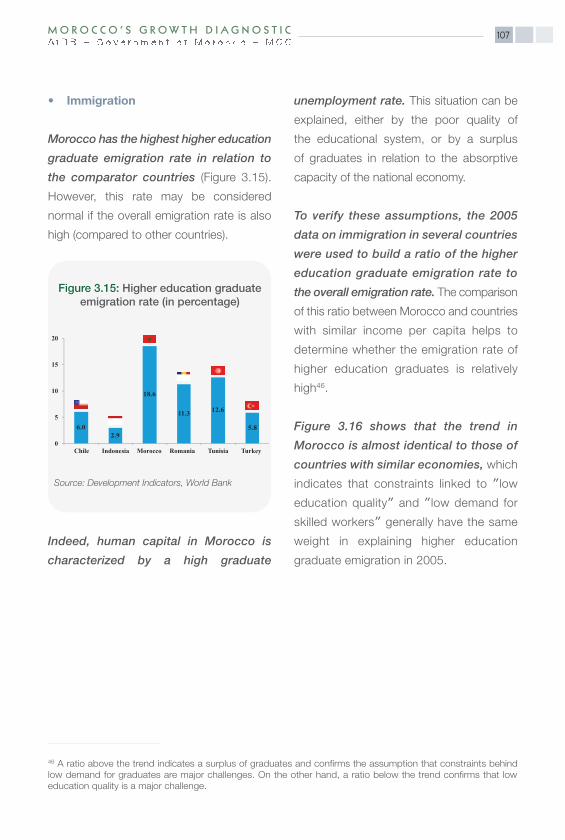
107M O R O C C O ’ S G R OW T H D I A G N O S T I C
• Immigration
Morocco has the highest higher education
graduate emigration rate in relation to
the comparator countries (Figure 3.15).
However, this rate may be considered
normal if the overall emigration rate is also
high (compared to other countries).
Indeed, human capital in Morocco is
characterized by a high graduate
unemployment rate. This situation can be
explained, either by the poor quality of
the educational system, or by a surplus
of graduates in relation to the absorptive
capacity of the national economy.
To verify these assumptions, the 2005
data on immigration in several countries
were used to build a ratio of the higher
education graduate emigration rate to
the overall emigration rate. The comparison
of this ratio between Morocco and countries
with similar income per capita helps to
determine whether the emigration rate of
higher education graduates is relatively
high46.
Figure 3.16 shows that the trend in
Morocco is almost identical to those of
countries with similar economies, which
indicates that constraints linked to ″low
education quality″ and ″low demand for
skilled workers″ generally have the same
weight in explaining higher education
graduate emigration in 2005.
46 A ratio above the trend indicates a surplus of graduates and confirms the assumption that constraints behindlow demand for graduates are major challenges. On the other hand, a ratio below the trend confirms that loweducation quality is a major challenge.
0
5
10
15
20
Chile Indonesia Morocco Romania Tunisia Turkey
6.02.9
18.6
11.3 12.6
5.8
Source: Development Indicators, World Bank
Figure 3.15: Higher education graduate emigration rate (in percentage)
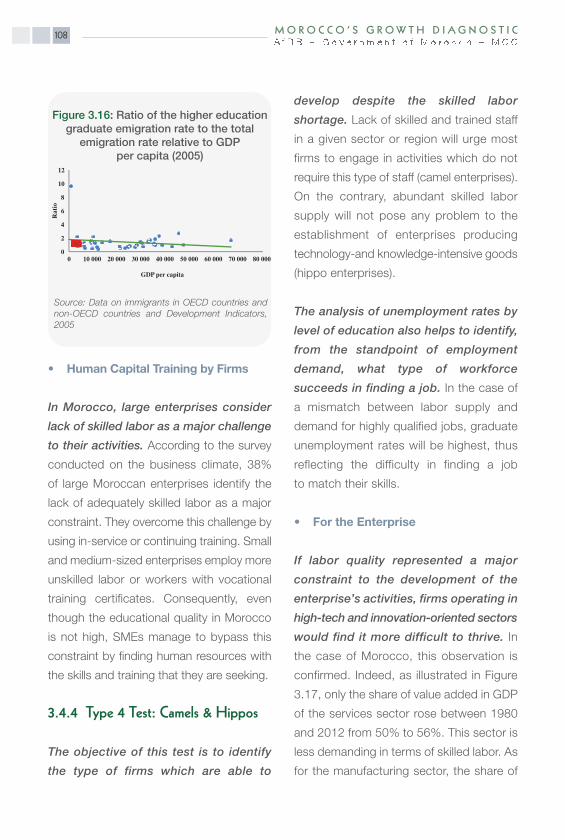
M O R O C C O ’ S G R O W T H D I A G N O S T I C108
• Human Capital Training by Firms
In Morocco, large enterprises consider
lack of skilled labor as a major challenge
to their activities. According to the survey
conducted on the business climate, 38%
of large Moroccan enterprises identify the
lack of adequately skilled labor as a major
constraint. They overcome this challenge by
using in-service or continuing training. Small
and medium-sized enterprises employ more
unskilled labor or workers with vocational
training certificates. Consequently, even
though the educational quality in Morocco
is not high, SMEs manage to bypass this
constraint by finding human resources with
the skills and training that they are seeking.
3.4.4 Type 4 Test: Camels & Hippos
The objective of this test is to identify
the type of firms which are able to
develop despite the skilled labor
shortage. Lack of skilled and trained staff
in a given sector or region will urge most
firms to engage in activities which do not
require this type of staff (camel enterprises).
On the contrary, abundant skilled labor
supply will not pose any problem to the
establishment of enterprises producing
technology-and knowledge-intensive goods
(hippo enterprises).
The analysis of unemployment rates by
level of education also helps to identify,
from the standpoint of employment
demand, what type of workforce
succeeds in finding a job. In the case of
a mismatch between labor supply and
demand for highly qualified jobs, graduate
unemployment rates will be highest, thus
reflecting the difficulty in finding a job
to match their skills.
• For the Enterprise
If labor quality represented a major
constraint to the development of the
enterprise’s activities, firms operating in
high-tech and innovation-oriented sectors
would find it more difficult to thrive. In
the case of Morocco, this observation is
confirmed. Indeed, as illustrated in Figure
3.17, only the share of value added in GDP
of the services sector rose between 1980
and 2012 from 50% to 56%. This sector is
less demanding in terms of skilled labor. As
for the manufacturing sector, the share of
0 2 4 6 8
10 12
0 10 000 20 000 30 000 40 000 50 000 60 000 70 000 80 000
Ratio
GDP per capita
Source: Data on immigrants in OECD countries andnon-OECD countries and Development Indicators,2005
Figure 3.16: Ratio of the higher educationgraduate emigration rate to the total
emigration rate relative to GDPper capita (2005)
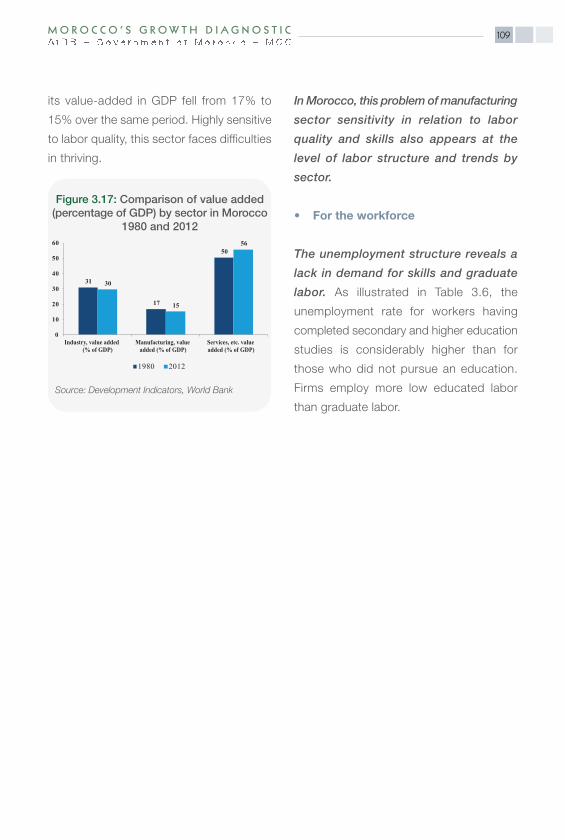
109M O R O C C O ’ S G R O W T H D I A G N O S T I C
its value-added in GDP fell from 17% to
15% over the same period. Highly sensitive
to labor quality, this sector faces difficulties
in thriving.
In Morocco, this problem of manufacturing
sector sensitivity in relation to labor
quality and skills also appears at the
level of labor structure and trends by
sector.
• For the workforce
The unemployment structure reveals a
lack in demand for skills and graduate
labor. As illustrated in Table 3.6, the
unemployment rate for workers having
completed secondary and higher education
studies is considerably higher than for
those who did not pursue an education.
Firms employ more low educated labor
than graduate labor.
31
17
50
30
15
56
0
10
20
30
40
50
60
Industry, value added (% of GDP)
Manufacturing, value added (% of GDP)
Services, etc. value added (% of GDP)
1980 2012
Figure 3.17: Comparison of value added(percentage of GDP) by sector in Morocco
1980 and 2012
Source: Development Indicators, World Bank
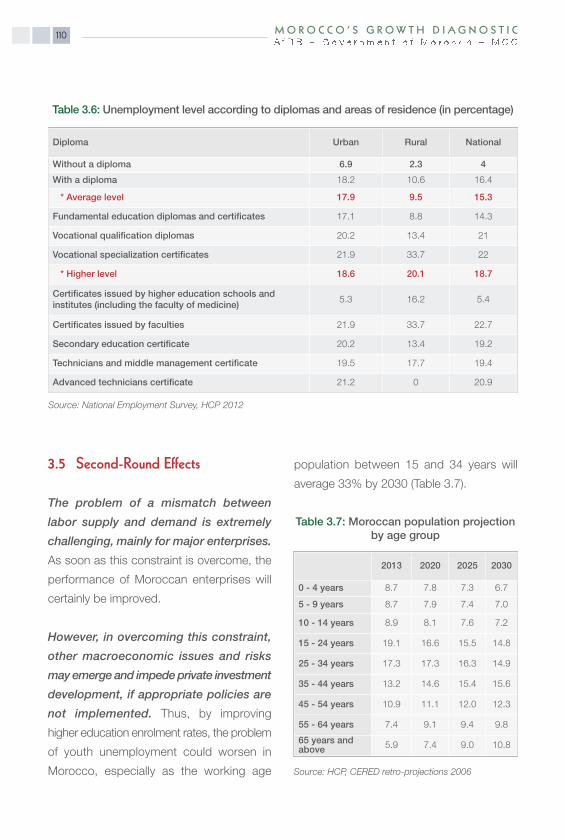
M O R O C C O ’ S G R O W T H D I A G N O S T I C110
3.5 Second-Round Effects
The problem of a mismatch between
labor supply and demand is extremely
challenging, mainly for major enterprises.
As soon as this constraint is overcome, the
performance of Moroccan enterprises will
certainly be improved.
However, in overcoming this constraint,
other macroeconomic issues and risks
may emerge and impede private investment
development, if appropriate policies are
not implemented. Thus, by improving
higher education enrolment rates, the problem
of youth unemployment could worsen in
Morocco, especially as the working age
population between 15 and 34 years will
average 33% by 2030 (Table 3.7).
Diploma Urban Rural National
Without a diploma 6.9 2.3 4
With a diploma 18.2 10.6 16.4
* Average level 17.9 9.5 15.3
Fundamental education diplomas and certificates 17.1 8.8 14.3
Vocational qualification diplomas 20.2 13.4 21
Vocational specialization certificates 21.9 33.7 22
* Higher level 18.6 20.1 18.7
Certificates issued by higher education schools and institutes (including the faculty of medicine)
5.3 16.2 5.4
Certificates issued by faculties 21.9 33.7 22.7
Secondary education certificate 20.2 13.4 19.2
Technicians and middle management certificate 19.5 17.7 19.4
Advanced technicians certificate 21.2 0 20.9
Table 3.6: Unemployment level according to diplomas and areas of residence (in percentage)
Source: National Employment Survey, HCP 2012
Table 3.7: Moroccan population projectionby age group
2013 2020 2025 2030
0 - 4 years 8.7 7.8 7.3 6.7
5 - 9 years 8.7 7.9 7.4 7.0
10 - 14 years 8.9 8.1 7.6 7.2
15 - 24 years 19.1 16.6 15.5 14.8
25 - 34 years 17.3 17.3 16.3 14.9
35 - 44 years 13.2 14.6 15.4 15.6
45 - 54 years 10.9 11.1 12.0 12.3
55 - 64 years 7.4 9.1 9.4 9.8
65 years andabove 5.9 7.4 9.0 10.8
Source: HCP, CERED retro-projections 2006

111M O R O C C O ’ S G R OW T H D I A G N O S T I C
The easing of this constraint could have
effects on wages and factor mobility.
Currently, wages are not elastic in relation to
the educational attainment. This is explained
by the scarcity of skilled labor which exactly
meets a firm’s needs. However, when this
issue of scarcity has been addressed, labor
market wage rigidity might increase.

Chapter 4
Infrastructure

M O R O C C O ’ S G R OW T H D I A G N O S T I C114
Chapter 4: Infrastructure
Key Messages
• Infrastructure in Morocco is a key factor in the country’s development process. It has
been significantly improved both in terms of quantity and quality.
• Nevertheless, wide regional disparities remain between the North and South, and the
East and West. These disparities are predominant in transport infrastructure and in
access to water and sanitation facilities.
• The electricity distribution network has been greatly expanded in urban and mainly
rural areas. However, connection costs remain high. Electricity prices for enterprises
have increased in recent years because of the Government’s decision to pass on part
of the difference between electricity generation and/or acquisition cost and its selling
price.
• Morocco is fairly well positioned in terms of infrastructure. Current infrastructure
demand is satisfied and cost does not seem to be a constraint. The level of infrastructure
is not, therefore, a fundamental constraint to growth in Morocco.
115M O R O C C O ’ S G R OW T H D I A G N O S T I C
Introduction
Infrastructure is a key factor in a country’s
development process. It is a determinant
of the failure or success of a country’s
production diversification process and
the development of its trade. By linking up
remote communities and promoting their
access to markets and employment, it also
improves the population’s living conditions.
It also helps to open up certain regions
and ensure a better distribution of wealth
countrywide.
The impact of private investments on
present and future production and
transport costs is closely linked to
infrastructure quality. Indeed, poorly
adapted infrastructure may considerably
reduce the return on private investment.
In order to increase productivity and reduce
costs, infrastructure investments must be
carried out at an appropriate rate. Thus,
infrastructure quality and its construction rate
are contributing factors to the development
of economic activity.
Morocco has made significant efforts in
constructing its infrastructure network.
They were initiated since the mid-90s
and consolidated over the last decade.
This is reflected in the various programs
and growth-generating projects that were
implemented or undertaken by the country
in several infrastructure sectors, especially
in transport (all modes), hydraulics and
drinking water supply, new information and
communication technology and energy
infrastructure.
To determine whether infrastructure is
a constraint to Moroccan growth, both
the quantity and cost of infrastructure will
be analyzed, by reviewing its trend over
time and comparing it with the reference
countries. The transport, energy, water and
sanitation sectors, and the telecommunications
sector will be analyzed.
4.1 The Moroccan Economy’s InfrastructureSupply
4.1.1 Quantitative and Qualitative Improvement of Transport in Morocco
The process of opening up to international
trade, promoted since the signing of the
Barcelona Declaration in 1995, makes
transport – land, air and maritime – a key
factor of Morocco’s economic success.
Significant quantitative and qualitative efforts
were made to develop and modernize road
and railway networks as well as to upgrade
ports and airports.
Nevertheless, the infrastructure development
strategy in Morocco has not helped to
reduce regional inequalities.
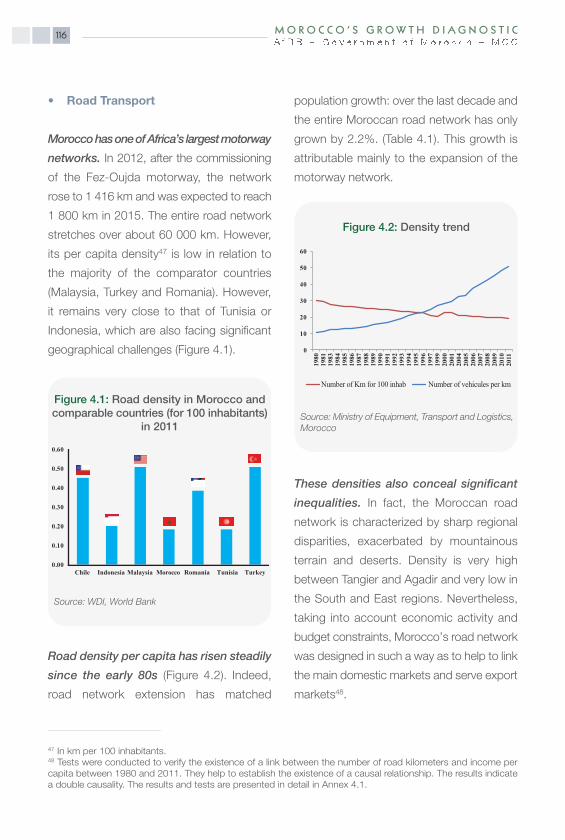
M O R O C C O ’ S G R OW T H D I A G N O S T I C116
• Road Transport
Morocco has one of Africa’s largest motorway
networks. In 2012, after the commissioning
of the Fez-Oujda motorway, the network
rose to 1 416 km and was expected to reach
1 800 km in 2015. The entire road network
stretches over about 60 000 km. However,
its per capita density47 is low in relation to
the majority of the comparator countries
(Malaysia, Turkey and Romania). However,
it remains very close to that of Tunisia or
Indonesia, which are also facing significant
geographical challenges (Figure 4.1).
Road density per capita has risen steadily
since the early 80s (Figure 4.2). Indeed,
road network extension has matched
population growth: over the last decade and
the entire Moroccan road network has only
grown by 2.2%. (Table 4.1). This growth is
attributable mainly to the expansion of the
motorway network.
These densities also conceal significant
inequalities. In fact, the Moroccan road
network is characterized by sharp regional
disparities, exacerbated by mountainous
terrain and deserts. Density is very high
between Tangier and Agadir and very low in
the South and East regions. Nevertheless,
taking into account economic activity and
budget constraints, Morocco’s road network
was designed in such a way as to help to link
the main domestic markets and serve export
markets48.
0.00
0.10
0.20
0.30
0.40
0.50
0.60
Chile Indonesia Malaysia Morocco Romania Tunisia Turkey
Source: WDI, World Bank
Figure 4.1: Road density in Morocco andcomparable countries (for 100 inhabitants)
in 2011
0
10
20
30
40
50
60
1980
1981
1983
1984
1985
1986
1987
1988
1989
1990
1991
1992
1993
1994
1995
1996
1997
1999
2000
2001
2004
2005
2006
2007
2008
2009
2010
2011
Number of Km for 100 inhab Number of vehicules per km
Source: Ministry of Equipment, Transport and Logistics,Morocco
Figure 4.2: Density trend
47 In km per 100 inhabitants.48 Tests were conducted to verify the existence of a link between the number of road kilometers and income percapita between 1980 and 2011. They help to establish the existence of a causal relationship. The results indicatea double causality. The results and tests are presented in detail in Annex 4.1.
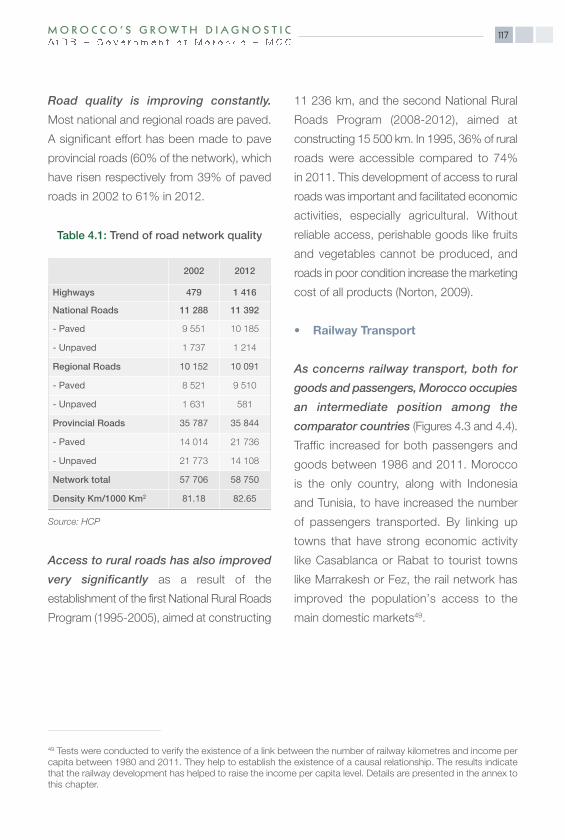
117M O R O C C O ’ S G R O W T H D I A G N O S T I C
Road quality is improving constantly.
Most national and regional roads are paved.
A significant effort has been made to pave
provincial roads (60% of the network), which
have risen respectively from 39% of paved
roads in 2002 to 61% in 2012.
Access to rural roads has also improved
very significantly as a result of the
establishment of the first National Rural Roads
Program (1995-2005), aimed at constructing
11 236 km, and the second National Rural
Roads Program (2008-2012), aimed at
constructing 15 500 km. In 1995, 36% of rural
roads were accessible compared to 74%
in 2011. This development of access to rural
roads was important and facilitated economic
activities, especially agricultural. Without
reliable access, perishable goods like fruits
and vegetables cannot be produced, and
roads in poor condition increase the marketing
cost of all products (Norton, 2009).
• Railway Transport
As concerns railway transport, both for
goods and passengers, Morocco occupies
an intermediate position among the
comparator countries (Figures 4.3 and 4.4).
Traffic increased for both passengers and
goods between 1986 and 2011. Morocco
is the only country, along with Indonesia
and Tunisia, to have increased the number
of passengers transported. By linking up
towns that have strong economic activity
like Casablanca or Rabat to tourist towns
like Marrakesh or Fez, the rail network has
improved the population’s access to the
main domestic markets49.
2002 2012
Highways 479 1 416
National Roads 11 288 11 392
- Paved 9 551 10 185
- Unpaved 1 737 1 214
Regional Roads 10 152 10 091
- Paved 8 521 9 510
- Unpaved 1 631 581
Provincial Roads 35 787 35 844
- Paved 14 014 21 736
- Unpaved 21 773 14 108
Network total 57 706 58 750
Density Km/1000 Km2 81.18 82.65
Source: HCP
49 Tests were conducted to verify the existence of a link between the number of railway kilometres and income percapita between 1980 and 2011. They help to establish the existence of a causal relationship. The results indicatethat the railway development has helped to raise the income per capita level. Details are presented in the annex tothis chapter.
Table 4.1: Trend of road network quality
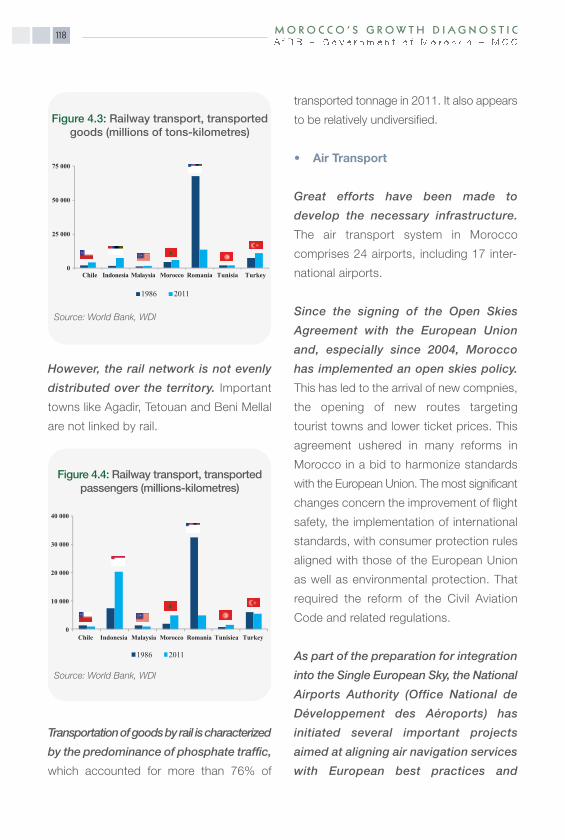
M O R O C C O ’ S G R OW T H D I A G N O S T I C118
However, the rail network is not evenly
distributed over the territory. Important
towns like Agadir, Tetouan and Beni Mellal
are not linked by rail.
Transportation of goods by rail is characterized
by the predominance of phosphate traffic,
which accounted for more than 76% of
transported tonnage in 2011. It also appears
to be relatively undiversified.
• Air Transport
Great efforts have been made to
develop the necessary infrastructure.
The air transport system in Morocco
comprises 24 airports, including 17 inter-
national airports.
Since the signing of the Open Skies
Agreement with the European Union
and, especially since 2004, Morocco
has implemented an open skies policy.
This has led to the arrival of new compnies,
the opening of new routes targeting
tourist towns and lower ticket prices. This
agreement ushered in many reforms in
Morocco in a bid to harmonize standards
with the European Union. The most significant
changes concern the improvement of flight
safety, the implementation of international
standards, with consumer protection rules
aligned with those of the European Union
as well as environmental protection. That
required the reform of the Civil Aviation
Code and related regulations.
As part of the preparation for integration
into the Single European Sky, the National
Airports Authority (Office National de
Développement des Aéroports) has
initiated several important projects
aimed at aligning air navigation services
with European best practices and
0
25 000
50 000
75 000
Chile Indonesia Malaysia Morocco Romania Tunisia Turkey
1986 2011
Source: World Bank, WDI
Figure 4.3: Railway transport, transportedgoods (millions of tons-kilometres)
0
10 000
20 000
30 000
40 000
Chile Indonesia Malaysia Morocco Romania Tunisiea Turkey
1986 2011
Source: World Bank, WDI
Figure 4.4: Railway transport, transportedpassengers (millions-kilometres)

119M O R O C C O ’ S G R OW T H D I A G N O S T I C
standards, especially through (i) the
strengthening of interoperability with
bordering countries especially Spain
and Portugal, through modernization
of Asynchronous Transfer Mode (ATM)
equipment; (ii) the harmonization of
procedures; (iii) the certification of air
navigation services under the twinning
project with the European Union; and (iv)
participation in R&D projects.
• Maritime Transport
Maritime transport in Morocco ensures
the transit of more than 95% of foreign
trade through 38 ports. In 2012, that
represented 92 million tons of goods, 3.7
million passengers and 30 regular lines.
Maritime transport of goods and passengers
has increased respectively by 37% and
110% since the late 1990s (Figure 4.5).
However, container traffic remains low.
Morocco comes only ahead of Tunisia and
Romania among the comparator countries
(Figure 4.6).
Port capacities are being fully developed.
Port facilities are in compliance with ISO
standards. Out of the 12 ports presented
in Table 4.2, more than half have not yet
reached their theoretical capacity.
45
50
55
60
65
70
75
1998 2000 2002 2004 2006 2008 2010 2012
Source: Ministry of Equipment, Transport and Logistics
Figure 4.5: Maritime transport of goods(in millions of tons)
0
5 000 000
10 000 000
15 000 000
20 000 000
25 000 000
Chile Indonesia Morocco Malaysia Romania Tunisia Turkey
2000 2012
Source: World Bank, WDI
Figure 4.6: Container traffic in ports(2000 and 2012)
Table 4.2: Port capacities(million tonnes/year)
Operationalcapacity (mT)
Theoreticalcapacity (mT)
Nador 5 13Tanger 108 108Kenitra 0.3 0.9Mohammedia 17 24Casablanca 31 38JorfLasfar 20 38Safi 9 8Agadir 4 6Tan tan 0.2 0.2Laayoune 2 2Warf 4 4Dakhla 0.4 0.4Total 201 243
Source: Ministry of Equipment, Transport and Logistics

M O R O C C O ’ S G R OW T H D I A G N O S T I C120
In addition, the country’s three main
non-specialized ports (Table 4.3) have
developed a hinterland with direct
highway and railway connections.
Table 4.3: Characteristics of the 3 main ports
Agadir Casablanca Tanger Med
Traffic 2012 (KT) 3.66 24.514 21.156
Surface (Ha) 42 87 78
Maritime fleetBulk (57%)Containers (28%)General goods (15%)
Bulk (42%)Containers (34%)General goods (24%)
n.d.
Connections to the portHighway(Agadir-Marrakech)
HighwayRailway
RoadRailway
Regular lines 3 7 n.d.
Weekly capacities 2 250 (TEU) 6 780 (TEU) n.d.
Infrastructure
5 terminals: Multipurpose(ro-ro, bulk), Containers,Cereals and passengers, Minerals, Oil
4 terminals:Multipurpose(ro-ro, bulk), Containers,Cereals and passengers,Minerals, Oil
Tanger Med (containerterminals): Logisticalplatform
Source: Ministry of Equipment, Transport and Logistics
• Logistics Infrastructure
To enhance the competitiveness of the
Moroccan economy in the equipment
and transport sector, the logistic sector is
a new strategic priority.
Within this framework, the government,
in partnership with the private sector
(CGEM), has established a strategy and
an action plan for the improvement of the
country’s logistic competitiveness. This
strategy seeks to provide adequate solutions
to problems relating to the management of
the flow of goods and meet the logistic
needs of the different sector strategies.
The objectives set are to reduce logistic
costs/GDP from 20% currently to 15%
by 2015 through optimized, secure and
large-scale management of the flow of
goods. These objectives also concern the
creation of 36,000 jobs and a contribution
to the country’s sustainable development
through the reduction of nuisances and CO2
emissions by 35% by the year 2015 and the
decongestion of roads and towns due to
sound management of distribution networks.

• Cross-border Trade
Government efforts have been conclusive
since, in terms of logistic performances
(Figure 4.7), Morocco is relatively
well-positioned for exports. Although the
number of documents required exceeds
the average, time-limits and costs are
among the lowest. However, transit times
for the Casablanca and Tangier ports,
which dominate port traffic (respectively by
14.9 and 5.1 million tons in 2007), remain
lower than those of the nearby ports of
competing countries. There is potential for
capacity building. On the other hand, the
time-limits, number of documents and
import-related costs remain relatively high.
It is, therefore, less costly and easier to
export than to import.
Transport infrastructure in Morocco
is developing. Medium-term economic
development will require larger scale infra-
structure. The number of ongoing infra-
structure projects confirms the government’s
awareness of this.
121M O R O C C O ’ S G R O W T H D I A G N O S T I C
0
400
800
1200
1600
Chile Indonesia Malaysia Morocco Romania Tunisia Turkey
Export costs (USD per container)Import costs (USD per container)
Source: World Bank, WDI
Figure 4.7: Transborder trade costs

M O R O C C O ’ S G R OW T H D I A G N O S T I C122
Box 4.1: Ongoing Transport Infrastructure Projects
Road transport:
- Rabat bypass motorway: 41.1 km, MAD 2 800 M.
- Tit Mellil-Berrechid motorway: 31 km, MAD 1 300 M.
- Berrechid-Beni Mellal motorway: 172 km, MAD 6 030 M.
- El Jadida-Safi motorway: 140 km, MAD 4 800 M.
- Taza-Al-Hoceima expressway: 148 km, 2 500 M MAD.
Railway transport:
- Tangier-Kenitra-Casa HST project: MAD 20 000 M.
- Renovation of the Casa-Port railway station.
Port projects:
- Tanger Med II: MAD 18 billion (commissioning 2015-2016)
- Nador West Med:
• 1st phase of MAD 5.9 billion (commissioning in 2015),dedicated to refined oil
products, total capacity of 15 million tons/year.
• 2nd phase: MAD 1.6 billion for two other structures dedicated to crude oil, total
capacity of 20 million tons/year.
- New Safi port:
• 1st phase: MAD 4 billion (commissioning 2017). To meet the coal requirements of
the ONEE thermal plant.
• 2nd phase: disengagement of the former Safi port from handling the OCP group’s
mineral products to enable it (as from 2020) to export phosphate and its by-products
directly.
Airport projects:
- Development of the Beni Mellal airfield (MAD 195.5 M);
- Development of terminal facilities in the Mohammed V Airport (MAD 938 M);
- Development of terminal facilities in the Marrakech Ménara Airport (MAD 1084 M);
- Extension of terminal facilities at Fez Saiss Airport (MAD 479 M);
- Extension and renovation of the passenger terminal at Nador Airport (MAD 315 M);
- Construction of a regional/south zone control tower (MAD 256 M).
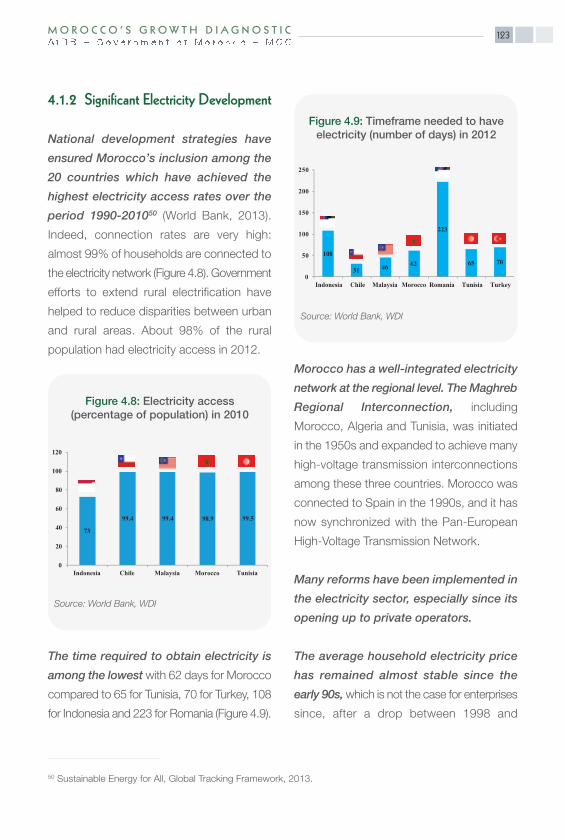
123M O R O C C O ’ S G R OW T H D I A G N O S T I C
4.1.2 Significant Electricity Development
National development strategies have
ensured Morocco’s inclusion among the
20 countries which have achieved the
highest electricity access rates over the
period 1990-201050 (World Bank, 2013).
Indeed, connection rates are very high:
almost 99% of households are connected to
the electricity network (Figure 4.8). Government
efforts to extend rural electrification have
helped to reduce disparities between urban
and rural areas. About 98% of the rural
population had electricity access in 2012.
The time required to obtain electricity is
among the lowest with 62 days for Morocco
compared to 65 for Tunisia, 70 for Turkey, 108
for Indonesia and 223 for Romania (Figure 4.9).
Morocco has a well-integrated electricity
network at the regional level. The Maghreb
Regional Interconnection, including
Morocco, Algeria and Tunisia, was initiated
in the 1950s and expanded to achieve many
high-voltage transmission interconnections
among these three countries. Morocco was
connected to Spain in the 1990s, and it has
now synchronized with the Pan-European
High-Voltage Transmission Network.
Many reforms have been implemented in
the electricity sector, especially since its
opening up to private operators.
The average household electricity price
has remained almost stable since the
early 90s, which is not the case for enterprises
since, after a drop between 1998 and
50 Sustainable Energy for All, Global Tracking Framework, 2013.
73
99.4 99.4 98.9 99.5
0
20
40
60
80
100
120
Indonesia Chile Malaysia Morocco Tunisia
Figure 4.8: Electricity access(percentage of population) in 2010
Source: World Bank, WDI
108
31 46 62
223
65 70
0
50
100
150
200
250
Indonesia Chile Malaysia Morocco Romania Tunisia Turkey
Figure 4.9: Timeframe needed to haveelectricity (number of days) in 2012
Source: World Bank, WDI

M O R O C C O ’ S G R OW T H D I A G N O S T I C124
2005, the prices started rising again.
However, it should be indicated that, if
these prices have remained relatively
stable, it is due to the great subsidy effort
made by the government to offset the
difference between the cost of energy
generation and/or acquisition for the
National Electricity and Drinking Water
Authority (ONEE) and its selling price. This
explains ONEE’s difficult financial situation
in recent years. Consequently, the intermittent
increases made are chiefly intended to pass
on part of the energy cost to users in order
to reduce ONEE’s costs.
Box 4.2: Main Electricity Sector Projects since 1990
• Development of independent power producers through competitive bidding
and the obligation to conclude long-term power purchase agreements with
ONE (Decree-Law 1994):
- 1997: Jorf Lasfar Eenergy Company, coal plant 1 360 W (48% of national production).
- 1998 : Compagnie Eolienne du Détroit, THELIOA group, Abdelkhalek Torres wind
park, 50 MW
- EET – ONE/ENSEA/SIEMENNS company, Tahaddart combined-cycle plant, 384 MW.
- Ongoing projects: Tarfaya wind farm …
• Delegation of multiservice distribution to private operators
- Casablanca: Lydec, GDF SUEZ group, 1997.
- Rabat, Salé and Temara: Redal, VEOLIA group, 1999.
- Tanger and Tetouan: Amendis, VEOLIA group, 2002.
• Launching of the overall rural electrification program in 1996
- Generalization of electricity access to all rural households.
• Interconnection of the national electric power grid with the Spanish grid in
1997

125M O R O C C O ’ S G R OW T H D I A G N O S T I C
Morocco’s electrification plan seems
to have been successful. The electricity
access rate is very high and timeframes for
obtaining electricity are low. However, there
is still uncertainty regarding the trend of
electricity prices.
4.1.3 Persistent Disparities in Water andSanitation Facilities
The fragmented distribution of Morocco’s
population throughout the country raises
a serious challenge regarding access to
water and sanitation facilities. It represents
a real challenge for the development of
agriculture and tourism.
Nevertheless, the government’s water
supply development strategy has helped
to increase access significantly, but
regional disparities remain. Access to an
improved water source, according to the
World Bank definition51, has developed
significantly in urban areas, reaching almost
98.2% of households in 2011 compared to
60.8% in rural areas (Figure 4.10).
However, considerable efforts have been
made to facilitate water access in rural
areas. Indeed, when the definition of water
access is modified and the drinking water
access rate is taken as the percentage of the
population having access to drinking water
at home or from a supply point within a
200-m radius in towns and 500-m radius in
rural areas, in relation to the total population,
the access rate in the urban area reached
100% since 1997, representing significant
growth since 1975 through individual
51 Access to an improved water source is the percentage of the population which has reasonable access to asufficient quantity of water coming from an improved source such as a domestic water container, a public tank onthe ground, a well, a protected spring or well or collected rainwater. Unimproved sources include sellers, tankersand unprotected springs and wells. Reasonable access is defined as being the daily availability of at least 20 litresper person coming from a source situated within a one-kilometre radius from dwellings.
0
40
80
120
Chile Indonesia Morocco Malaysia Romania Tunisia Turkey
Rural Urban
Figure 4.10: Population rate of access(%) to improved water sources
Source: World Bank, WDI

connections. The rural access trend once
again rose more rapidly from 22% in 1975 to
92% in 2011. However, data does not make
it possible to distinguish individual access
from access by standpipe.
Water access efforts are continuing, with
the objective of increasing storage capacity
by almost 32 000 m³. An investment of
about MAD 1 030 M had to be made by
ONEE in 2013 to improve rural drinking
water supply (DWS), which was expected
to increase the average national access rate
to 94% (compared to 93% in 2012). This
rate varies across regions: 81% in Doukkala-
Abda, 83% in Tangier-Tetouan, 84% in
Taza-Al Hoceima-Taounate, 99% in Oued
Eddahab-Lagouira as well as in Fez-Boule-
mane and Salé-Zemmour-Zaer. Disparities
also exist between provinces of the same
region with rates, at times, not exceeding 65%.
Furthermore, the sanitation sector has
long been a weak link in Morocco’s water
policy. Indeed, its situation is characterized
by (i) the low priority given to waste water
management and the needs of operators; (ii)
the partial coverage of networks, which are
outdated and saturated; (iii) a limited number
of wastewater treatment stations; and (iv)
an estimated urban wastewater volume of
600 million m3 discharged in 2005, without
prior treatment.
To close the gap and upgrade this sector,
the National Liquid Sanitation and Waste-
water Treatment Program [Programme
National d’Assainissement Liquide et
d’Epuration des Eaux Usées] (PNA)
was established in 2005 and updated in
2008. Since its implementation, a marked
improvement has been observed. The rate
of connection to the urban area network is
estimated at 72% and the wastewater
treatment rate reached 34% compared to
8% in 2005. The PNA was established for
urban and semi-urban areas, but certain
rural centers have also benefitted from
sanitation projects under this program.
However, further improvements are
required in the sanitation sector. Indeed,
in 2011, sanitation facilities remain to be
developed; since only 83.1% of urban
households and 52% of rural households
had access to them (figure 4.11). Compared
to the reference countries, Morocco remains
behind in this sector.
0
40
80
120
Chile Indonesia Morocco Malaysia Romania Tunisia Turkey
Rural Urban
Figure 4.11: Population rate of access toimproved sanitation facilities in 2011
Source: World Bank, WDI
M O R O C C O ’ S G R OW T H D I A G N O S T I C126

127M O R O C C O ’ S G R O W T H D I A G N O S T I C
However, objectives pursued by the Government
confirm awareness of the need to close the
gap with regard to liquid sanitation, in relation
to the country’s current and future needs.
4.1.4 Telecommunications
In 1997, Law no. 24-96 initiated a
profound change in the telecommunications
sector with the market opening up to
private initiatives and national and
international developers. This reform
sought to extend posts and telecommunications
networks and services to the entire
territory, while developing competitive
situations among operators. This sector
was restructured around partial privatization
of the historic operator and the establishment
of a regulatory body, the National
Telecommunications Regulatory Agency
(ANRT).
As concerns the fixed telephone network,
despite the slight increase in telephone
density, in recent years, it is still insufficient
in relation to the level attained by the
Reference countries (figure 4.12).
Box 4.3: Objectives of the PNA
Establishment of the National Liquid Sanitation and Wastewater Treatment Program in
2005 and its update in 2007, jointly with the Ministry of Interior and the Department of
Environment. The plan concerns 330 towns and urban centers (10 million inhabitants).
Objectives:
• Achieve a sanitation network connection rate of 75% in urban areas in 2016, 80% in
2020 and 90% in 2030;
• Reduce domestic pollution by 50% in 2016, 60% in 2020 and 100% in 2030;
• Treat and reuse 100% of collected wastewater by 2030;
• Construct wastewater treatment stations for 330 towns and urban centers.
Overall cost: MAD 50 billion by the year 2020.
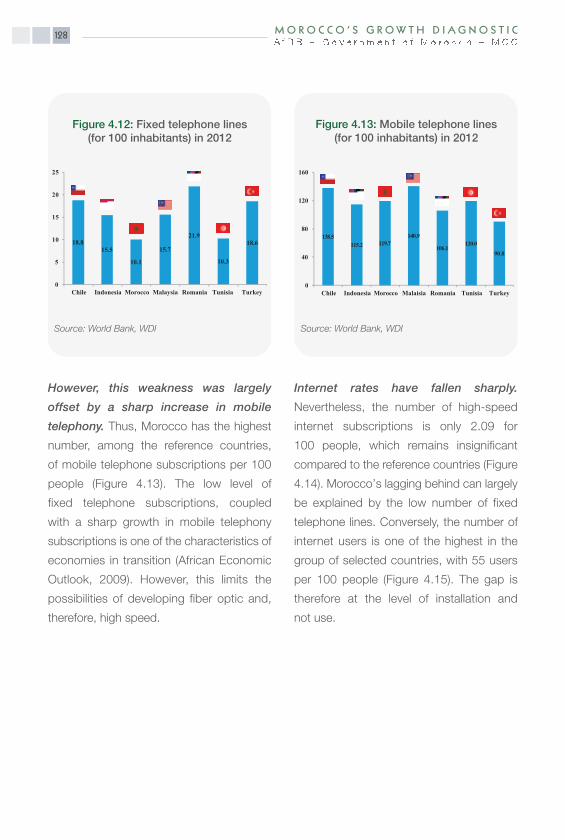
M O R O C C O ’ S G R OW T H D I A G N O S T I C128
However, this weakness was largely
offset by a sharp increase in mobile
telephony. Thus, Morocco has the highest
number, among the reference countries,
of mobile telephone subscriptions per 100
people (Figure 4.13). The low level of
fixed telephone subscriptions, coupled
with a sharp growth in mobile telephony
subscriptions is one of the characteristics of
economies in transition (African Economic
Outlook, 2009). However, this limits the
possibilities of developing fiber optic and,
therefore, high speed.
Internet rates have fallen sharply.
Nevertheless, the number of high-speed
internet subscriptions is only 2.09 for
100 people, which remains insignificant
compared to the reference countries (Figure
4.14). Morocco’s lagging behind can largely
be explained by the low number of fixed
telephone lines. Conversely, the number of
internet users is one of the highest in the
group of selected countries, with 55 users
per 100 people (Figure 4.15). The gap is
therefore at the level of installation and
not use.
18.815.5
10.1
15.7
21.9
10.3
18.6
0
5
10
15
20
25
Chile Indonesia Morocco Malaysia Romania Tunisia Turkey
Figure 4.12: Fixed telephone lines(for 100 inhabitants) in 2012
Source: World Bank, WDI
138.5115.2 119.7
140.9106.1 120.0
90.8
0
40
80
120
160
Chile Indonesia Morocco Malaisia Romania Tunisia Turkey
Figure 4.13: Mobile telephone lines(for 100 inhabitants) in 2012
Source: World Bank, WDI

129M O R O C C O ’ S G R OW T H D I A G N O S T I C
Market trends and the population’s
enthusiasm for new telecommunications
tools – as reflected in the growing number
of mobile telephone users – are indicators
of strong growth for the coming years.
However, it is important to find a solution to
the gap in developing fixed telephone lines,
which might restrict internet subscriptions.
4.2 Growth Diagnostic Tests
4.2.1 Infrastructure Quality Comparison
In the first stage, the degree of severity of
the infrastructure supply constraint in
Morocco is analyzed. It would be wrong to
consider that only a low level of infrastructure
represents a major constraint. To avoid that,
this test uses an international infrastructure
quality and not quantity indicator and
analyses Morocco’s position in relation to
the reference countries.
The infrastructure quality-related indicator
of WEF (World Economic Forum) does
not reveal any particular constraint.
Morocco does not seem to be insufficiently
developed in infrastructure. The country was
ranked 57th in the world in 2013 (Table 4.4).
Compared with the reference countries, it
occupies a median position, with a higher
quality level than in Indonesia, Romania and
Tunisia.
12.4
1.2 2.1
8.4
15.9
4.8
10.5
0
4
8
12
16
20
Chile Indonesia Morocco Malaysia Romania Tunisia Turkey
Figure 4.14: High-speed internetsubscriptions (for 100 inhabitants) in 2012
Source: World Bank, WDI
61.4
15.4
55.065.8
50.041.4 45.1
0
10
20
30
40
50
60
70
Chile Indonesia Morocco Malaysia Romania Tunisia Turkey
Figure 4.15: Number of internet users(for 100 inhabitants) in 2012
Source: World Bank, WDI
Classification according to infrastructure quality, 2013
Morocco 57
Chile 46
Indonesia 61
Malaysia 29
Romania 100
Tunisia 77
Turkey 49
Table 4.4: Infrastructure quality
Source: World Economic Forum, 2013
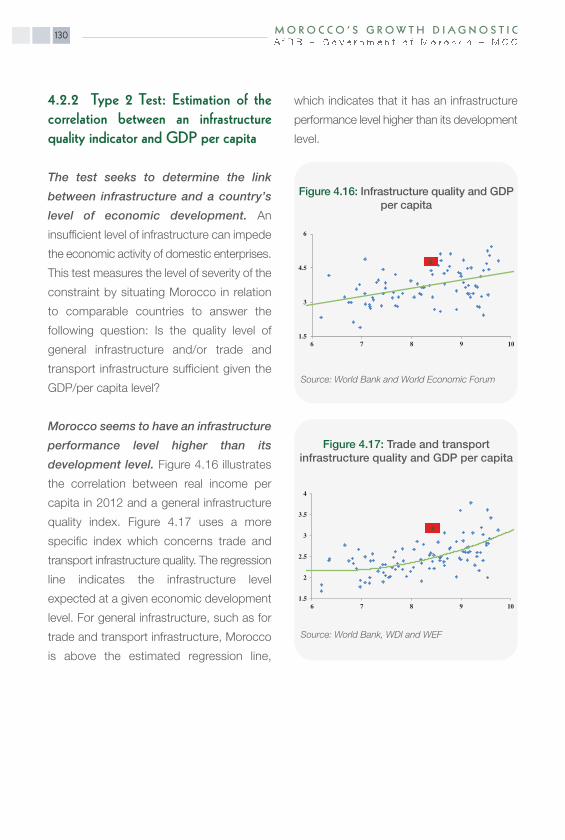
M O R O C C O ’ S G R OW T H D I A G N O S T I C130
4.2.2 Type 2 Test: Estimation of the correlation between an infrastructure quality indicator and GDP per capita
The test seeks to determine the link
between infrastructure and a country’s
level of economic development. An
insufficient level of infrastructure can impede
the economic activity of domestic enterprises.
This test measures the level of severity of the
constraint by situating Morocco in relation
to comparable countries to answer the
following question: Is the quality level of
general infrastructure and/or trade and
transport infrastructure sufficient given the
GDP/per capita level?
Morocco seems to have an infrastructure
performance level higher than its
development level. Figure 4.16 illustrates
the correlation between real income per
capita in 2012 and a general infrastructure
quality index. Figure 4.17 uses a more
specific index which concerns trade and
transport infrastructure quality. The regression
line indicates the infrastructure level
expected at a given economic development
level. For general infrastructure, such as for
trade and transport infrastructure, Morocco
is above the estimated regression line,
which indicates that it has an infrastructure
performance level higher than its development
level.
1.5
3
4.5
6
6 7 8 9 10
Figure 4.16: Infrastructure quality and GDPper capita
Source: World Bank and World Economic Forum
1.5
2
2.5
3
3.5
4
6 7 8 9 10
Figure 4.17: Trade and transportinfrastructure quality and GDP per capita
Source: World Bank, WDI and WEF
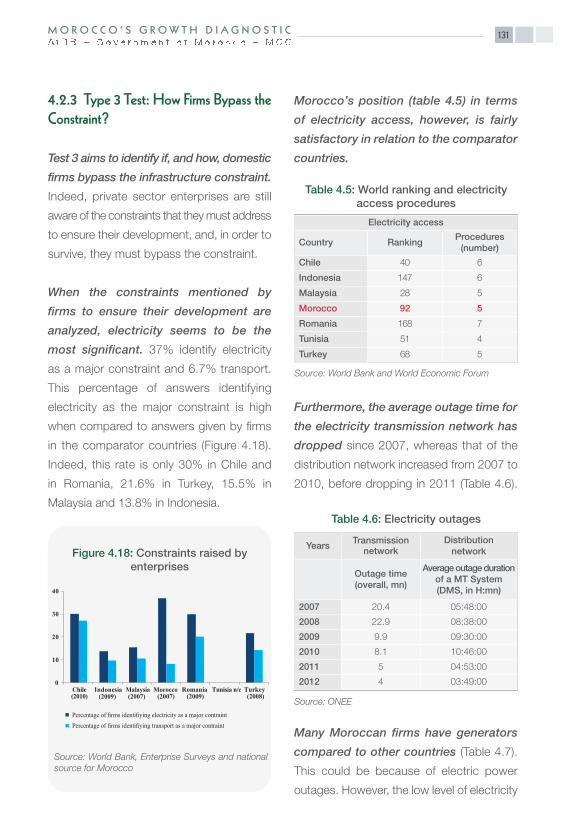
131M O R O C C O ’ S G R OW T H D I A G N O S T I C
4.2.3 Type 3 Test: How Firms Bypass theConstraint?
Test 3 aims to identify if, and how, domestic
firms bypass the infrastructure constraint.
Indeed, private sector enterprises are still
aware of the constraints that they must address
to ensure their development, and, in order to
survive, they must bypass the constraint.
When the constraints mentioned by
firms to ensure their development are
analyzed, electricity seems to be the
most significant. 37% identify electricity
as a major constraint and 6.7% transport.
This percentage of answers identifying
electricity as the major constraint is high
when compared to answers given by firms
in the comparator countries (Figure 4.18).
Indeed, this rate is only 30% in Chile and
in Romania, 21.6% in Turkey, 15.5% in
Malaysia and 13.8% in Indonesia.
Morocco’s position (table 4.5) in terms
of electricity access, however, is fairly
satisfactory in relation to the comparator
countries.
Furthermore, the average outage time for
the electricity transmission network has
dropped since 2007, whereas that of the
distribution network increased from 2007 to
2010, before dropping in 2011 (Table 4.6).
Many Moroccan firms have generators
compared to other countries (Table 4.7).
This could be because of electric power
outages. However, the low level of electricity
0
10
20
30
40
Chile(2010)
Indonesia (2009)
Malaysia (2007)
Morocco (2007)
Romania (2009)
Tunisia n/c Turkey(2008)
Percentage of firms identifiying electricity as a major contraintPercentage of firms identifiying transport as a major contraint
Figure 4.18: Constraints raised byenterprises
Source: World Bank, Enterprise Surveys and nationalsource for Morocco
Electricity access
Country RankingProcedures(number)
Chile 40 6
Indonesia 147 6
Malaysia 28 5
Morocco 92 5
Romania 168 7
Tunisia 51 4
Turkey 68 5
Table 4.5: World ranking and electricityaccess procedures
Source: World Bank and World Economic Forum
Source: ONEE
Years Transmissionnetwork
Distributionnetwork
Outage time(overall, mn)
Average outage durationof a MT System(DMS, in H:mn)
2007 20.4 05:48:00
2008 22.9 08:38:00
2009 9.9 09:30:00
2010 8.1 10:46:00
2011 5 04:53:00
2012 4 03:49:00
Table 4.6: Electricity outages

M O R O C C O ’ S G R OW T H D I A G N O S T I C132
produced by these generators as well as
the historic obligation for certain firms to
have generators do not seem to support
this assumption. The problem raised by
enterprises could, therefore, come from the
price, but nothing enables us to prove it.
4.2.4 Type 4 Test: Does Limited Infrastructure Impede the Developmentof Firms?
This test seeks to determine if enterprises
with the greatest need for electrical
infrastructure are the most restricted
in their development. To do this, the
infrastructure intensity level of enterprises
should be identified by sector and by
region, and compared with their economic
performance level.
If electricity is a major constraint to
the development of economic activities,
firms in high-energy consuming sectors
should experience development problems
compared to others.
The most sensitive sectors do not,
however, appear to have followed a trend
in their value added different from other
sectors. The sectors concerned are wood
and wooden products, paper and paper
products, rubber and plastic products, other
non-metal products and basic metals. The
number of firms in these sectors increased
between 2000 and 2009, with a few exceptions.
Therefore, they do not seem to have been
impeded in their development.
The analysis of value added distribution
over the territory shows that infrastructure
does not seem to be a major constraint
to economic growth, since regions relatively
less well-endowed in infrastructure
contribute to wealth creation in a relatively
significant manner like Beni Mellal-
Khénifra (8.1%) and Daraa-Tafilalt (3.3%).
Therefore, infrastructure does not constitute
a major constraint to growth.
4.3 Second-Round Effects
Infrastructure does not seem to be a
major obstacle to growth, but it can
induce second-round effects. Indeed,
there can be strong interdependence
between land access for enterprises and
Percentage offirms havingor sharing agenerator
Proportion ofelectricity producedby the generator
(%)
Chile (2010) 46.5 3.2
Indonesia(2009)
6.3 1.7
Malaysia(2007)
16.1 0.8
Morocco(2007)
18 1.1
Romania(2009)
14.6 1.6
Tunisia n/c n/c n/c
Turkey(2008)
8.6 0.3
Table 4.7: Generator Use
Source: World Bank, Enterprise Survey and nationalsource for Morocco

133M O R O C C O ’ S G R OW T H D I A G N O S T I C
installed infrastructure. Thus, infrastructure
development throughout the territory can result
in increased demand for land by enterprises.
The survey conducted by the Moroccan
Government on a sample of manufacturing
sector firms in 2007 shows the close
link between infrastructure and land.
Enterprises are usually established in areas
where basic infrastructure does not pose
problems. Indeed, in this survey, firms
declared that electricity infrastructure did
not represent a major constraint to their
establishment and the smooth conduct
of their operations. Similarly, water infra-
structure does not cause any serious
impediments to the effective establishment
of an enterprise on the territory (Figure 4.19).
On the other hand, the condition of
roads and urban transport access are
serious constraints to the establishment
of enterprises (Figure 4.20).
The expansion of infrastructure and
its even distribution over the territory
could result in a considerable increase in
demand for access to land by enterprises,
thus leading to new pressure on it.
0%
10%
20%
30%
Not anobstacle
Minorobstacle
Averageobstacle
Majorobstacle
Very severeobstacle
Perc
enta
ge
Figure 4.20: State of roads and landacquisition (degree of severity)
Source: Enterprise Survey, Morocco 2007
0%
10%
20%
30%
Not anobstacle
Minorobstacle
Averageobstacle
Majorobstacle
Very severeobstacle
Perc
enta
ge
Figure 4.19: Transport infrastructure andland acquisition (degree of severity)
Source: Enterprise Survey, Morocco 2007
Chapter 5
Natural Capital
M O R O C C O ’ S G R OW T H D I A G N O S T I C136
Chapter 5: Natural Capital
Key Messages
• Natural capital is a key component of a country’s sustainable development. The
capacity to use new technologies to optimize natural resources is an important
contributing factor to economic development.
• Morocco is not as well-endowed as certain countries in natural fossil fuel resources
and adequate water resources, but it has geographical proximity to the European Union
and exceptional phosphate deposits.
• Morocco’s natural resources are fairly well developed, which is not a major impediment
to growth.
• Arable land and phosphate are resources requiring further development.
• Considering Morocco’s heavy dependency on conventional energy resources, its
alternative energy development efforts should be pursued.
• While pricing policies may further social and economic objectives, they may also
distort the relative prices of natural resources, which prevents their efficient allocation
and sustainable management.

137M O R O C C O ’ S G R OW T H D I A G N O S T I C
Introduction
Natural capital is an essential component
of a country’s sustainable development.
The availability of natural resources as well
as the geographical position can be both
drivers of growth and obstacles to smooth
development.
Morocco has an ideal geographical
situation and exceptional phosphate
resources, but it does not have its
neighbors’ assets in terms of energy
resources, nor sufficient water
resources. Situated at the gateway of
Europe, on the other side of the Straits of
Gibraltar, north of Mauritania and west of
Algeria, Morocco has access both to the
Mediterranean Sea and the Atlantic Ocean.
The country has the largest coastal region
in the African continent, with more than
3500 km of coastline, including 500 km in
the Mediterranean.
This chapter highlights two areas of
fragility directly linked to productive
activity: water and energy. The Government’s
significant efforts to remedy the situation
have resulted in heavy expenditure for
the general government budget ensuring
that these two weaknesses are not major
impediments to the development of the
economic activity of Moroccan enterprises.
5.1 Basic Resources
5.1.1 Geographical Position
Situated between Sub-Saharan Africa
and Europe, Morocco has an ideal
location on the Mediterranean and on
the Atlantic and close to international
markets.
5.1.2 Land
Arable land represents only 13% of the
territory (Figure 5.1). This situation is particularly
challenging as the major part of the country
is made up of arid and mountainous areas.
However, the proportion of arable land
per capita remains within the average of
the comparator countries with 0.25 hectare
per capita. 59% of agricultural land is used
for cereal farming.
0
10
20
30
40
50
Chile Indonesia Morocco Malaysia Romania Tunisia Turkey
Figure 5.1: Arable land (percentage of territory)
Source: World Bank, WDI

M O R O C C O ’ S G R OW T H D I A G N O S T I C138
5.1.3 Water
Morocco is a water-stressed country with
very low rainfall. The country is characterized
both by a Mediterranean climate to the
North and an arid climate to the South and
the south-east of the Atlas Mountains, with a
dry, hot season and a cold, humid season.
Water is a scarce resource and it is unevenly
distributed among the various regions
(Figure 5.2). Annual rainfall exceeds 800 mm
in the North region, with the heaviest rainfall
from 400 to 600 mm in the center, from 200
to 400 mm in the Oriental and Souss region,
from 200 to 50 mm in the South Atlantic
region, and less than 50 mm in the most
arid area, the Sakia El Hamra and Oued
Eddahab basins.
In 2011, with slightly over 904 m3 of
renewable water resources per year and
per capita (according to the World Bank
definition), Morocco has the lowest level
of resources, after Tunisia which boasts of
393 m3 (figure 5.3). This comparison with
countries highlights Morocco’s worrisome
situation.
Nevertheless, drinking water production
has increased by a factor of 5 during the
last three decades rising to over 1 billion
m3 in 2007. However, the 135 existing
dams in Morocco have a storage capacity
lower than the population’s annual water
consumption.
20% of Morocco’s water resource potential
is comprised of groundwater as reflected
in the distribution of groundwater tables
identified (Figure 5.4). In addition, almost
10% of the national territory is covered by
the most extensive aquifer systems (about
80 000 km2).
Figure 5.2: Rainfall in Morocco
Source: Ministry of Energy, Mines, Water and Environment
0
10 000
20 000
30 000
40 000
50 000
60 000
Chile Indonesia Morocco Malaysia Romania Tunisia Turkey
Figure 5.3: Renewable water resourcesper capita (in m3)
Source: World Bank, WDI

139M O R O C C O ’ S G R OW T H D I A G N O S T I C
However, surface and groundwater water
is of poor quality (Table 5.1). According to the
latest analyses, it is estimated that 8 to 10%
of nitrogen used as fertilizer for agriculture
is washed into groundwater tables or into
watercourses and that 0.5 to 1% of pesticides
drain on to watercourses, representing a
current pollution of 8,500 tons of nitrogen
and 15 tons of pesticides. In addition,
a large part of wastewater is discharged
into the natural environment without prior
treatment.
Estimated water scarcity projections
are disturbing. The rate of natural water
resources per capita expresses a country’s
water supply or relative scarcity. According
to Government projections (Water Quality
Study, General Directorate for Hydraulics,
2011), this rate is expected to fall to
625 m3/pc/year in 2020, given that the
critical threshold is 1 000 m3/pc/year.
5.2 Extractive Resources
5.2.1 Fossil Fuels
Morocco is not very well endowed with
conventional energy resources. Its main
energy production comes from hydroelectricity
(Figure 5.5).
Oil products are predominant in its
energy consumption and their share has
continued to grow since the early 80s
(Figure 5.6).
Figure 5.4: Groundwater tables
Source: Ministry of Energy, Mines, Water and Environment
Source: Water quality study, DGH, 2011
Type of resource Good Average Poor
Groundwater 20% 29% 51%
Table 5.1: Quality level of surface waterand groundwater
0
200
400
600
800
1000
1979 1984 1989 1994 1999 2004 2009
Hydroelectricity CoalCrude oil Natural gasWind electricity
Figure 5.5: Energy production (thousands of TOE "Tons of Oil Equivalent")
Source: Ministry of Energy, Mines, Water and Environment

M O R O C C O ’ S G R OW T H D I A G N O S T I C140
This low endowment in fossil energy
makes Morocco a huge energy importer
(Figure 5.7). The share of oil products in
energy imports remains predominant with
45% in 2011. They also account for a very
high proportion of total imports of goods
that has continued to grow since the
early 90s.
5.2.2 Phosphate, an Exceptional Endowment
Morocco is the leading phosphate
exporter with 40% of the world market
for crude phosphate, 50% for phosphoric
acid and 21% for fertilizers. Except for the
world crisis period, phosphate production
and mining have increased steadily since the
late 90s (Figure 5.8).
5.3 Resource Development
5.3.1 Capitalizing on Geographical Proximity
Morocco’s proximity to the European
Union makes this market a preferred
partner in its foreign trade. The country
sells more than 50% of its exports on the
European Union market.
0
2000
4000
6000
8000
10000
12000
1979 1984 1989 1994 1999 2004 2009
Electricity CoalCrude oil Petroleum products
Figure 5.6: Energy consumption(thousands of TOE)
Source: Ministry of Energy, Mines, Water and Environment
0
2000
4000
6000
8000
10000
1979 1984 1989 1994 1999 2004 2009
Electricity CoalCrude oil Petroleum products
Figure 5.7: Energy imports(thousands of TOE)
Source: Ministry of Energy, Mines, Water and Environment
17000
21000
25000
29000
1999 2001 2003 2005 2007 2009 2011 2013
Phosphate mining (in thousands of tonnes)Market production (in thousands of tonnes)
Figure 5.8: Phosphate mining andproduction
Source: Cherifian Office for Phosphates

141M O R O C C O ’ S G R O W T H D I A G N O S T I C
By developing its transport infrastructure
and lowering trade barriers, the Moroccan
Government has been able to take
advantage of its geographical position
by increasing trade with neighboring
countries. Thus, countries like France and
Spain, the closest geographically, on their
own, account for 39% of Moroccan exports.
Morocco’s rich natural capital, its sunshine
and its proximity to Europe attract many
tourists and make the country a preferred
destination. Despite the crisis periods,
the number of tourists has continued to rise
(Figure 5.9). Tourism in Morocco is also one
of the activities with strong potential for
development of the country’s geographical
proximity.
5.3.2. Land Development
The agricultural sector plays a very
important economic and social role in
terms of contribution to growth, job
creation and food security.
With relatively low yields, land in Morocco
could be better developed. Most farms
(1.5M) are of a semi-subsistence type
with low yields (Oulhaj et al. 2012).
Agricultural production is characterized by
the coexistence of a large number of small
farms, the low quality of their production,
very limited market integration and a limited
number of high value-added, large-scale
farms most of whose production is exported.
For example, the only cereal produced for
marketing is soft wheat. Certain regions
are almost entirely specialized in this crop,
even though it is not necessarily the most
suitable production. Furthermore, the coverage
rate, representing the relationship between
the value of exports and that of imports of
agricultural products has decreased since
1990, indicating a deficit in agricultural
products (Table 5.2).0
2 000 000
4 000 000
6 000 000
8 000 000
10 000 000
0
10
20
30
40
2005 2006 2007 2008 2009 2010 2011
Num
ber
of to
uris
ts
Perc
entag
e
Tourism, revenue (in % of total exports)Tourism, number of arrivals
Figure 5.9: Tourism trend in Morocco
Source: World Bank, WDI

M O R O C C O ’ S G R OW T H D I A G N O S T I C142
According to Oulhaj et al. (2012), net
imports are positive and more significant
in the fruit and vegetable subsector.
This situation has gradually deteriorated
because of increased domestic consumption
at a rate above that of the population and
low yields (Akesbi, 2011). While remaining
low, oilseed yields have increased since the
early 1980s and those of cereals and
legumes have risen slightly. On the other
hand, industrial crop yields have continued
to fall.
The Moroccan agricultural sector has to
address several constraints. The investment
level is relatively low, organization and
supervision are inadequate and water
resources are limited. This sector must
overcome an additional constraint which is
the excessive fragmentation of holdings
(an average of 6 plots per farm). In addition,
almost 70% of farms have surface areas
below 5 hectares. The plethora of legal land
ownership systems, as well as low registration
and titling rates pose a serious threat to
investment in this sector.
Aware of the land challenge, the Government
established the strategy known as the
Green Morocco Plan for the 2008-2020
period. This is a far-reaching program
focused on seven thrusts: (i) making
agriculture the main growth driver, (ii) adopting
aggregation as the agriculture organization
model, (iii) ensuring the development of
agriculture in its entirety, (iv) promoting
private investment, (v) adopting a contractual
approach to implement this plan, (vi)
sustaining agricultural development and
(vii) preparing an overhaul of the sector
framework.
5.3.3 Water Development
The water resource situation is worrisome,
but the Government has made considerable
efforts. Indeed, the Water Department
has implemented several measures which
are an integral part of the National Water
Strategy, published in 2009 and divided
into three components: water conservation
in agriculture, strengthening of water
infrastructure and mobilization of non-
traditional water resources.
The Government has initiated the
exploitation of abundant resources such
as sea water or wastewater and their
enhancement through new technologies
like desalination plants using solar or
Table 5.2: Cover rate of the agriculturalbalance (in percentage)
Country 1990 1995 2000 2005 2010
Chile 603.5 472.9 450.3 468.4 345.2
Spain 64.5 114.6 82.8 76.3 79.8
India 76.5 88.9 101.9 96.8 108.8
Mexico 203.7 210.5 149.0 136.6 132.9
Morocco 112.1 74.4 89.9 92.9 75.5
Source: Calculations of Oulhaj and alii. (2012) based onWorld Bank and World Trade Organization data

143M O R O C C O ’ S G R OW T H D I A G N O S T I C
wind energy in order to respond to water
shortages. In addition, the significant
efforts made in water infrastructure have
contributed to the development of large-
scale irrigation (Table 5.3). Consequently,
the surface area currently irrigated is
almost 1.5 M hectares, two-thirds of which
is equipped by the public authorities.
5.3.4 Alternative Energy Development
Morocco’s energy dependence has
continued growing in line with the rise
in consumption of the resource. The
dependency rate rose from 82% in 1980
to 95.6% in 2011.
In order to address this worrisome situation,
the Government launched a large-scale
energy strategy particularly based on
solar (with the Moroccan Integrated
Solar Energy Project) and wind (with
the Moroccan Integrated Wind Energy
Project) energy. By using new technologies,
the Government has been able to utilize
non-exhaustible and clean natural resources
such as the sun and wind to reduce the
energy deficit. The new installed capacities
in 2012 (table 5.4) and the various plans
established indicate that energy production
will develop rapidly over the coming years.
Table 5.3: Various types of irrigation
Type of irrigation Gravity Spraying Localized Total Percentage
Large-scale irrigation scheme
533 900 113 800 34 900 682 600 47.0%
Small and mediumscale irrigationscheme
327 200 6 900 - 334 100 23.0%
Private irrigation 317 600 16 950 106 900 441 450 30.0%
Total 1 178 700 137 650 141 800 1 458 150 100%
Source: Ministry of Agriculture and Maritime Fishing

M O R O C C O ’ S G R OW T H D I A G N O S T I C144
5.3.5 Phosphate Development
From the employment standpoint, the
Office Chérifien des Phosphates (OCP)
directly employs more than 22 000 people,
thereby generating activity upstream and
downstream of the subsector. Its production
is intended both for the local and export
markets.
Locally sold quantities have continued
to increase since the early 2000s.
Furthermore, phosphate contribution to
exports is very significant since it accounted
for 27% in 2012 compared to 16.2%
in 2000, and over MAD 48.4 billion in
foreign exchange revenue (African Economic
outlook, 2013). Exports increased in value
more rapidly than in volume between 1980
and 2010.
Phosphates represent an exceptional
endowment for Morocco. Most products
from this ore are relatively unprocessed.
Therefore, there is scope for the development
of this resource.
5.4 Growth Diagnostic Tests
5.4.1 Comparison of Water and LandAvailability
The first test consists in analyzing water
resource and arable land availability
in relation to the comparator countries.
The objective of this test is to determine
whether water and land are scarce resources
in Morocco.
Morocco has a very low renewable water
resource level in relation to country
comparators. Nevertheless, when it is
compared to a country closer to it in terms of
geographical characteristics such as Tunisia,
its water resources and the percentage
of irrigated agricultural land are much
higher. Even though the country has limited
resources, the irrigation-related effort made
by Morocco for several years now makes
the situation sustainable.
For land availability, the proportion of
arable land remains within the average
with 0.25 hectares per capita (Figure 5.10).
Morocco is ranked ahead of Chile, Indonesia
and Malaysia. The area of land seems to be
reasonable.
0
0.1
0.2
0.3
0.4
0.5
Chile Indonesia Moroccco Malaysia Romania Tunisia Turkey
Figure 5.10: Useful agricultural surfacearea per capita
Source: World Bank, WDI

145M O R O C C O ’ S G R OW T H D I A G N O S T I C
5.4.2 Type 2 Test: Estimation of the Correlation Between Resources (Waterand Land) and the Level of EconomicDevelopment
The second test aims to determine the
link between water resources and land
availability and the level of economic
activity. An insufficient level of renewable
water can impede the smooth running
of industrial enterprises and agricultural
activity. Similarly, low land availability can
also lead to development difficulties. This
test, therefore, measures the severity of the
constraint by situating Morocco in relation
to the comparator countries to answer
the following question: Is water and arable
land availability adequate considering the
country’s economic activity?
However, Morocco seems to have a
renewable water availability level lower
than its level of economic activity.
Figure 5.11 illustrates the correlation
between real income per capita in 2012
and the level of renewable water resources.
The regression line indicates the expected
level of renewable water resources in
relation to the level of economic activity.
Here, Morocco is below the regression line,
which indicates that it has an inadequate
level for its level of development.
On the other hand, the level of arable
land availability does not seem to impede
economic activity. According to figure 5.12,
Morocco is on the regression line. It appears,
therefore, that the level of arable land
availability corresponds to agricultural value
added per worker.
0
2
4
6
8
10
12
14
6 7 8 9 10 11Log of GDP
Figure 5.11: Renewable water resourcesand wealth level (log of GDP/per capita
in PPP, 2005 constant $)
Source: World Bank, WDI
0 0.2 0.4 0.6 0.8
1 1.2 1.4
6 6.5 7 7.5 8 8.5 9 9.5 10 10.5 11
Figure 5.12: Arable land and agriculturalvalue added (log/per capita, 2005
constant $)
Source: World Bank, WDI

M O R O C C O ’ S G R OW T H D I A G N O S T I C146
5.4.3 Type 3 Test: Are Firms Obligedto Bypass the Constraint?
Test 3 seeks to identify the need for firms
to by-pass the constraint. The aim here
is to analyze whether it is necessary for
domestic firms to bypass the resource
availability constraint.
Moroccan firms do not seem to be
obliged to bypass the constraint.
They declare that they do not have
water shortages (Figure 5.13). Morocco’s
situation seems more favorable when
compared to the average of MENA
countries where enterprises claimed during
surveys to have experienced “2.1 water
shortages” per month.
5.4.4 Type 4 Test: Are Firms Requiringmore Water and/or Land Hindered intheir Development?
This test seeks to identify whether firms
whose activity requires more water and
land are most challenged in their development.
Generally, the economic activity which makes
most use of water and arable land availability
is agriculture. Thus, the test consists in analyzing
the agricultural sector’s economic performance,
as well as that of the agri-food sector which
is closely linked to it.
If water or land was a major constraint
to the development of economic activity,
agricultural and agri-food firms would
experience difficulties developing. Figure
5.14, indicates the trend of agricultural value
added since 1990.
00.40.81.21.6
22.4
Chile
Indo
nesia
Mor
occo
Rom
ania
Turk
ey
Latin
Ame
rica
East
and P
acifi
cAs
ia
East
and
cent
ral
Euro
pe
MEN
A
Figure 5.13: Number of water shortages(per month) declared by firms
Source: World Bank, Enterprise Surveys
0
2E+09
4E+09
6E+09
8E+09
1E+10
1.2E+10
1.4E+10
1990 1992 1994 1996 1998 2000 2002 2004 2006 2008 2010
Dol
lar c
onst
ant,
2005
Figure 5.14: Agricultural value added(in 2005 constant $)
Source: World Bank, WDI
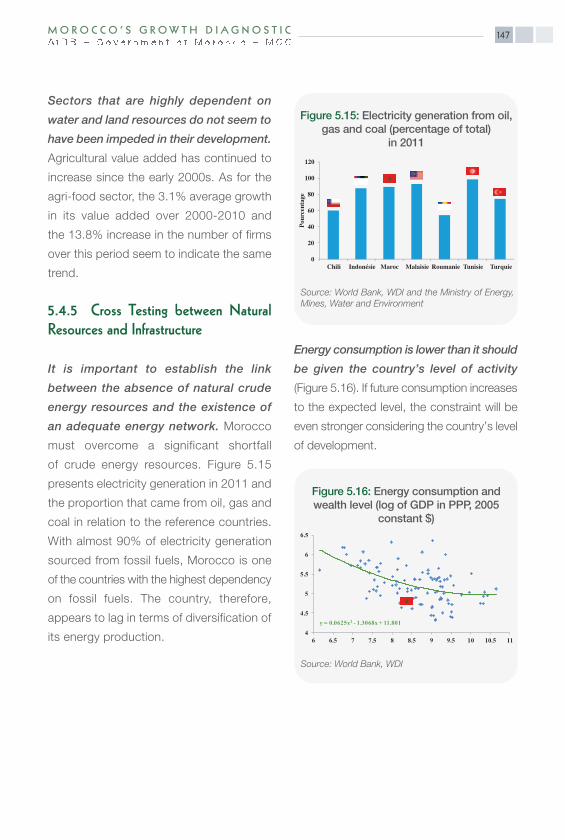
147M O R O C C O ’ S G R OW T H D I A G N O S T I C
Sectors that are highly dependent on
water and land resources do not seem to
have been impeded in their development.
Agricultural value added has continued to
increase since the early 2000s. As for the
agri-food sector, the 3.1% average growth
in its value added over 2000-2010 and
the 13.8% increase in the number of firms
over this period seem to indicate the same
trend.
5.4.5 Cross Testing between Natural Resources and Infrastructure
It is important to establish the link
between the absence of natural crude
energy resources and the existence of
an adequate energy network. Morocco
must overcome a significant shortfall
of crude energy resources. Figure 5.15
presents electricity generation in 2011 and
the proportion that came from oil, gas and
coal in relation to the reference countries.
With almost 90% of electricity generation
sourced from fossil fuels, Morocco is one
of the countries with the highest dependency
on fossil fuels. The country, therefore,
appears to lag in terms of diversification of
its energy production.
Energy consumption is lower than it should
be given the country’s level of activity
(Figure 5.16). If future consumption increases
to the expected level, the constraint will be
even stronger considering the country’s level
of development.
0
20
40
60
80
100
120
Chili Indonésie Maroc Malaisie Roumanie Tunisie Turquie
Pour
cent
age
Figure 5.15: Electricity generation from oil,gas and coal (percentage of total)
in 2011
Source: World Bank, WDI and the Ministry of Energy,Mines, Water and Environment
y = 0.0625x2 - 1.3068x + 11.801
4
4.5
5
5.5
6
6.5
6 76.5 7.5 8.5 9.5 10.58 9 10 11
Figure 5.16: Energy consumption andwealth level (log of GDP in PPP, 2005
constant $)
Source: World Bank, WDI

M O R O C C O ’ S G R OW T H D I A G N O S T I C148
The low level of production compels the
country to import in great quantities.
Figure 5.17 illustrates the trend of Moroccan
oil imports as a percentage of imported
goods. It appears that these imports have
steadily increased since 1998.
However, if energy is a constraint to the
development of economic activity, firms
in high energy consuming sectors would
experience more development difficulties
than others. High energy consuming
sectors do not seem to have been impeded
in their development since the trend of
their value added does not seem to differ
from that of other sectors. However, this
conclusion must be qualified by the fact that
energy is highly subsidized with result that
the soaring international energy prices did
not have an impact on business activities.
However, this effect could become significant
in future, in relation to diversification of
the energy mix and establishment by the
Government of the partial indexation system.
5.5 Second-Round Effects
The availability of water, arable land
and energy do not seem to be a major
obstacle to growth, but may potentially
induce second-round effects. Indeed, the
development of the economy can profoundly
change the use of resources. This is
particularly true if the use of new technologies
is not promoted in order to better develop
and sustain existing resources.
This applies in particular to water resources,
where there could be trade-offs between
use for consumption at the level of
households, industry or agriculture. This
issue arises especially if the necessary
technologies are not used to develop
resources (desalination, rainwater collection,
reduction of runoff, etc.), improve efficiency
(drip irrigation) or recycle them (treatment
station).
In the case of land, certain agricultural
practices and lack of technology have
led to the deterioration of soil quality
(salinization and erosion). The development
of agricultural activities partly in response
to growth and change in local demand,
subsequent to economic development,
could worsen this resource degradation if
0
5
10
15
20
25
30
1990 1992 1994 1996 1998 2000 2002 2004 2006 2008 2010 2012
Perc
enta
ge
Figure 5.17: Oil imports (in percentage ofimported goods)
Source: Ministry of the Economy and Finance
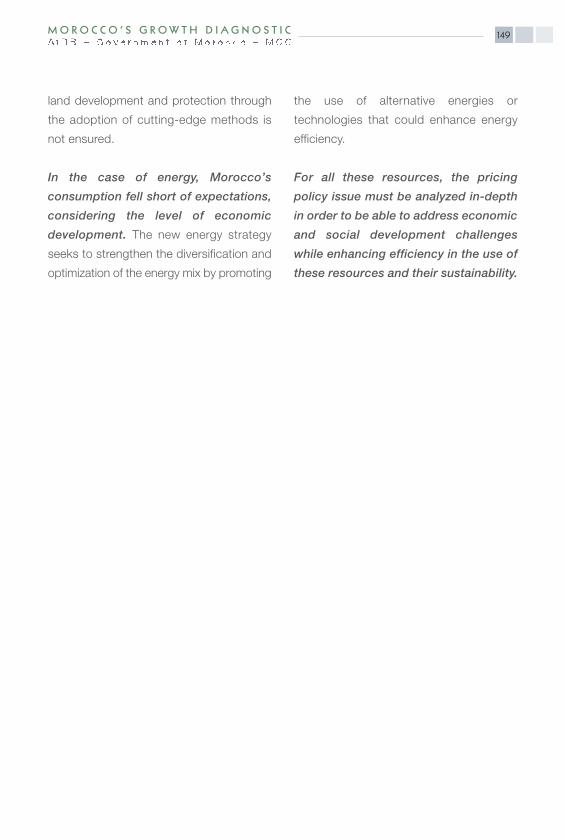
149M O R O C C O ’ S G R OW T H D I A G N O S T I C
land development and protection through
the adoption of cutting-edge methods is
not ensured.
In the case of energy, Morocco’s
consumption fell short of expectations,
considering the level of economic
development. The new energy strategy
seeks to strengthen the diversification and
optimization of the energy mix by promoting
the use of alternative energies or
technologies that could enhance energy
efficiency.
For all these resources, the pricing
policy issue must be analyzed in-depth
in order to be able to address economic
and social development challenges
while enhancing efficiency in the use of
these resources and their sustainability.

Chapter 6
Macroeconomic Risks

Chapter 6: Macroeconomic Risks
Key Messages
• Since the early 90s and up to the 2007 financial crisis, Morocco, just like other countries
of the MENA region, benefitted from its geographical proximity and its integration
policies with the European market. The prolonged fall in growth in Europe, the impact of
the Arab Spring and the hike in world commodity prices impacted negatively on public
finances, the balance of payments current account and employment, and challenged
macroeconomic stability.
• The balance of payments current account balance remained within the IMF benchmark
level (-2.8% of the GDP). However, the rapid increase in investments rate to GDP, which
has not been offset since 2007 by a substantial increase in the savings rate, accounts
for the widening financing gap.
• Despite the deterioration in the balance of payments current account, the deficit on
which reached 9.7% of GDP in 2012, the level of net foreign assets remained above
the commonly accepted floor level (3 months of imports) owing to the foreign currency
stock accumulated in the past. However, current pressure on net foreign assets raises
the issue of sustainability of the balance of payments current account deficit.
• The calculation of equilibrium real exchange rates reveals an appreciation of the real
exchange rate between 1995 and 2004 and depreciation since 2005, invalidating the
hypothesis of an overvaluation of the dirham.
• Despite the inter-bank market liquidity problem observed since the financial crisis, the
satisfactory fundamentals of the banking sector enabled it to continue financing the
Moroccan economy under good conditions.
• The banking sector gradually improved its risk management as reflected in the drop in
the bad and doubtful debt ratio to the level of the main comparator countries.
• Macroeconomic balances are sustainable in the medium term, but are threatened in the
short term by an unfavorable international context and growing social demand.
M O R O C C O ’ S G R OW T H D I A G N O S T I C152

Introduction
Macroeconomic imbalances can be a
major obstacle to growth when they
generate inflationary pressures, crowding out
private investment by government deficits
and financial and exchange crises.
For countries with access to financial
markets, the banking sector is the guarantor
of macroeconomic stability. The financial
sector’s solidity enhances the sustainability
of fundamental balances by ensuring that
external shocks do not spread through the
banks to the entire economy. Conversely,
the financial sector’s fragility exacerbates
macroeconomic imbalances.
Since the end of the structural adjustment
period, Morocco’s performance has often
been threatened by external shocks
(commodity prices or international
situation) and internal fragilities
(weather conditions and social and
institutional rigidities). Recently, the
combination of slowdown of economic
activity in Europe, social tensions in the wake
of the Arab Spring, and the 2012 drought,
led to a decline in economic growth and
a widening of budget and balance of
payments current account deficits.
Nevertheless, despite the various external
shocks which have occurred since the
financial crisis, Morocco’s experience
in macroeconomic management and
institutional stability place the Moroccan
authorities in a favorable position to manage
the risks associated with the deteriorating
balances observed in the last three years.
To restore short-term macroeconomic
balances, Morocco can rely on the
Precautionary and Liquidity Line granted
by the IMF, which enhances the credibility
of the country’s determination to under-
take reforms, particularly in the area
of taxation and compensation52.
6.1 Balance of Payments Current Account Imbalances
Moroccan authorities have demonstrated
their ability, in the long run, to restore the
macroeconomic balances. However, even
though domestic growth components were
controlled, the sources of external vulnerability
for the Moroccan economy remain intact.
52 It should be stated that the subsidy policy reform was initiated since mid-2013.
153M O R O C C O ’ S G R O W T H D I A G N O S T I C
6.1.1 External Macroeconomic Risk Factors53
The degree of openness of the Moroccan
economy54 (86% in 2012) exceeds that of
all Lower Middle-Income Countries (LMIC).
Because of this, Morocco is fairly highly
exposed to international income fluctuations.
Despite outstanding performances in
certain exportable products for almost
ten years, foreign trade remains a weak
point of the Moroccan economy. In the
longer term, foreign trade trends show
a strengthening of Morocco’s export
position, alongside high energy dependency
on the import side.
The share of consumer (textiles) and food
products in exports dropped sharply
during the first decade of the 2000s
in favor of semi-processed products,
fertilizers, phosphoric acids and, to a
lesser extent, industrial equipment products.
This trend reflects a change in Morocco’s
industrialization process. However, the
geographical concentration of exports in
South European countries heightens the
risk of exposure to demand shocks.
Regarding imports (more than half of
which originate from Europe), structural
dependency on fixed imports affects the
sustainable restoration of the balance of
payments current account balance.
Indeed, energy imports since 2009 and the
rapid increase in food imports since 2007
affect the trade balance because of higher
commodity prices.
Consequently, the size of the energy and
food import bills is a constraint to the
exchange rate policy which must avoid the
inflationary risk linked to a sharp depreciation
of the dirham.
6.1.2 Current Account Balance Trendand Financing Gap
The balance of payments current account
imbalance reflects excess aggregate demand
due to insufficient savings in relation to
investment. Since the early nineties, Morocco
has reduced its current account deficits,
almost balanced them between 1996 and
2000, and generated surpluses between 2001
and 2006, especially as a result of privatization
revenue, massive inflows of migrant remittances,
and tourism revenue. The trend was, however,
reversed as from 2004 and the Moroccan
economy’s resilience to shocks was severely
tested since 2009 and, again, in the years
2011 and 2012.
In the longer term, with the exception of
the 2010-2012 period, the balance of
M O R O C C O ’ S G R OW T H D I A G N O S T I C154
53 See annex 6.1 for more details.54 (X+M)/GDP.
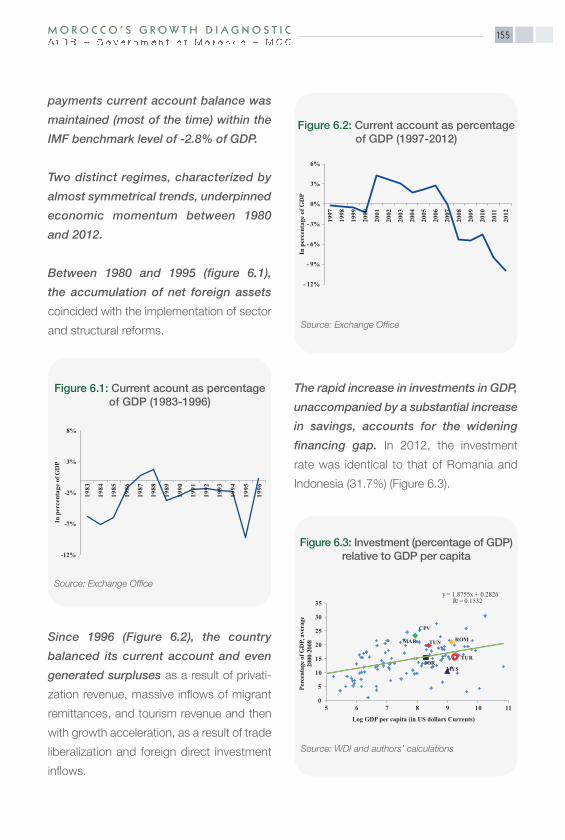
payments current account balance was
maintained (most of the time) within the
IMF benchmark level of -2.8% of GDP.
Two distinct regimes, characterized by
almost symmetrical trends, underpinned
economic momentum between 1980
and 2012.
Between 1980 and 1995 (figure 6.1),
the accumulation of net foreign assets
coincided with the implementation of sector
and structural reforms.
Since 1996 (Figure 6.2), the country
balanced its current account and even
generated surpluses as a result of privati-
zation revenue, massive inflows of migrant
remittances, and tourism revenue and then
with growth acceleration, as a result of trade
liberalization and foreign direct investment
inflows.
The rapid increase in investments in GDP,
unaccompanied by a substantial increase
in savings, accounts for the widening
financing gap. In 2012, the investment
rate was identical to that of Romania and
Indonesia (31.7%) (Figure 6.3).
155M O R O C C O ’ S G R OW T H D I A G N O S T I C
-12%
-7%
-2%
3%
8%
1983
1984
1985
1986
1987
1988
1989
1990
1991
1992
1993
1994
1995
1996
In p
erce
ntag
e of
GD
P
Figure 6.1: Current acount as percentageof GDP (1983-1996)
Source: Exchange Office
- 12%
- 9%
- 6%
- 3%
0%
3%
6%
1997
1998
1999
2000
2001
2002
2003
2004
2005
2006
2007
2008
2009
2010
2011
2012
In p
erce
ntag
e of
GD
P
Figure 6.2: Current account as percentageof GDP (1997-2012)
Source: Exchange Office
CPV
JORMYS
MAR ROMTUN
TUR
y = 1.8755x + 0.2826R = 0.1532
0
5
10
15
20
25
30
35
5 6 7 8 9 10 11
Perc
enta
ge o
f GD
P, a
vera
ge
2000
-200
8
Log GDP per capita (in US dollars Currents)
Figure 6.3: Investment (percentage of GDP)relative to GDP per capita
Source: WDI and authors’ calculations

Between 2004 and 2011, FDI accounted
for about 2.8% of GDP. Over the same
period, the average investment / savings
gap was 5.9%. The external financing gap,
therefore, stood at about 3.1% of GDP.
Over the short term, the balance of
payments current account deficit
deteriorated rapidly from 2007 with the
decline in global activity following the
financial crisis (Figure 6.4).
However, from a longer-term perspective
and compared to the comparator countries,
Morocco’s financing requirements have
been fairly stable, thanks to the implementation
of counter-cyclical policies (accumulation
of net foreign assets during the acceleration
phase).
6.1.3 Trend in Net Foreign Assets
In the case of Morocco, the external
position is a key factor in assessing
macroeconomic risk. The trend in net
foreign assets is a preferred indicator for
analyzing the insolvency and financial risk
of open economies55.
The macroeconomic insolvency risk can
result from weakness of the banking sector,
exposure to exchange risk (depreciation
of foreign assets) or interest-rate risk
exposure (ill-adapted maturity structure
of net borrowings). It can also be generated
by an accumulation of net foreign assets
underpinned by excessive borrowing to offset
the imbalance on the balance of payments
current account.
Despite the widening of the balance of
payments current account deficit to 9.7%
of GDP in 2012, the level of net foreign
assets in Morocco remained above the
commonly accepted floor level (3 months
of imports) owing to the foreign currency
stock accumulated in the past (Figure 6.5).
In 2011 and 2012, a succession of negative
shocks, falling exports, a higher energy bill,
lower migrant remittances and a drop in FDI
accelerated the fall in net foreign assets.
However, their maintenance at the equivalent
of 4.5 months of imports of goods was
M O R O C C O ’ S G R OW T H D I A G N O S T I C156
-20
-15
-10
-5
0
5
10
15
20
2007 2008 2009 2010 2011 2012
In p
erce
ntag
e of
GD
P
Egypt IndonesiaJordan MalaysiaMauritius Income countries MiddleMorocco RomaniaTunisia Turkey
Figure 6.4: Current account balance aspercentage of GDP
Source: Data Market, World Bank and authors’ calculations
55 Lane, Philip R., and Gian Maria Milesi-Ferretti, / Lehmann, Alexander, / Mathisen, Johan, and Anthony J. Pellechio.
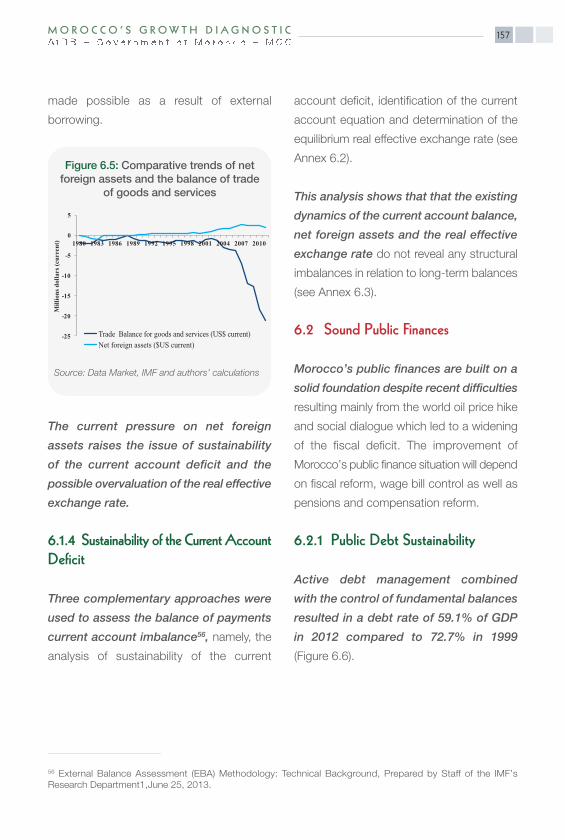
made possible as a result of external
borrowing.
The current pressure on net foreign
assets raises the issue of sustainability
of the current account deficit and the
possible overvaluation of the real effective
exchange rate.
6.1.4 Sustainability of the Current AccountDeficit
Three complementary approaches were
used to assess the balance of payments
current account imbalance56, namely, the
analysis of sustainability of the current
account deficit, identification of the current
account equation and determination of the
equilibrium real effective exchange rate (see
Annex 6.2).
This analysis shows that that the existing
dynamics of the current account balance,
net foreign assets and the real effective
exchange rate do not reveal any structural
imbalances in relation to long-term balances
(see Annex 6.3).
6.2 Sound Public Finances
Morocco’s public finances are built on a
solid foundation despite recent difficulties
resulting mainly from the world oil price hike
and social dialogue which led to a widening
of the fiscal deficit. The improvement of
Morocco’s public finance situation will depend
on fiscal reform, wage bill control as well as
pensions and compensation reform.
6.2.1 Public Debt Sustainability
Active debt management combined
with the control of fundamental balances
resulted in a debt rate of 59.1% of GDP
in 2012 compared to 72.7% in 1999
(Figure 6.6).
56 External Balance Assessment (EBA) Methodology: Technical Background, Prepared by Staff of the IMF’sResearch Department1,June 25, 2013.
157M O R O C C O ’ S G R OW T H D I A G N O S T I C
-25
-20
-15
-10
-5
0
5
1980 1983 1986 1989 1992 1995 1998 2001 2004 2007 2010
Mill
ions
dol
lars
(cur
rent
)
Trade Balance for goods and services (US$ current)Net foreign assets ($US current)
Figure 6.5: Comparative trends of netforeign assets and the balance of trade
of goods and services
Source: Data Market, IMF and authors’ calculations

However, it should be noted that public
debt is already relatively high in relation
to the comparator countries and that any
increase would endanger inclusive and
sustainable growth (Figure 6.7).
With a widening fiscal deficit since 2010
and rising debt ratio, the issue of public
debt sustainability would have arisen if
commitments taken within the framework
of establishing the IMF Precautionary
and Liquidity Line were not fulfilled.
According to the IMF’s forward-looking
Debt Sustainability Analysis for Morocco,
the debt ratio is expected to fall to 56.9%
in 201757.
6.2.2 Assessment by Markets
Despite guaranteed access to the global
market, the Credit Default Swap (CDS)
sovereign premium increased sharply
at the end of 2012, thus leading to
a deterioration of public finances.
Nevertheless, Morocco still had a favorable
quotation compared to Tunisia and Egypt.
Figure 6.8 highlights the relationship
between the CDS premium at 5 years and
the debt/GDP ratio. Except for advanced
countries, the premium/debt relationship
is logically on the rise. The grey scatter
dots include middle-income countries with
a debt level below 50% and a premium
below that of Morocco. In late 2012,
Morocco benefitted from an “overvaluation”,
with a premium level slightly above the
group average, despite a considerably
higher debt level.
M O R O C C O ’ S G R OW T H D I A G N O S T I C158
-9-8-7-6-5-4-3-2-1012
0
20
40
60
80
100
120
199019921994199619982000200220042006200820102012Fi
scal
bal
ance
(% G
DP)
Gov
ernm
ent d
ebt (
% G
DP)
Government debt (% GDP) Fiscal balance (% GDP)
Figure 6.6: Budget deficits and publicdebts
Source: World Bank
0
40
80
120
1990 1995 2000 2005 2010
In p
erce
ntag
e of
GD
P
Morocco Malaysia Romania TunisiaTurkey Chile Indonesia
Figure 6.7: Gross public debt(in percentage of GDP)
Source: World Bank
57 Calculated from the formula d=d-1 [(r - p(1+g) - g + ae(1+r)]/(1+g+p+gp)) where d is the debt/GDP ratio; r = apparent interest rate of the debt; p = inflation rate; g = GDP growth rate in volume; a = share of the debt inforeign currency; and e = depreciation rate of the nominal exchange rate (number of dirhams for a USD).
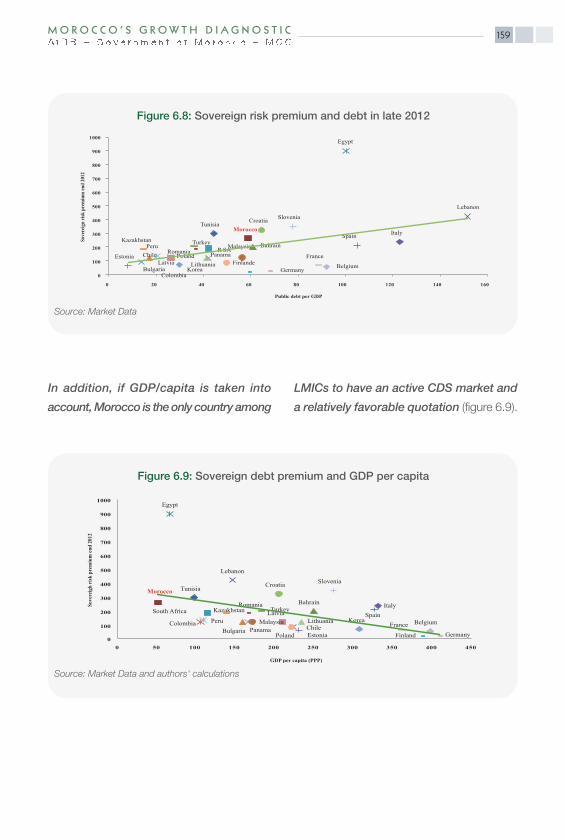
In addition, if GDP/capita is taken into
account, Morocco is the only country among
LMICs to have an active CDS market and
a relatively favorable quotation (figure 6.9).
159M O R O C C O ’ S G R OW T H D I A G N O S T I C
TunisiaMorocco
Bahrain
Lebanon
Egypt
Malaysia
Spain
RomaniaTurkey
Italy
R SA
Bulgaria
Chile
Colombia
Croatia
EstoniaFinlande
Kazakhstan
KoreaLatvia Lithuania
PanamaPeru
Poland
Slovenia
Germany
France
Belgium0
100
200
300
400
500
600
700
800
900
1000
0 20 40 60 80 100 120 140 160
Sove
reig
n ris
k pr
emiu
m en
d 20
12
Public debt per GDP
Figure 6.8: Sovereign risk premium and debt in late 2012
Source: Market Data
TunisiaMorocco
Bahrain
Lebanon
Egypt
MalaysiaSpain
RomaniaTurkey Italy
South Africa
Bulgaria ChileColombia
Croatia
Estonia Finland
KazakhstanKorea
LatviaLithuania
PanamaPeru
Poland
Slovenia
GermanyFrance Belgium
0
100
200
300
400
500
600
700
800
900
1000
0 50 100 150 200 250 300 350 400 450
Sove
reig
h ris
k pr
emiu
m en
d 20
12
GDP per capita (PPP)
Figure 6.9: Sovereign debt premium and GDP per capita
Source: Market Data and authors' calculations
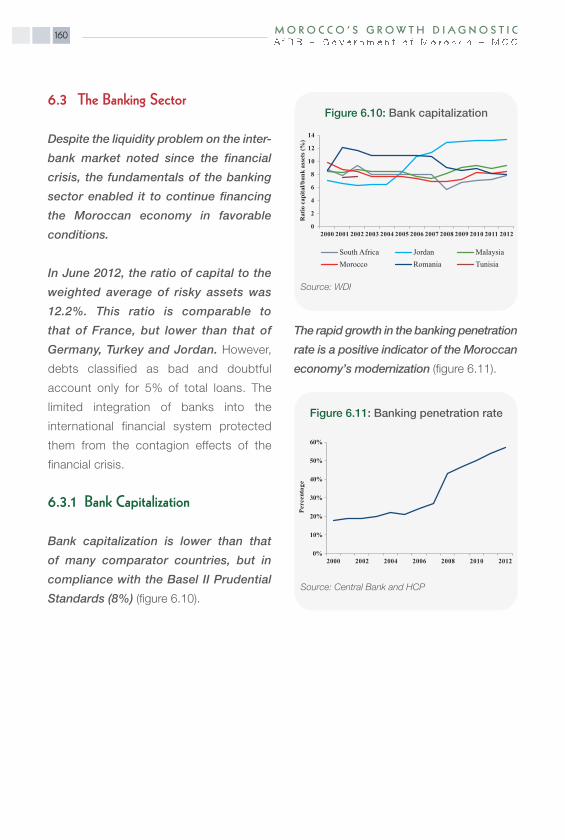
6.3 The Banking Sector
Despite the liquidity problem on the inter-
bank market noted since the financial
crisis, the fundamentals of the banking
sector enabled it to continue financing
the Moroccan economy in favorable
conditions.
In June 2012, the ratio of capital to the
weighted average of risky assets was
12.2%. This ratio is comparable to
that of France, but lower than that of
Germany, Turkey and Jordan. However,
debts classified as bad and doubtful
account only for 5% of total loans. The
limited integration of banks into the
international financial system protected
them from the contagion effects of the
financial crisis.
6.3.1 Bank Capitalization
Bank capitalization is lower than that
of many comparator countries, but in
compliance with the Basel II Prudential
Standards (8%) (figure 6.10).
The rapid growth in the banking penetration
rate is a positive indicator of the Moroccan
economy’s modernization (figure 6.11).
M O R O C C O ’ S G R OW T H D I A G N O S T I C160
0
2
4
6
8
10
12
14
2000 2001 2002 2003 2004 2005 2006 2007 2008 2009 2010 2011 2012
Rat
io c
apita
l/ban
k as
sets
(%)
South Africa Jordan MalaysiaMorocco Romania Tunisia
Figure 6.10: Bank capitalization
Source: WDI
0%
10%
20%
30%
40%
50%
60%
2000 2002 2004 2006 2008 2010 2012
Perc
enta
ge
Figure 6.11: Banking penetration rate
Source: Central Bank and HCP

Between 2000 and 2012, the banking
penetration rate rose in all regions and the
reduction in the number of people per bank
counter continued during the same period in
most regions (Figure 6.12).
6.3.2 Return on Capital
In addition to bank capitalization, the key
issues are those of the return on capital
invested in the financial sector and bank
governance, particularly in the area of
risk management. The return on capital of
Moroccan banks was 10% in 2012 compared
to 13% in Turkey, 15% in Malaysia and 1.5%
in Romania. The average return on Moroccan
bank assets is also low, but stable since the
early 2000s decade. It is lower than those
of Malaysia and Turkey (Figure 6.13).
6.3.3 Risk Management
The banking sector has gradually
improved its risk management. The ratio
of BDDs has decreased to the level of the
main comparator countries. In June 2013,
the BDD rate was 5%, with, however,
a wide sector disparities. It is almost 10%
in agriculture, 9.3% in the manufacturing
industry, 11% in the hotel trade, 4.8%
for households, but only 0.3% in the mining
industries. In addition, the increase in
provisions for doubtful debts, which rose
to 68% in 2012, enhances bank credibility.
These efforts were made in a context of
tighter margins.
161M O R O C C O ’ S G R OW T H D I A G N O S T I C
010 00020 00030 00040 00050 00060 000
Chao
uia -
Oua
rdigh
a
Douk
kala
- Abd
a
Fès B
oulem
ane
Gha
rb -
Chra
rda -
Bén
i Hsse
n
Gra
nd C
asab
lanca
Gue
lmim
- Es
- Se
mar
a La
âyou
ne -
Bouj
dour
- Sa
kia
El H
amra
Mar
rake
ch - T
ensif
t - A
lH
aouz
Mek
nès -
Taf
ilalet
Orie
ntal
Oue
d Ed
- Da
hab
- Lag
ouira
Raba
t - S
alé -
Zem
mou
r - Z
aêr
Sous
s - M
assa
- Dr
aâ
Tadl
a - A
zilal
Tang
er - T
étoua
n
Taza
- Al H
oceim
a - T
aoun
ate
Num
ber o
f inh
abita
nts p
er w
icket
2000 2012
Figure 6.12: Number of inhabitants bybank counter and by region
Source: Central Bank and HCP
-8
-6
-4
-2
0
2
4
6
1998-01
1999-01
2000-01
2001-01
2002-01
2003-01
2004-01
2005-01
2006-01
2007-01
2008-01
2009-01
2010-01
2011-01
Rat
io
Morocco Jordan MalaysiaRomania Tunisia Turkey
Figure 6.13: Return on bank assets
Source: Data market

Chapter 7
Microeconomic Risks
M O R O C C O ’ S G R OW T H D I A G N O S T I C164
Chapter 7: Microeconomic Risks
Key Messages
• During the last decade, Morocco embarked on a process of modernizing and enhancing
its legal and institutional frameworks. However, judicial system-related issues are always
raised as constraining for all categories of firms.
• The Moroccan judicial system is considered extremely cumbersome in terms of
contract execution (very long timeframes and very high number of procedures), and
insolvency settlement costs are also considered high.
• In a bid to bypass the complexity of the judicial system in Morocco and propose an
alternative method of settling disputes, a new Law on Arbitration and Mediation
(national and international) was enacted in February 2008. However, since its enactment,
the use of trade arbitration has not yet been fully successful.
• The Moroccan authorities are fully aware of the flaws of the judicial system. Considerable
efforts have been made to change its negative perception by investors.
• The reforms already undertaken have undoubtedly helped to address several issues but
challenges remain. The Moroccan authorities are continuing their commitments to the
modernization of the judicial system through, among other things, the simplification of
procedures and the establishment of new, specialized courts.
• The acceleration of structural reforms in the judicial sector is essential to promote private
investment and build investor confidence.
• Land Tenure is a complex issue in Morocco. Land ownership is subject to a dual
system, which makes land transactions very difficult, especially under the traditional
system governed by the principles of Muslim law and local customs. Similarly, land
tenure in Morocco is often criticized for the excessive diversity of its statutes and
oversight authorities.
• In Morocco, land access is a constraint which is highly dependent on land availability
in the regions attractive for investment. In addition to the issue of land availability, high
prices, speculation and the very long timeframes (time required to lease land) are
considered as additional obstacles.
• The creation of industrial zones has, to some extent, mitigated the problem of land
access but urbanistic constraints remain.

165M O R O C C O ’ S G R O W T H D I A G N O S T I C
• Land tenure is considered as major obstacles to private investment in Morocco.
Despite the efforts made, the problem of land access could discourage national and
foreign investors. It is, therefore, urgent to reform and modernize certain aspects of this
sector’s regulatory and institutional framework.
• The tax system has largely been used by Moroccan authorities as an economic
incentive. However, the tax burden does not weigh equally on economic operators
(problem of fiscal distortions).
• In practice, Moroccan taxation has been permanently under reform since the mid-80s.
However, changes made by various budget laws have made the tax system less
transparent and complex.
• For several years now, the significant improvement in tax administration quality (in terms
of timeframes and number of taxes paid per year) and the modernization of its services
has helped to simplify procedures and reduce tax payment timeframes.
• Despite the efforts made to reduce the tax rate, Moroccan firms operating in the
formal sector still feel that these rates are relatively high and impede the expansion of
their activities.
• During the last decade, Morocco embarked on a process of strengthening good
governance practices. However, recent international reports in this area emphasize that
governance and anti-corruption perception indicators were among the lowest.
Consequently, the improvement of governance remains a major challenge for the
Moroccan authorities. In this regard, several measures were adopted [adoption of the
2010-12 action plan, establishment of the Central Authority for the Prevention of
Corruption (ICPC) which became a constitutional body in 2011, and the establishment
of the Anti-Corruption Inter-ministerial Commission CILCC)].
• The contract values of Moroccan firms are not seriously affected by corruption, and
problems of governance and corruption within the administration do not seem to be a
major constraint to the development of their activities.
• International indicators show that Morocco has a relatively rigid Labor Code in relation
to the comparator countries, which results in implicitly high costs.

M O R O C C O ’ S G R OW T H D I A G N O S T I C166
• In relation to the comparator countries, the financial cost of labor in Morocco is
relatively high. In addition, the minimum wage in Morocco is close to the average
productivity per worker, which shows that Morocco promotes unskilled labor, compared
to its level of income per capita.
• Moroccan entrepreneurs feel that labor legislation is less problematic than access to
financing or bad governance. However, some of them are not prepared to comply with
this legislation, which is an explanation for the relatively high number of strikes and size
of the informal sector.
• Aware of the importance of trade openness in its development process, Morocco has,
for many years now, embarked on important reforms to simplify trade procedures.
• Morocco has made great efforts in terms of openness: since the late 1990s, many trade
agreements have been signed with various partners resulting in a general drop in tariffs,
which was even sharper for industrial products.
• Morocco’s trade policy also concerned the reduction in the number of non-tariff
measures (NTM) and their harmonization with international standards.
• Morocco’s overall trade openness has improved greatly and trade barriers do not
impede the country’s growth. However, the increasing number of trade agreements
might complicate Morocco’s trade regime.
167M O R O C C O ’ S G R OW T H D I A G N O S T I C
Introduction
Weak ownership of the return on
economic activity in a given country is
often due to the failure of government
policies and institutions. Indeed,
institutional weaknesses create risks and
distortions at the microeconomic level,
reduce the return on private investments
and slow down economic growth.
To address these weaknesses, it is essential
to establish adequate microeconomic
policies and efficient institutions. These
policies will foster the establishment of a
reliable system of property rights, transparent
and efficient regulations, a fair, modern and
rapid judicial system in terms of the enforcement
of judgements, relatively flexible taxation
rules without distortions, easy access to
land, and adequate protection against unfair
trade practices and situations of monopolistic
competition.
Within the framework of the growth
diagnostic, microeconomic distortions
and weak institutions can be a major
constraint to economic growth and
impede private investment. This chapter
presents an empirical analysis, which shows
that weaknesses in certain microeconomic
policies and institutional failures are major
constraints to growth in Morocco. The
sluggish judicial system, including the
enforcement of court rulings, increasingly
difficult access to land and governance
issues represent a major challenge which
must be addressed.
7.1 The Judicial System
7.1.1 Situation and Challenges
The judicial system, in addition to its conflict
resolution role, can be a very important
factor for economic development and
private investment promotion. Indeed,
investor protection partly depends on the
efficiency of the judicial system and its ability
to pass impartial judgments in accordance
with the law, ensure compliance with
agreements and contracts and see to the
reliable and transparent enforcement of laws
in settling trade conflicts. By guaranteeing
the freedom of financial and economic
transactions, ensuring investors’ rights and
promoting a climate of trust, the judicial
system could encourage private investors
and promote economic activities.
During the last decade, Morocco embarked
on a process of modernizing its body of laws
and strengthening its institutional framework,
through the adoption of a series of reforms
culminating in the amendment of several laws
(Family Code, Criminal Code, Labor Code,
Nationality Code, Electoral Code, Communal
Charter, etc.) and the establishment of various
institutions, but whose mechanisms of action
are still to be perfected (especially regarding

M O R O C C O ’ S G R OW T H D I A G N O S T I C168
the judicial, control, coordination, monitoring
and evaluation bodies).
This process culminated in July 2013
in the Judicial Reform Charter, which is
a significant step towards improving
governance in public action. This charter
seeks to consolidate the independence of
the judiciary, moralize the justice system,
strengthen the protection of human rights
and freedoms, improve the efficiency and
effectiveness of the judicial apparatus, build
the judicial system’s institutional capacities
and modernize the administration.
According to the Global Integrity Report,
Morocco was ranked in the “very low”
category with a score of 50 out of 100 for
the Rule of Law criterion (Table 7.1.1). This
score is not encouraging for investors and
remains lower than that of the comparator
countries (57 for Tunisia, 80 for Turkey, 82
for Romania and 78 for Chile). However, it
should be noted that this 2010 ranking did
not yet reflect the reforms implemented to
modernize and strengthen the judicial system.
The last World Justice 2014 ranking
shows that Morocco’s judicial system
has evolved as a result of the reforms
engaged in for some years now. Indeed,
Morocco is ranked 52nd out of 99 countries
with an overall score of 0.51. This ranking
reflects the improvements made with ongoing
reforms in the public order and security
sectors (ranked 44th globally) and regulatory
enforcement (36th and 3rd globally among
countries of the region). However, despite
the progress made, this ranking remains
lower than that of Chile (21st with a 0.68 score),
Malaysia (35th) or Tunisia (41st) globally. Major
challenges remain in the areas of protection
of fundamental rights (84th out of 99) and
control of corruption (62nd). The civil justice
system is ranked 51st overall and the criminal
justice system 81st, mainly due to the
violations of due process, harsh conditions
in correctional facilities and political interference.
This ranking, while reflecting an improvement
following reforms, shows that the Moroccan
judicial system still suffers from certain
problems concerning theenforcement and
interpretation of regulations and emphasizes
the major challenges to be faced.
The results of the World Bank “Enterprise
Survey, 2007” confirm this problem and
justify the reforms undertaken by Moroccan
authorities to address it. Indeed, in 2007,
30.1% of Moroccan firms declared, during
this survey, that the judicial system is a
major obstacle to their activity. This rate is
significantly higher than that observed in
Turkey, Chile and Indonesia (Figure7.1.1).
Table 7.1.1: Global Integrity Score onanti-corruption and the Rule of law
Anti-corruption and Rule ofLaw
60 Very weak
Anti-Corruption Law 100 Very high
Anti-Corruption Agency 72 Moderate
Rule of Law 50 Very weak
Law Enforcement 63 Weak
Source: Global Integrity, 2010, Notes on a scale of 0 to 100.

169M O R O C C O ’ S G R OW T H D I A G N O S T I C
During this survey, all categories of
Moroccan firms (of various sizes and
operating in different sectors) stressed
the constraining nature of the Moroccan
judicial system. Thus, 34.6% of large
Moroccan firms and 31% of medium firms
identified the judicial system as a major
constraint (Figure 7.1.2). These results are
confirmed in a study on the business climate
and investment policy in Morocco conducted
in 2008 by UNCTAD58. This study highlights
issues linked to the credibility of the judicial
institution among investors and the inability
of magistrates and representatives of the
law to handle commercial matters, as very
constraining for investment promotion in
Morocco. It emphasizes that 30% of firms
consider the settlement of disputes by
commercial courts as a major obstacle to their
economic activity. In addition, foreign firms
established in Morocco are more sensitive to
this problem: 60% of firms (large, medium
and small) consider justice and judicial
uncertainty as the second obstacle to
business, after taxation. The results of this
survey explained the need and urgency to
reform the Moroccan judicial system.
7.1.2 Type 1 Test: High Cost of Justice
The Moroccan judicial system has always
been considered as being very complex
in the area of contract execution. Thus,
investors have often indicated that
Moroccan justice is slow (procedure
timeframes, adjournment of hearings),
uncertain (difficulty in getting court rulings
enforced) and unpredictable (corruption,
58 UNCTAD, 2008.
32.8 30.1
19.812.5
5.20
10
20
30
40
Romania (2009)
Morocco(2007)
Turkey(2008)
Chile(2010)
Indonesia (2009)
Perc
enta
ge
Figure 7.1.1: Percentage of firms identifyingthe judicial system as a binding constraint(Morocco and comparable countries)
Source: Enterprise Survey, World Bank
17.5
3134.6
0
10
20
30
40
Small (5-19) Medium (20-99) Large (100+)
Perc
enta
ge
Figure 7.1.2: Percentage of Moroccan firmsidentifying the judicial system as a binding
constraint
Source: Enterprise Survey, World Bank
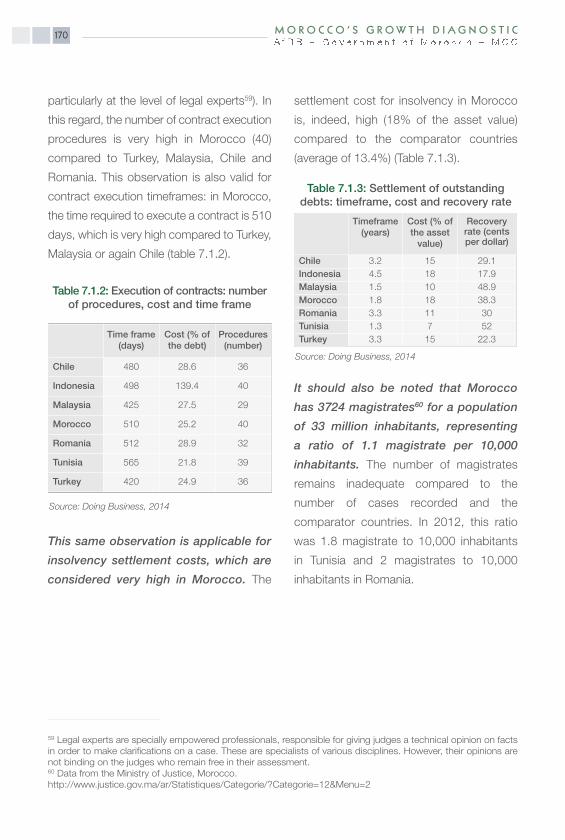
M O R O C C O ’ S G R OW T H D I A G N O S T I C170
particularly at the level of legal experts59). In
this regard, the number of contract execution
procedures is very high in Morocco (40)
compared to Turkey, Malaysia, Chile and
Romania. This observation is also valid for
contract execution timeframes: in Morocco,
the time required to execute a contract is 510
days, which is very high compared to Turkey,
Malaysia or again Chile (table 7.1.2).
This same observation is applicable for
insolvency settlement costs, which are
considered very high in Morocco. The
settlement cost for insolvency in Morocco
is, indeed, high (18% of the asset value)
compared to the comparator countries
(average of 13.4%) (Table 7.1.3).
It should also be noted that Morocco
has 3724 magistrates60 for a population
of 33 million inhabitants, representing
a ratio of 1.1 magistrate per 10,000
inhabitants. The number of magistrates
remains inadequate compared to the
number of cases recorded and the
comparator countries. In 2012, this ratio
was 1.8 magistrate to 10,000 inhabitants
in Tunisia and 2 magistrates to 10,000
inhabitants in Romania.
59 Legal experts are specially empowered professionals, responsible for giving judges a technical opinion on factsin order to make clarifications on a case. These are specialists of various disciplines. However, their opinions arenot binding on the judges who remain free in their assessment.60 Data from the Ministry of Justice, Morocco.http://www.justice.gov.ma/ar/Statistiques/Categorie/?Categorie=12&Menu=2
Time frame(days)
Cost (% ofthe debt)
Procedures(number)
Chile 480 28.6 36
Indonesia 498 139.4 40
Malaysia 425 27.5 29
Morocco 510 25.2 40
Romania 512 28.9 32
Tunisia 565 21.8 39
Turkey 420 24.9 36
Table 7.1.2: Execution of contracts: numberof procedures, cost and time frame
Source: Doing Business, 2014
Timeframe(years)
Cost (% ofthe assetvalue)
Recoveryrate (centsper dollar)
Chile 3.2 15 29.1Indonesia 4.5 18 17.9Malaysia 1.5 10 48.9Morocco 1.8 18 38.3Romania 3.3 11 30Tunisia 1.3 7 52Turkey 3.3 15 22.3
Table 7.1.3: Settlement of outstandingdebts: timeframe, cost and recovery rate
Source: Doing Business, 2014

171M O R O C C O ’ S G R OW T H D I A G N O S T I C
7.1.3 Type 2 Test: Relationship betweenJudicial System Quality and GDP percapita
Morocco is highly ranked in terms of protection
of property rights (overall indicator for the
protection of private property rights). The
property rights index in Morocco is consistent
with its level of GDP per capita (Figure 7.1.3).
This observation also applies for the Rule
of Law index61. Morocco is ranked highly in
relation to its GDP per capita (Figure 7.1.4).
This shows the existence of the Rule of law
and regulations.
7.1.4 Type 3 Test: By-passing theConstraints
Slow judicial procedures (too many texts,
various interpretations) and problems in
implementing procedures and decisions
compel Moroccan firms to avoid using the
judicial system.
In the case of the financial sector, for
example, in order to bypass this constraint
of a slow judicial system, banks prefer to
insist on very high guarantees on loans
granted: 90% of loans granted by Moroccan
0
20
40
60
80
100
120
140
0 10 000 20 000 30 000 40 000
Prop
erty
rig
hts i
ndex
(100
= m
ore
righ
t)
GDP per capita, PPP (constant 2005 international $)
Figure 7.1.3: Property right index and GDPper capita
Source: World Governance Indicators, 2014
-2.0
-1.5
-1.0
-0.5
0.0
0.5
1.0
1.5
2.0
2.5
0 10 000 20 000 30 000 40 000
Rul
e of
Law
(2.5
= M
ore
righ
t)
GDP per capita, PPP (constant 2005 international $)
Figure 7.1.4: Rule of law and GDPper capita
Source: World Governance Indicators, 2014
61 This is a perception indicator on people’s trust in the society’s functioning rules, the protection of property rights,the police, the justice system, and the protection of citizens against acts of violence and criminal activities.

M O R O C C O ’ S G R OW T H D I A G N O S T I C172
banks are subject to guarantees (Figure
7.1.5). This rate is significantly higher than
those of the reference countries.
These guarantees, according to a World
Bank business survey (2006-2009),
average 171% of the loan amount
(Figure 7.1.6).
In a bid to bypass judicial system red
tape in Morocco and propose an
alternative method of settling disputes,
the new Law on Arbitration and
Mediation (national and international)62
was enacted in February 2008. This law
encourages the use of consensual dispute
settlement procedures, particularly in trade
arbitration. However, since its adoption,
trade arbitration is little used.
7.2 Land Tenure
7.2.1 Situation and Challenges
In Morocco, land remains a key
determinant of domestic and foreign
investment and land tenure plays a
predominant role in boosting economic
activity (See Annex 7.1).
Land ownership in Morocco is subject
to a dual system, due to the coexistence
of a "traditional" system governed by
Muslim law principles and local customs,
and a "modern" land registration system
(which dates back to the year 1913). The
latter system has legal, economic and
social benefits. However, because of
its optional nature, it is not sufficiently
widespread.
62 See sections 306 and the following ones of the Criminal Procedure Code (CPC).
51.1 60.4 65.1 75.5 83.690
0
20
40
60
80
100
Chi
le (2
010)
Mal
aysi
a (2
007)
Turk
ey (2
008)
Rom
ania
(200
9)
Indo
nesi
a (2
009)
Mor
occo
(200
7)
Perc
enta
ge
Figure 7.1.5: Proportion of loans requiringa guarantee
Source: World Bank Surveys
065
90122 128 171
210
0
40
80
120
160
200
240
Indo
nesi
a(2
009)
Mal
aysi
a(2
007)
Turk
ey(2
008)
Tuni
sia
(201
1)
Rom
ania
(200
9)
Mor
occo
(2
007)
Chi
le
(201
0)
Perc
enta
ge
Figure 7.1.6: Guarantee value necessaryfor a loan (percentage of loan amount)
Source: World Bank Surveys
173M O R O C C O ’ S G R O W T H D I A G N O S T I C
The predominance of the traditional system
has made land transactions very difficult.
Indeed, this system, characterized by lack of
transparency, does not guarantee transaction
security, hence the many disputes among
local residents and credit access difficulties.
Another land-related issue often raised
by Moroccan firms, is the excessive
diversity of land statutes, systems and
oversight authorities. Some land classified
as “agricultural land” cannot be subject
to commercial transactions (sale or lease)
outside its agricultural purpose63. In addition,
long and difficult negotiations and procedures
are required to change this system for
the purposes of developing an industrial
area.
Land access is a constraint which is
heavily dependent on land availability
in the regions attractive for investment.
Indeed, according to the Enterprise Survey
on the investment climate, this constraint is
more serious in regions such as Fez, Tangier,
Tetouan and Casablanca (Figure 7.2.1). In
Tangier and Tetouan, for instance, 62%
of firms consider land access as a major or
very binding constraint to their business.
This observation was confirmed during
Box 7.2.1: Typology of Public Land in Morocco
• State-owned public land is mainly under the oversight of the Ministry of Equipment,
Transport and Logistics although it may be occupied and managed by public
enterprises (such as transport enterprises) and local authorities;
• State-owned private land is under the oversight of the Department of State Lands at
the Ministry of Economy and Finance; this land may also be occupied and managed
by various public organizations;
• Forest land is also under the oversight of the Department of State Lands, but
managed by the High Commission for Water and Forests;
• “Habous” lands, under the oversight of the Ministry of Habous and Islamic Affairs;
• “Guich” land, under the oversight of the Ministry of Interior; and
• Collective lands, under the oversight of the Ministry of Interior.
63 World Bank, Ministry of Industry and Trade of Morocco, 2005.

M O R O C C O ’ S G R OW T H D I A G N O S T I C174
consultations with the private sector in the
various regions of Morocco as part of this
growth diagnostic. It is also observed that
firms occupying leased land seem to be
those that express the greatest need to
acquire it, probably because land can be
used as a guarantee for a bank loan.
This degree of difficulty also depends on
the firm’s size. Indeed, large firms (43%)
are most likely to consider land access as a
major or severe constraint to the expansion
of their activities (Table 7.2.1). This can be
explained by the fact that large and often
exporting firms are generally those most
often seeking to make extension plans and
ensure the growth of their activities. This
problem also arises for medium (37%) and
small (42%) firms.
In addition to the issue of industrial
land, Morocco faces a problem of
agricultural land. Indeed, land structures
in Morocco are characterized by excessive
fragmentation, their small size and the
significant joint ownership that characterizes
the majority of farms, in addition to the
multiplicity of land statutes. More than 70%
of farms have surface areas below 5 ha
and are composed on average of 6.4 plots,
which, to a certain extent, explains low
plot yields in terms of production. This
situation would appear to persist despite
the special attention paid by the Moroccan
Authorities to agricultural land especially
at the legislative level.
35.8
61.9
49.1
8
010203040506070
Rabat/Casablanca Tanger / Tetouan Fez Settat
Major or severe obstacle Medium obstacle
Minor obstacle No obstacle
Figure 7.2.1: Level of land access difficultyby region
Source: Enterprise Survey (2007), World Bank
Table 7.2.1: Level of land access difficultyby business size
Source: Enterprise Survey (2007), World Bank
Not anobstacle
Minorobstacle
Averageobstacle
Major orverysevereobstacle
Small >=5and <=19
35 11 13 42
Medium =20and <=99
31 13 20 37
Big >=100 23 16 18 43

175M O R O C C O ’ S G R O W T H D I A G N O S T I C
7.2.2 High Cost and Perception ofFirms
For Moroccan firms, access to industrial
land is very difficult and constitutes a
major constraint to the development
of their activities. Thus, according to the
World Bank Enterprise Survey (2007), more
than 40% of Moroccan firms consider land
access as a major or very severe obstacle
(Figure 7.2.2). Morocco comes first in
terms of level of dissatisfaction compared
to the reference countries: in Romania
and Turkey, this rate is only 9% and 7%
respectively.
Even when compared to a larger group
of countries using the results of surveys
on the investment climate, Morocco has
the highest rate (Figure 7.2.3).
Despite the difficult access to industrial
land, the prices of this land are not
particularly high and remain lower than
those of land reserved for the construction
of property. In 2011, the price per square
metre of industrial land (MAD 1,243) was
lower than the price per square metre for
land reserved for property construction
(MAD 1,758) and the prices of industrial
land evolve less rapidly than those of land
intended for construction (Figure 7.2.4).
These relatively low price levels can be
explained by the fact that land availability for
industry in Morocco is dominated by public
land that the Government sells at subsidized
prices. The private market for vast land
surfaces exists but it is small in size. This
dual market for industrial land, characteristic
of Morocco, led to a situation whereby the
country did not supply land that meets the
29.1
13.317.2
40.3
0
10
20
30
40
50
Noobstacle
Minorobstacle
Mediumobstacle
Major or severeobstacle
Perc
enta
ge
Figure 7.2.2: Level of land accessdifficulty (Morocco 2007)
Source: Enterprise Survey (2007), World Bank
05
1015202530354045
Cro
atia
Geo
rgia
Hun
gary
Cam
bodi
aL
atvi
aSl
oven
iaE
ston
iaPo
land
Aze
rbai
jan
Uzb
ekis
tan
Bul
gari
aC
zech
Yu
gosl
avia
Turk
eyR
oman
iaR
ussi
aPe
ruH
ondu
ras
Bel
arus
Chi
naM
oldo
vaA
lban
iaN
icar
agua
Bra
zil
Ken
yaTa
nzan
iaO
man
Ban
glad
esh
Mor
occo
Perc
enta
ge o
f fir
ms
Figure 7.2.3: Industrial land accessconstraint: international comparisons
Source: Surveys on the investment climate, various countries

M O R O C C O ’ S G R O W T H D I A G N O S T I C176
needs of industrial development. During
consultations with the private sector and the
Government of Morocco, several potential
reasons were given to explain the reasons
for this problem of the mismatch between
the quality of industrial land and the
needs of firms. These are due mainly to
land development decisions64 and the
configuration and/or location of areas that do
not match the real needs of investors65, the
land administration’s weak capacity and
lack of coordination.
For agricultural land, low crop yields are
indicative of the fact that land tenure
is an obstacle to investment. Indeed, a
comparison of the yields of agricultural
land in terms of cereal production67 (Figure
7.2.5) between Morocco and the comparator
countries shows that the productivity of
agricultural plots remained low in Morocco
over the 1961-2012 period.
The low level of investment linked to
agricultural land in Morocco is limited
by land insecurity in the rural areas
as well as issues of joint ownership
and fragmentation68. Land insecurity in
rural areas in Morocco has often been
exacerbated by the low level of registration,
64 Real needs for industrial development include water access, electricity access, telephone network access,provision of security services, etc. 65 Configuration refers to the physical characteristics of the developed land (including location). 66 Real estate prices are not included in this comparison because real estate can also be an industrial or commercialand residential asset. 67 It should be noted that cereal farming occupies more than 70% of arable land. Morocco is a cereal-producingcountry, whereas it has comparative advantage in olive production which takes 5 to 7 years to reach maturity andrequires heavy investments (plantation projects). 68 World Bank, 2007. Lazarev 2012, Consultations with the private sector and the Government 2014.
0
500
1000
1500
2000
2500
3000
1980 1983 1986 1989 1992 1995 1998 2001 2004 2007 2010
In d
irha
m
Villas Industry and trade Administration
Figure 7.2.4: Trend of prices per squaremeter66
Source: HCP 2013
010002000300040005000600070008000
1961
1963
1965
1967
1969
1971
1973
1975
1977
1979
1981
1983
1985
1987
1989
1991
1993
1995
1997
1999
2001
2003
2005
2007
2009
2011
2013
Chile Indonesia Malaysia MoroccoRomania Tunisia Turkey
Figure 7.2.5: Cereal yields in Morocco(1961-2012)
Source: Development Indicators, World Bank
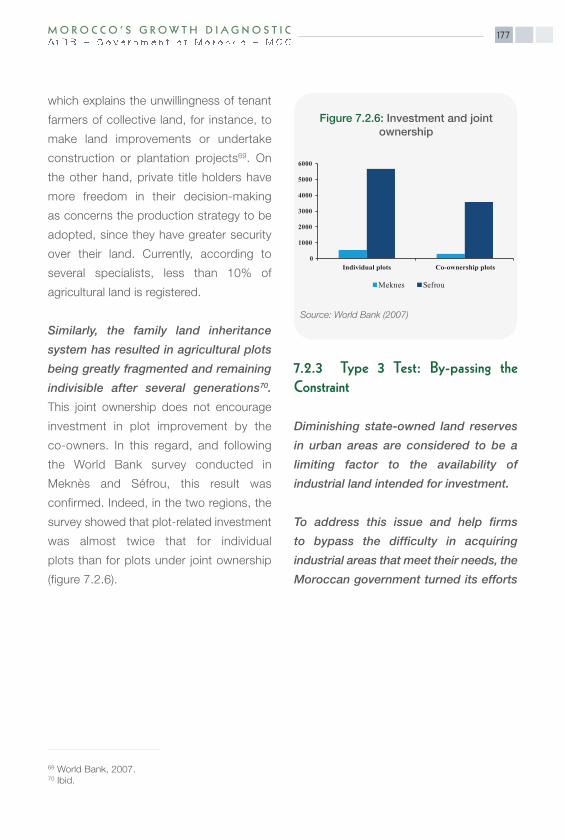
177M O R O C C O ’ S G R OW T H D I A G N O S T I C
which explains the unwillingness of tenant
farmers of collective land, for instance, to
make land improvements or undertake
construction or plantation projects69. On
the other hand, private title holders have
more freedom in their decision-making
as concerns the production strategy to be
adopted, since they have greater security
over their land. Currently, according to
several specialists, less than 10% of
agricultural land is registered.
Similarly, the family land inheritance
system has resulted in agricultural plots
being greatly fragmented and remaining
indivisible after several generations70.
This joint ownership does not encourage
investment in plot improvement by the
co-owners. In this regard, and following
the World Bank survey conducted in
Meknès and Séfrou, this result was
confirmed. Indeed, in the two regions, the
survey showed that plot-related investment
was almost twice that for individual
plots than for plots under joint ownership
(figure 7.2.6).
7.2.3 Type 3 Test: By-passing theConstraint
Diminishing state-owned land reserves
in urban areas are considered to be a
limiting factor to the availability of
industrial land intended for investment.
To address this issue and help firms
to bypass the difficulty in acquiring
industrial areas that meet their needs, the
Moroccan government turned its efforts
69 World Bank, 2007.70 Ibid.
0
1000
2000
3000
4000
5000
6000
Individual plots Co-ownership plots
Meknes Sefrou
Figure 7.2.6: Investment and jointownership
Source: World Bank (2007)
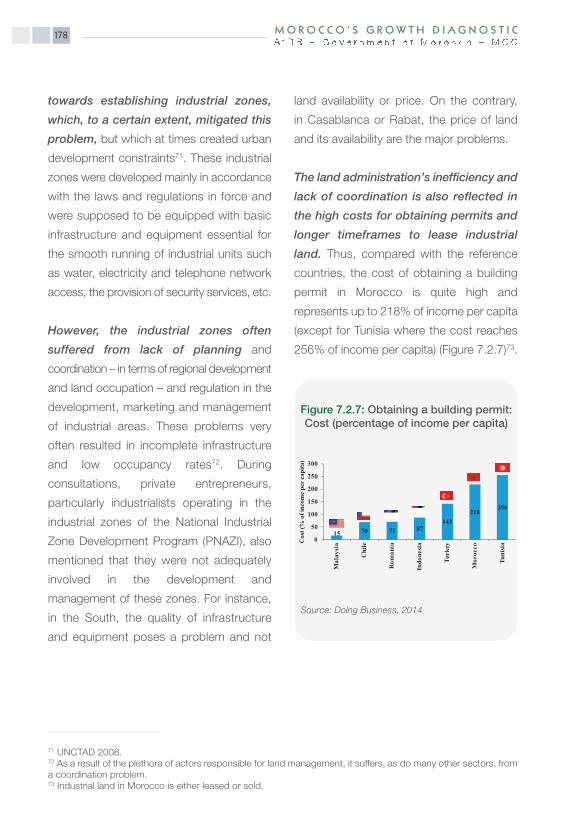
M O R O C C O ’ S G R OW T H D I A G N O S T I C178
towards establishing industrial zones,
which, to a certain extent, mitigated this
problem, but which at times created urban
development constraints71. These industrial
zones were developed mainly in accordance
with the laws and regulations in force and
were supposed to be equipped with basic
infrastructure and equipment essential for
the smooth running of industrial units such
as water, electricity and telephone network
access, the provision of security services, etc.
However, the industrial zones often
suffered from lack of planning and
coordination – in terms of regional development
and land occupation – and regulation in the
development, marketing and management
of industrial areas. These problems very
often resulted in incomplete infrastructure
and low occupancy rates72. During
consultations, private entrepreneurs,
particularly industrialists operating in the
industrial zones of the National Industrial
Zone Development Program (PNAZI), also
mentioned that they were not adequately
involved in the development and
management of these zones. For instance,
in the South, the quality of infrastructure
and equipment poses a problem and not
land availability or price. On the contrary,
in Casablanca or Rabat, the price of land
and its availability are the major problems.
The land administration’s inefficiency and
lack of coordination is also reflected in
the high costs for obtaining permits and
longer timeframes to lease industrial
land. Thus, compared with the reference
countries, the cost of obtaining a building
permit in Morocco is quite high and
represents up to 218% of income per capita
(except for Tunisia where the cost reaches
256% of income per capita) (Figure 7.2.7)73.
71 UNCTAD 2008.72 As a result of the plethora of actors responsible for land management, it suffers, as do many other sectors, froma coordination problem.73 Industrial land in Morocco is either leased or sold.
15 70 71 87143
218256
0
50
100
150
200
250
300
Mal
aysi
a
Chi
le
Rom
ania
Indo
nesi
a
Turk
ey
Mor
occo
Tuni
siaC
ost (
% o
f inc
ome
per
capi
ta)
Figure 7.2.7: Obtaining a building permit:Cost (percentage of income per capita)
Source: Doing Business, 2014
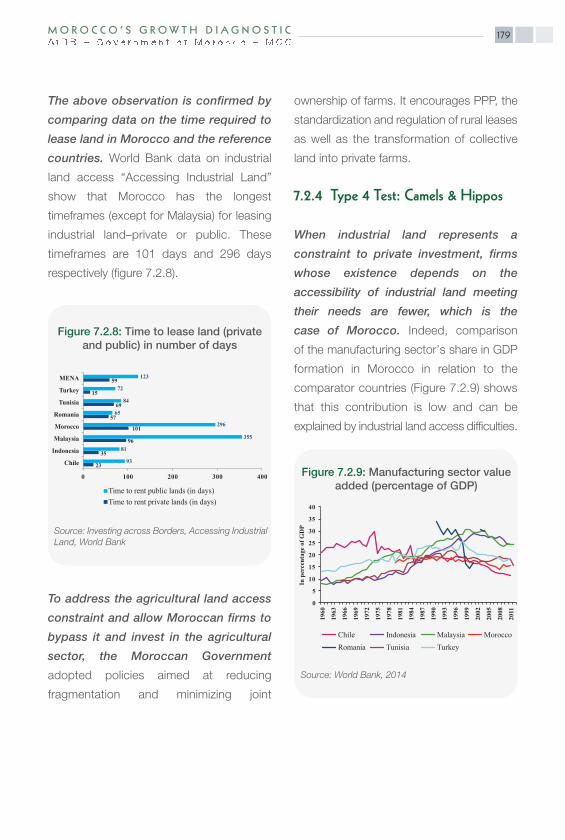
179M O R O C C O ’ S G R O W T H D I A G N O S T I C
The above observation is confirmed by
comparing data on the time required to
lease land in Morocco and the reference
countries. World Bank data on industrial
land access “Accessing Industrial Land”
show that Morocco has the longest
timeframes (except for Malaysia) for leasing
industrial land–private or public. These
timeframes are 101 days and 296 days
respectively (figure 7.2.8).
To address the agricultural land access
constraint and allow Moroccan firms to
bypass it and invest in the agricultural
sector, the Moroccan Government
adopted policies aimed at reducing
fragmentation and minimizing joint
ownership of farms. It encourages PPP, the
standardization and regulation of rural leases
as well as the transformation of collective
land into private farms.
7.2.4 Type 4 Test: Camels & Hippos
When industrial land represents a
constraint to private investment, firms
whose existence depends on the
accessibility of industrial land meeting
their needs are fewer, which is the
case of Morocco. Indeed, comparison
of the manufacturing sector’s share in GDP
formation in Morocco in relation to the
comparator countries (Figure 7.2.9) shows
that this contribution is low and can be
explained by industrial land access difficulties.
23
35
96
101
57
69
15
59
93
81
355
296
65
84
72
123
0 100 200 300 400
Chile
Indonesia
Malaysia
Morocco
Romania
Tunisia
Turkey
MENA
Time to rent public lands (in days)Time to rent private lands (in days)
Figure 7.2.8: Time to lease land (privateand public) in number of days
Source: Investing across Borders, Accessing IndustrialLand, World Bank
0
5
10
15
20
25
30
35
40
1960
1963
1966
1969
1972
1975
1978
1981
1984
1987
1990
1993
1996
1999
2002
2005
2008
2011
In p
erce
ntag
e of
GD
P
Chile Indonesia Malaysia MoroccoRomania Tunisia Turkey
Figure 7.2.9: Manufacturing sector valueadded (percentage of GDP)
Source: World Bank, 2014
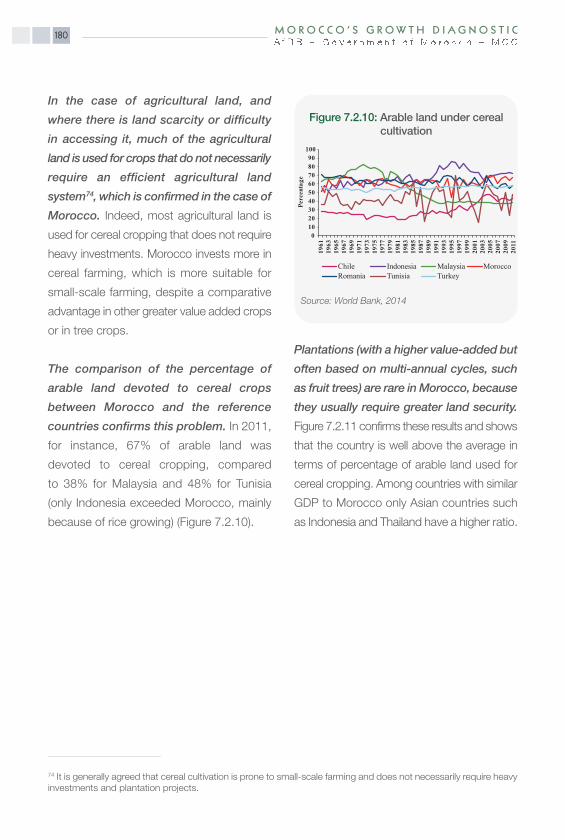
M O R O C C O ’ S G R OW T H D I A G N O S T I C180
In the case of agricultural land, and
where there is land scarcity or difficulty
in accessing it, much of the agricultural
land is used for crops that do not necessarily
require an efficient agricultural land
system74, which is confirmed in the case of
Morocco. Indeed, most agricultural land is
used for cereal cropping that does not require
heavy investments. Morocco invests more in
cereal farming, which is more suitable for
small-scale farming, despite a comparative
advantage in other greater value added crops
or in tree crops.
The comparison of the percentage of
arable land devoted to cereal crops
between Morocco and the reference
countries confirms this problem. In 2011,
for instance, 67% of arable land was
devoted to cereal cropping, compared
to 38% for Malaysia and 48% for Tunisia
(only Indonesia exceeded Morocco, mainly
because of rice growing) (Figure 7.2.10).
Plantations (with a higher value-added but
often based on multi-annual cycles, such
as fruit trees) are rare in Morocco, because
they usually require greater land security.
Figure 7.2.11 confirms these results and shows
that the country is well above the average in
terms of percentage of arable land used for
cereal cropping. Among countries with similar
GDP to Morocco only Asian countries such
as Indonesia and Thailand have a higher ratio.
74 It is generally agreed that cereal cultivation is prone to small-scale farming and does not necessarily require heavyinvestments and plantation projects.
0102030405060708090
100
1961
1963
1965
1967
1969
1971
1973
1975
1977
1979
1981
1983
1985
1987
1989
1991
1993
1995
1997
1999
2001
2003
2005
2007
2009
2011
Perc
enta
ge
Chile Indonesia Malaysia MoroccoRomania Tunisia Turkey
Figure 7.2.10: Arable land under cerealcultivation
Source: World Bank, 2014
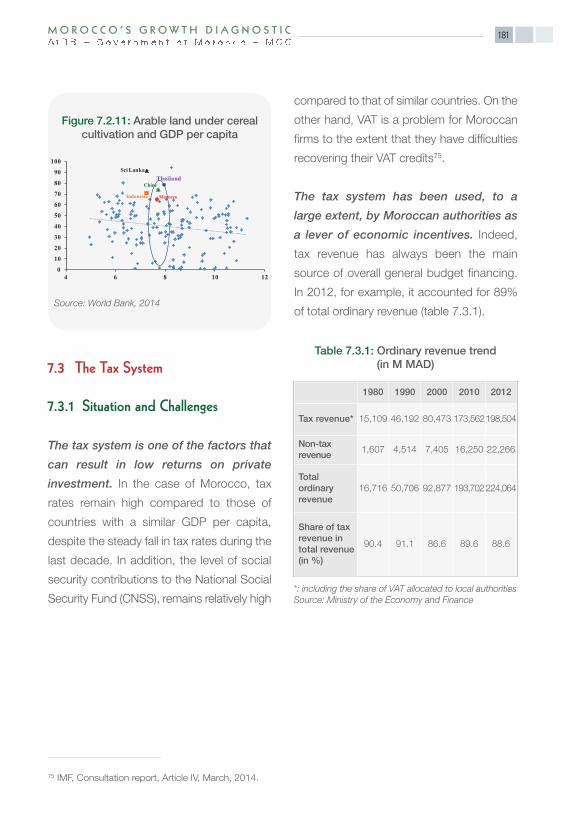
181M O R O C C O ’ S G R OW T H D I A G N O S T I C
7.3 The Tax System
7.3.1 Situation and Challenges
The tax system is one of the factors that
can result in low returns on private
investment. In the case of Morocco, tax
rates remain high compared to those of
countries with a similar GDP per capita,
despite the steady fall in tax rates during the
last decade. In addition, the level of social
security contributions to the National Social
Security Fund (CNSS), remains relatively high
compared to that of similar countries. On the
other hand, VAT is a problem for Moroccan
firms to the extent that they have difficulties
recovering their VAT credits75.
The tax system has been used, to a
large extent, by Moroccan authorities as
a lever of economic incentives. Indeed,
tax revenue has always been the main
source of overall general budget financing.
In 2012, for example, it accounted for 89%
of total ordinary revenue (table 7.3.1).
Thailand
Morocco
Chine
Indonesia
Sri Lanka
0
10
20
30
40
50
60
70
80
90
100
4 6 8 10 12
Figure 7.2.11: Arable land under cereal cultivation and GDP per capita
Source: World Bank, 2014
75 IMF, Consultation report, Article IV, March, 2014.
1980 1990 2000 2010 2012
Tax revenue* 15,109 46,192 80,473 173,562198,504
Non-tax revenue
1,607 4,514 7,405 16,250 22,266
Total ordinary revenue
16,716 50,706 92,877 193,702224,064
Share of taxrevenue intotal revenue(in %)
90.4 91.1 86.6 89.6 88.6
Table 7.3.1: Ordinary revenue trend(in M MAD)
*: including the share of VAT allocated to local authoritiesSource: Ministry of the Economy and Finance

M O R O C C O ’ S G R OW T H D I A G N O S T I C182
In this regard, tax revenue as a percentage
of GDP increased steadily from 16.4% in
1980 to 23.7% in 2012 (Figure 7.3.1). This
revenue was relatively high compared to
countries with the same level of GDP
per capita.
In 2012, three-quarters of Morocco’s
tax revenue came from three sources,
namely: VAT, income tax (IT), and
corporation tax (CT). Other major sources
of revenue are domestic consumption taxes
and customs duties (Figure 7.3.2).
The tax burden is not spread evenly
among economic agents in Morocco:
the weight of CT is borne by a minority
of firms and IT is mainly calculated on
the basis of formal sector wages. In this
regard, according to the report “The
Moroccan Taxation System, Economic
Development and Social cohesion” by
the Economic, Social and Environmental
Council, 82% of CT revenue comes from
the profits of 2% of companies, and 73%
of IT revenue is deducted from public
and private sector wage earners. The low
22%
16%
5%38%
4%
7%
6%
2%Corporate taxes
Taxes on income
Tariffs on imports
VAT
Tobacco taxes
Taxes on petroleum products
License fees
Others
Figure 7.3.2: Tax revenue by source(2012)
Source: Ministry of the Economy and Finance
0
5
10
15
20
25
30
35
40
0 10 000 20 000 30 000 40 000 50 000 60 000 70 000 80 000
Tax
reve
nue
(% G
DP)
GDP per capita (US $ PPP)
Figure 7.3.1: Tax revenue (in percentage ofGDP) relative to GDP per capita
(PPA, $ international)
Source: Development Indicators, World Bank

183M O R O C C O ’ S G R OW T H D I A G N O S T I C
contribution of non-salaried physical
persons (traders, entrepreneurs operating
privately, liberal professions) should also be
noted76.
In practice, Moroccan taxation has been
undergoing an ongoing reform process
since the mid-eighties. These reforms have
been undertaken with a view to enhancing
efficiency and improving harmonization
with international standards. The main
objective of these reforms is to develop a
modern, coherent, efficient and fair taxation
system.
Tax reforms were also carried out to
encourage the taxation of the informal
economy and ensure the transition of
firms into the formal sector. In this regard,
the budget bill for the 2011 fiscal year
provided for a 15% CT rate for the Very
Small Enterprise (VSE) whose turnover
before tax was below MAD 2 M. In 2013,
this rate dropped to 10% for firms with
taxable income below or equal to MAD
300,000. Reforms were also undertaken
to modernize the tax administration and
the quality of its services.
Despite this reform process, the
objectives have not been achieved and
the tax system has lost transparency. The
many reforms have resulted in differences in
the interpretation of tax revision provisions
between the administration and economic
operators. These ongoing reforms have
made taxation a very complex tool for
private investors who have often criticized
it and considered it as an obstacle to the
expansion of their activities. A general
reform is underway, following the National
Tax Conference organized in 2013.
76 Economic, Social and Environmental Council, 2012.
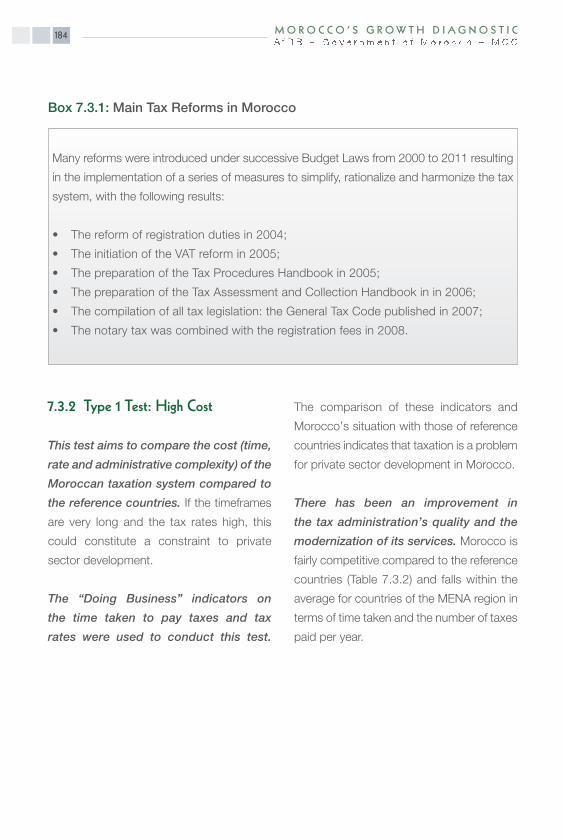
M O R O C C O ’ S G R OW T H D I A G N O S T I C184
7.3.2 Type 1 Test: High Cost
This test aims to compare the cost (time,
rate and administrative complexity) of the
Moroccan taxation system compared to
the reference countries. If the timeframes
are very long and the tax rates high, this
could constitute a constraint to private
sector development.
The “Doing Business” indicators on
the time taken to pay taxes and tax
rates were used to conduct this test.
The comparison of these indicators and
Morocco’s situation with those of reference
countries indicates that taxation is a problem
for private sector development in Morocco.
There has been an improvement in
the tax administration’s quality and the
modernization of its services. Morocco is
fairly competitive compared to the reference
countries (Table 7.3.2) and falls within the
average for countries of the MENA region in
terms of time taken and the number of taxes
paid per year.
Box 7.3.1: Main Tax Reforms in Morocco
Many reforms were introduced under successive Budget Laws from 2000 to 2011 resulting
in the implementation of a series of measures to simplify, rationalize and harmonize the tax
system, with the following results:
• The reform of registration duties in 2004;
• The initiation of the VAT reform in 2005;
• The preparation of the Tax Procedures Handbook in 2005;
• The preparation of the Tax Assessment and Collection Handbook in in 2006;
• The compilation of all tax legislation: the General Tax Code published in 2007;
• The notary tax was combined with the registration fees in 2008.

185M O R O C C O ’ S G R OW T H D I A G N O S T I C
The reforms carried out have modernized
the tax administration and simplified
procedures and shortened tax payment
time frames. Only 17% of Moroccan firms
feel that relations with the tax administration
are constraining (major or very severe
constraint; Figure 7.3.3). According to
Moroccan firms, payment procedures and
time frames, and relations with the tax
administration do not constitute an obstacle.
Despite the efforts made to reduce tax
rates, firms operating in the formal sector
still consider these rates as relatively
high and constraining on the expansion
of their activities. In this regard, and with
the objective of reducing the tax burden on
the firm, there were several downward
revisions of the CT rate. This rate, which was
set at 45% in 1987, was cut several times77,
falling to 30% from 2008. In addition, the CT
rate applied to credit establishments and
similar organizations was cut from 39.6% to
37% from 2008.
This observation is confirmed by the
recent “Doing Business 2013” report
which compares taxes on profits, income
taxes and other taxes as a percentage of
business profits. Thus, as shown in Figure
7.3.4, despite the reduction in taxes on
profits from 35% to 30% in 2008, they
remain very high in Morocco in comparison
with other countries.
77 Decreasing to 44% in 1988, 38% in 1993, 36% in 1994 and 35% in 1996.
MENA Chile Indonesia Malaysia Morocco Romania Tunisia Turkey
Payments (numberper year)
19 6 51 13 17 41 8 15
Time-limit (hours peryear)
184 291 259 133 238 216 144 223
Table 7.3.2: Tax payment: Time (hours per year) and number (per year), Morocco and comparable countries
Source: Doing Business, 2013
34.228.2
20.6
11.6
5.40
5
10
15
20
25
30
35
40
Noobstacle
Minorobstacle
Mediumobstacle
Majorobstacle
Severeobstacle
Figure 7.3.3: Level of difficulty representedby relations with the tax administration
for business operations
Source: Enterprise Survey, World Bank

M O R O C C O ’ S G R OW T H D I A G N O S T I C186
That also applies to labor taxes and
social security contributions (Figure 7.3.5).
It should be noted that the comparison of
tax rates in Morocco with those applied in
the other countries of the sample does
not take into account the effort made
in tax expenditure which, in Morocco,
accounted for 4.1% of GDP in 2012,
whereas it only accounts for 1.4% in Turkey
(2007) and 3.6% in Chile (2012).
During the World Bank survey on the
business climate, 55.8% of Moroccan
firms considered that tax rates were high
in Morocco and that informal activities were
unfair competition against them (figure 7. 3.6).
This rate is high in relation to the comparator
countries: 30% in Tunisia, 19% for Turkey,
25% for Malaysia and 16% for Chile.
Furthermore, 63% of firms operating on
the local market and 55% of partially
exporting firms consider tax rates as a
major or very severe constraint (Table
7.3.3). This problem arises, to a lesser
extent, for exporting firms (only 38%),
which is explained by the tax incentives
that they enjoy.
0
10
20
30
40
50
60
70
0 10 000 20 000 30 000 40 000 50 000 60 000 70 000 80 000
Figure 7.3.4: Taxes on profits relativeto GDP per capita (2012)
Source: Doing Business, 2013
0
10
20
30
40
50
60
0 10 000 20 000 30 000 40 000 50 000 60 000 70 000 80 000
Figure 7.3.5: Labour taxation and welfarecosts (percentage profit) vs GDP
per capita (2012)
Source: Doing Business, 2013
7.4
18.1 18.830.8 25.0
0
5
10
15
20
25
30
35
Noobstacle
Minorobstacle
Mediumobstacle
Majorobstacle
Severeobstacle
Perc
enta
geFigure 7.3.6: Level of difficulty
represented by the tax rate for businessoperations
Source: Enterprise Survey, World Bank
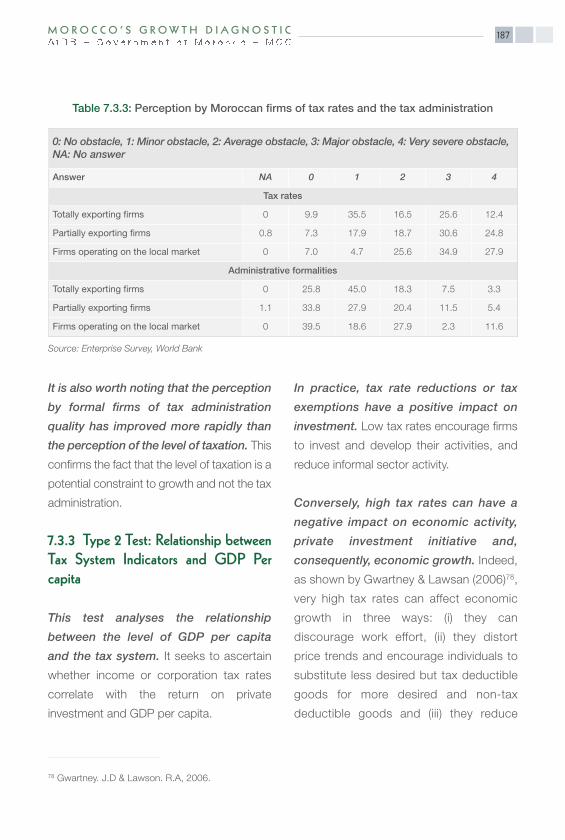
187M O R O C C O ’ S G R OW T H D I A G N O S T I C
It is also worth noting that the perception
by formal firms of tax administration
quality has improved more rapidly than
the perception of the level of taxation. This
confirms the fact that the level of taxation is a
potential constraint to growth and not the tax
administration.
7.3.3 Type 2 Test: Relationship betweenTax System Indicators and GDP Percapita
This test analyses the relationship
between the level of GDP per capita
and the tax system. It seeks to ascertain
whether income or corporation tax rates
correlate with the return on private
investment and GDP per capita.
In practice, tax rate reductions or tax
exemptions have a positive impact on
investment. Low tax rates encourage firms
to invest and develop their activities, and
reduce informal sector activity.
Conversely, high tax rates can have a
negative impact on economic activity,
private investment initiative and,
consequently, economic growth. Indeed,
as shown by Gwartney & Lawsan (2006)78,
very high tax rates can affect economic
growth in three ways: (i) they can
discourage work effort, (ii) they distort
price trends and encourage individuals to
substitute less desired but tax deductible
goods for more desired and non-tax
deductible goods and (iii) they reduce
0: No obstacle, 1: Minor obstacle, 2: Average obstacle, 3: Major obstacle, 4: Very severe obstacle,NA: No answer
Answer NA 0 1 2 3 4
Tax rates
Totally exporting firms 0 9.9 35.5 16.5 25.6 12.4
Partially exporting firms 0.8 7.3 17.9 18.7 30.6 24.8
Firms operating on the local market 0 7.0 4.7 25.6 34.9 27.9
Administrative formalities
Totally exporting firms 0 25.8 45.0 18.3 7.5 3.3
Partially exporting firms 1.1 33.8 27.9 20.4 11.5 5.4
Firms operating on the local market 0 39.5 18.6 27.9 2.3 11.6
Table 7.3.3: Perception by Moroccan firms of tax rates and the tax administration
Source: Enterprise Survey, World Bank
78 Gwartney. J.D & Lawson. R.A, 2006.

M O R O C C O ’ S G R OW T H D I A G N O S T I C188
private initiatives and the willingness to
invest in physical and human capital. In
the case of Morocco, there is a negative
relationship between tax rates and GDP
per capita (Figure 7.3.7).
In order to prevent the flight of certain
firms (particularly small ones) into
informal activities and encourage
taxation of the informal economy,
Moroccan authorities have, since 2005,
embarked on a new wave of tax reforms
for SMEs, aimed at making VAT a central
tax of Moroccan taxation and curtailing the
informal sector which is developing at the
expense of the formal sector.
7.3.4 Type 3 Test: By-passing the Constraint
The aim of this test is to determine how
firms avoid taxation. In practice, to avoid
this problem, firms turn partially or totally
towards activities that benefit from exemptions
or a special tax regime or even towards
the informal sector.
Indeed, in developing countries, this
problem of the high cost of the tax
system is often accompanied by a highly
developed informal sector. Thus, firms
prefer to operate informally or carry out
certain informal activities in order to avoid
paying a tax that they deem too high.
Despite implementation of the different
reforms, they have not produced the
expected positive impact since the
informal sector has continued to penalize
formal activities (Figure 7.3.8).
2001
2002
20092010
20082006
20042003
2005
2007
2.22.85
Ln (GDP per capita, PPP constant 2005 international $)
Ln (M
argin
al Ta
x Rat
es)
2.9 2.95 3 3.05 3.1 3.15 3.2 3.25 3.3
2.32.42.52.62.72.82.9
3
Figure 7.3.7: Relationship between taxrates and GDP per capita in Morocco
Source: HCP Maroc & Economic freedom of the World
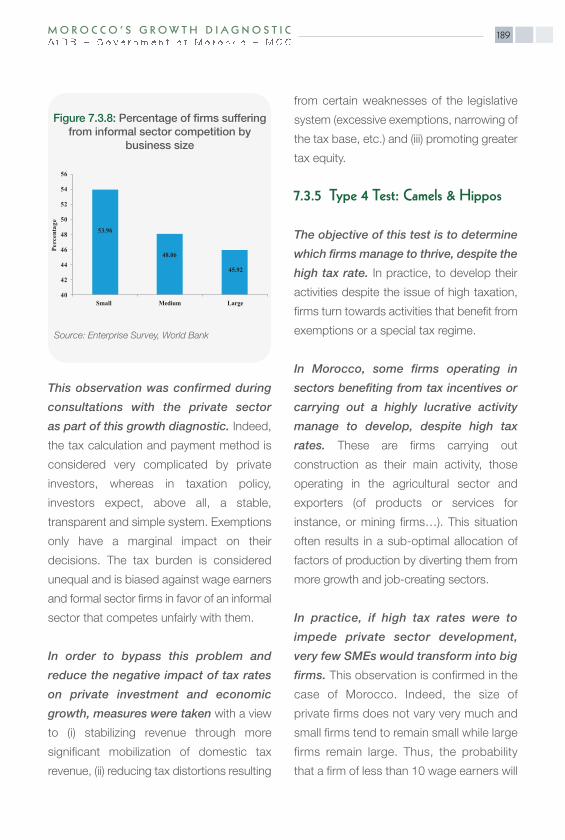
189M O R O C C O ’ S G R OW T H D I A G N O S T I C
This observation was confirmed during
consultations with the private sector
as part of this growth diagnostic. Indeed,
the tax calculation and payment method is
considered very complicated by private
investors, whereas in taxation policy,
investors expect, above all, a stable,
transparent and simple system. Exemptions
only have a marginal impact on their
decisions. The tax burden is considered
unequal and is biased against wage earners
and formal sector firms in favor of an informal
sector that competes unfairly with them.
In order to bypass this problem and
reduce the negative impact of tax rates
on private investment and economic
growth, measures were taken with a view
to (i) stabilizing revenue through more
significant mobilization of domestic tax
revenue, (ii) reducing tax distortions resulting
from certain weaknesses of the legislative
system (excessive exemptions, narrowing of
the tax base, etc.) and (iii) promoting greater
tax equity.
7.3.5 Type 4 Test: Camels & Hippos
The objective of this test is to determine
which firms manage to thrive, despite the
high tax rate. In practice, to develop their
activities despite the issue of high taxation,
firms turn towards activities that benefit from
exemptions or a special tax regime.
In Morocco, some firms operating in
sectors benefiting from tax incentives or
carrying out a highly lucrative activity
manage to develop, despite high tax
rates. These are firms carrying out
construction as their main activity, those
operating in the agricultural sector and
exporters (of products or services for
instance, or mining firms…). This situation
often results in a sub-optimal allocation of
factors of production by diverting them from
more growth and job-creating sectors.
In practice, if high tax rates were to
impede private sector development,
very few SMEs would transform into big
firms. This observation is confirmed in the
case of Morocco. Indeed, the size of
private firms does not vary very much and
small firms tend to remain small while large
firms remain large. Thus, the probability
that a firm of less than 10 wage earners will
53.96
48.06
45.92
40
42
44
46
48
50
52
54
56
Small Medium Large
Perc
enta
ge
Figure 7.3.8: Percentage of firms sufferingfrom informal sector competition by
business size
Source: Enterprise Survey, World Bank

M O R O C C O ’ S G R OW T H D I A G N O S T I C190
have more than 100 of them after 5 years is
0.4% (Table 7.3.479). Only 24% of firms with
fewer than 5 wage earners increased their
staffing over a 5-year period.
The analysis of the relationship between
the tax ratio in relation to the size of the
informal economy and GDP per capita,
shows that firms resisting this constraint
are generally those engaged in informal
activities (partially or totally) (Figure 7.3.9).
7.3.6 Second-Round Effects
Tax rates are considered high and
constraining for private sector development
in Morocco and the easing of this
constraint could have very significant
macroeconomic risks. Indeed, tax revenue
constitutes the most important share of
Moroccan Government revenue (averaging
90% in recent years). A cut in tax rates could
reduce tax revenue and impact on the
macroeconomic balances.
79 See section 7.4, the labour market, for more details.
Table 7.3.4: Transition matrix relativeto business size
Source: World Bank
Size Exit [0-5] [6,10] [11,20]
[0-5] 37.88 38.24 16.56 5.4
[6,10] 30.35 14.61 36.11 13.07
[11,20] 29.83 4.9 15.56 28.67
[21,50] 28.78 1.28 4.37 11.11
[51,100] 29.96 1.21 0 2.43
> 100 26.61 0.81 0.81 0.4
Size [21.50] [51.100] > 100
[0-5] 1.65 0.18 0.09
[6,10] 5.04 0.51 0.31
[11,20] 16.28 3.46 1.3
[21,50] 33.7 14.75 6.01
[51,100] 8.5 33.2 24.7
> 100 4.44 8.87 58.06
0
0.2
0.4
0.6
0.8
1
1.2
1.4
1.6
1.8
2.7 3.2 3.7 4.2 4.7
Fisc
al p
ress
ure
ratio
/ wei
ght o
f the
info
rmal
eco
nom
y
Log GDP per capita in USD PPP in 2005
Figure 7.3.9: Correlation between tax burden ratio and weight of the informal
economy
Source: World Bank
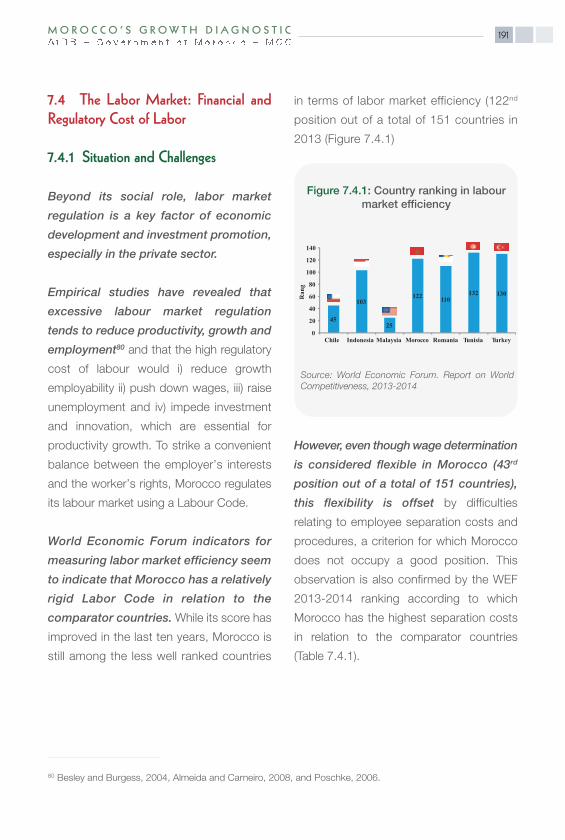
191M O R O C C O ’ S G R OW T H D I A G N O S T I C
7.4 The Labor Market: Financial andRegulatory Cost of Labor
7.4.1 Situation and Challenges
Beyond its social role, labor market
regulation is a key factor of economic
development and investment promotion,
especially in the private sector.
Empirical studies have revealed that
excessive labour market regulation
tends to reduce productivity, growth and
employment80 and that the high regulatory
cost of labour would i) reduce growth
employability ii) push down wages, iii) raise
unemployment and iv) impede investment
and innovation, which are essential for
productivity growth. To strike a convenient
balance between the employer’s interests
and the worker’s rights, Morocco regulates
its labour market using a Labour Code.
World Economic Forum indicators for
measuring labor market efficiency seem
to indicate that Morocco has a relatively
rigid Labor Code in relation to the
comparator countries. While its score has
improved in the last ten years, Morocco is
still among the less well ranked countries
in terms of labor market efficiency (122nd
position out of a total of 151 countries in
2013 (Figure 7.4.1)
However, even though wage determination
is considered flexible in Morocco (43rd
position out of a total of 151 countries),
this flexibility is offset by difficulties
relating to employee separation costs and
procedures, a criterion for which Morocco
does not occupy a good position. This
observation is also confirmed by the WEF
2013-2014 ranking according to which
Morocco has the highest separation costs
in relation to the comparator countries
(Table 7.4.1).
80 Besley and Burgess, 2004, Almeida and Carneiro, 2008, and Poschke, 2006.
45
103
25
122 110 132 130
0
20
40
60
80
100
120
140
Chile Indonesia Malaysia Morocco Romania Tunisia Turkey
Ran
g
Figure 7.4.1: Country ranking in labourmarket efficiency
Source: World Economic Forum. Report on WorldCompetitiveness, 2013-2014
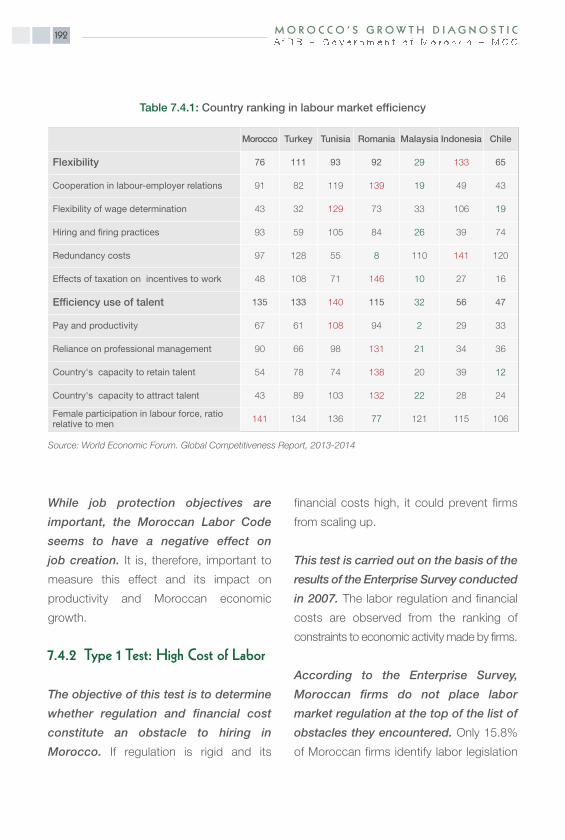
M O R O C C O ’ S G R OW T H D I A G N O S T I C192
While job protection objectives are
important, the Moroccan Labor Code
seems to have a negative effect on
job creation. It is, therefore, important to
measure this effect and its impact on
productivity and Moroccan economic
growth.
7.4.2 Type 1 Test: High Cost of Labor
The objective of this test is to determine
whether regulation and financial cost
constitute an obstacle to hiring in
Morocco. If regulation is rigid and its
financial costs high, it could prevent firms
from scaling up.
This test is carried out on the basis of the
results of the Enterprise Survey conducted
in 2007. The labor regulation and financial
costs are observed from the ranking of
constraints to economic activity made by firms.
According to the Enterprise Survey,
Moroccan firms do not place labor
market regulation at the top of the list of
obstacles they encountered. Only 15.8%
of Moroccan firms identify labor legislation
Morocco Turkey Tunisia Romania Malaysia Indonesia Chile
Flexibility 76 111 93 92 29 133 65
Cooperation in labour-employer relations 91 82 119 139 19 49 43
Flexibility of wage determination 43 32 129 73 33 106 19
Hiring and firing practices 93 59 105 84 26 39 74
Redundancy costs 97 128 55 8 110 141 120
Effects of taxation on incentives to work 48 108 71 146 10 27 16
Efficiency use of talent 135 133 140 115 32 56 47
Pay and productivity 67 61 108 94 2 29 33
Reliance on professional management 90 66 98 131 21 34 36
Country's capacity to retain talent 54 78 74 138 20 39 12
Country's capacity to attract talent 43 89 103 132 22 28 24
Female participation in labour force, ratiorelative to men 141 134 136 77 121 115 106
Table 7.4.1: Country ranking in labour market efficiency
Source: World Economic Forum. Global Competitiveness Report, 2013-2014
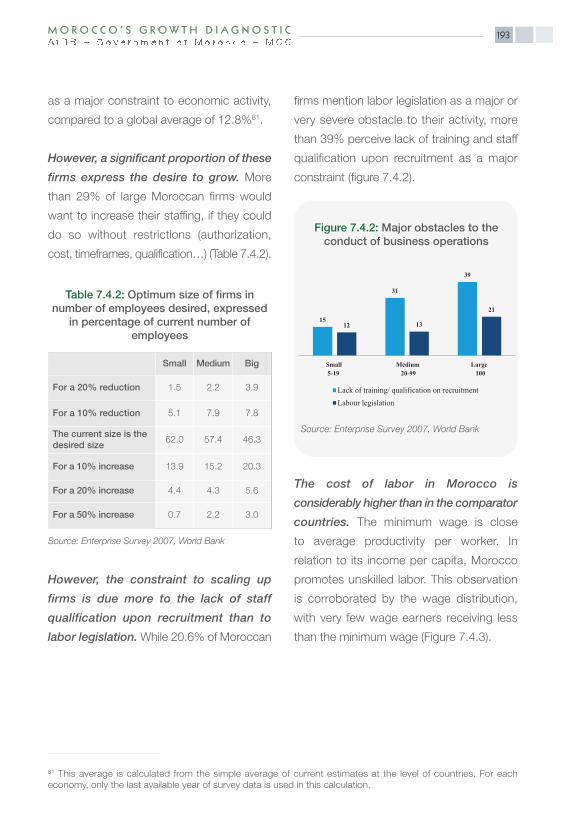
193M O R O C C O ’ S G R OW T H D I A G N O S T I C
as a major constraint to economic activity,
compared to a global average of 12.8%81.
However, a significant proportion of these
firms express the desire to grow. More
than 29% of large Moroccan firms would
want to increase their staffing, if they could
do so without restrictions (authorization,
cost, timeframes, qualification…) (Table 7.4.2).
However, the constraint to scaling up
firms is due more to the lack of staff
qualification upon recruitment than to
labor legislation. While 20.6% of Moroccan
firms mention labor legislation as a major or
very severe obstacle to their activity, more
than 39% perceive lack of training and staff
qualification upon recruitment as a major
constraint (figure 7.4.2).
The cost of labor in Morocco is
considerably higher than in the comparator
countries. The minimum wage is close
to average productivity per worker. In
relation to its income per capita, Morocco
promotes unskilled labor. This observation
is corroborated by the wage distribution,
with very few wage earners receiving less
than the minimum wage (Figure 7.4.3).
81 This average is calculated from the simple average of current estimates at the level of countries. For eacheconomy, only the last available year of survey data is used in this calculation.
Small Medium Big
For a 20% reduction 1.5 2.2 3.9
For a 10% reduction 5.1 7.9 7.8
The current size is thedesired size
62.0 57.4 46.3
For a 10% increase 13.9 15.2 20.3
For a 20% increase 4.4 4.3 5.6
For a 50% increase 0.7 2.2 3.0
Table 7.4.2: Optimum size of firms in number of employees desired, expressed
in percentage of current number of employees
Source: Enterprise Survey 2007, World Bank
15
31
39
12 13
21
Small5-19
Medium20-99
Large100
Lack of training/ qualification on recruitmentLabour legislation
Figure 7.4.2: Major obstacles to theconduct of business operations
Source: Enterprise Survey 2007, World Bank

M O R O C C O ’ S G R OW T H D I A G N O S T I C194
In Morocco, wages are subject to
centralized negotiation and two official
minimum wages are set, one for
agricultural workers and the second for
the other sectors. The aim of regulation
is to ensure a convenient living standard
for these workers. However, very high
wages in relation to marginal labor
productivity can lead to loss of
competitiveness.
The private sector wage distribution
shows that most Moroccan firms pay
their employees the minimum wage. It
should be noted that the gap between the
minimum wage set at MAD 1845 in 2007
and the average wage of MAD 244282, the
same year, is relatively high. In this regard,
F. Mourji & al (2004) show that the minimum
wage contributes significantly in raising the
average wage in the Moroccan firm.
7.4.3 Type 3 Test: By-passing theConstraint
If labor regulation and cost were a major
obstacle to their economic activity,
Moroccan firms would try to bypass
them. One way would be to hire workers
in the informal sector. The informal sector’s
importance in the Moroccan economy is
fairly low in relation to income per capita,
which is the contrary in Tunisia and Malaysia
where the informal sectors are more
important than might be expected given their
level of income per capita (Figure 7.4.4).
82 Estimated from the data of the Enterprise Survey 2007.
Figure 7.4.3: Wage distribution in theindustrial sector (2007)
Source: Enterprise Survey 2007, World Bank
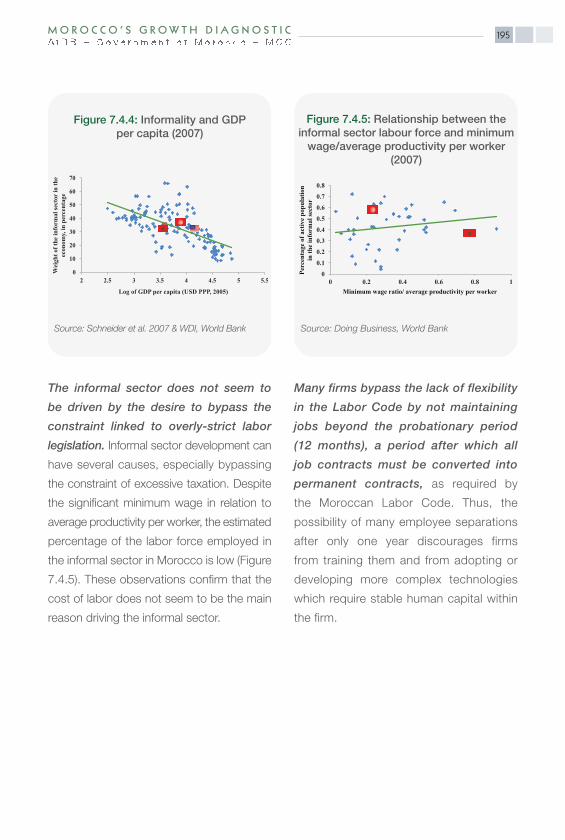
195M O R O C C O ’ S G R OW T H D I A G N O S T I C
The informal sector does not seem to
be driven by the desire to bypass the
constraint linked to overly-strict labor
legislation. Informal sector development can
have several causes, especially bypassing
the constraint of excessive taxation. Despite
the significant minimum wage in relation to
average productivity per worker, the estimated
percentage of the labor force employed in
the informal sector in Morocco is low (Figure
7.4.5). These observations confirm that the
cost of labor does not seem to be the main
reason driving the informal sector.
Many firms bypass the lack of flexibility
in the Labor Code by not maintaining
jobs beyond the probationary period
(12 months), a period after which all
job contracts must be converted into
permanent contracts, as required by
the Moroccan Labor Code. Thus, the
possibility of many employee separations
after only one year discourages firms
from training them and from adopting or
developing more complex technologies
which require stable human capital within
the firm.
0
10
20
30
40
50
60
70
2 2.5 3 3.5 4 4.5 5 5.5
Wei
ght o
f the
info
rmal
sect
or in
the
econ
omy,
in p
erce
ntag
e
Log of GDP per capita (USD PPP, 2005)
Figure 7.4.4: Informality and GDPper capita (2007)
Source: Schneider et al. 2007 & WDI, World Bank
00.10.20.30.40.50.60.70.8
0 0.2 0.4 0.6 0.8 1
Perc
enta
ge o
f act
ive
popu
latio
nin
the
info
rmal
sect
or
Minimum wage ratio/ average productivity per worker
Figure 7.4.5: Relationship between the informal sector labour force and minimumwage/average productivity per worker
(2007)
Source: Doing Business, World Bank

M O R O C C O ’ S G R OW T H D I A G N O S T I C196
At the same time, while a high proportion
of Moroccan firms appear to comply with
labor legislation, there are still a high
number of strikes in the industrial sector.
In 2012, Morocco recorded 335 strikes in
the industrial sector, compared to 418 in
201183, with a participation rate of more than
45%. These strikes are mainly attributed84
to late or non-payment of wages (19.7%),
curtailment of social benefits (14.7%) and
redundancy (12.5%).
Contrary to the industrial sector, social
conflicts in the agricultural sector are
due mainly to redundancy practices
considered abusive by employees. In
the agricultural sector, the main causes
of strikes are redundancy (40%), working
hours and paid leave (22%), wages (14%)
and social security (8%).
However, the economic impact of these
strikes is hard to measure. Generally, the
absence of data and studies on the direct
and indirect impacts of labor conflicts makes
it impossible to assess their economic and
social cost or the efforts made to contain
them. However, this considerable number of
strikes implies non-compliance with labor
legislation.
7.4.4 Type 4 Test: Camels & Hippos
The objective of this test is to determine
which firms will thrive by bypassing labor
regulations. Indeed, if labor regulation and
cost were really restrictive, very few small
and medium firms would grow.
As illustrated above by the transition
matrix (Table 7.3.4), the probability that a
firm of less than 10 wage earners will
have more than 100 wage earners after
5 years is only 0.4%. Similarly, this matrix
reveals that only 24% of firms with less than
5 wage earners increased their staffing in
5 years. These 24% can be considered as
“camels” in the desert and comprising firms
which have bypassed the constraint of labor
regulation and cost.
7.5 Governance, Corruption andTransparency
7.5.1 Situation and Challenges
The concept of good governance85 is
at the core of discussions on the
determinants of economic growth,
particularly on the conditions of private
sector development. It is, therefore,
83 This figure is linked mainly to the contagious effect of the wave of revolts in Arab countries, especially those ofthe region.84 Figures of the Ministry of Employment and social affairs.

197M O R O C C O ’ S G R OW T H D I A G N O S T I C
increasingly acknowledged that good
governance (which is reflected in quality
of institutions) is necessary to accelerate a
country’s economic development. According
to the UNDP86, good governance is based
on seven core criteria: political legitimacy
and accountability, freedom of association
and participation, existence of a reliable
judicial system, sense of responsibility,
freedom of information and expression,
effective and efficient public sector
management and cooperation with the
society’s organizations.
During the last decade, Morocco
embarked on a reform process aimed at
strengthening institutional efficiency. This
process culminated in the adoption of a new
Constitution in 2011, aimed at consolidating
the Rule of Law, enshrining the principles
of separation of powers, ensuring
accountability and adopting a public service
charter that lays down good governance
rules on the operation of public
administrative services, regions and local
authorities and other public organizations. In
this regard, Moroccan authorities adopted,
in 2012, a Code of Good Governance
Corporate Practices of Public Enterprises
and Institutions. In addition, a new Finance
Organic Law, being adopted, enshrines
the principle of performance in public
management. In this regard, Moroccan
authorities adopted a Good of Good
Governance Corporate Practices (PEI) in
2012. In addition, a new Finance Organic
Law, being adopted, enshrines the principle
of performance in public management.
However, despite these efforts, governance
remains a concern for the Moroccan
authorities. The “Heritage Foundation”
2013 economic freedom indicators
highlight particular weaknesses, especially
in the areas of governance and corruption,
property rights and freedom of labor.
This observation is confirmed by the
comparison of Morocco’s indicators
with those of the reference countries.
Indeed, Morocco has the lowest score after
Indonesia in absence of corruption (34 out
of 100) and property rights (40 out of 100),
thus indicating issues of good governance
in Moroccan institutions. These indicators
show that several inadequacies and
failures likely to impede investments are
governance-related (table 7.5.1).
85 According to the Institute on Governance, governance is defined as “the institutions, processes and traditionswhich determine how power is exercised, how decisions are taken, and how citizens have their say”, CanadianInternational Development Agency, March 1997.86 UNDP: United Nations Development Program.
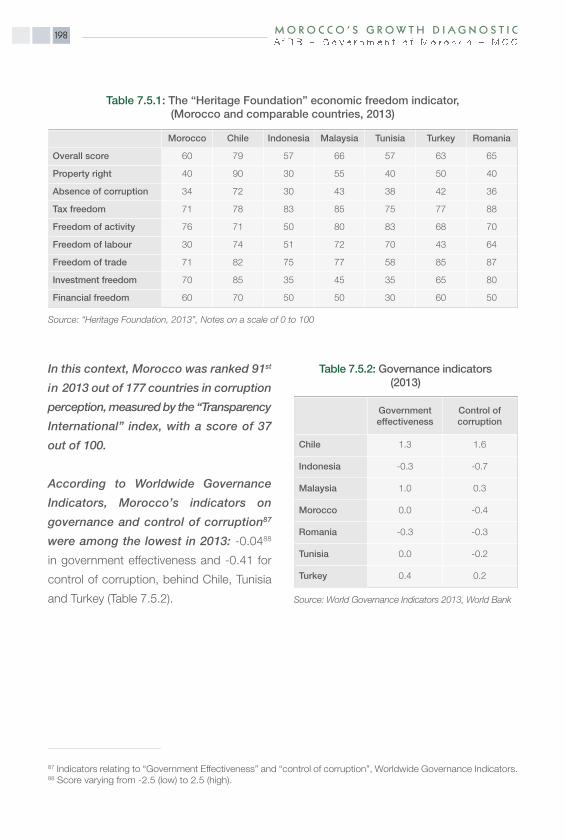
M O R O C C O ’ S G R OW T H D I A G N O S T I C198
In this context, Morocco was ranked 91st
in 2013 out of 177 countries in corruption
perception, measured by the “Transparency
International” index, with a score of 37
out of 100.
According to Worldwide Governance
Indicators, Morocco’s indicators on
governance and control of corruption87
were among the lowest in 2013: -0.0488
in government effectiveness and -0.41 for
control of corruption, behind Chile, Tunisia
and Turkey (Table 7.5.2).
87 Indicators relating to “Government Effectiveness” and “control of corruption”, Worldwide Governance Indicators. 88 Score varying from -2.5 (low) to 2.5 (high).
Table 7.5.1: The “Heritage Foundation” economic freedom indicator, (Morocco and comparable countries, 2013)
Source: “Heritage Foundation, 2013”, Notes on a scale of 0 to 100
Morocco Chile Indonesia Malaysia Tunisia Turkey Romania
Overall score 60 79 57 66 57 63 65
Property right 40 90 30 55 40 50 40
Absence of corruption 34 72 30 43 38 42 36
Tax freedom 71 78 83 85 75 77 88
Freedom of activity 76 71 50 80 83 68 70
Freedom of labour 30 74 51 72 70 43 64
Freedom of trade 71 82 75 77 58 85 87
Investment freedom 70 85 35 45 35 65 80
Financial freedom 60 70 50 50 30 60 50
Source: World Governance Indicators 2013, World Bank
Governmenteffectiveness
Control ofcorruption
Chile 1.3 1.6
Indonesia -0.3 -0.7
Malaysia 1.0 0.3
Morocco 0.0 -0.4
Romania -0.3 -0.3
Tunisia 0.0 -0.2
Turkey 0.4 0.2
Table 7.5.2: Governance indicators(2013)
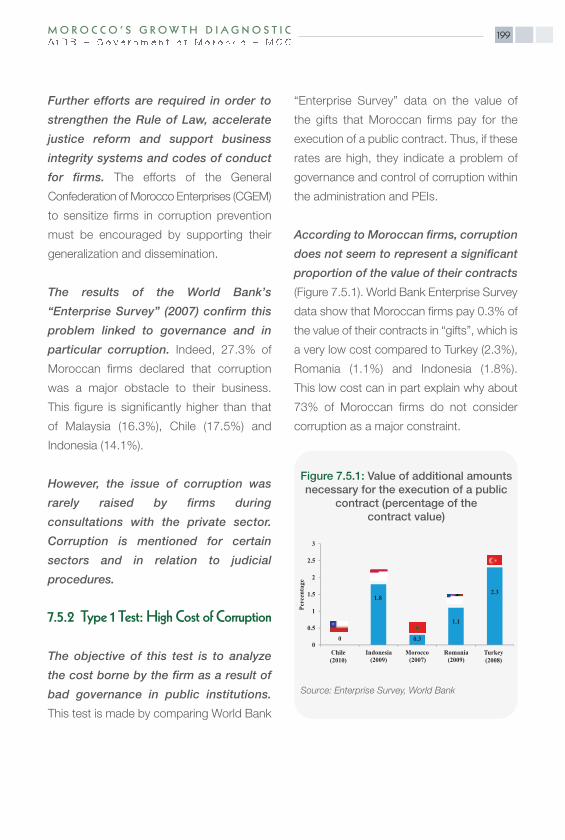
199M O R O C C O ’ S G R OW T H D I A G N O S T I C
Further efforts are required in order to
strengthen the Rule of Law, accelerate
justice reform and support business
integrity systems and codes of conduct
for firms. The efforts of the General
Confederation of Morocco Enterprises (CGEM)
to sensitize firms in corruption prevention
must be encouraged by supporting their
generalization and dissemination.
The results of the World Bank’s
“Enterprise Survey” (2007) confirm this
problem linked to governance and in
particular corruption. Indeed, 27.3% of
Moroccan firms declared that corruption
was a major obstacle to their business.
This figure is significantly higher than that
of Malaysia (16.3%), Chile (17.5%) and
Indonesia (14.1%).
However, the issue of corruption was
rarely raised by firms during
consultations with the private sector.
Corruption is mentioned for certain
sectors and in relation to judicial
procedures.
7.5.2 Type 1 Test: High Cost of Corruption
The objective of this test is to analyze
the cost borne by the firm as a result of
bad governance in public institutions.
This test is made by comparing World Bank
“Enterprise Survey” data on the value of
the gifts that Moroccan firms pay for the
execution of a public contract. Thus, if these
rates are high, they indicate a problem of
governance and control of corruption within
the administration and PEIs.
According to Moroccan firms, corruption
does not seem to represent a significant
proportion of the value of their contracts
(Figure 7.5.1). World Bank Enterprise Survey
data show that Moroccan firms pay 0.3% of
the value of their contracts in “gifts”, which is
a very low cost compared to Turkey (2.3%),
Romania (1.1%) and Indonesia (1.8%).
This low cost can in part explain why about
73% of Moroccan firms do not consider
corruption as a major constraint.
0
1.8
0.3
1.1
2.3
0
0.5
1
1.5
2
2.5
3
Chile(2010)
Indonesia(2009)
Morocco(2007)
Romania(2009)
Turkey(2008)
Perc
enta
ge
Figure 7.5.1: Value of additional amountsnecessary for the execution of a public
contract (percentage of the contract value)
Source: Enterprise Survey, World Bank
M O R O C C O ’ S G R OW T H D I A G N O S T I C200
7.6 Trade Barriers
7.6.1 Introduction
Convinced of the importance of
openness to international trade in its
development process, Morocco has,
for many years now, embarked on
reforms to streamline trade procedures,
and diversify and expand its trade ties,
through the establishment of many free
trade agreements and the reduction of the
ensuing tariff and non-tariff measures.
The openness of an economy can be
approached through the trend of exports
of goods and services to foreign markets,
imports of inputs, the encouragement of
foreign investors, the use of external
financing or the adoption of common
regulations. The analysis is focused mainly on
access of foreign goods to the domestic
market and of domestic goods to foreign
markets. Various positive effects can be
expected from the liberalization of trade in
goods and services. Increased competition of
foreign goods on the domestic market can
encourage domestic firms to innovate as well
as to use better quality or less costly imported
inputs, thus improving their efficiency (Aghion
et al., 2009). It is also possible that foreign
competition results in a shift of resources from
the least productive domestic firms to the
most productive (Melitz, 2003). Finally, better
access of domestic firms to foreign markets
to meet potential needs, enables them to make
economies of scale and acquire know-how.
The efforts made by Morocco in trade
openness have been considerable since
the mid-90s. To test whether trade barriers
are, nonetheless, an impediment to Morocco’s
economic development, the presence and
trend of tariff barriers and non-tariff barriers is
analyzed, as well as their role.
7.6.2 Situation and Challenges
• Trade Agreements
Preferential trade agreements signed by
Morocco are a pillar of its liberalization
and openness strategy. Indeed, Morocco
embarked relatively early on a process of
trade openness with the signing of the GATT
(General Agreement on Tariffs and Trade)
agreements in 1987, and then acceded to
the WTO (World Trade Organization) in 1995.
This strong will by Morocco continued with
the signing of several preferential free trade
agreements with the European Union, the
European Free Trade Association (EFTA), the
United States, Turkey and the Arab League
Countries. The main trade agreements
signed by Morocco since the late 1990s are
summarized in table 7.6.1 below.
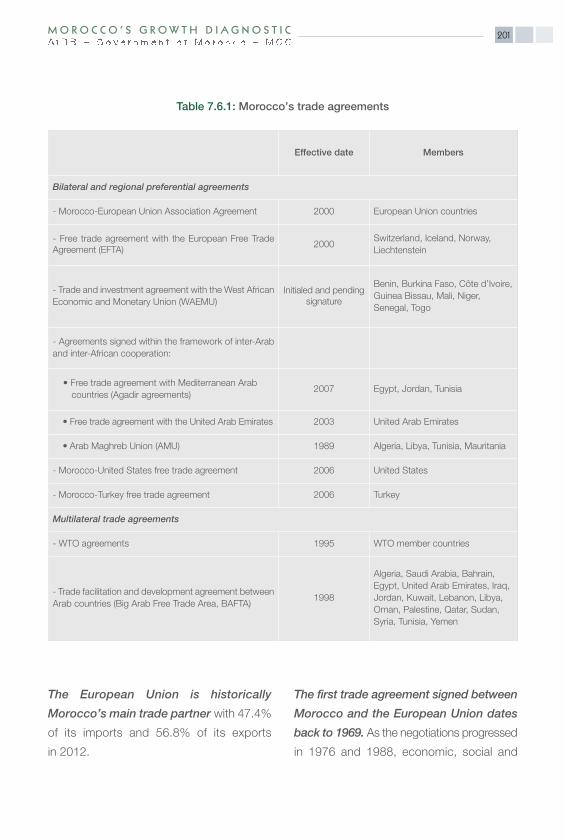
201M O R O C C O ’ S G R OW T H D I A G N O S T I C
The European Union is historically
Morocco’s main trade partner with 47.4%
of its imports and 56.8% of its exports
in 2012.
The first trade agreement signed between
Morocco and the European Union dates
back to 1969. As the negotiations progressed
in 1976 and 1988, economic, social and
Effective date Members
Bilateral and regional preferential agreements
- Morocco-European Union Association Agreement 2000 European Union countries
- Free trade agreement with the European Free Trade Agreement (EFTA)
2000Switzerland, Iceland, Norway,Liechtenstein
- Trade and investment agreement with the West AfricanEconomic and Monetary Union (WAEMU)
Initialed and pendingsignature
Benin, Burkina Faso, Côte d’Ivoire,Guinea Bissau, Mali, Niger, Senegal, Togo
- Agreements signed within the framework of inter-Araband inter-African cooperation:
• Free trade agreement with Mediterranean Arab countries (Agadir agreements)
2007 Egypt, Jordan, Tunisia
• Free trade agreement with the United Arab Emirates 2003 United Arab Emirates
• Arab Maghreb Union (AMU) 1989 Algeria, Libya, Tunisia, Mauritania
- Morocco-United States free trade agreement 2006 United States
- Morocco-Turkey free trade agreement 2006 Turkey
Multilateral trade agreements
- WTO agreements 1995 WTO member countries
- Trade facilitation and development agreement betweenArab countries (Big Arab Free Trade Area, BAFTA)
1998
Algeria, Saudi Arabia, Bahrain,Egypt, United Arab Emirates, Iraq,Jordan, Kuwait, Lebanon, Libya,Oman, Palestine, Qatar, Sudan,Syria, Tunisia, Yemen
Table 7.6.1: Morocco’s trade agreements

M O R O C C O ’ S G R OW T H D I A G N O S T I C202
financial components were added to the
commercial component. In 1996, following
the 1995 Barcelona Declaration establishing
the Euro-Mediterranean partnership, an
association agreement was signed between
Morocco and the European Union and
became effective in 2000. In July 2005, the
ties between Morocco and the European
Union were further consolidated with the
European Neighborhood Policy Action
Plan. This is a vast Plan made up of
many components such as social policy
cooperation, migrant flow management,
energy sector development, educational
system support, etc. During the preparation
of this Plan, the negotiation of a free trade
agreement in the services sector was initiated.
On 13 October 2008, Morocco was the first
country to be granted advanced status.
Later, Morocco and the EU signed an
agricultural agreement in October 2012.
Advanced status implies the establishment
of a gradual rapprochement plan with
respect to the Community acquis.
Regulatory convergence is an essential
element of strong integration between two
trade areas. On 1 March 2013, negotiations
on a Deep and Comprehensive Free Trade
Agreement (DCFTA) were initiated. This
agreement aims to align Moroccan
legislation and regulations with EU standards
in trade in industrial goods, agricultural
products and services, investment protection,
public procurement, competitiveness policy
and the safeguarding of intellectual property
rights.
To develop its trade with high-income
countries, Morocco signed a free
trade agreement in 1997 with EFTA
(Switzerland, Iceland, Norway and
Liechtenstein) which entered into force
in 2000. This agreement covers several
aspects related to industrial, agricultural,
agro-industrial and fishery products.
Morocco also turned towards its Arab
and African neighbors. It signed many
agreements with Arab countries (Agadir
Agreement, Greater Arab Free Trade Area
(GAFTA), providing for various levels of
integration from a simple tariff reduction in
import duties to total exemption from these
duties.
Other bilateral agreements were signed,
especially with Turkey, which provided
for a 10-year transitional period as from
1 January 2006.

203M O R O C C O ’ S G R OW T H D I A G N O S T I C
The free trade agreement with the United
States was signed on 15 June 2004 and
entered into force on 1 January 2006. This
Agreement was based both on trade in
goods (industrial, agricultural and fishery
products) and services (financial services,
telecommunications, tourism, transport,
construction, electricity, water, etc.) and
on investment. This Agreement also has
several components on intellectual property,
environmental protection, public procurement,
and customs procedures.
These agreements are important since
they offer visibility to investors and
guarantee them the necessary legal
security.
• Customs Duties
The many trade agreements signed by
Morocco have led to a sharp reduction in
customs duties since the mid-1990s
(Figure 7.6.1). The reduction in customs
duties took place in two waves: i) first,
between 1993 and 1997, which corresponds
to Morocco’s accession to WTO. Following
the consolidation of rates, tariffs increased
slightly between 1997 and 2000 and ii)
second, after 2000, with the entry into force
of trade agreements, in particular with the
European Union.
This trend in tariff barriers is important
and common to Morocco’s various
partners. Thus, the average import duty rate
dropped from 64% in 1993 to close to 4.6%
in 2012. The sharpest decrease concerned
trade with MENA countries (whose rate
fell from 68.5% to 0.6%). Tariffs applied
on products originating from the EU also
dropped sharply from 63% to 1.1%.
0
10
20
30
40
50
60
70
80
1993 1997 2000 2001 2002 2003 2005 2006 2007 2008 2009 2012
World EU 25 USAMENA Development countries
Figure 7.6.1: Customs duty trend, effectively applied rate (simple average)
Source: UNCTAD, TRAINS

M O R O C C O ’ S G R OW T H D I A G N O S T I C204
The customs duty trend by sector of
activity shows a general decrease in tariffs
but with a stronger trend for industrial
products. This gap is explained by the fact
that most of the trade agreements are based
mainly on industrial products. Indeed, in
agriculture, tariffs fell from 66.5% in 1993 to
19.3% in 2012, whereas in industry, over
the same period, rates dropped from about
64% to 3.7%.
In addition to the customs duty trend by
sector of activity, it is important to take
their structure into account to assess
the effective protection of an economy.
In 2012, the highest tariffs concerned
raw materials with 12.5%, followed by
consumer goods with 7%, intermediate
goods with 2.6%, and then capital goods
with 1.9%. A country’s effective protection
increases if the gap between custom
duties applied on inputs and those applied
to consumer goods increases. And yet, the
decrease in customs duties on consumer
goods was identical to the rate of decrease
in tariffs on inputs for the period from 1993
to 2007 and higher after 2007. Protection,
therefore, decreased and a downward shift
towards convergence of customs duties
was observed (figure 7.6.2).
The maximum rate that Morocco applies
on imports is 304% (Table 7.6.2). It
concerns only agricultural products. In
industry, the maximum rate is 50%. As might
be expected, the number of tariff headings
exceeding 3 times the overall simple applied
rate is high in agriculture. On the other hand,
it is relatively low in industry. This observation
is very different regarding the number
of international peaks (number of tariff
headings exceeding 15%), which is higher in
industry.
Overall, it appears that tariff dismantling
in Morocco has been significant in the
last 15 years. It is obvious that, in the
0102030405060708090
1993 1997 2000 2001 2002 2003 2005 2006 2007 2008 2009 2012
Equipment goods Consumer goodsIntermediate goods Raw materials
Figure 7.6.2: Customs duty trend by category of goods, effectively applied
rate (simple average)
Source: UNCTAD, TRAINS

205M O R O C C O ’ S G R OW T H D I A G N O S T I C
coming years, tariff decreases will be
smaller. The rare tariff reductions which
could still be envisaged concern imports
from developing countries, excluding MENA
countries.
• Non-Tariff Measures (NTM)
NTMs can impact trade in many ways
without the objective of protecting
the national economy. They are not
only implemented for the purpose of
protectionism, but also in response to
increased demand for traceability, quality
and consumer protection. NTMs can help
to reduce health risks, a product’s lack of
safety or environmental degradation. They
may, therefore, concern the production
process of a good, its content, its technical
characteristics, labelling, product or
quantity control as well as procedures
applied to verify these requirements
(Baldwin 2000).
In response to increasing requests from
some trade partners to adapt Moroccan
products to international standards
(particularly European) and facilitate
trade, Morocco adopted a number of
measures. In addition to the reduction in
tariffs, Morocco’s trade policy also concerned
non-tariff measures, by reducing the number
of these measures and harmonizing some of
them to international standards. With the
Community acquis, NTMs aim to ensure the
country’s convergence towards the common
body of rights and obligations of European
Union Member States.
Unlike other comparator countries like
Chile and Indonesia as well as other
MENA countries like Tunisia, Egypt or
Lebanon, Morocco tends to impose
non-tariff measures on low-value items.
Thus, Morocco is among the top third of
countries with the least NTMs. The efforts
deployed by Morocco to reduce the impact
of NTMs or the percentage of products on
which one (or several) non-tariff measure(s)
is/are applied, since the last wave of
collection in 2001, are outstanding (Figure
7.6.3). The frequency index has decreased
by 75%.
Total Agriculture Industry
Simple average 4.58 19.32 3.65
Weighted average 3.4 14.44 1.93
Standard deviation
12.11 29.09 8.04
Minimum rate 0 0 0
Maximum rate 304 304 50
No. of domesticpeaks 45 69 4 358 211
No. of internationalpeaks 36 272 8376 27 826
Table 7.6.2: Morocco’s tariff profile
Source: World Bank/UNCTAD NTM data

M O R O C C O ’ S G R OW T H D I A G N O S T I C206
• Challenges
The efforts made by Morocco in
international goods and services trade
openness have been considerable both in
terms of customs duties and non-tariff
measures. Indeed, tariff dismantling has
been so significant that the rare possible
opportunities to reduce customs duties are
to be found only in the agricultural sector
or from developing countries, excluding
MENA countries. The efforts in terms of
harmonization and regulation, and reduction
of non-tariff measures are outstanding.
However, an important point to be
emphasized is the liberalization of
services. Services must be treated in a
distinct manner. Certain categories of
services may be more sensitive than others
and require greater caution. It is, therefore,
important for the Government to be
vigilant and correctly identify the sectors for
which alignment of regulations with those
of partner countries or with international
regulations can be beneficial.
7.6.3 Trade Freedom Comparison
It is relatively easy to trade in Morocco.
Figure 7.6.4 presents a Heritage
Foundation indicator on trade freedom
in 2010. This indicator assesses trade
freedom on a scale of 0 to 100. With
an index above 75, Morocco is well-
positioned, even if certain reference
countries, like Romania or Turkey, have
higher scores. Trade reforms undertaken
by Morocco increased the economy’s
degree of openness which resulted in
a significant improvement in external
assessments on this issue between 1995
and 2012.
0
20
40
60
80
100
120
Egypt Lebanon Morocco Tunisia
Inde
x
2001 2010
Figure 7.6.3: Frequency index trendbetween 2001 and 2010
Source: World Bank/UNCTAD NTM data

207M O R O C C O ’ S G R OW T H D I A G N O S T I C
7.6.4 Type 2 Test: Estimate of theCorrelation between Trade Openness andthe Level of Economic Development
The objective of the test is to determine
the link between trade freedom and the
level of trade in relation to income.
Therefore, this test measures the constraint
level by situating Morocco in relation to
its comparable countries to answer the
following question: Is trade freedom enough
to develop trade in goods in Morocco?
Morocco seems to have a slightly higher
degree of trade freedom considering its
income level. Even though there do not
appear to be any major impediments
to international trade, it is important to link
the country’s openness to its level of wealth.
Indeed, trade openness is often a means
for countries to improve the level of
productivity of domestic firms through
keener competition and exploration of new
foreign markets. Figure 7.6.5 illustrates the
correlation between real income per capita
in 2012 and the trade freedom index.
Morocco is well-positioned, since it is lies on
the trend line. Thus, the level of trade is as
expected given the country’s degree of
openness.
0102030405060708090
100
0 20 40 60 80 100 120Merchandise trade (in % of GDP)
Free
dom
of t
rade
(in
2012
)
Figure 7.6.5: Correlation between real income per capita in 2012 and trade
freedom index
Source: World Bank, WDI and Heritage Foundation
0102030405060708090
100
Inde
x
Chile Indonesia Malaysia Morocco Romania Tunisia Turkey
1995 2012
Figure 7.6.4: Trade freedom indexin 2012
Source: Heritage Foundation

M O R O C C O ’ S G R OW T H D I A G N O S T I C208
7.6.5 Type 3 Test: Are Firms Able toTrade?
The objective is to determine the ability
of firms to trade. It will, therefore, be
necessary to consider the proportion of firms
that export and those that import in order to
determine to what extent Moroccan firms are
capable of integrating into global trade.
Openness to international markets is not
a constraint for domestic firms (Figure
7.6.6). Indeed, among the comparator
countries, Morocco has the second highest
number of exporting firms after Malaysia
(37.5%). Morocco also has the second
highest number of importing firms (73.4%).
This result indicates that trade barriers are
not a constraint to Morocco’s growth,
which is consistent with the results of the
preceding tests.
7.6.6 Type 4 Test: Import Trend byMajor Sectors
The objective of this test is to compare
the import trend of major sectors. Since
customs duties fell more rapidly in industry
than in agriculture, a drop in agricultural
imports and an increase in industrial
imports might be expected. Therefore, this
test will make it possible to determine
whether the sectors with more gradual
trade openness were constrained in their
trade development.
Imports of agricultural and industrial
products rose. In the import breakdown,
the share of agricultural products trended
downwards slightly (this share fell from
18% in 1993 to 13% in 2012), whereas the
share of industrial imports rose (from 82%
in 1993 to 87% in 2012) (Figure 7.6.7).
Since the agricultural sector is protected
more than the rest of the economy and
since, in industry, the domestic market’s
competitive structure had changed,
industrial imports increased faster than
agricultural imports.
Percentage of firms that export
Percentage of firms that import
0%
10%
20%
30%
40%
50%
60%
70%
80%
Chile Indonesia Malaysia Morocco Romania Turkey
Perc
enta
ge
Figure 7.6.6: Proportion of exportingand importing firms
Source: World Bank, WDI and Exchange Office

209M O R O C C O ’ S G R OW T H D I A G N O S T I C
However, despite a slower decrease in
customs duties in agriculture, imports did
not decrease. In fact, the reverse was the
case.
0%
20%
40%
60%
80%
100%
1993 1995 1997 1999 2001 2003 2005 2007 2009 2011
Perc
enta
ge
Share of industrial imports (in %)Share of agricultural imports (in %)
Figure 7.6.7: Import breakdown trend
Source: World Bank, WDI

Chapter 8
Innovation

M O R O C C O ’ S G R OW T H D I A G N O S T I C212
Chapter 8: Innovation
Key Messages
• Innovation, defined as the development or adoption of new technologies, techniques,
products and services, is a key driver of economic growth.
• Without effective central government intervention to correct market shortcomings
regarding innovation and closer coordination with the private sector and among public
innovation promotion agencies, investments incorporating innovation with a high
efficiency level, capable of stimulating growth, might not be made.
• Analysis of Morocco’s export basket trend over the last 30 years reveals a low level of
sophistication relative to the level of income per capita and fairly modest results in
terms of structural transformation compared to the comparator countries.
• Morocco’s inability to make technological progress appears to be mainly due to
microeconomic risks and a shortage of human capital, and to a lesser extent, weaknesses
due to learning and coordination externalities.
• Lack of coordination between the government and the private sector and among the
different public innovation promotion agencies is a constraint to a strong and sustainable
growth.
• The available indicators do not make it possible to qualify market innovation weaknesses
as a major constraint to growth in Morocco.
213M O R O C C O ’ S G R OW T H D I A G N O S T I C
Introduction
Innovation, defined as the development or
adoption of new technologies, techniques,
products and services, is a key driver
of economic growth alongside capital
and labor. In addition to the public policy
weaknesses identified throughout the
diagnostic, market shortcomings in terms
of innovation89 (Annex 8.1) may affect
returns on investments90.
Without effective government intervention
to correct it and real public-public, public-
private and private-private coordination,
innovative investments likely to boost
growth might not be made. Grossman
and Helpman (1991) show that growth
depends, in part, upon the ability of
producers to climb quality ladders.
Similarly, Hausmann, Hwang and Rodrik.
(2007) formulate a theory of “self-discovery”
whereby firms must discover their own
productivity. Either of these two theories
may explain the correlation documented by
Hausmann, Hwang and Rodrik (2007)
between what countries produce initially
and their subsequent per capita growth
rates.
Although market failures in innovation are a
reality, determining whether they constitute
a major constraint to growth in a given
country is difficult. One way to approach this
question is to assess the strength of government
efforts to address such market failures.
Determining whether a country’s innovation
performance is slow in relation to its overall
investment and growth performance could also
provide an answer to the question considered
throughout this chapter. A high cost of financing,
low skill levels and lack of key infrastructure,
for instance, may impede innovation and
sophistication in a given country.
The Moroccan economy has become
fairly diversified and sophisticated over
the last two decades. However, its results
remain modest as compared to those
achieved by other countries in the region.
Morocco’s export basket remains the least
diversified and least sophisticated among
the comparator countries, despite relatively
comparable levels in 1970 (Figure 8.1).
89 Market weakness is a case where the market fails in the optimum allocation of economic resources and goodsand services. This is an eminently political concept as it serves to justify policy interventions aimed at correctingmarkets, i.e. the peaceful and voluntary coordination of operators.90 Innovation externalities drop considerably if innovating investors share an innovation’s productivity with otheractors, who, through imitation, take advantage of it.
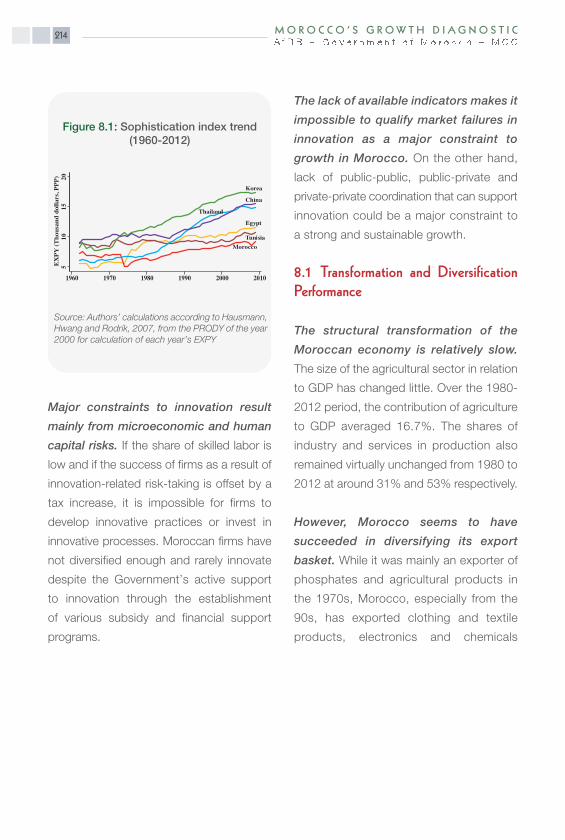
M O R O C C O ’ S G R OW T H D I A G N O S T I C214
Major constraints to innovation result
mainly from microeconomic and human
capital risks. If the share of skilled labor is
low and if the success of firms as a result of
innovation-related risk-taking is offset by a
tax increase, it is impossible for firms to
develop innovative practices or invest in
innovative processes. Moroccan firms have
not diversified enough and rarely innovate
despite the Government’s active support
to innovation through the establishment
of various subsidy and financial support
programs.
The lack of available indicators makes it
impossible to qualify market failures in
innovation as a major constraint to
growth in Morocco. On the other hand,
lack of public-public, public-private and
private-private coordination that can support
innovation could be a major constraint to
a strong and sustainable growth.
8.1 Transformation and Diversification Performance
The structural transformation of the
Moroccan economy is relatively slow.
The size of the agricultural sector in relation
to GDP has changed little. Over the 1980-
2012 period, the contribution of agriculture
to GDP averaged 16.7%. The shares of
industry and services in production also
remained virtually unchanged from 1980 to
2012 at around 31% and 53% respectively.
However, Morocco seems to have
succeeded in diversifying its export
basket. While it was mainly an exporter of
phosphates and agricultural products in
the 1970s, Morocco, especially from the
90s, has exported clothing and textile
products, electronics and chemicals
510
1520
EXPY
(Tho
usan
d do
llars
, PPP
)
1960 1970 1980 1990 2000 2010
Egypt
MoroccoTunisia
Korea
ThailandChina
Figure 8.1: Sophistication index trend(1960-2012)
Source: Authors’ calculations according to Hausmann,Hwang and Rodrik, 2007, from the PRODY of the year2000 for calculation of each year’s EXPY
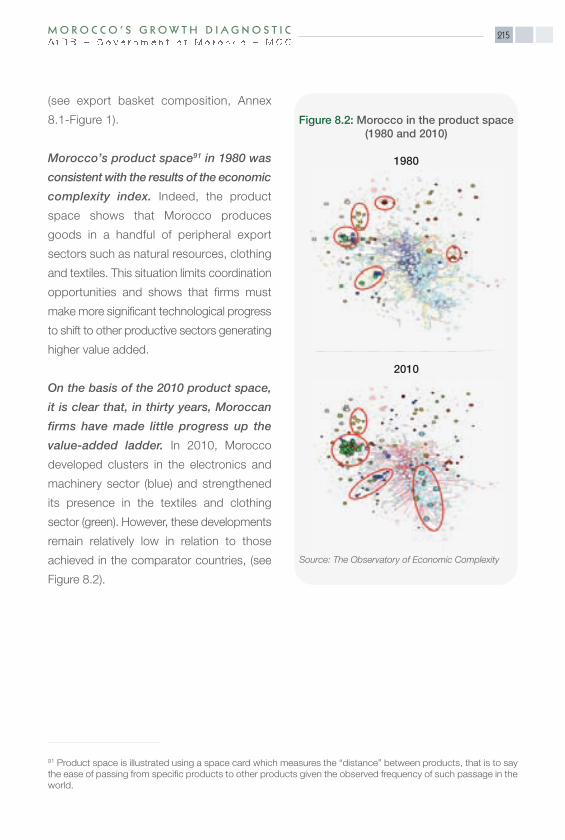
215M O R O C C O ’ S G R OW T H D I A G N O S T I C
(see export basket composition, Annex
8.1-Figure 1).
Morocco’s product space91 in 1980 was
consistent with the results of the economic
complexity index. Indeed, the product
space shows that Morocco produces
goods in a handful of peripheral export
sectors such as natural resources, clothing
and textiles. This situation limits coordination
opportunities and shows that firms must
make more significant technological progress
to shift to other productive sectors generating
higher value added.
On the basis of the 2010 product space,
it is clear that, in thirty years, Moroccan
firms have made little progress up the
value-added ladder. In 2010, Morocco
developed clusters in the electronics and
machinery sector (blue) and strengthened
its presence in the textiles and clothing
sector (green). However, these developments
remain relatively low in relation to those
achieved in the comparator countries, (see
Figure 8.2).
91 Product space is illustrated using a space card which measures the “distance” between products, that is to saythe ease of passing from specific products to other products given the observed frequency of such passage in theworld.
1980
2010
Source: The Observatory of Economic Complexity
Figure 8.2: Morocco in the product space(1980 and 2010)
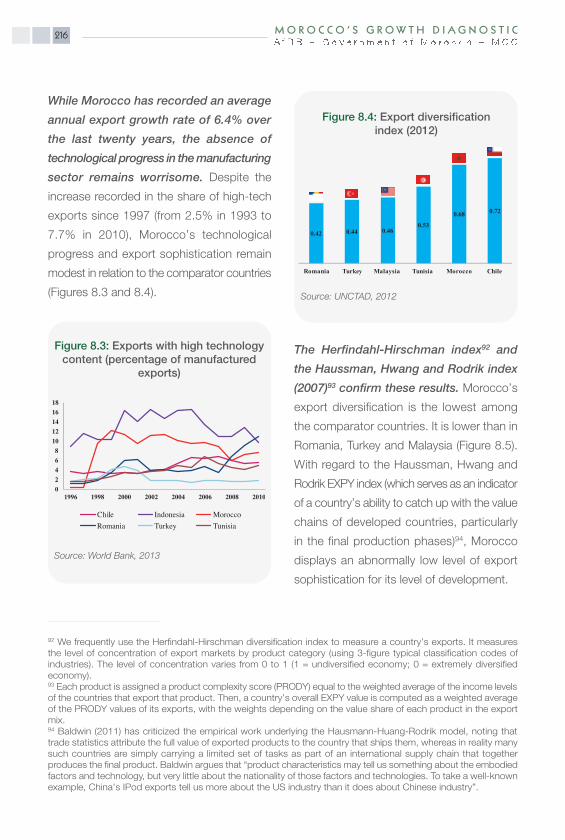
M O R O C C O ’ S G R OW T H D I A G N O S T I C216
While Morocco has recorded an average
annual export growth rate of 6.4% over
the last twenty years, the absence of
technological progress in the manufacturing
sector remains worrisome. Despite the
increase recorded in the share of high-tech
exports since 1997 (from 2.5% in 1993 to
7.7% in 2010), Morocco’s technological
progress and export sophistication remain
modest in relation to the comparator countries
(Figures 8.3 and 8.4).
The Herfindahl-Hirschman index92 and
the Haussman, Hwang and Rodrik index
(2007)93 confirm these results. Morocco’s
export diversification is the lowest among
the comparator countries. It is lower than in
Romania, Turkey and Malaysia (Figure 8.5).
With regard to the Haussman, Hwang and
Rodrik EXPY index (which serves as an indicator
of a country’s ability to catch up with the value
chains of developed countries, particularly
in the final production phases)94, Morocco
displays an abnormally low level of export
sophistication for its level of development.
92 We frequently use the Herfindahl-Hirschman diversification index to measure a country’s exports. It measuresthe level of concentration of export markets by product category (using 3-figure typical classification codes ofindustries). The level of concentration varies from 0 to 1 (1 = undiversified economy; 0 = extremely diversifiedeconomy).93 Each product is assigned a product complexity score (PRODY) equal to the weighted average of the income levelsof the countries that export that product. Then, a country’s overall EXPY value is computed as a weighted averageof the PRODY values of its exports, with the weights depending on the value share of each product in the exportmix. 94 Baldwin (2011) has criticized the empirical work underlying the Hausmann-Huang-Rodrik model, noting thattrade statistics attribute the full value of exported products to the country that ships them, whereas in reality manysuch countries are simply carrying a limited set of tasks as part of an international supply chain that togetherproduces the final product. Baldwin argues that “product characteristics may tell us something about the embodiedfactors and technology, but very little about the nationality of those factors and technologies. To take a well-knownexample, China’s IPod exports tell us more about the US industry than it does about Chinese industry”.
02468
1012141618
1996 1998 2000 2002 2004 2006 2008 2010
Chile Indonesia MoroccoRomania Turkey Tunisia
Figure 8.3: Exports with high technologycontent (percentage of manufactured
exports)
Source: World Bank, 2013
0.42 0.44 0.46 0.53
0.68 0.72
Romania Turkey Malaysia Tunisia Morocco Chile
Figure 8.4: Export diversificationindex (2012)
Source: UNCTAD, 2012

217M O R O C C O ’ S G R OW T H D I A G N O S T I C
8.1.1 Type 1 Test: Level of Complexity inRelation to GDP per capita
The objective of this test is to determine
whether the level of complexity of
Moroccan exports matches its level of
income per capita. The test is conducted
using GDP per capita data in constant
2005 USD and from export complexity
levels available from the Harvard University
Observatory of Economic Complexity.
The level of complexity of Morocco’s
exports remains low in relation to its
income per capita95. In addition to export
basket diversification, we can also try to
assess the level of frequency or “ubiquity” of
export products, which reflects the extent
to which goods produced are relatively
common goods on the global market. Lower
ubiquity is a sign that a country has capabilities
that are relatively rare in the world. Similarly,
greater diversity is a sign of varied capabilities.
Thus, low ubiquity and high diversification
confer competitive advantages and a high
level of complexity96.
Morocco’s export basket was relatively
undiversified during 1995-2011 but there
was some transformation. Data indicate
that Morocco has made progress in
transforming its export basket by exporting
more in the non-traditional sectors of
the automobile and aeronautic industry.
Morocco’s export basket trend during the
period 1995-2011 shows that the share
of mechanical product exports rose from
6% of total exports in 1995 to 17% in 2011.
95 The complexity index is computed from the export basket’s diversity (number of products) and ubiquity (shortageof products). Contrary to the EXPY sophistication index, the export complexity index does not use any informationon prices or product-related revenue levels.96 Ricardo Hausmann (2009).
AGO
ALB
AREARG
AUS
AUT
AZE
BEL
BGD
BGRBIH
BLR
BOL
BRA
BWA
CAN
CHE
CHL
CHN
CIV
CMR
COG COL
CRI
CUB
CZEDEUDNK
DOM
DZA
ECU
ESPEST
ETH
FINFRA
GAB
GBR
GEO
GHA
GIN
GRC
GTM
HKG
HND
HRV
HUN
IDNIND
IRL
IRN
ISRITA
JAM
JOR
JPN
KAZ
KENKGZ
KHM
KOR
LAO
LBN
LBR
LBY
LKA
LTULVA
MDA
MDG
MEX
MKD
MLI
MNGMOZ
MRTMUS
MWI
MYS
NAM
NGA
NIC
NLD
NORNZL
OMN
PAK
PAN
PER
PHL
PNG
POLPRT
PRY
QAT
RUS SAU
SDN
SEN
SGP
SLV
SRB
SVKSVN
SWE
SYRTCD
THA
TJK
TKM
TTO
TUR
TZA
UGA
UKRURY
USA
UZB
VEN
VNM
YEM
ZAF
ZMB
ZWEMAR
TUN
EGY
MAR
TUN
8.59
9.510
10.5
Log E
XPY
4 6 8 10 12Log GDP per capita (US $)
Figure 8.5: Export sophistication and income per capita (2008)
Source: Authors' calculations from data COMTRADE
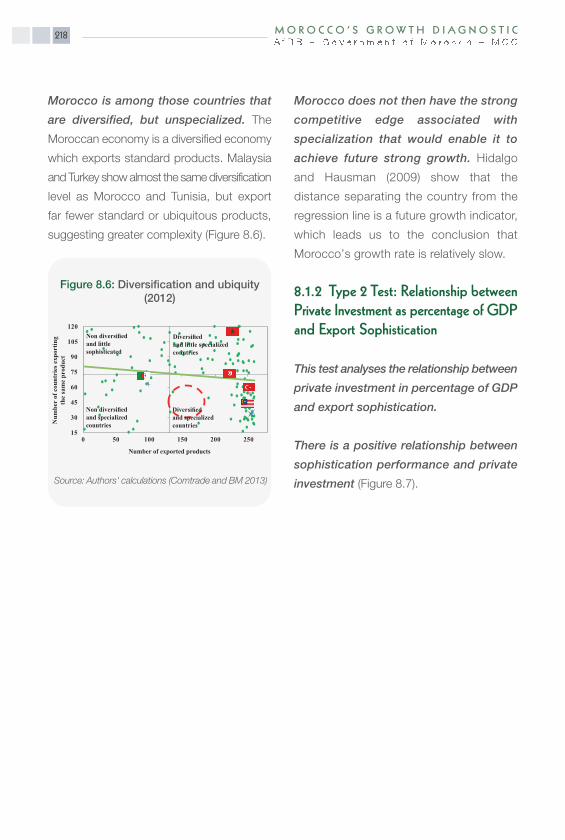
M O R O C C O ’ S G R OW T H D I A G N O S T I C218
Morocco is among those countries that
are diversified, but unspecialized. The
Moroccan economy is a diversified economy
which exports standard products. Malaysia
and Turkey show almost the same diversification
level as Morocco and Tunisia, but export
far fewer standard or ubiquitous products,
suggesting greater complexity (Figure 8.6).
Morocco does not then have the strong
competitive edge associated with
specialization that would enable it to
achieve future strong growth. Hidalgo
and Hausman (2009) show that the
distance separating the country from the
regression line is a future growth indicator,
which leads us to the conclusion that
Morocco’s growth rate is relatively slow.
8.1.2 Type 2 Test: Relationship betweenPrivate Investment as percentage of GDPand Export Sophistication
This test analyses the relationship between
private investment in percentage of GDP
and export sophistication.
There is a positive relationship between
sophistication performance and private
investment (Figure 8.7).
15
30
45
60
75
90
105
120
0 50 100 150 200 250
Num
ber
of c
ount
ries
exp
ortin
gth
e sa
me
prod
uct
Number of exported products
Non diversifiedand littlesophisticated
Non diversifiedand specializedcountries
Diversifiedand specializedcountries
Diversifiedand little specializedcountries
Figure 8.6: Diversification and ubiquity(2012)
Source: Authors' calculations (Comtrade and BM 2013)

219M O R O C C O ’ S G R OW T H D I A G N O S T I C
Granger causality tests were carried out
to determine whether sophistication
leads to private investment improvement
and vice versa. The results showed that
the causal relationship between the export
sophistication index and private investment
operates one-way, with a one-year time lag.
Thus, an increase in the export sophistication
level in Morocco leads to an increase in
investment (Figure 8.8).
8.2 Government Policies to AddressMarket Failures in Innovation
Morocco’s low export complexity and
sophistication performances can be
explained by the theory of market failure,
advanced by Hausmann, Hwang and
Rodrik (2007). Morocco’s first sophistication
phase was above that of Egypt and Thailand.
According to the theory of market failures,
2021222324252627282930
5000 5500 6000 6500 7000 7500 8000 8500
Priv
ate
inve
stm
ent (
% G
DP)
Sophistication index EXPY (constant 2005 PPP GDP)
Figure 8.8: Private investment rate (percentage of GDP) - Sophistication Index
(1980-2010)
Source: The Observatory of Economic Complexity andWorld Bank, 2013
2.5
3.0
3.5
4.0
4.5
5.0
5.5
-2.5 -1.5 -0.5 0.5 1.5 2.5
GD
P pe
r ca
pita
, PPP
(con
stan
t 201
1 in
tern
atio
nal $
)
Complexity index
Figure 8.7: Complexity index and incomeper capita (2011)
Source: The Observatory of Economic Complexity andWorld Bank, 2013
M O R O C C O ’ S G R OW T H D I A G N O S T I C220
the Moroccan economy’s growth per capita
should have been higher than that of these
two countries. However, Thailand and other
middle-income countries have succeeded in
innovating and achieving much more rapid
growth. Market failures, which aggravate
the initial export sophistication shortcomings,
could explain the relatively low level of
sophistication.
8.2.1 Industrial Policies and Strategies
In order to emerge from the agricultural
economy stage, Morocco initiated many
industrial policies following independence
ranging from import substitution policies in
the 1960s, to government investment in the
industrial sector during the 70s97, support to
exporting industries during the 1980s or the
sector policies of the 2000s. The country has
always deployed substantial resources to
support the structural transformation of its
economy.
Central government has always played
a determining role in the Moroccan
economy’s industrialization effort. To
help new investors to overcome the possible
failures of information and innovation
markets, the Moroccan government has
established several support agencies and
structures: the Morocco Export Centre
(Centre Maroc Export) for export promotion
established in 1976, the Moroccan Export
Insurance Company (SMAEX) established
in 1989, the National SME Promotion
Agency (ANPME) established in 2002,
the Moroccan Agency for Investment
Development (AMDI) established in 2009
and the Moroccan Innovation Centre (CMI)
established in 2011.
Donors have also supported Morocco
in its program to upgrade the industrial
sector (Programme de mise à niveau,
PMN). Established in 1998, the PMN
was the main instrument for upgrading
firms in the early years of its operation98.
The program receives support from the
European Union under the 1995 Euro-
Mediterranean Free Trade Agreement. It was
designed as a transitional agreement to
help local firms which are increasingly affected
by international competition.
97 During the 1973-1977 plan, and beyond its incentive role, the State intervened more decisively in the industrialsector as a promoter and an entrepreneur.98 Euro Maroc Entreprise (EME) is a European Commission-financed program, with an operational budget of EUR 13.3 million. It was established to help upgrade Moroccan SMEs through actions aimed at improving the competitiveness of Moroccan firms (strategic diagnosis and specific upgrade actions such as the improvementof production management, support to certification, commercial development, etc.) and actions aimed at improving the entrepreneurial environment, in partnership with professional associations (sectoral studies,information/sensitization seminars for firms, export promotion activities, search for partnerships, etc.). The EMEprogram ended on 30 June 2004. The “PME - MEDA II modernization” progam, which lasted until 2008, took overfrom the latter. www.eme.ma

221M O R O C C O ’ S G R OW T H D I A G N O S T I C
However, the results of industrial policies
launched since the 60s remain modest
in relation to the initially set objectives.
Industrial policies have not completely
succeeded in transforming supply structures
and setting the Moroccan economy on a
new growth path, in which the agricultural
sector and technology-intensive exports play
an important role.
Consequently, in order to revitalize the
industrial sector and respond to the
changing international situation, Morocco
has embarked on a new more modern and
innovative industrial strategy. The National
Industrial Acceleration Plan for 2014-2020
succeeds the National Industrial Emergence
Plan (PNEI) launched in 2009 and which
enabled the country to develop new industries
such as aeronautics or automobile manufac-
turing by attracting large groups like Renault
or Bombardier. In this regard, this new strategy
aims to build on, consolidate and develop the
successes already achieved in the Moroccan
industrial sector. This plan will be based on
key measures with the following objectives i)
creating a new momentum and a new
relationship between large firms and SMEs, ii)
strengthening industry’s position as the
major source of jobs, especially for youths iii)
optimizing the social and economic benefits
of public procurement through industrial
compensation. The new plan will also help
to support the transition from the informal to
the formal sector with the establishment of
a full-fledged mechanism for integrating the
Very Small Enterprise (VSE), to meet the
key challenge of matching skills with the
needs of firms and the establishment of a
public industrial investment fund (Fonds de
Développement Industriel, FDI), which will be
provided with a package of MAD 20 billion
by the year 2020.
In order to respond more effectively to
growing competition on world markets,
Moroccan authorities have endeavored
to ensure that national producers increase
their exports and improve product quality.
In 2009, the Department of Industry
launched a participatory reflection process
called “Maroc Innovation,” including several
key sector actors, especially the Ministries
concerned, firms, academia and financial
operators. In addition to strengthening the
Moroccan innovation ecosystem, this initiative
sought to establish by 2014 (i) 1000 Moroccan
patents and (ii) more than 200 innovative
start-ups.
The “Maroc Innovation” initiative consisted
of analyzing the Moroccan innovation
value chain and defining the actions to be
taken to enable this value chain to operate
as effectively as possible. Thirteen action
measures were defined under this initiative,
classified into four areas : (i) governance and
the legislative framework, (ii) infrastructure,
(iii) financing and support to firms, and (iv)
mobilization of talents. The main measures
are (a) modernization and adaptation of the
legislative framework; (b) establishment of

M O R O C C O ’ S G R OW T H D I A G N O S T I C222
the Moroccan Centre for Innovation: first
one-stop shop with three different financing
instruments; (c) stimulation of the venture
capital sector; (d) establishment of new
clusters: innovation centers in collaboration
with four universities to run the R&D projects
and encourage start-up incubation; and (e)
the establishment of the first Moroccan
innovation club (social exchange network).
To this end, venture capital is a means
of financing innovation and start-ups in
Morocco. Investment capital emerged in
the early 90s with the establishment of the
Moussahama management company, which,
for a long time, was the sole operator on the
market. Starting from the year 2000, other
funds emerged, including the Moroccan
Association of Capital Investors (AMIC) created
the same year. Founded at the initiative of four
operators, AMIC today brings together most
of Morocco’s capital investment actors.
The Moroccan venture capital industry is
rapidly expanding. Cumulative investments
in 2012 stood at 3.6 billion dirhams for
140 firms and a 16% internal rate of
return. The sector’s dynamism encouraged
the government to actively engage in the
development of capital investment, especially
through the Savings and Investment Fund
(CDG). The activity’s development potential
also attracted banking establishments, which
established their own investment capital
funds. In less than 15 years, the cumulative
capital investment amounts raised by
Moroccan industry rose from MAD 400 million
to 8 billion dirhams.
However, to-date, the contribution of
venture capital to innovation financing
remains low. Only 2% of amounts raised are
allocated to seed capital funding. Morocco’s
four seed capital funds account for MAD 300
M of the capital raised. Investments remain
highly concentrated in a few sectors of activity,
mainly the services and construction sectors,
and the chemical and agri-food industries.
In terms of geographical concentration, Greater
Casablanca’s share is gradually declining in
favor of other regions, especially the Tangier-
Tetouan region.
Morocco has a system to safeguard
intellectual property that guarantees the
protection of local innovations and does
not constitute an obstacle to the legal
importation or entry of foreign technologies.
It applies the rule of international exhaustion
for foreign patents.
Morocco has also signed several
treaties on the protection of trademarks,
licenses and patents (Figure 8.9).
However, further efforts are required in
this area. Indeed, Morocco’s position in
the Global Competitiveness Report in 2013
shows that the country needs to implement
urgent reforms in the area of intellectual
property safeguards. Morocco is ranked
90th out of 148 countries, with a score
lower than the average (3.3 over 7).

223M O R O C C O ’ S G R OW T H D I A G N O S T I C
8.2.2 Industrial Parks – A Key Factor inSector Policy
In the late 1970s, Morocco launched a
program to establish industrial zones.
However, because of the structural changes
of the early 1980s, this program was
unsuccessful. In the Emergence Plan, the
Government made provision for industrial
parks, technology parks and free trade zones
to serve both national and foreign investors.
Morocco has almost 70 industrial zones
(less than half of which are operational),
two operational offshore zones, and
seven technology parks. These parks are
situated in densely populated towns (of more
than one million inhabitants), with universities
and faculties that can meet the human
resource requirements of firms.
Currently, three of the 7 technology
parks are operational, others are
under construction and some are not
fully operational. Opened in 2007, the
Casablanca Technology Park is the first
Moroccan industrial park specialized in
ICTs. The Rabat and Oujda Technology
Parks have also been operational since
2008 and 2011.
Industrial parks offer investors substantial
tax incentives as well as remarkable
140 178 150 177 135 152 169
520
732 782 834 856 882 880
660
910 9321 011 991 1 034 1 049
0
200
400
600
800
1000
1200
2005 2006 2007 2008 2009 2010 2011
Moroccan patent Foreign patentNational patent
Figure 8.9: Trend of patent registrationapplications since 2005
Source: Ministry of Industry, Trade, investment and theDigital Economy
Box 8.1: Tangier Free Trade Zone: AZone of the Future
The Tangier Free Trade Zone (FTZ) was
established in 2001 and developed
mainly from foreign capital attracted
by tax incentives, infrastructure and
geographical situation.
The ZFT hosts many firms, which are
developing many new products and
activities. According to a global ranking
on "Global Free Zones of the Future,
2012-2013", the zone tops the "best port
free zone" category and is ranked sixth
in "zones of the future".
In addition to manufacturing activities,
this zone hosts service activities, which
are developing rapidly.
M O R O C C O ’ S G R OW T H D I A G N O S T I C224
Technology parks offer investors sub-
stantial tax incentives as well as out-
standing infrastructure. These parks have
geostrategic sites, with high national and
international connectivity, close to airports,
high-speed train and railway lines, and
highways. Investors setting up shop in the
Rabat Technology City (Technopolis) are
granted a 20% effective IT rate, a 0% CT
rate for the first 5 years and a 50% discount
thereafter, and highly competitive monthly
rents. Morocco’s four offshore parks are
managed and run by MedZ Sourcing, a
subsidiary of the Savings and Management
Fund (CDG), by authorization of the Ministry
responsible for Industry.
It is still too early to assess the impact of
the establishment and operationalization
of the Moroccan technology parks.
8.3 Other Explanatory Factors of Morocco’s Mixed Performance in Innovation and Sophistication
Even though the Moroccan Government
has identified and supported sectors
quite similar to those described by Rodrik
& Hausmann as being sophisticated and
likely to rapidly generate productivity
gains, these gains have not been observed
over the last few decades99. Rodrik states
that developing countries can obtain
productivity gains by supporting industries
which benefit from unconditional convergence.
The important question is to determine why
the growth of sectors which experienced
rapid productivity gains in other countries
was inadequate in Morocco. What should
the country do to further sophisticate its
economy?
Morocco’s limited structural transformation
and its position in the product space
(which shows an absence of connection
between sectors) emphasizes the lack of
coordination in the shift to new, innovative
and more sophisticated activities. The
product space shows that Morocco produces
goods competitively in a handful of peripheral
sectors100 in the product space: natural
resources, the clothing and textile sector, as
well as the electronics and machinery sector.
There are many government export
promotion and innovation support entities
and agencies. However, coordination
between the latter and the public and
private sectors seems inadequate. It is
essential to build the monitoring capacity
of national export activity, identify the
constraints and address them efficiently. In
addition, it is strongly advisable to involve the
private sector more closely in order to better
guide Government efforts in industrial policy
implementation.
99 See the preceding section: innovation and structural transformation results.100 Situated at the edges of product space.

225M O R O C C O ’ S G R OW T H D I A G N O S T I C
The Government should play a catalytic
role in encouraging firms to innovate or
engage in sophisticated and higher value-
added activities. However, Government
support to innovation must be done in a
comprehensive manner by limiting
coordination-related problems among
the various public entities altogether as
well as with the private sector. An export
and innovation-driven growth model must
be established as a national priority and
supported by additional actions. Thus,
macroeconomic stability, trade financing,
investments in R&D and trade logistics are
only examples.
In addition to providing essential public
goods (a competent and transparent
administration, an independent judicial
system, education, health and infrastructure),
the Government should contribute to
addressing the coordination issues that
constitute a constraint to the production of
new goods and the structural transformation
of the country’s economy101. Hausmann
(2005) shows that technological progress
requires policies which go beyond the
fundamentals for two reasons. First, the
initial production structure impacts on future
productivity growth. More specifically, countries,
whose export basket is more sophisticated,
experience more rapid growth and even
succeed in exceeding their initial income
level (Hausmann, 2009). Secondly, market
failures, especially “learning-by-doing” in
certain sectors, knowledge dissemination
and coordination failure risks indicate that
the government has a key role to play in
order for firms to produce more sophisticated
goods and thus boost growth.
In conclusion, it is essential to rethink the
issues of consistency of public strategies
and policies and coordination in the
economic sphere. To achieve this, Morocco
could capitalize on the experiences of other
countries, especially emerging Asian countries
which, with sophistication levels similar to
those of Morocco in the 1960s and 1980s,
now appear among the most sophisticated
countries globally (South Korea, China, and
Malaysia)102.
101 AfDB, 2012.102 Ibid.

Appendices
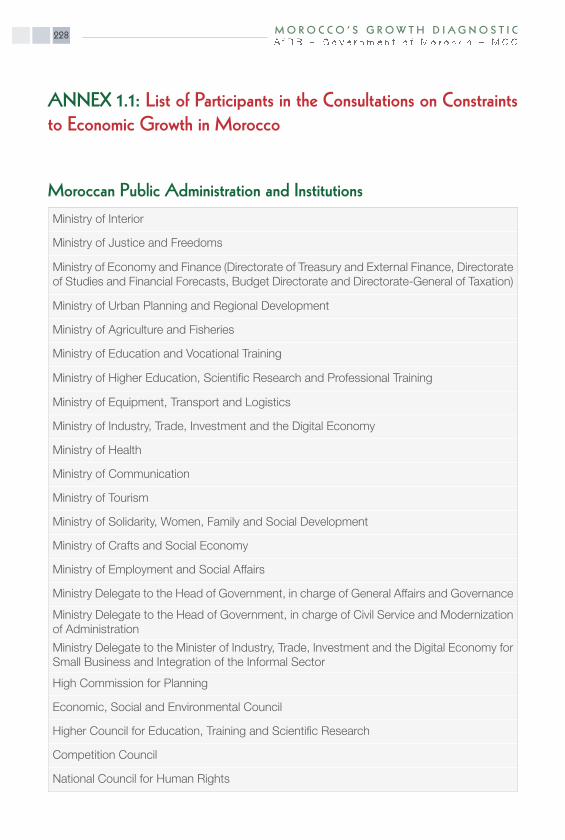
M O R O C C O ’ S G R OW T H D I A G N O S T I C228
ANNEX 1.1: List of Participants in the Consultations on Constraintsto Economic Growth in Morocco
Moroccan Public Administration and InstitutionsMinistry of Interior
Ministry of Justice and Freedoms
Ministry of Economy and Finance (Directorate of Treasury and External Finance, Directorateof Studies and Financial Forecasts, Budget Directorate and Directorate-General of Taxation)
Ministry of Urban Planning and Regional Development
Ministry of Agriculture and Fisheries
Ministry of Education and Vocational Training
Ministry of Higher Education, Scientific Research and Professional Training
Ministry of Equipment, Transport and Logistics
Ministry of Industry, Trade, Investment and the Digital Economy
Ministry of Health
Ministry of Communication
Ministry of Tourism
Ministry of Solidarity, Women, Family and Social Development
Ministry of Crafts and Social Economy
Ministry of Employment and Social Affairs
Ministry Delegate to the Head of Government, in charge of General Affairs and Governance
Ministry Delegate to the Head of Government, in charge of Civil Service and Modernizationof Administration
Ministry Delegate to the Minister of Industry, Trade, Investment and the Digital Economy forSmall Business and Integration of the Informal Sector
High Commission for Planning
Economic, Social and Environmental Council
Higher Council for Education, Training and Scientific Research
Competition Council
National Council for Human Rights
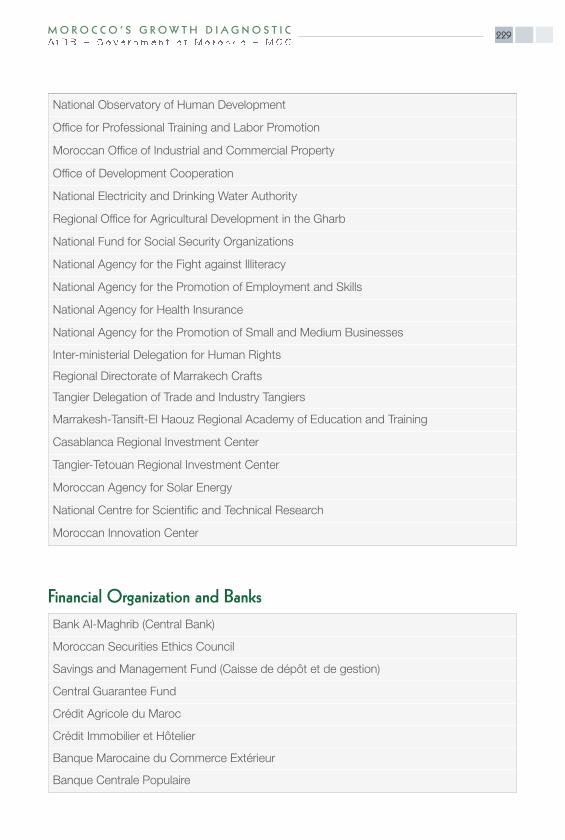
229M O R O C C O ’ S G R OW T H D I A G N O S T I C
National Observatory of Human Development
Office for Professional Training and Labor Promotion
Moroccan Office of Industrial and Commercial Property
Office of Development Cooperation
National Electricity and Drinking Water Authority
Regional Office for Agricultural Development in the Gharb
National Fund for Social Security Organizations
National Agency for the Fight against Illiteracy
National Agency for the Promotion of Employment and Skills
National Agency for Health Insurance
National Agency for the Promotion of Small and Medium Businesses
Inter-ministerial Delegation for Human Rights
Regional Directorate of Marrakech Crafts
Tangier Delegation of Trade and Industry Tangiers
Marrakesh-Tansift-El Haouz Regional Academy of Education and Training
Casablanca Regional Investment Center
Tangier-Tetouan Regional Investment Center
Moroccan Agency for Solar Energy
National Centre for Scientific and Technical Research
Moroccan Innovation Center
Financial Organization and BanksBank Al-Maghrib (Central Bank)
Moroccan Securities Ethics Council
Savings and Management Fund (Caisse de dépôt et de gestion)
Central Guarantee Fund
Crédit Agricole du Maroc
Crédit Immobilier et Hôtelier
Banque Marocaine du Commerce Extérieur
Banque Centrale Populaire
M O R O C C O ’ S G R OW T H D I A G N O S T I C230
Technical and Financial Partners and Other International Organization
Delegation of the African Development Bank in Morocco
Delegation of the World Bank in Morocco
Delegation of the French Development Agency in Morocco
Delegation of the European Commission in Morocco
Delegation of the United States Agency for International Development in Morocco
Private SectorGeneral Confederation of Enterprises of Morocco
Moroccan Confederation of Agriculture and Rural Development
General Confederation of Enterprises of Morocco-Northern Region
Professional Association of Financing Companies
Association of Women Heads of Businesses in Morocco
Investors’ Association of the Tangier Export Processing Zone
Moroccan Association of Textiles and Clothing Industries
Moroccan Association of Intercontinental Road Transporters
Association of Cattle Breeders in Gharb
Artichoke Producers Association in Gharb
National Federation of the Milling Industry
Tangier Chamber of Commerce, Industry and Services
Tangier Textiles Operator (Vita Couture)
Renault-Nissan Tangier
Equipment Manufacturers in the Tangier Free Zone: Polydesign Systems Company andSnop Company Morocco
Sofitel Marrakesh
Abwab Consultants
231M O R O C C O ’ S G R OW T H D I A G N O S T I C
Lahcen Achy, Professor at the National Institute of Statistics and Applied Economics
Bakass Fatima, Professor at the National Institute of Statistics and Applied Economics
Bougroum Mohammed, Professor at the University Cadi Ayyad - Marrakesh, Faculty of Law,Economics and Social Sciences
El Abbassi Idriss, Professor at the University Mohammed V - Rabat, Faculty of Law, Economicsand Social Sciences
Karim Mohamed, Professor at the University Mohammed V - Rabat, Faculty of Law, Economicsand Social Sciences
Nmili Mohammed, Professor at the Sidi Mohamed Ben Abdellah University - Fez, Faculty ofLaw, Economics and Social Sciences
Tounsi Said, Professor at the University Mohammed V - Rabat Faculty of Law, Economicsand Social Sciences
ESPOD Association (Starting Point Space)
Alliance of Labor Training and Action for Children (ATFAL)
People’s Bank Foundation
Democratic Association of Moroccan Women
Moroccan Association of Support for the Promotion of Small Businesses
Moroccan Organization for Human Rights
Young Entrepreneur Foundation
Moroccan Family Planning Association
Oyoune Nissaiya Observatory
Moroccan Association of Human Rights
Associative Space
Civil Society Organizations
Representatives of Trade Union Bodies
Academic Staff
Several Resource Persons
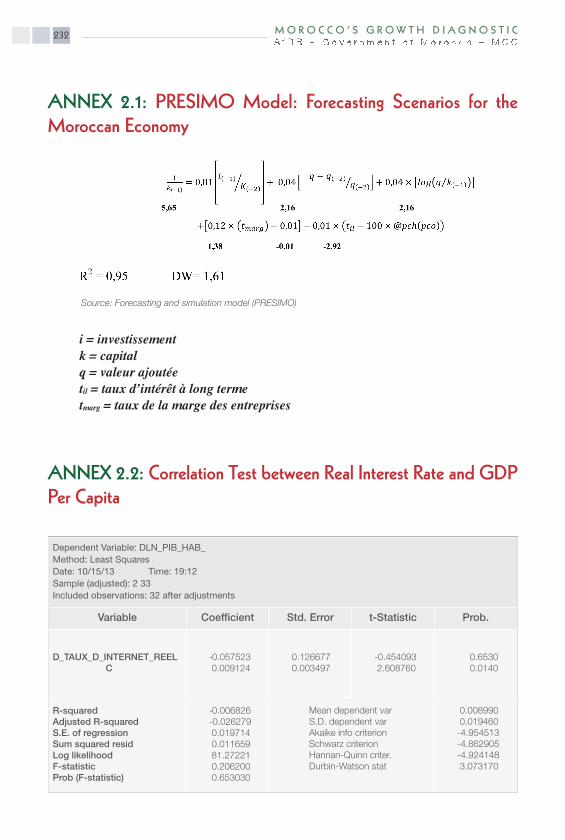
M O R O C C O ’ S G R O W T H D I A G N O S T I C232
ANNEX 2.1: PRESIMO Model: Forecasting Scenarios for the Moroccan Economy
i = investissement
k = capital
q = valeur ajoutée
til = taux d’intérêt à long terme
tmarg = taux de la marge des entreprises
ANNEX 2.2: Correlation Test between Real Interest Rate and GDPPer Capita
Dependent Variable: DLN_PIB_HAB_Method: Least SquaresDate: 10/15/13 Time: 19:12Sample (adjusted): 2 33Included observations: 32 after adjustments
Variable Coefficient Std. Error t-Statistic Prob.
D_TAUX_D_INTERNET_REEL C
-0.0575230.009124
0.1266770.003497
-0.4540932.608760
0.65300.0140
R-squaredAdjusted R-squaredS.E. of regressionSum squared residLog likelihoodF-statisticProb (F-statistic)
-0.006826-0.0262790.0197140.01165981.272210.2062000.653030
Mean dependent varS.D. dependent varAkaike info criterionSchwarz criterionHannan-Quinn criter.Durbin-Watson stat
0.0089900.019460-4.954513-4.862905-4.9241483.073170
Source: Forecasting and simulation model (PRESIMO)

233M O R O C C O ’ S G R OW T H D I A G N O S T I C
ANNEX 2.3: Correlation Test between Real Interest Rate and PrivateInvestment
Dependent Variable: DLN_INVEST_PRIVE_Method: Least SquaresDate: 10/14/13 Time: 20:14Sample (adjusted): 2 33Included observations: 32 after adjustments
Variable Coefficient Std. Error t-Statistic Prob.
D_TAUX_D_INTERNET_REEL C
-0.4452420.006925
0.2116250.005843
-2.1039221.185297
0.04390.2452
R-squaredAdjusted R-squaredS.E. of regressionSum squared residLog likelihoodF-statisticProb (F-statistic)
0.1285780.0995310.0329340.03253964.850674.4264890.043873
Mean dependent varS.D. dependent varAkaike info criterionSchwarz criterionHannan-Quinn criter.Durbin-Watson stat
0.0058920.034706-3.928167-3.836558-3.8978012.064516
ANNEX 2.4: Granger Causality Test
Pairwise Granger Causality TestsDate: 10/14/13 Time: 17:43Sample: 1 30Lags: 4
Null Hypothesis: Std. Error F-Statistic Prob.
DLN_PIB_HAB_ does not Granger Cause DLN_CREDIT PIB_
DLN_CREDIT PIB_ does not Granger Cause DLN_PIB_HAB_25
0.84588
2.08196
0.5165
0.1309

M O R O C C O ’ S G R OW T H D I A G N O S T I C234
The econometric analysis of time series
always requires verification whether these
series are stationary, in other words, when
a series is stable around its average. For
that, we carried out an augmented Dickey-
Fuller test, without a trend, to verify the
stationarity of the income per capita level,
the number of road kilometers and the
number of railway kilometers over the
1980-2011 period 1980-20111. In table
A, the Dickey-Fuller test shows that
the series are not stable and the number of
intervals corresponds to 4. It is impossible
to reject the invalidity of a unit root; since
the ordinary least squares (OLS) method is
not valid. However, the Granger test can
be conducted to verify whether infrastructure
generates a higher income or vice-versa.
The results of table B indicate that the link
between road development and income
ANNEX 3.1: Ranking on Education System Quality, The GlobalCompetitiveness Report 2013-2014
ANNEX 4.1: Stationarity Test of Certain Types of Infrastructure andIncome Per Capita
Morocco Tunisia Jordan Malaysia Romania Turkey
Primary education quality 118 72 44 33 85 92
Higher education and training
102 73 56 46 59 65
Educational system quality 110 71 27 19 99 91
Quality of studies in Mathsand Sciences
52 31 30 27 57 101
Primary education enrolment 54 14 96 55 112 23
Secondary education enrolment 103 59 79 105 46 89
Higher education enrolment 106 71 70 62 39 46
Source: World Competitiveness Report 2013-2014
1 Data from WDI (World Bank) and the Ministry of equipment.

235M O R O C C O ’ S G R OW T H D I A G N O S T I C
Dickey-Fuller
Critical value
Variable to be tested 1% 5% 10%
Log GDP/pc 0.801 -3.736 -2.994 -2.628
MacKinnon P approximate value for Z(t) = 0.9917
Log km_road -1.348 -3.743 -2.997 -2.629
MacKinnon P approximate value for Z(t) = 0.6067
Log km_train -0.889 -3.743 -2.997 -2.629
MacKinnon P approximate value for Z(t) = 0.7915
Note: Log GDP/pc, logarithm of the GDP per capita in PPA (in 2005 constant $), log km, the logarithm of the numberof road kilometres
Table A: Results of the Augmented Dickey-Fuller Unit Root Test
Table B: Results of Causality Tests: income per capita and road kilometers
Granger causality Wald tests
Equation Excluded chi2 df Prob > chi2
Log PIB/habLog PIB/hab
Log KmALL
20.44720.447
44
0.0000.000
Log kmLog km
Log PIB/habALL
11.41311.413
44
0.0220.022
Table C: Results of Causality Tests: income per capita and railway kilometers
Source SS DF MS Number of obs = 32F (1, 30) = 60.28Prob > F = 0.0000R-squared = 0.6677Adj R-squared = 0.6566Root MSE = 0.11718
Model -827781431 1 -827781431
Residual -411939666 30 -013731322
Total 1.2397211 31 -039991003
Log PIB/hab Coef. Std. Err. t P>t (954 conf. Interval)
Log km 3.575819 0.4605469 7.76 0.000 2.635257 4.516382
_cons -18.99783 3.475335 -5.47 0.000 -26.09541 -11.90025
Granger causality Wald tests
Equation Excluded chi2 df Prob > chi2Log PIB/habLog PIB/hab
Log KmALL
2.35982.3598
44
0.6700.670
Log kmLog km
Log KmALL
8.92818.9281
44
0.0630.063
per capita functions in the two directions.
Table C indicates that railway development
has helped to raise the income per capita
level. Nevertheless, these results are to be
interpreted with extreme care, considering
the very low number ofobservations.

M O R O C C O ’ S G R OW T H D I A G N O S T I C236
Despite outstanding performances for
a number of exportable products,
for about ten years now, foreign trade
remains a weak point of the Moroccan
economy.
The degree of openness of the Moroccan
economy2, 86% in 2012, is above that of
all lower middle-income countries (LMIC)
and comparable to that of Romania.
Thus, Morocco is considerably exposed
to international income fluctuations.
Exports are geographically concentrated
and are characterized by lower-than-
expected growth. Indeed, 63% of exports
are shipped to Europe, while the index
for exports of goods and services3 an
increase in foreign sales equivalent to
that of higher middle-income countries
(HMIC), above those of Tunisia but far
below countries which capitalized on
their integration into the global economy
such as Malaysia, Turkey and Romania
(Figure A6.1).
As a percentage, the share of consumer
(textiles) and food products in exports
dropped sharply during the 2000s
decade in favor of semi-finished
products, fertilizers and phosphoric
acids, and to a lesser extent, industrial
equipment. This change reflects the
country’s industrialization process and,
as concerns the decrease in exports of
consumer goods, the expansion of
domestic demand for this category of
goods (Figures A6.2 and A6.3).
ANNEX 6.1: External Sources of Macroeconomic Risk
2 (X+M)/GDP.3 1990 base year =100.
0
50
100
150
200
250
1990
1991
1992
1993
1994
1995
1996
1997
1998
1999
2000
2001
2002
2003
2004
2005
2006
2007
2008
2009
2010
2011
2012
(X+M
)/GD
P
Egypt Jordan PRITI Malaysia
Morocco Romania Tunisia Turkey
Figure A6.1: Level of openness
Source: WDI
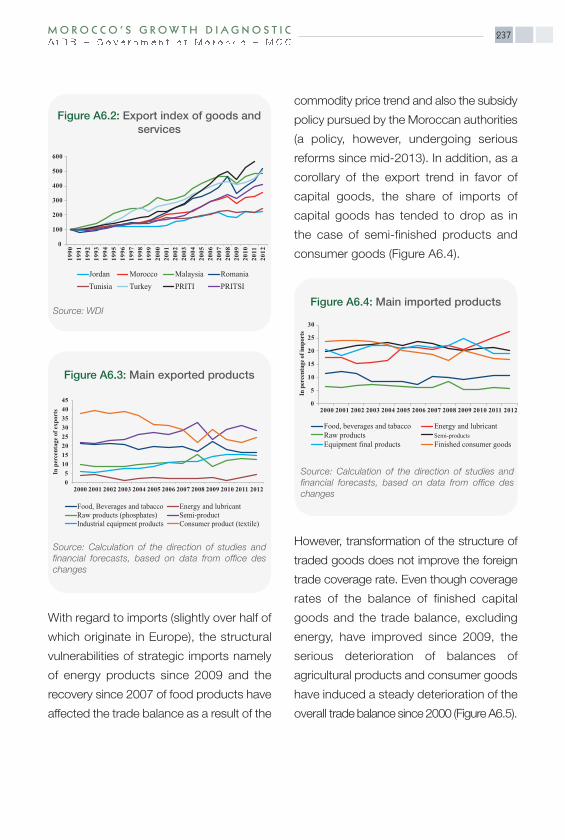
237M O R O C C O ’ S G R OW T H D I A G N O S T I C
With regard to imports (slightly over half of
which originate in Europe), the structural
vulnerabilities of strategic imports namely
of energy products since 2009 and the
recovery since 2007 of food products have
affected the trade balance as a result of the
commodity price trend and also the subsidy
policy pursued by the Moroccan authorities
(a policy, however, undergoing serious
reforms since mid-2013). In addition, as a
corollary of the export trend in favor of
capital goods, the share of imports of
capital goods has tended to drop as in
the case of semi-finished products and
consumer goods (Figure A6.4).
However, transformation of the structure of
traded goods does not improve the foreign
trade coverage rate. Even though coverage
rates of the balance of finished capital
goods and the trade balance, excluding
energy, have improved since 2009, the
serious deterioration of balances of
agricultural products and consumer goods
have induced a steady deterioration of the
overall trade balance since 2000 (Figure A6.5).
0
100
200
300
400
500
600
1990
1991
1992
1993
1994
1995
1996
1997
1998
1999
2000
2001
2002
2003
2004
2005
2006
2007
2008
2009
2010
2011
2012
Jordan Morocco Malaysia RomaniaTunisia Turkey PRITI PRITSI
Figure A6.2: Export index of goods andservices
Source: WDI
05
1015202530354045
2000 2001 2002 2003 2004 2005 2006 2007 2008 2009 2010 2011 2012
In p
erce
ntag
e of
exp
orts
Food, Beverages and tabacco Energy and lubricantRaw products (phosphates) Semi-productIndustrial equipment products Consumer product (textile)
Figure A6.3: Main exported products
Source: Calculation of the direction of studies and financial forecasts, based on data from office deschanges
0
5
10
15
20
25
30
2000 2001 2002 2003 2004 2005 2006 2007 2008 2009 2010 2011 2012
In p
erce
ntag
e of i
mpo
rts
Food, beverages and tabacco Energy and lubricantRaw products Semi-productsEquipment final products Finished consumer goods
Figure A6.4: Main imported products
Source: Calculation of the direction of studies and financial forecasts, based on data from office deschanges
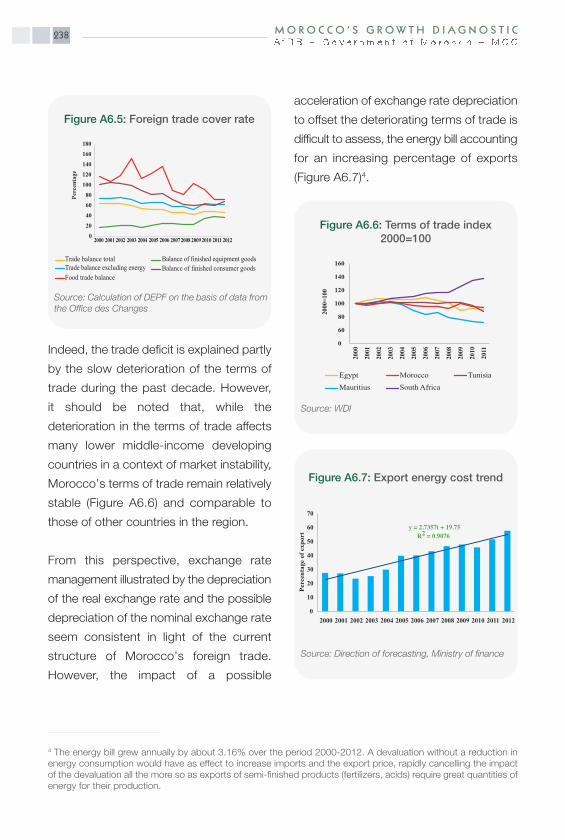
M O R O C C O ’ S G R OW T H D I A G N O S T I C238
Indeed, the trade deficit is explained partly
by the slow deterioration of the terms of
trade during the past decade. However,
it should be noted that, while the
deterioration in the terms of trade affects
many lower middle-income developing
countries in a context of market instability,
Morocco’s terms of trade remain relatively
stable (Figure A6.6) and comparable to
those of other countries in the region.
From this perspective, exchange rate
management illustrated by the depreciation
of the real exchange rate and the possible
depreciation of the nominal exchange rate
seem consistent in light of the current
structure of Morocco’s foreign trade.
However, the impact of a possible
acceleration of exchange rate depreciation
to offset the deteriorating terms of trade is
difficult to assess, the energy bill accounting
for an increasing percentage of exports
(Figure A6.7)4.
4 The energy bill grew annually by about 3.16% over the period 2000-2012. A devaluation without a reduction inenergy consumption would have as effect to increase imports and the export price, rapidly cancelling the impactof the devaluation all the more so as exports of semi-finished products (fertilizers, acids) require great quantities ofenergy for their production.
0
20
40
60
80
100
120
140
160
180
2000 2001 2002 2003 2004 2005 2006 20072008 20092010 2011 2012
Perc
enta
ge
Trade balance totalTrade balance excluding energyFood trade balance
Balance of finished equipment goodsBalance of finished consumer goods
Figure A6.5: Foreign trade cover rate
Source: Calculation of DEPF on the basis of data fromthe Office des Changes
0
60
80
100
120
140
160
2000
2001
2002
2003
2004
2005
2006
2007
2008
2009
2010
2011
2000
=100
EgyptMauritius
MoroccoSouth Africa
Tunisia
Figure A6.6: Terms of trade index2000=100
Source: WDI
y = 2.7357t + 19.75R2 = 0.9076
0
10
20
30
40
50
60
70
2000 2001 2002 2003 2004 2005 2006 2007 2008 2009 2010 2011 2012
Perc
enta
ge o
f exp
ort
Figure A6.7: Export energy cost trend
Source: Direction of forecasting, Ministry of finance

239M O R O C C O ’ S G R OW T H D I A G N O S T I C
5 The level of net foreign assets required is expressed as NFA0 = -NFAT/(1+r)T - CA1/(1+rCA1(1+r)2CAT(1+r) ca = g+π(1+g)(1+π)nfa (2) where CA designates the current account balance, NFA, net foreign assets and r the discountedrate (interest rate). In equilibrium net foreign assets must be equal to the sum of future discounted deficits. i.e. acurrent account balance to equilibrium long-term GDP (ca) equal to
where c a = , and, n fa= g and π respectively designate the growth rate in terms of volume and the inflation rate.
ANNEX 6.2: Balance of Payments Current Account Deficit Sustainability
1) Current Account Deficit Sustainability
A current balance of payments deficit
is sustainable if the value of the net
foreign assets of the central bank and
commercial banks guarantees the sum
of updated values of future deficits5.
The fulfilment of this condition is
subject to the formulation of a growth
and inflation scenario, to be able to
determine the deficit level as a
percentage of the GDP of the trade
balance and the current account balance
compatible with the net foreign asset
level reached before the 2008 financial
crisis.
Moroccan authorities project an
average annual potential growth rate
of 5.5% between 2014 and 2018
(Figure A6.8). The inflation rate has been
contained since the early 2000s and the
continuation of the current monetary policy
must maintain price increases below 2.5%
during the next three years (Figure A6.9).
The objective of a stabilized current
account deficit in the short-term at -5%
of GDP due to the partial revival of activity
in Europe, also seems realistic. These
assumptions are consistent with the
macroeconomic stabilization policies
implemented by Morocco since the early
1990s.
ca = g+ π(1+g)(1+π)
nfa (2)
Où ca = , et, nfa= g et π désignent respectivement
le taux de croissance en volume et le taux d’in"ation
4.5
5.8
0
1
2
3
4
5
6
7
2011 2012 2013 2014 2015 2016 2017 2018
Figure A6.8: Forecasts of real GDP growthrates in percentage
Source: HCP

M O R O C C O ’ S G R OW T H D I A G N O S T I C240
Based on this scenario, the reduction
of the current account deficit to its 2004
level, the deficit acceleration year, and
the rebuilding of net foreign assets to their
level of 2007, requires, a substantial
increase in external debt in order to close
the sustainability gap. External debt is
expected to return to its 2003 level of
about 36% of GDP compared to 29.3%
in 20116.
6 This simulation does not take exchange rate variations into account.
12.49
1.280
2
4
6
8
10
12
14
1980 1982 1984 1986 1988 1990 1992 1994 1996 1998 2000 2002 2004 2006 2008 2010 2012
Figure A6.9: Inflation, consumption price(annual percentage)
Table A6.1: Reduction of the currentbalance of payment deficit
Source: World Bank
Simulation of return to asustainable current accountbalance (-5 %) in 2014
2014 2015 2016
Growth rate 5% 5.5% 5.5%
Inflation rate 1.9% 2% 2.5%
Real interest rate 1.9% 2.5% 3%
Net foreign assets (% GDP),2007 34.5% 34.5% 34.5%
Net foreign assets (% GDP),2012 19.3% 19.3% 19.3%
Current account balance (% GDP) stabilising the external position in 2007
2.2% 2.5% 2.6%
Balance of goods and services(% GDP) stabilising the externalposition in 2007
-0.3% -0.5% -0.4%
Increase in external debt with acurrent account deficit of -5%and Net foreign assets of 2007
36.5% 36.8% 36.9%
Current account balance (% GDP) stabilising the external position in 2012
1.2% 1.3% 1.4%
Balance of goods and services(% GDP) stabilising the externalposition in 2012
-0.6% -0.5% -0.4%
Increase in external debt with acurrent account deficit of -5%and Net foreign assets of 2012
35.5% 35.6% 35.7%
Source: Authors' calculations
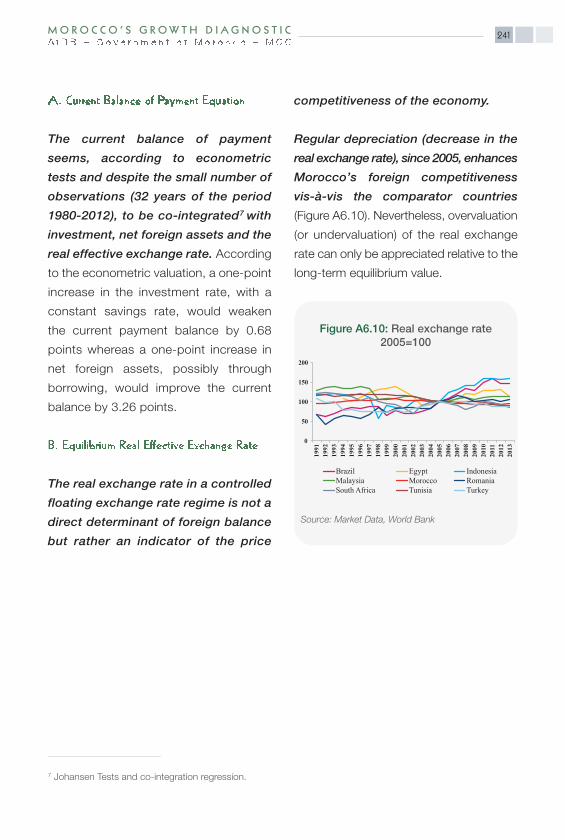
241M O R O C C O ’ S G R OW T H D I A G N O S T I C
The current balance of payment
seems, according to econometric
tests and despite the small number of
observations (32 years of the period
1980-2012), to be co-integrated7 with
investment, net foreign assets and the
real effective exchange rate. According
to the econometric valuation, a one-point
increase in the investment rate, with a
constant savings rate, would weaken
the current payment balance by 0.68
points whereas a one-point increase in
net foreign assets, possibly through
borrowing, would improve the current
balance by 3.26 points.
The real exchange rate in a controlled
floating exchange rate regime is not a
direct determinant of foreign balance
but rather an indicator of the price
competitiveness of the economy.
Regular depreciation (decrease in the
real exchange rate), since 2005, enhances
Morocco’s foreign competitiveness
vis-à-vis the comparator countries
(Figure A6.10). Nevertheless, overvaluation
(or undervaluation) of the real exchange
rate can only be appreciated relative to the
long-term equilibrium value.
0
50
100
150
200
1991
1992
1993
1994
1995
1996
1997
1998
1999
2000
2001
2002
2003
2004
2005
2006
2007
2008
2009
2010
2011
2012
2013
Brazil Egypt IndonesiaMalaysia Morocco RomaniaSouth Africa Tunisia Turkey
Figure A6.10: Real exchange rate2005=100
Source: Market Data, World Bank
7 Johansen Tests and co-integration regression.

M O R O C C O ’ S G R OW T H D I A G N O S T I C242
It follows from the co-integration
study (see Annex 6.3) that the
equilibrium real effective exchange
rate (REER) depends on the gap
between investment and savings,
foreign assets and terms of trade.
With respect to the long-term balance
between 1996 and 2007, the REER
observed was probably overvalued, but
since 2011, it seems undervalued,
which contradicts the idea of a current
overvaluation of the dirham.
80
90
100
110
120
130
140
1981
1982
1983
1984
1985
1986
1987
1988
1989
1990
1991
1992
1993
1994
1995
1996
1997
1998
1999
2000
2001
2002
2003
2004
2005
2006
2007
2008
2009
2010
2011
2012
Real effective exchange rates (2005 = 100)Real effective exchange rate of balance
Figure A6.11: Equilibrium real effective exchange rate
Source: Market Data World Bank and authors' calculations

243M O R O C C O ’ S G R OW T H D I A G N O S T I C
ANNEX 6.3: Johansen Co-integration Test, Real Exchange Rate
HypothesizedN°. of CE (s)
Eigenvalue Trace Statistic Critical Value0.05
Prob.**
None*At most 1At most 2At most 3
0.7124090.5195220.3824860.105390
77.1783039.7918017.802603.341010
63.8761042.9152525.8721112.51798
0.00260.09920.35730.8338
RER-0.0804650.1338130.021805
-0.159282
AEN-1.6035320.416624
-0.470780-0.382925
TOT -6.853374-4.58785525.794737.569468
INV/EPAR -9.5288561.4162608.6280478.604123
TREND 0.212313
-0.0897530.1194590.009865
Unrestricted Adjustment Coefficients (alpha):
D (INDICE_DU_D (AVOIRS_EX
D TOT)D (RATIO_INVE
-0.8986830.515093
-0.004207-0.382925
-1.582334-0.0844290.025868
-0.058393
-0.2046930.396870
-0.012309-0.018871
0.2481000.1514020.009168
-0.011450
1 Cointegrating Equation (s): Log likelihood -8.302137
Normalized cointegrating coefficients (standard error in parentheses)
RER1.000000
AEN19.92839(2.29079)
TOT 85.17240(47.6110)
INV/EPAR 118.4228(32.7071)
TREND -2.638585(0.44116)
Adjustment coefficients (standard error in parentheses)
D (IND) 0.072312(0.03969)
D (IND) -0.041447(0.01423)
D (IND) 0.000339(0.00082)
D (IND) -0.002807(0.00158)
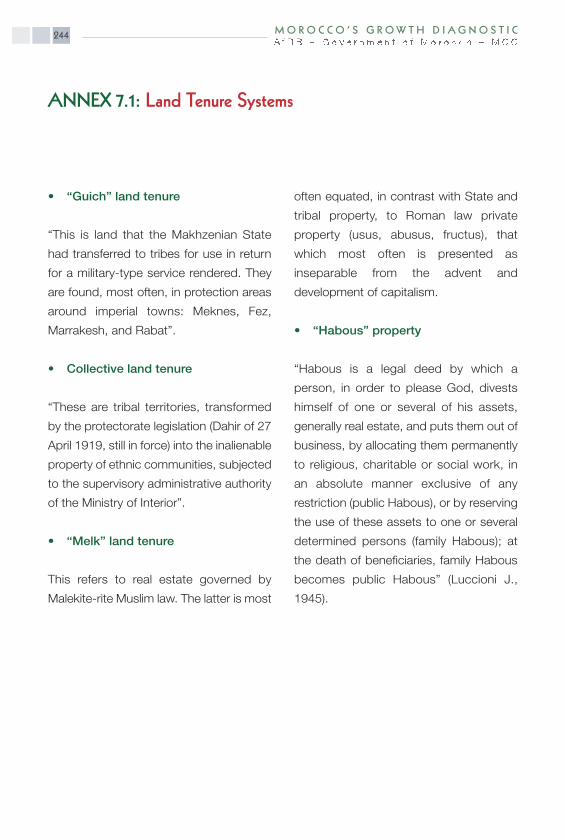
M O R O C C O ’ S G R OW T H D I A G N O S T I C244
• “Guich” land tenure
“This is land that the Makhzenian State
had transferred to tribes for use in return
for a military-type service rendered. They
are found, most often, in protection areas
around imperial towns: Meknes, Fez,
Marrakesh, and Rabat”.
• Collective land tenure
“These are tribal territories, transformed
by the protectorate legislation (Dahir of 27
April 1919, still in force) into the inalienable
property of ethnic communities, subjected
to the supervisory administrative authority
of the Ministry of Interior”.
• “Melk” land tenure
This refers to real estate governed by
Malekite-rite Muslim law. The latter is most
often equated, in contrast with State and
tribal property, to Roman law private
property (usus, abusus, fructus), that
which most often is presented as
inseparable from the advent and
development of capitalism.
• “Habous” property
“Habous is a legal deed by which a
person, in order to please God, divests
himself of one or several of his assets,
generally real estate, and puts them out of
business, by allocating them permanently
to religious, charitable or social work, in
an absolute manner exclusive of any
restriction (public Habous), or by reserving
the use of these assets to one or several
determined persons (family Habous); at
the death of beneficiaries, family Habous
becomes public Habous” (Luccioni J.,
1945).
ANNEX 7.1: Land Tenure Systems

245M O R O C C O ’ S G R O W T H D I A G N O S T I C
ANNEX 8.1: Composition of the Export Basket, 1995 and 2010
Source: The Observatory of Economic Complexity
1995
2010
Total Country Trade: $7.14B
Total Country Trade: $20.3B


247M O R O C C O ’ S G R OW T H D I A G N O S T I C
References
• Agence française de développement (2005) Les programmes de mise à niveau des
entreprises. Tunisie, Maroc, Sénégal. Rapport.
• Aghion, P. et al. (2009) The Effects of Entry on Incumbent Innovation and Productivity.
Review of Economics and Statistics, Vol. 90, No.1, pp. 20-32.
• Aghion, P., Howitt, P. & Murtin, F. (2010) : Le bénéfice de la santé : Un apport des théories
de la croissance endogène. Revue de l’OFCE, N°. 112, pp. 87-108.
• Akesbi, N. (2011a) Le Plan Maroc Vert : une analyse critique. Questions d’économie
marocaine, ouvrage collectif, Association marocaine de sciences économiques, éd. Presse
universitaire du Maroc, Rabat.
• Akesbi, N. (2011b) La nouvelle stratégie agricole du Maroc annonce-t-elle l’insécurité
alimentaire du pays ? Confluences Méditerranée, 2011/3, N°. 78.
• Bajeddi, M. (2007) Développement agricole et régimes fonciers au Maroc. Disponible sur :
http://perso.menara.ma/bajeddi/Developpement_agricole_et_regimes_fonciers_au_Maroc.htm.
(Consulté le 20 avril 2014).
• Bakhti,J., Brillet. J.L., Sadiki, M.A. (2011) Présentation du modèle PRESIMO, Modèle de
prévision et de simulation des politiques économiques de l’économie marocaine. Haut-
Commissariat au Plan, janvier 2011.
• Baldwin, R. E. (2000) Regulatory Protectionism, Developing Nations, and a Two-Tier World
Trade System, in Brookings Trade Forum 2000, Susan Collins and Dani Rodrik (eds.),
Washington, D.C. Brookings Institution Press.
• Bank Al-Maghrib (2012) Rapport Annuel, pp. 72-75.
• Banque africaine de développement (2012) Étude comparative sur les politiques d’exportation
du Maroc, de la Tunisie, de l’Egypte et la Corée du Sud. Rapport.
• Banque Mondiale (2003) Maroc, Évaluation du Système Juridique et Judiciaire. Rapport.
• Banque Mondiale (2006) Promouvoir la croissance et l’emploi dans le Royaume du Maroc.
Rapport.
• Banque Mondiale (2006) Rapport sur l’observation des normes et codes (RONC) Maroc :
Insolvabilité et droits des créanciers.
• Banque Mondiale (2008) Marchés fonciers pour la croissance économique au Maroc :
Héritage et Structures Foncières au Maroc. Les contraintes structurelles et institutionnelles
à l’émergence d’un marché efficient du foncier au Maroc (Volume I). Rapport.
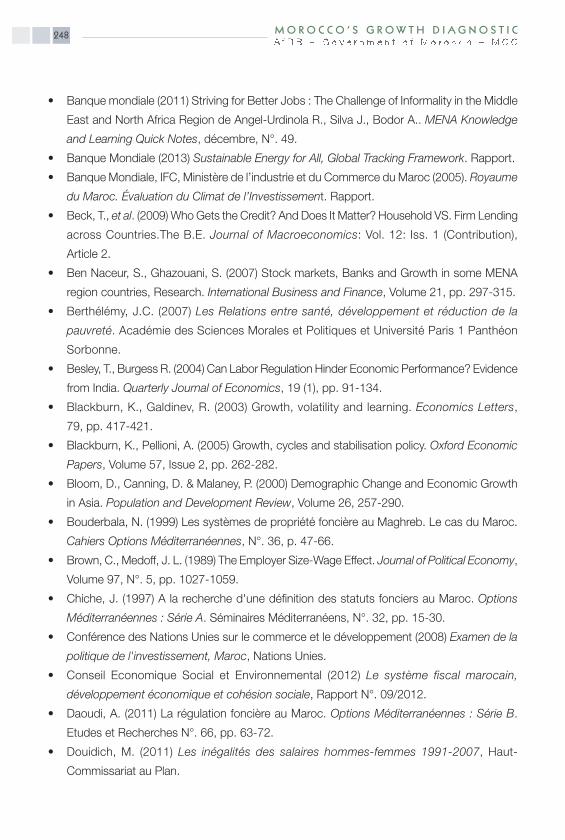
M O R O C C O ’ S G R OW T H D I A G N O S T I C248
• Banque mondiale (2011) Striving for Better Jobs : The Challenge of Informality in the Middle
East and North Africa Region de Angel-Urdinola R., Silva J., Bodor A.. MENA Knowledge
and Learning Quick Notes, décembre, N°. 49.
• Banque Mondiale (2013) Sustainable Energy for All, Global Tracking Framework. Rapport.
• Banque Mondiale, IFC, Ministère de l’industrie et du Commerce du Maroc (2005). Royaume
du Maroc. Évaluation du Climat de l’Investissement. Rapport.
• Beck, T., et al. (2009) Who Gets the Credit? And Does It Matter? Household VS. Firm Lending
across Countries.The B.E. Journal of Macroeconomics: Vol. 12: Iss. 1 (Contribution),
Article 2.
• Ben Naceur, S., Ghazouani, S. (2007) Stock markets, Banks and Growth in some MENA
region countries, Research. International Business and Finance, Volume 21, pp. 297-315.
• Berthélémy, J.C. (2007) Les Relations entre santé, développement et réduction de la
pauvreté. Académie des Sciences Morales et Politiques et Université Paris 1 Panthéon
Sorbonne.
• Besley, T., Burgess R. (2004) Can Labor Regulation Hinder Economic Performance? Evidence
from India. Quarterly Journal of Economics, 19 (1), pp. 91-134.
• Blackburn, K., Galdinev, R. (2003) Growth, volatility and learning. Economics Letters,
79, pp. 417-421.
• Blackburn, K., Pellioni, A. (2005) Growth, cycles and stabilisation policy. Oxford Economic
Papers, Volume 57, Issue 2, pp. 262-282.
• Bloom, D., Canning, D. & Malaney, P. (2000) Demographic Change and Economic Growth
in Asia. Population and Development Review, Volume 26, 257-290.
• Bouderbala, N. (1999) Les systèmes de propriété foncière au Maghreb. Le cas du Maroc.
Cahiers Options Méditerranéennes, N°. 36, p. 47-66.
• Brown, C., Medoff, J. L. (1989) The Employer Size-Wage Effect. Journal of Political Economy,
Volume 97, N°. 5, pp. 1027-1059.
• Chiche, J. (1997) A la recherche d'une définition des statuts fonciers au Maroc. Options
Méditerranéennes : Série A. Séminaires Méditerranéens, N°. 32, pp. 15-30.
• Conférence des Nations Unies sur le commerce et le développement (2008) Examen de la
politique de l'investissement, Maroc, Nations Unies.
• Conseil Economique Social et Environnemental (2012) Le système fiscal marocain,
développement économique et cohésion sociale, Rapport N°. 09/2012.
• Daoudi, A. (2011) La régulation foncière au Maroc. Options Méditerranéennes : Série B.
Etudes et Recherches N°. 66, pp. 63-72.
• Douidich, M. (2011) Les inégalités des salaires hommes-femmes 1991-2007, Haut-
Commissariat au Plan.
249M O R O C C O ’ S G R OW T H D I A G N O S T I C
• Elidrissi, A. (2013) La question foncière au Maroc entre la trivialité et le concret, 6ème édition.
Séminaire d’actualité immobilière, Casablanca.
• Favara, G. (2003) An Empirical Reassessment of the Relationship between Financial
Development and Economic Growth. IMF Working paper N°. 03/123.
• Fogli, A., Perri, F. (2013) Macroeconomic Volatility and External Imbalances. Federal Reserve
Bank of Minneapolis, NBER, CEPR, October.
• Mourji, F., Bousselhami, N. (2004) Salaire minimum, salaire d’efficience et productivité : le
poids des institutions. Communication préparée pour le Colloque “firm productivity, trade
and development” Université de la Méditerranée / Aix – Marseille II, 2004.
• Guillaumont, J. S., Kpodar, K.R. (2004) Développement financier, instabilité financière et
croissance économique. CERDI, Etudes et Documents.
• Gwartney, J.D, Lawson, R.A. (2006) The impact of tax policy on economic growth, income
distribution, and allocation of taxes. Social Philosophy and Policy, Volume 23, Issue
02, pp. 28-52.
• Hammoumi, M. (2014) La gouvernance réglementaire au Maroc : des enjeux qui appellent
une réforme urgente. Revue de droit, N° double 16-17, éd. Almaarif Aljadida, Rabat.
• Hanushek, E., Ludger, W. (2012) Do Better Schools Lead to More Growth? Cognitive Skills,
Economic Outcomes, and Causation. Journal of Economic Growth, Volume 17, pp. 267-321.
• Hausmann, R. (2009) The Building Blocks of Economic Complexity. CID Working Paper
N°. 186.
• Hausmann, R., Hwang J., Rodrik D. (2005) What you Export Matters. NBER Working
Paper N°. 11905.
• Hausmann, R., Hwang J., Rodrik D. (2007) What you Export Matters. Journal of Economic
Growth, Volume 12, N°. 1, pp. 1-25.
• Hausmann, R., Klinger, B., Wagner, R. (2008) Doing Growth Diagnostics in Practice:
A ‘Mindbook’. Document de travail de la Harvard University, CID N°. 177.
• Hausmann, R., Pritchett, L., Rodrik, D. (2004) Growth Accelerations. Manuscript, Inter-
American Development Bank.
• Hausmann, R., Rodrik, D., Velasco, A. (2005) Growth Diagnostics? CID Working Paper N°. 177.
• Haute Instance du Dialogue National sur la Réforme du Système Judiciaire du Maroc, (2013)
La Charte de la réforme du système judiciaire. Rapport.
• Hellmann, T., Murdock, K., Stiglitz, J. (2000) Liberalization, moral hazard in banking, and
prudential regulation: are capital requirements enough? American Economic Review,
Volume 90, N°. 1, pp. 147-165.
• Hidalgo, C., et al. (2007) The Product Space Conditions the Development of Nations. Science,
Volume 317, N°. 5837.

M O R O C C O ’ S G R OW T H D I A G N O S T I C250
• Instance Centrale de Prévention de la Corruption (2011) Bonne gouvernance entre la situation
actuelle et les dispositions de la nouvelle constitution de 2011. Rapport.
• Kee, H. L., Nicita, A, Olarreaga, M. (2009) Estimating trade restrictiveness indices. Economic
Journal, Volume 119, pp. 172-199.
• Kumar, A., Manuela, F. (2005) Enterprise Size, Financing Patterns, and Credit Constraints
in Brazil. Document de travail de la Banque mondiale N°. 49.
• Lahcen, A. (2013) En quête d’une efficacité industrielle. Disponible sur : www.economica.ma
(Consulté le 29 avril 2014).
• Lane, P. R., Milesi-Ferretti. G. (2002) Long-Term Capital Movements. IMF Working Paper
(WP/01/107).
• Lehmann, A. (2002) Foreign Direct Investment in Emerging Markets: Income, Repatriations
and Financial Vulnerabilities. IMF Working Paper N°. 02/47.
• Machouri, N. (2012) Le secteur des transports et le développement durable. Université
Mohammed V, Faculté des lettres et des sciences humaines, Maroc.
• Mathisen, J., Pellechio, J.A. (2006) Using the Balance Sheet Approach in Surveillance: the
Balance Sheet Approach in Surveillance: Framework, Data Sources, and Data Availability.
IMF Working Paper N°. 06/100.
• McKinnon, R. (1973) Money and Capital in Economic Development. Brookings Institution
Press, Washington DC, pp. 1973-184.
• Melitz, M.J., (2003) The Impact of Trade on Intra-Industry Reallocations and Aggregate
Industry Productivity. Econometrica, Volume 71, pp.1695-1725.
• M'hassni, M., Feljy, M., Khalali, H. (2003) Le système foncier au Maroc. Une sécurité et un
facteur de développement durable, au milieu urbain et rural. 2ème Conférence Régionale de
la FIG, Marrakech.
• Ministère de l’Economie et des Finances du Maroc (2010) Les grandes réformes du Ministère
de l’Economie et des Finances, pp. 15-20.
• Ministère de l’Economie et des Finances du Maroc (2012) Code général des impôts. Direction
Générale des Impôts, Maroc.
• Ministère de l’industrie, du Commerce et des nouvelles technologies du Maroc, (2011) Etude
Juridique du Cadre Réglementaire de l’Innovation en vigueur au Maroc. Rapport.
• Ministère de la santé du Maroc (2012) Plan d’action 2012-2016 pour accélérer la réduction
de la mortalité maternelle et néonatale, Fin du Compte à rebours 2015 (Rapport avec l’appui
de l’UNICEF et l’UNFPA).
• Motthagi, L. (2011) Pourquoi la croissance est-elle si volatile dans la région MENA ? Disponible
sur : http://menablog.banquemondiale.org/croissance-volatile-mena (Consulté le 20 mars
2014).
251M O R O C C O ’ S G R OW T H D I A G N O S T I C
• Naanaa, A. (2002) Étude sur la taxation du travail au Maroc : le coin fiscal et social. Ministère
de l’Economie, des Finances et de la Privatisation, Direction de la Politique Economique
Générale, Document de travail N°. 77.
• Natke, P. (1999) Financial repression and firm self-financing of investment: empirical evidence
from Brazil. Applied Economics, Volume 31, pp. 1009-1019.
• Norton, R. (2009) Strategic Investment and Policy Priorities for a Competitive Agriculture in
Belize. Report prepared for the Inter-American Development Bank, Washington, D.C.
• Oulhaj L. et al. (2012) Evaluation de la stratégie agricole du Maroc (Plan Maroc Vert) à l’aide
d’un modèle d’équilibre général dynamique. Rapport Femise N°. 35-20.
• Ramey, G., Ramey, V. A. (1995) Cross-country evidence on the link between volatility and
growth. American Economic Review, Volume 85, N°. 5.
• Roubini, N., Sala-i-Martin,X. (1994) A growth model of inflation, tax evasion, and financial
repression. Journal of Monetary Economics, Volume 35, pp. 275-301.
• Zhang, J. (2005) The Effect of Life Expectancy on Fertility, Saving, Schooling and Economic
Growth: Theory an Evidence. Scandinavian Journal of Economics, Volume 107, pp. 45-66.
M O R O C C O ’ S G R OW T H D I A G N O S T I C252
Design and LayoutThe African Development BankYASSO creation: Hela chaouachiE-mail: [email protected]