
The PASCAL Visual Object Classes (VOC) Dataset and Challenge
Mark EveringhamLuc Van GoolChris WilliamsJohn Winn
Andrew Zisserman

The PASCAL VOC Challenge
� Challenge in visual objectrecognition funded byPASCAL network ofexcellence
� Publicly available dataset ofannotated images
� Main competitions in classification (is there an X in this image) and detection (where are the X’s)
� “Taster competitions” in segmentation and 2-D human “pose estimation” (2007-present)
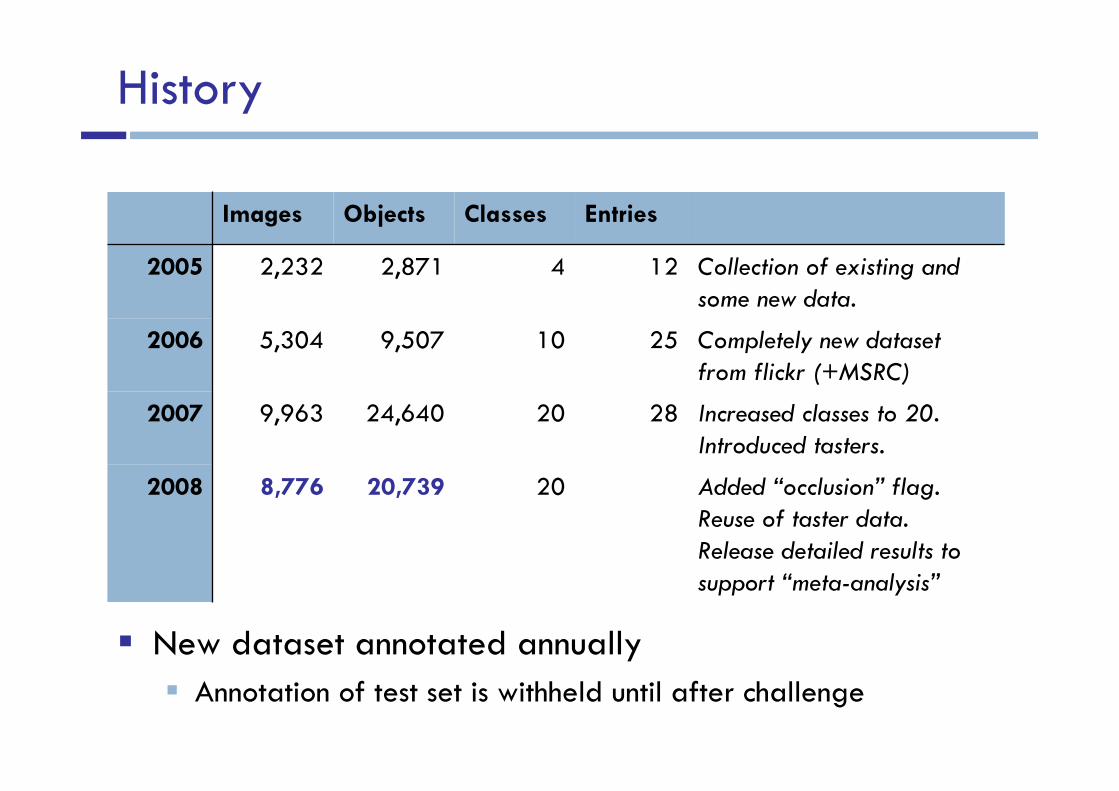
History
� New dataset annotated annually
� Annotation of test set is withheld until after challenge
20
20
10
4
Classes
Added “occlusion” flag.
Reuse of taster data.
Release detailed results to
support “meta-analysis”
Increased classes to 20.
Introduced tasters.
Completely new dataset
from flickr (+MSRC)
Collection of existing and
some new data.
122,8712,2322005
259,5075,3042006
2824,6409,9632007
20,7398,7762008
EntriesObjectsImages

Dataset Content
� 20 classes: aeroplane, bicycle, boat, bottle, bus, car, cat, chair, cow, dining table, dog, horse, motorbike, person, potted plant, sheep, train, TV
� Real images not filtered for “quality” (no CC tag)
� Complex scenes, scale, pose, lighting, occlusion, ...

Annotation
� Complete annotation of all objects
� Annotated in one session with written guidelines� High quality (?)
Truncated
Object extends beyond BB
Occluded
Object is significantly occluded within BB
Pose
Facing left
Difficult
Not scored in evaluation

Segmentation
� Subset of images manually segmented w.r.t. 20 classes (tri-map)
� 422 images - 1,215 objects (2007)

2-D “Pose” Annotation
� Subset of images annotated with location of body parts – head, hands, feet
� 322 images, 439 objects (2007)

Main Challenge Tasks
� Classification
� Is there a dog in this image?
� Evaluation by precision/recall
� Detection
� Localize all the people (if any) in this image
� Evaluation by precision/recall based on bounding box overlap

“Taster” Challenges
� “Segmentation”
� Label each pixel as class x or background
� Evaluation by pixel-wise accuracy (balanced for class priors)
� “Pose”
� Predict bounding boxes of body parts (2008 given bounding box of person)
� Evaluation by precision/recall

Attempts at Analysis
� Statistical Significance
� Does the output of methods differ significantly?
� Does the performance of methods differ significantly?
� What is being learnt?
� Are confusions between classes “intuitive”?
� Classification: learning Object or Scene?
� Detection: is there a bias towards large objects?
� Longitudinal Results
� Are methods getting better?

Classification: Does output differ significantly?
� 2006: McNemar’s test: Measure statistical significance of different error patterns between methods

Classification: Are errors “intuitive”?
� Class images:Highest ranked
� Class images:Lowest ranked
� Non-class images:Highest ranked
� “Structured” Texture?

20 40 60 8020
30
40
50
60
70
80
VOC2006
2007: AP (%)
2006
: A
P (
%)
INRIA_FlatINRIA_Genetic
Tsinghua
UVA_Bigrams
UVA_FuseAllUVA_MCIP
UVA_SFS
UVA_WGTXRCE
Classification: Are methods getting better?
� High correlation between results on 2007 and 2006 test data
� Some evidence of “over-fitting” – no method equalled results when trained on 2006 data

For Discussion...

Dataset
� Known Bias
� Some bias due to keyword-based image collection
� Images with only many small objects are discarded
� Segmentation/pose data is biased towards simple scenes with larger objects
� Small Objects/Context
� Objects unrecognizable inisolation are ignored in theevaluation but are includedin the annotation

Sustainability
� Cost & Difficulty
� Annotation is expensive: ~700 person hours for 2008
� New (test) data is required each year to support withholding test annotation
� Difficult to maintain high quality annotation with increased number of object classes (“cognitive load”)
� Availability of Data
� Becoming difficult to find examplesof certain categories on flickr
0
5,000
10,000
15,000
20,000
25,000
30,000
2005 2006 2007 2008

20 40 60 8020
30
40
50
60
70
80
VOC2006
2007: AP (%)
2006
: A
P (
%)
INRIA_FlatINRIA_Genetic
Tsinghua
UVA_Bigrams
UVA_FuseAllUVA_MCIP
UVA_SFS
UVA_WGTXRCE
Challenge
� “Longitudinal” Data
� New test set every year makesmeasuring improvement difficult
� Stop collecting more (test) data?
� “Pushing the curve”?
� Are we encouraging incrementalresearch?
� 17 classification methods in 2007were “bag of words”
0 0.1 0.2 0.3 0.4 0.5 0.6 0.7 0.8 0.9 10
0.1
0.2
0.3
0.4
0.5
0.6
0.7
0.8
0.9
1
recall
prec
isio
n
Top 5 results by AP
INRIA_Genetic (0.859)INRIA_Flat (0.845)
XRCE (0.840)TKK (0.822)
QMUL_LSPCH (0.808)

Annotation
� Bounding Boxes?
� More suitable for someobjects than others...
� Alternatives?
� Should we be annotating less data in more detail?
� Polygons, “sketches”, parts, pixels, ...?
� Should we be annotating more data in less detail?
� Weak supervision e.g. keywords at image level?
� Are we annotating the right data?
� Video?

Evaluation
� Useful to the community?
� Are we measuring the right thing?
� How to provide useful diagnosticinformation to guide research?
� Is the data too difficult?
� “Taster” Challenges
� Are the new challenges useful?
� What other tasks should beintroduced to stimulate research?
0 0.1 0.2 0.3 0.4 0.5 0.6 0.7 0.8 0.9 10
0.1
0.2
0.3
0.4
0.5
0.6
0.7
0.8
0.9
1
recall
prec
isio
n
UoCTTI (0.094)
TKK (0.072)
MPI_Center (0.031)INRIA_PlusClass (0.025)
MPI_ESSOL (0.016)
INRIA_Normal (0.002)


