
THE PENNINE WAY
Thursday, 2nd June 2016
John HusselbeeHead of Multi-Asset, Liontrust

• The global economic cycle is unsynchronised moving into 2016
• “Lower for longer,” with the risk of a global recession low
• US Federal Reserve unlikely to aggressively hike interest rates
• Potential for further QE in Europe & Japan
• Concern that currency is the tool to promote growth & defeat deflation
• Lower oil price is positive news for consumers & businesses
• Emerging Markets require commodity price stability
• Strong employment numbers in UK & US
• Europe has better growth & China’s service sector is growing
• BREXIT has weakened Sterling & may import inflation
• US Presidential Election – Trump vs Clinton?
• Volatility has increased which continues to favour active management
• Geopolitical risk in Syria, Iran & Middle East with potential oil price consequences
Source: Liontrust, 1st March 2016.
WHAT DID WE SAY LAST TIME?
2

Source: Lipper. FTSE 100 Index CR from 1st January 2016 to 25th May 2016. Past performance is not a guide to future performance.
%
A QUARTER OF TWO HALVES
3
FTSE 100 INDEX (PRICE RETURN)
5400
5600
5800
6000
6200
6400
6600
Jan-16 Feb-16 Mar-16 Apr-16 May-16
FTSE 100 CR
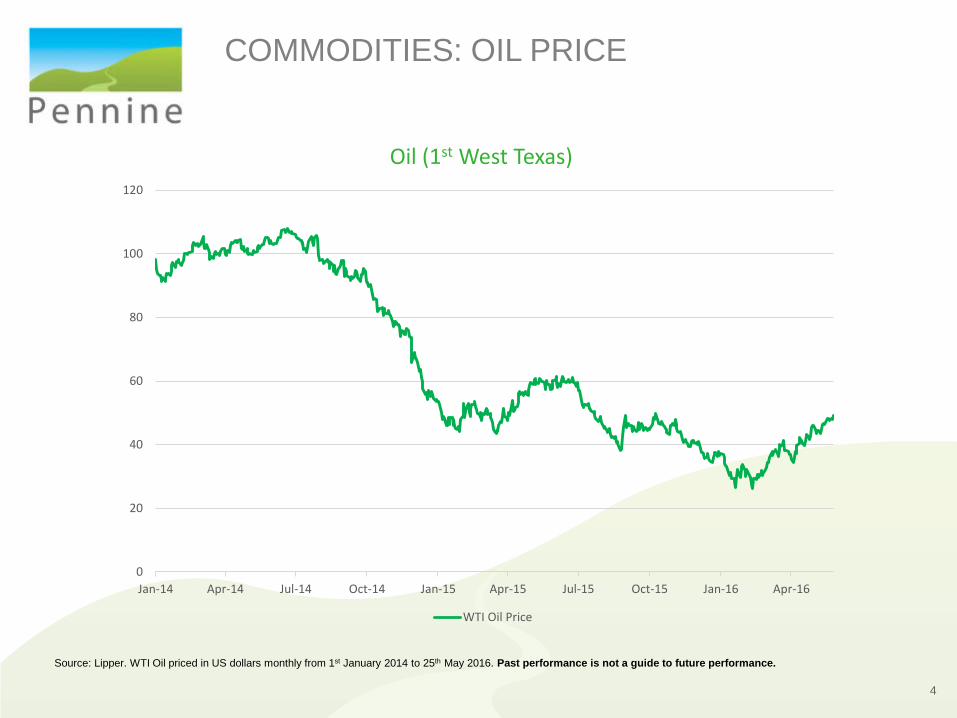
Source: Lipper. WTI Oil priced in US dollars monthly from 1st January 2014 to 25th May 2016. Past performance is not a guide to future performance.
Oil (1st West Texas)
COMMODITIES: OIL PRICE
4
0
20
40
60
80
100
120
Jan-14 Apr-14 Jul-14 Oct-14 Jan-15 Apr-15 Jul-15 Oct-15 Jan-16 Apr-16
WTI Oil Price

USD per 1 CNY
Source: Fuller Treacy Money plc. All rights reserved. US dollar per 1 Chinese yuan from 1st January 2007 to 25th May 2016.Past performance is not a guide to future performance.
CHINA: POLICY RESPONSE
5

Source: Google Trends
China Hard Landing
USING BIG DATA
6

7
INTERNATIONAL (CENTRAL BANK) RESCUE
Source: JPMorgan Asset Management, “Guide to the Markets - UK” Q2 2016, all data to 31st March 2016.

Source: Brookes, The Times, February 2016.
EU REFERENDUM
8

• The lights will go out
• Strawberries will only be available in the summer
• Broccoli prices could fall by up 0.3%
• Trigger avalanches, tidal waves and higher incidences of scattered showers
• Tax will increase on Easter Eggs
• Expats will have to return from Spain and France
• Leicester FC will not be able to compete in the Champions League
• We won’t win the Ryder Cup
9
A NATION OF SCAREMONGERS
Source: Liontrust.

10
SOME HARD FACTS
Source: BlackRock “BREXIT: Big Risk, Little Reward”, February 2016.

• Security – protecting our borders
• Social – migration & immigration
• Economics – contribution to EU budget
• Sovereignty – ability to self govern
11
THE REAL ISSUES

12
UK MIGRATION & IMMIGRATION
Source: International Migration Time Series and Long-Term International Migration Estimates, Office National Statistics.

13
UK EMPLOYMENT ATRECORD LEVELS
Source: Office National Statistics.

14
WHAT THE BREXITPOLLS SAY?
Source: BBC Website.
15
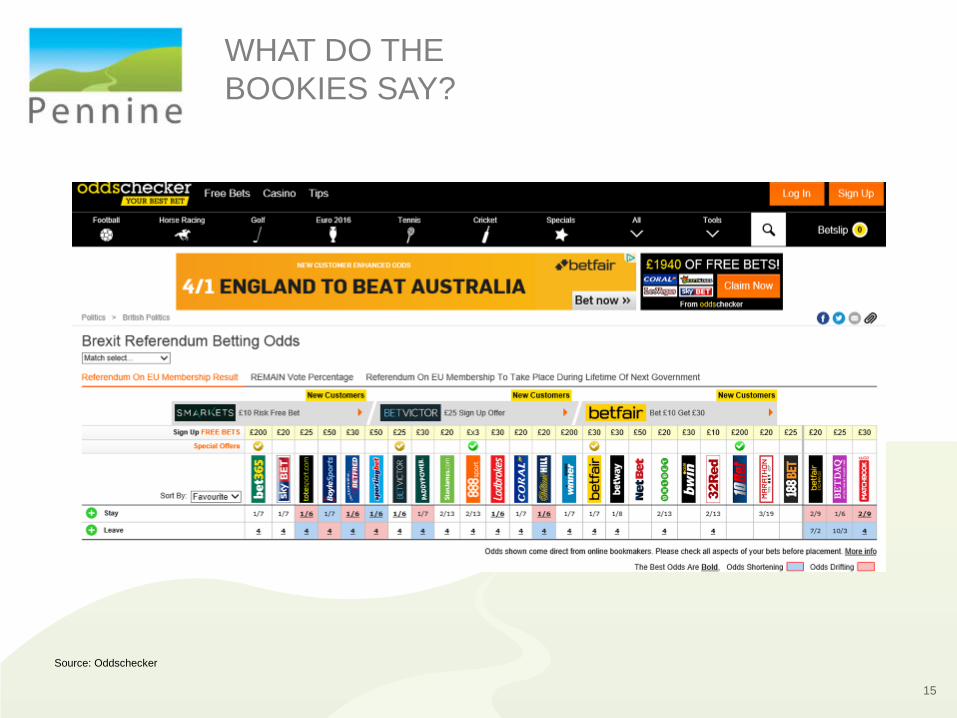
WHAT DO THEBOOKIES SAY?
Source: Oddschecker

16
Source: Brookes, The Times September 2014
SCOTTISH REFERENDUM
17
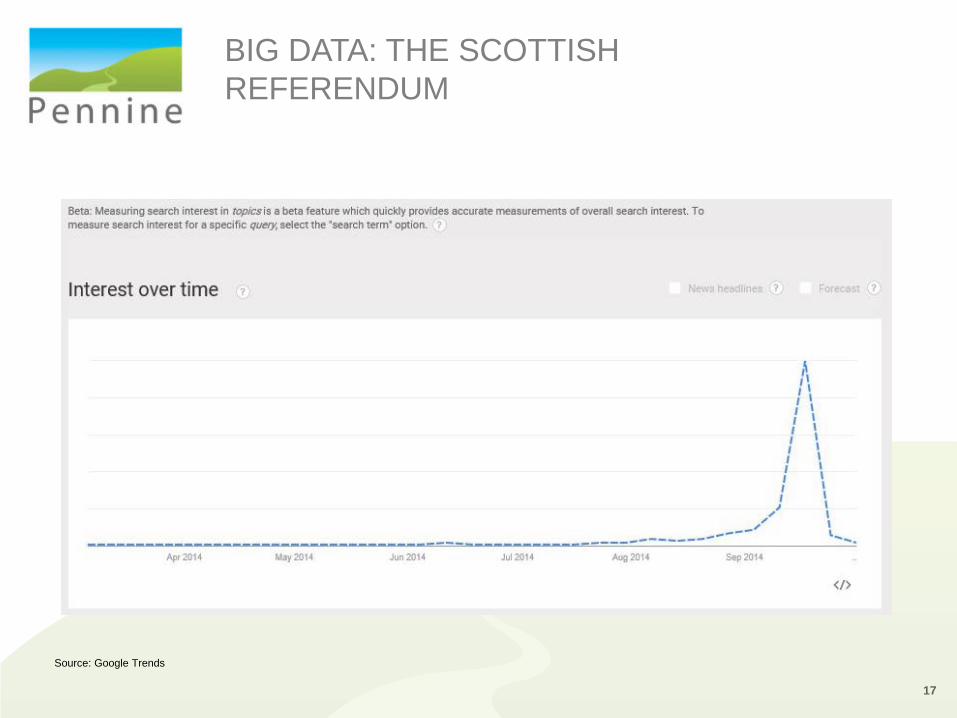
BIG DATA: THE SCOTTISH REFERENDUM
Source: Google Trends

18
TWO MONTHS LEADING UP TOTHE SCOTTISH REFERENDUM
Source: Bloomberg, 18th July 2014 to 18th September 2014.

19
THREE MONTHS POST THE SCOTTISH REFERENDUM
20
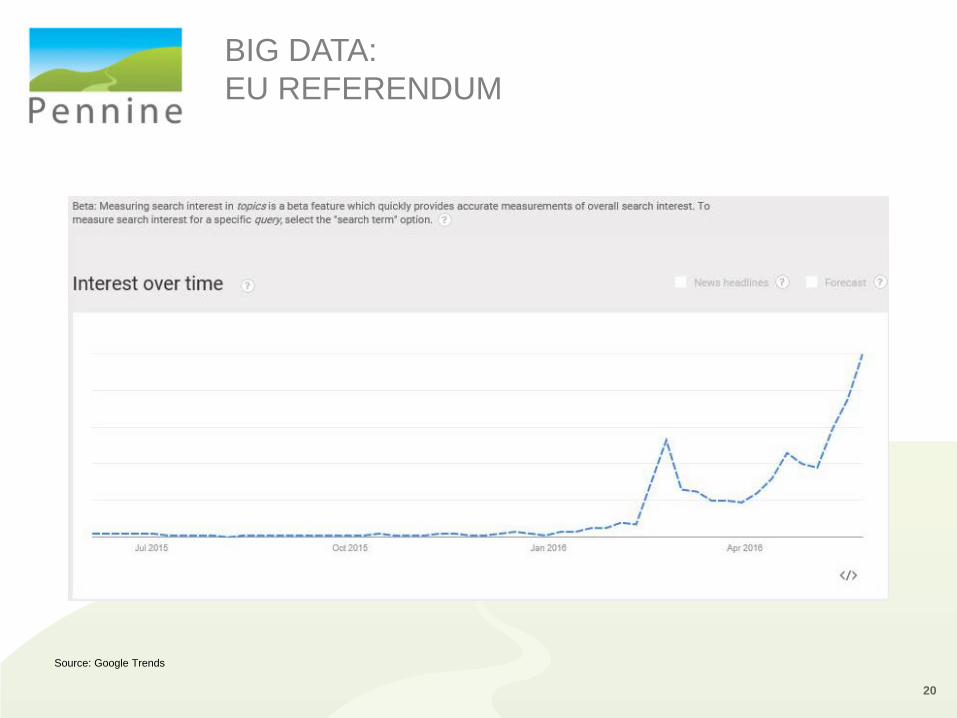
BIG DATA:EU REFERENDUM
Source: Google Trends

21
TWO MONTHS POSTEU REFERENDUM ANNOUNCEMENT
Source: Bloomberg, 19th February 2016 to 19th April 2016.

• Markets fall, UK equities biggest impact
• Sterling falls against US Dollar & Euro
• Safe haven asset classes rally – gold, government bonds
• Gilts suffer in the turmoil
• Bank of England forced to cut interest rates
• Credit spreads widen
• Fear rises as the trigger for EU break up
22
BREXIT SCENARIO
• Short term relief rally in markets, mostly priced in
• Sterling may strengthen against US Dollar & Euro
• Mid and Small Cap stocks in the UK outperform
• Q3 rebounds after impact of delayed investment and trade ahead of referendum
• US hikes interest rates
• Will other EU countries want the right to vote?
23
BREMAIN SCENARIO

24
VIX – INDEX OFFEAR & GREED
Source: Fuller Treacy Money. All rights reserved. 1st January 2008 to 25th May 2016. Past performance is not a guide to future performance.
OEX Volatility Index (VIX)

25
A SLOWER, LONGER RECOVERY

26
GLOBAL BUSINESS CYCLE
Source: Global Recession from DismalScientist.com. Copyright 2015. Moody’s Analytics, Inc., and/or its licensors and affiliates. All rights reserved.

27
US DOLLAR INDEX
Source: Fuller Treacy Money. All rights reserved. 1st January 2008 to 25th May 2016. Past performance is not a guide to future performance.
Dollar Index (DXY INDEX)

Source: Lipper, Liontrust. Indices of Value-added of the Tertiary Industry (preceding year=100), Current Quarter 31st March 1996 to 30th September 2015. Past performance is not a guide to future performance.
CHINA’S CHANGING ECONOMY
28
China GDP

29
EUROZONE IMPROVEMENT
Source: Moody’s Analytics, ECB

Source: Short-Term Energy Outlook, https://www.eia.gov/forecasts/steo/report/global_oil.cfm, February 2016. Past performance is not a guide to future performance.
World Liquid Fuels Production and Consumption Balance
OIL IN THE BALANCE
30

31
FORWARD LOOKING SURVEYS
Source: JPMorgan Asset Management “Guide to the Markets” Q2 2016, all data to 31st March 2016.

32
GLOBAL POLICY DIVERGENCE

33
WHERE ARE WE NOW?
Source: Lipper. FTSE 100 Index CR from 1st May 2007 to 25th May 2016. Past performance is not a guide to future performance.
3500
4000
4500
5000
5500
6000
6500
7000
7500
May-07 Feb-08 Nov-08 Aug-09 May-10 Feb-11 Nov-11 Aug-12 May-13 Feb-14 Nov-14 Aug-15
FTSE 100 CR
34
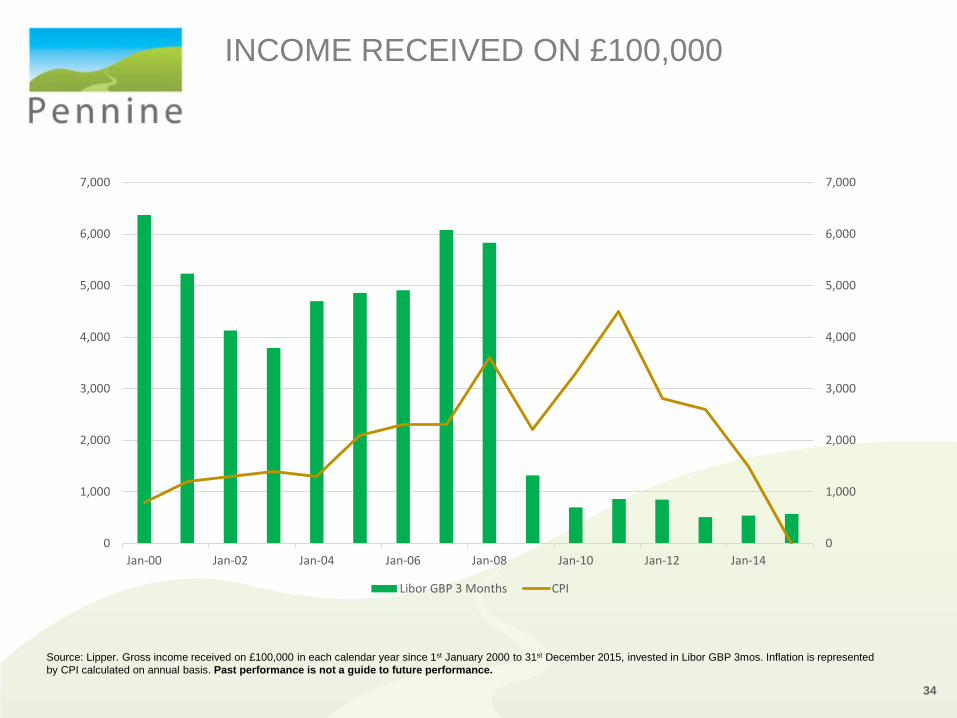
INCOME RECEIVED ON £100,000
Source: Lipper. Gross income received on £100,000 in each calendar year since 1st January 2000 to 31st December 2015, invested in Libor GBP 3mos. Inflation is represented by CPI calculated on annual basis. Past performance is not a guide to future performance.
0
1,000
2,000
3,000
4,000
5,000
6,000
7,000
0
1,000
2,000
3,000
4,000
5,000
6,000
7,000
Jan-00 Jan-02 Jan-04 Jan-06 Jan-08 Jan-10 Jan-12 Jan-14
Libor GBP 3 Months CPI
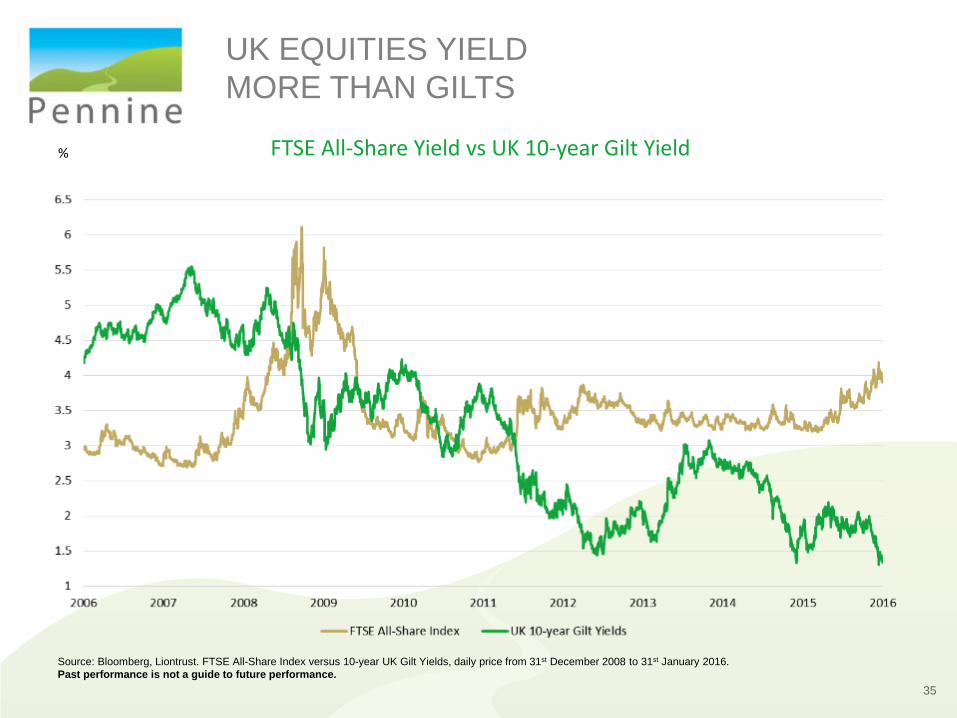
FTSE All-Share Yield vs UK 10-year Gilt Yield
Source: Bloomberg, Liontrust. FTSE All-Share Index versus 10-year UK Gilt Yields, daily price from 31st December 2008 to 31st January 2016.Past performance is not a guide to future performance.
%
UK EQUITIES YIELD MORE THAN GILTS
35

36
Source: FactSet, FTSE, Tullett Pregon, JPMorgan Asset Management, “Guide to the Markets – UK ” Q2 2016. Local currency returns, P/E ratios are forward P/E ratios. Forward P/E ratio is a bottom-up calculation based on the most recent price data divided by the mean consensus estimates for earnings in the next 12 months and is provided by FactSetMarket Aggregates. Return calculations shown in green are based on the total return index. Data as at to 31st March 2016.
THE UK MARKET IS NOT CHEAP
37
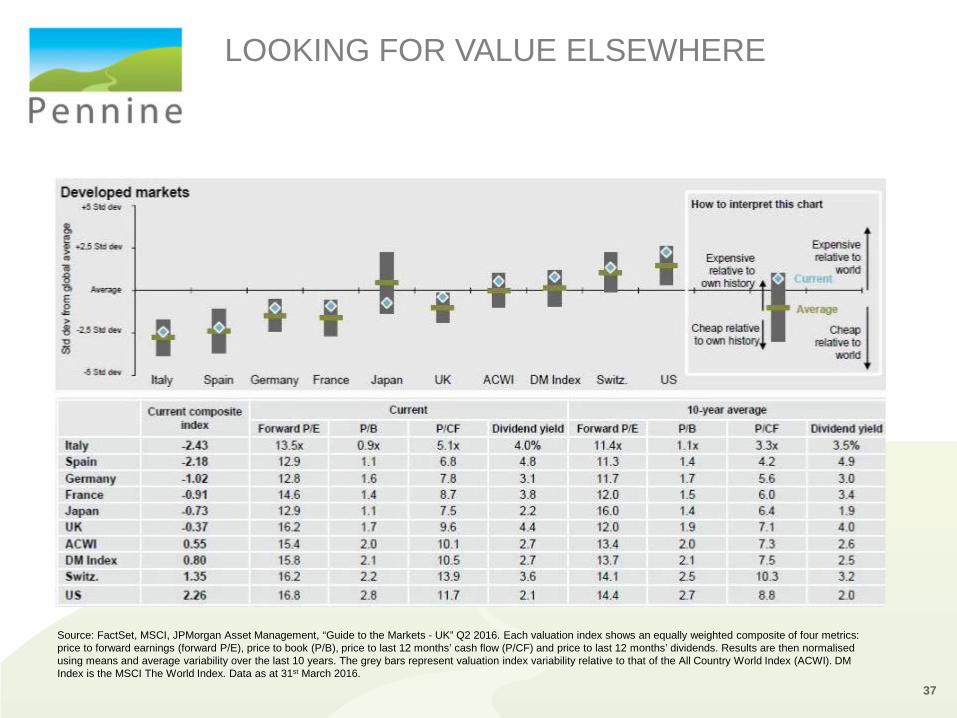
Source: FactSet, MSCI, JPMorgan Asset Management, “Guide to the Markets - UK” Q2 2016. Each valuation index shows an equally weighted composite of four metrics: price to forward earnings (forward P/E), price to book (P/B), price to last 12 months’ cash flow (P/CF) and price to last 12 months’ dividends. Results are then normalised using means and average variability over the last 10 years. The grey bars represent valuation index variability relative to that of the All Country World Index (ACWI). DM Index is the MSCI The World Index. Data as at 31st March 2016.
LOOKING FOR VALUE ELSEWHERE

38
Source: FactSet, MSCI, JPMorgan Asset Management, “Guide to the Markets - UK” Q2 2016. Each valuation index shows an equally weighted composite of four metrics: price to forward earnings (forward P/E), price to book (P/B), price to last 12 months’ cash flow (P/CF) and price to last 12 months’ dividends. Results are then normalised using means and average variability over the last 10 years. The grey bars represent valuation index variability relative to that of the All Country World Index (ACWI). Data as at 31st March 2016.
LOOKING FOR VALUEELSEWHERE

Source: Brookes, The Times, February 2016.
US PRESIDENTIALELECTION 2016
39
40
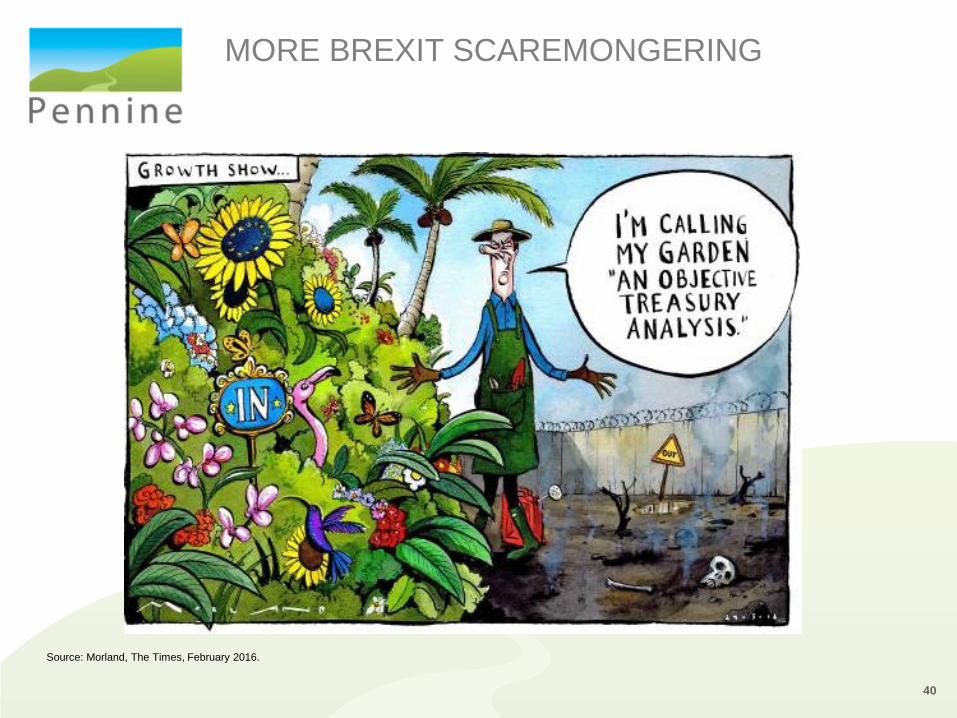
MORE BREXIT SCAREMONGERING
Source: Morland, The Times, February 2016.

• Global economic cycle remains unsynchronised moving into 2016
• Modest global growth & plenty of global liquidity maintains support for financial markets
• After US “lift-off,” Fed tone expected to remain more dovish
• Central Bank divergence favours regions & countries loosening monetary policy
• ECB willingness to extend extraordinary measures if required
• UK investors focus on BREXIT as well as when BoE will increase interest rates
• Japanese 'Abenomics' may require revision with lack of growth
• EM growth needs to be supported by commodity prices stabilisation
• Inflation outlooks improve as base effect of lower commodity prices fade
• Volatility expected to increase which favours active management
• Demand for income remains challenging in low interest rate environment
• High Yield, Strategic Bond & Alternative Strategies required to complimenttraditional sources of income
• Geopolitical risk in Syria, Iran and Middle East with potential oil price consequences
Source: Liontrust, 1st May 2016.
OUTLOOK
41

42
Source: FactSet, FTSE, JPMorgan Asset Management, “Guide to the Markets - UK” Q2 2016. For illustrative purposes only. Assumes all income is re-invested; returns calculated daily over the time period assuming no return on each of the specified number of best days. Data as at 31st March 2016.
STAYING THE COURSE
43
Liontrust Investment Solutions Limited (LISO), which is 100% owned by Liontrust Asset Management, is authorised and regulated by the Financial Conduct Authority (No 495713). This presentation contains information intended only for the person to whom it is addressed or presented, and is intended for evaluation purposes only, with no licence to use the content or materials within. In receiving this presentation, the recipient acknowledges and agrees that: i) in the event the recipient does not wish to pursue this matter, this presentation will be returned as soon as possible; ii) the recipient willnot copy, fax, reproduce, divulge or distribute this confidential presentation, in whole or in part, without the express written consent of LISO; iii) all of the information herein will be treated as confidential material with no less care than thatafforded to the addressee’s own confidential material of the most sensitive nature; iv) information herein may constitute material non-public information, disclosure of which may be prohibited by law, and the legal responsibility for its use is borne solely by the recipient. This presentation in no way constitutes an offer to sell, nor a solicitation to purchase securities in any company or investment product.
Nothing contained within this document constitutes investment, legal, tax or any other advice. It should not be relied upon when making an investment or other decision. Any performance shown represents model portfolios which are periodically restructured and/or rebalanced. Although the model portfolios are applied to a client’s account, the actual returns may vary from the model returns shown. In addition, portfolio performance is quoted net of cost of investment but gross of fees – i.e. the OCF of the underlying portfolio investments is taken into account but the Investment Management Fee is not so client returns will differ from the returns shown above. Returns do not take account of platform, product provider or Adviser fees. Any figures shown have not been externally audited.
The value of investments and any income may go down as well as up and will depend on the fluctuations of investments and financial markets outside of the control of Liontrust Investment Solutions Limited. As a result a client may not get back the amount originally invested. Past performance is not indicative of future performance and any reference to a security is not a recommendation to buy or sell that security.
Issued by Liontrust Investment Solutions Limited, 2 Savoy Court, London WC2R 0EZ.


