
Discussion paper (201124)
The views expressed in this paper are those of the author(s)and do not necessarily reflect the policies of Statistics Netherlands
Den Haag/Heerlen, 2011
011Jacqueline van Beuningen and Tineke de Jonge
The Personal Wellbeing Index
Construct Validity for the Netherlands

Colofon
UitgeverCentraal Bureau voor de StatistiekHenri Faasdreef 3122492 JP Den Haag
Prepress Centraal Bureau voor de StatistiekGrafimedia
OmslagTeldesign, Rotterdam
InlichtingenTel. (088) 570 70 70Fax (070) 337 59 94Via contactformulier: www.cbs.nl/infoservice
BestellingenE-mail: [email protected] (045) 570 62 68
Internetwww.cbs.nl
ISSN: 1572-0314
© Centraal Bureau voor de Statistiek, Den Haag/Heerlen, 2011.Verveelvoudiging is toegestaan, mits het CBS als bron wordt vermeld.
Verklaring van tekens
. = gegevens ontbreken * = voorlopig cijfer ** = nader voorlopig cijfer x = geheim – = nihil – = (indien voorkomend tussen twee getallen) tot en met 0 (0,0) = het getal is kleiner dan de helft van de gekozen eenheid niets (blank) = een cijfer kan op logische gronden niet voorkomen 2010–2011 = 2010 tot en met 2011 2010/2011 = het gemiddelde over de jaren 2010 tot en met 2011 2010/’11 = oogstjaar, boekjaar, schooljaar enz., beginnend in 2010 en eindigend in 2011 2008/’09– 2010/’11 = oogstjaar, boekjaar enz., 2008/’09 tot en met 2010/’11
In geval van afronding kan het voorkomen dat het weergegeven totaal niet overeenstemt met de som van de getallen.
60083201124 X-10
3
Personal Wellbeing Index Construct Validity for The Netherlands
Summary This report describes the results of the analyses of the Personal Wellbeing Index (PWI) for the Netherlands. We show that the original scale has sufficient construct validity. Six of the eight distinguished life domains contribute significantly to the explained variance of the overall quality of life. Further, PWI indicators are related to other items and alternative dependent variables as expected from theory. Lastly, the eight life domains can be aggregated into one PWI scale with high construct validity. We conclude that the PWI can be used as a quality of life measure instead of a single life satisfaction indicator in order to reveal the multi-dimensionality of quality of life.

4
Contents
1 Introduction 5
1.1 Background 5
1.2 The Personal Wellbeing Index 6
1.3 Objective and structure of the report 8
2 Method 9
2.1 Data Collection 9
2.2 The PWI measurement construct 9
2.3 Analyses 10
3 Results 12
3.1 Testing data assumptions 12
3.2 Regression analyses 13
3.3 Nomological validity 15
3.4 Factor analysis 16
3.5 PWI scores 17
4 Reflection and conclusions 19
References 20
Appendix A A new framework for Dutch key social indicators 22
Appendix B Translating the PWI into Dutch 24
5
1 Introduction
Given the multidimensionality of satisfaction with life, the question arose whether it
would be possible to measure satisfaction with respect to various life domains using
a composite index that could compete with our existing general question on
satisfaction with life. Therefore, the construct validity of the multidimensional
Personal Wellbeing Index (PWI) for the Netherlands has been analysed.
1.1 Background
Statistics Netherlands developed its first Life Situation Survey in 1974. The survey
covered several life domains. Besides an objective indication for each domain,
respondents were asked for their perceptions with respect to each domain. In
addition, the survey contained the more general subjective question “How satisfied
are you with your life?”. The Life Situation Survey evolved into the Continuous Life
Situation Survey that started in 1997. Although in the course of time several
modules disappeared from this survey and several questions have been incorporated
in other social surveys addressing a specific aspect of the life situation, the general
question on life satisfaction is still included and remains unchanged over time.
In the past few years the measurement of subjective wellbeing has spurred research
interests at Statistics Netherlands, not in the least due to the “Beyond GDP”
discussion and the recommendations in the report of the Stiglitz-commisssion
(Stiglitz, Sen, and Fitoussi 2009). Based on the recommendations in this report on
the dimensions of quality of life (QoL), Statistics Netherlands restructured the
framework on the key indicators of the life situation in the Netherlands to reflect the
following dimensions:
- Material living standards;
- Economic risks;
- Education and profession;
- Health;
- Institutional participation and trust;
- Social cohesion and relations;
- Physical safety;
- Natural environment and living environment.
6
An explanation for why these dimensions do not fully coincide with those in the
Stiglitz-report can be found in appendix A.
1.2 The Personal Wellbeing Index
Given the eight dimensions for quality of life in our new framework, the question
arose whether it would be possible to measure satisfaction with each of these
dimensions by a composite index that could compete with our existing general
question on satisfaction with life.
As far as we know, the Personal Wellbeing Index (PWI) developed by the
International Wellbeing Group (IWbG) is currently the only multi-dimensional scale
measuring satisfaction with life (IWbG 2006). The PWI covers a basic set of eight
quality of life domains:
- standard of living;
- personal health;
- achieving in life;
- personal relationships;
- personal safety;
- community connectedness;
- future security;
- spirituality/religion.
These eight domains represent the first-level deconstruction of satisfaction with
“life as a whole”. The International Wellbeing Group (IWbG 2006) indicates that
there is no current theory to motivate the choice of life domains, but suggests that
two further criteria be employed to narrow the focus of the search to domains most
likely to result in a scale with the simplest conceptual construction:
(a) Each domain name must describe a broad aspect of life which is amenable to
both objective and subjective measurement. This is based on the fundamental
principle that QoL exists as separate objective and subjective dimensions. While
the PWI is concerned only with the subjective dimension, this criterion allows
for the possibility that a parallel objective scale could be constructed. This
criterion also excludes affective adjectives (e.g., Happiness).
(b) Each domain must describe an unequivocal indicator variable, as opposed to a
causal variable of QoL. An indicator variable may be defined as one that can
never act alone as a mediator. An example of an indicator variable is

7
‘Satisfaction with your health’ and an example of a causal variable is
‘Satisfaction with your control over your life’. Since the perception of control
can mediate the influence of physical disability on health satisfaction, control is
not an unequivocal indicator variable.
The PWI scale contains eight items of satisfaction, each one corresponding to one of
the quality of life domains mentioned above. Each item represents a domain of life
satisfaction that explains some unique variance in the ‘life as a whole’ question,
while also sharing most of its variance with the other domains. This shared variance
is called Homeostatically Protected Mood (Cummins 2009) Essentially, therefore,
each item represents its own domain (e.g., health) through a small amount of unique
variance with sufficient power for the domains to respond differentially when
subjective wellbeing homeostasis (attached) is challenged. Thus, the PWI can be
used as a scale comprising closely-related items that form a single factor measuring
subjective wellbeing, or the individual domains can be examined to provide a
diagnostic profile of wellbeing across the domains.
The items in the PWI are all intentionally semi-abstract. For example, people are not
asked how satisfied they are with the relationship they have with their partner. While
this is an interesting question in its own right, it is very specific, such that the
satisfaction response will be driven by specific cognitions and emotions determined
by the target. However, the PWI domains are designed to measure broad life aspects,
as described above.
It has been shown that countries can be compared on the PWI (Lau, Cummins, and
McPherson 2005). This implies that people from different cultures interpret the
translated scale in a similar way. The predecessor of the PWI, the Comprehensive
Quality of Life Scale (ComQol), was developed by selecting relevant domains from
the literature followed by empirical validation (Cummins 1997; Gullone and
Cummins 1999). This is used as a benchmark to validate the PWI. The ComQol is a
more extensive scale than the PWI and includes objective measures as well as
importance ratings in addition to seven subjective domains that resemble the PWI.
Internal consistency, test-retest reliability, and correlations with other relevant
variables have been examined.

8
1.3 Objective and structure of the report
The dimensions distinguished by the PWI differ slightly from the dimensions in our
own framework. Only three dimensions fully correspond between the frameworks.
These are the PWI domains standard of living, personal health and physical safety.
The PWI domains personal relationships and community connectedness relate to the
dimension social cohesion and relations in our framework. One could argue that the
PWI domain achieving in life is comparable to the dimension education and
profession in our framework. The PWI domain future security is interpreted more
broadly than the dimension economic risks that we identify. The PWI domain
spirituality/religion does not correspond to any of the dimensions in our framework.
Despite this mismatch we decided to measure the original PWI to examine the
construct validity for the Netherlands. This is mainly to test whether the conceptual
basis of the PWI is valid, i.e., whether it is possible to have a set of semi-abstract
items that each represent a domain of life satisfaction and explain unique variance in
the ‘life as a whole’ question, while sharing most of its variance with the other
domains. If this holds, it follows that the concept could possibly be applicable to
another set of life domains as well. The challenge would be to come up with
appropriate semi-abstract items for the domains that represent our framework.
Objective
The objective of the study described in this report was to analyse the construct
validity of the PWI in the Netherlands. It is important to show empirically whether
the eight indicators can be combined into one index, because this is empirical proof
of an overall underlying quality of life concept. In addition to this we investigated
whether PWI indicators affect variables which have been identified in theory as
outcomes of wellbeing.
Structure
First, a description of how the data were collected, the PWI measures, and the
analytical steps taken to study the PWI are given in chapter 2. Next, the results of
the analyses are described in chapter 3. Lastly, chapter 4 is dedicated to a reflection
on the applicability of the PWI concept for Statistics Netherlands and ends with the
conclusions.
9
2 Method
The PWI was translated into Dutch using a back-translation procedure and included
in the 2010 Survey on Perceptions. The results were analysed in several analytical
steps to test the construct validity of the PWI for The Netherlands.
2.1 Data collection
The PWI was included in the 2010 Survey on Perceptions (‘Onderzoek Belevingen’)
by Statistics Netherlands. The Dutch version of the PWI used in this survey was
translated by Statistics Netherlands using a back-translation procedure (Wild et al.
2005). First, the PWI was translated into Dutch by a Dutch native speaker. Second,
the Dutch translation was translated back into English by an English native speaker.
Prof. Dr. R. Cummins of the Deakin University in Australia, who initiated the
development of the PWI, was consulted during the process. Appendix B contains a
description of the outcomes of this translation process.
The Survey on Perceptions employs a mixed-mode design, where respondents are
approached for a CAWI response, followed by a re-approach in CATI and a second
re-approach in CAPI (“HPE”) (Janssen 2010; Cuppen, van der Laan, and van
Nunspeet 2011). The sample consists of 3,402 citizens of 18 years and older. The
majority responded using CAWI (61.4 percent). This is an advantage for the PWI
because self-reports are recommended (IWbG 2006).
2.2 The PWI measurement construct
The PWI is measured by asking respondents the following questions (in brackets are
the domains these correspond with):
How satisfied are you with…?
1. your standard of living? [Standard of Living]
2. your health? [Personal Health]
3. what you are achieving in life? [Achieving in Life]
4. your personal relationships? [Personal Relationships]
5. how safe you feel? [Personal Safety]
6. feeling part of your community? [Community-Connectedness]
7. your future security? [Future Security]

10
8. your spirituality or religion? [Spirituality – Religion]
One additional indicator is included about the satisfaction with the overall quality of
life, formulated as “How satisfied are you with your life as a whole?”. This indicator
is not part of the PWI, but is used to test construct validity (IWbG 2006). This
indicator is used as dependent variable in OLS regression analyses to test the effect
of the eight PWI indicators.
Thus, respondents are asked about their perceptions of their own life and its
subdomains. The response scale for each question is an eleven-point scale ranging
from “0” to “10”, whereby “0” stands for “Completely dissatisfied” and “10” for
“Completely satisfied”. The midpoint of the scale coded “5” means “Neutral” or
“Not dissatisfied, not satisfied”. Following previous research, the scale was rescaled
to scores from “0” to “100” for this paper to ease interpretation of the results. The
psychometric qualities of the scale have been tested empirically in several countries
(Cummins 1995).
Not all indicators necessarily contribute significantly to the index, however, in
previous research all indicators are typically included because they are relevant in
other countries. The eight domain indicators are summed and averaged. Missing
values are excluded. Therefore, a respondent with one missing value has an average
score based on seven indicators. If someone has four or more missing values, no
PWI score is calculated in this study.
2.3 Analyses
The following analytical steps were taken to study the PWI:
Step 1.
The percentage of missing values, multivariate outliers, and response sets are
analysed to check whether any respondents need to be excluded from further
analysis.
Step 2.
Various OLS regression analyses are conducted with PWI indicators as predictors.
Stepwise regression is used to test whether each indicator contributes to the
explained variance of the indicator on satisfaction with life as a whole. In addition,
11
effects on alternative dependent variables are examined. These analyses show
whether the eight PWI domains correspond to the overall quality of life and other
related constructs.
Step 3.
Nomological validity is established by examining various alternative wellbeing
measures and correlations of PWI domain indicators and items from other scales that
relate to the same life domain.
Step 4.
Principal Component analysis (PCA) is conducted to determine construct validity of
the PWI. PCA determines the factors which can account for the total variance in a
set of variables. Furthermore, relevant PWI indicators are summed and averaged
into a PWI construct score for each respondent. Construct validity is also tested
using reliability analysis and the Cronbach’s alpha is reported. These analyses
determine whether the eight domains of the PWI can be condensed into one overall
PWI construct.

12
3 Results
OLS regression was used to test whether each indicator significantly affects the
satisfaction with one’s overall quality of life. Furthermore, we tested how the PWI
behaves with respect to related constructs. Lastly, the factor structure has been
explored. Based on these analyses the conclusion is drawn that the PWI scale shows
sufficient construct reliability. The PWI scores of various groups are reported.
3.1 Testing data assumptions
Some respondents return response sets with extreme scores on each of the eight PWI
indicators, i.e., respondents who score only “0” or “100” on the PWI scale. There
are 21 respondents with either of these patterns (0.6 percent of the sample). This is
comparable to the Austrian PWI analyses (Renn et al. 2009). Factor loadings do not
change substantially after exclusion of these cases. Furthermore, there is no
indication that this group has not given real answers. Four of the five respondents
who scored only “0” on the PWI disagree with the statement that in most cases their
life is almost ideal. Because there are no clear conceptual or empirical reasons to
eliminate these cases, they are not excluded from the sample in line with previous
research (Renn et al. 2009).
Most PWI indicators are negatively skewed as the range is -1.49 to -0.75, which is
slightly outside the usual range of -1 to 1. This is typical for PWI data (Renn et al.
2009). Kurtosis is higher than the cut-off value 2 for all indicators except two,
namely satisfaction with future security and with religion. The Shapiro-Wilk test
shows deviations from normality for each of the eight indicators (minimum
SW(2488) = 0.86, p < 0.01). Therefore, results of the regression analyses should be
interpreted with caution. In order to be able to compare our results with previous
studies we use the original indicators (Lau et al. 2005; Renn et al. 2009).
There are also multivariate outliers in the sample, which implies that some
respondents have relatively different answer patterns on the PWI. This might imply
individual cases who are very different from the remainder of the sample and thus
bias the results. Alternatively, they could be meaningful subgroups in the sample;
for example, a small group that is extremely unhappy. In any case it is important to
examine the biasing effect on the results (Mardia 1975). The Mahalanobis distance
check for multivariate outliers is only available for respondents who do not have

13
missing values (N=2488). It uses correlations in the dataset to check how different
each observation is from the others. There are 129 outliers (D2(8) > 26.13, p <
0.001), which is 2.2 percent of the total sample. The average PWI score for the
remaining respondents is 73.97 (SD = 10.44, N = 2359), which is slightly higher
than the score with outliers. In the OLS regression analyses without these outliers
satisfaction with safety feelings does not contribute to satisfaction with quality of
life, the other indicators including religion have a positive effect. However, the
effect of religion is very small (β = 0.04, p < 0.01). The analysis of the full sample
described in section 3.2 does not show effects of religion, which is in line with
previous research. Therefore, we assume that the outliers represent a meaningful
subgroup in the sample and should not be excluded.
3.2 Regression analyses
OLS regression is used to test whether each of the eight indicators significantly
affects the satisfaction with one’s overall quality of life (PWI1). Two indicators are
not significantly related to overall quality of life. Satisfaction with religion and
safety are not related to overall quality of life. Satisfaction with standard of life is
related most to overall quality of life (β = 0.36, p < 0.01) followed by satisfaction
with personal relationships (β = 0.20, p < 0.01), achievements in life (β = 0.19, p <
0.01) and health (β = 0.14, p < 0.01). These four domains seem to be the most
important for explaining the wellbeing of Dutch citizens. Details are presented in
Table 1. The Variance Inflation Factor ranges from 1.16 to 2.25, which is well
below the threshold of 10 and shows there is no multicollinearity between the eight
domain indicators. This indicates there is no large overlap between indicators and all
can be included in the regression analysis. The explained variance on overall quality
of life is 66 percent. Correlations between the domain indicators including overall
quality of life range from 0.28 to 0.73, which is a larger range than the 0.39 to 0.67
from Lau et al. (2005) and 0.31 to 0.62 from Renn et al. (2009). Pairwise deletion is
used, because of the high percentage of missing values on satisfaction with religion
due to respondents who are not religious. The model is also estimated using listwise
deletion (i.e., all cases with at least one missing value on the PWI are excluded)
(Table 2). However, results are similar and therefore not discussed in detail.
Furthermore, the contribution of each indicator is examined separately by a series of
hierarchical regressions. In step 1 seven indicators are included while the remaining
indicator is included in step 2. This is done eight times. Two indicators do not

14
contribute significantly to the explained variance of overall quality of life (p < 0.05).
This is “satisfaction with safety” and “satisfaction with religion”. This is in line with
results from Australia, where religion and safety do not contribute uniquely either
(IWbG 2006). Religion is the newest indicator of the PWI. When it was added it
caused much discussion on the wordings of the question and it is the only indicator
with an additional answer option stating “Not applicable”. This indicator turned out
to be problematic in the pretest of the Dutch version of the PWI as well (appendix
B). Thus, when the other PWI indicators are controlled for, this indicator does not
contribute unique variance to explaining overall quality of life. In addition, two
indicators contribute less than 0.00 to the explained variance. Although significant,
it can be argued that this is not a relevant contribution. These are: future security and
community connectedness.
3.2.1 Correlations and results of OLS regressions (pairwise deletion) 1 2 3 4 5 6 7 8 9 B β Part r2
PWI1 overall quality 1 - - -PWI2 living standard .73 1 .33 .36** .15PWI3 health .56 .51 1 .11 .14** .03PWI4 achievements .68 .66 .52 1 .16 .19** .04PWI5 relationships .61 .52 .42 .57 1 .17 .20** .07PWI6 safety .39 .38 .37 .37 .34 1 .02 .00 .00PWI7 community .54 .52 .41 .51 .47 .49 1 .06 .07** .00PWI8 security .56 .56 .48 .55 .43 .47 .59 1 .05 .06** .00PWI9 religion .28 .27 .23 .26 .25 .27 .30 .30 1 .01 .02 .00
Adj. R2
R2 change - .06** .01** .02** .02** .00 .00* .00* .00
Note. All correlations are significant, * p < 0.05, ** p < 0.01.-----------------------------------------------------------------------------------------------------------------------------------------------------------------------------------------
0.66
-----------------------------------------------------------------------------------------------------------------------------------------------------------------------------------------
-----------------------------------------------------------------------------------------------------------------------------------------------------------------------------------------
-----------------------------------------------------------------------------------------------------------------------------------------------------------------------------------------
3.2.2 Correlations and results of OLS regressions (N=2486)(listwise deletion)
1 2 3 4 5 6 7 8 9 B Part r2
PWI1 overall quality 1 - - -PWI2 living standard .75 1 .36 .38 ** .17PWI3 health .58 .53 1 .11 .14 ** .03PWI4 achievements .69 .67 .55 1 .16 .17 ** .04PWI5 relationships .63 .55 .45 .61 1 .16 .19 ** .06PWI6 safety .40 .39 .41 .38 .36 1 -.00 -.00 -.00 PWI7 community .56 .55 .43 .54 .50 .51 1 .07 .07 ** .01PWI8 security .56 .58 .50 .56 .44 .48 .61 1 .04 .05 ** .00PWI9 religion .29 .28 .24 .26 .25 .27 .31 .31 1 .02 .03 * .00
Adj. R2
R2 change - .07** .01** .01** .02** .00 .00** .00** .00*
Note. All correlations are significant, * p < 0.05, ** p < 0.01.
---------------------------------------------------------------------------------------------------------------------------------------------------------------------------------------
---------------------------------------------------------------------------------------------------------------------------------------------------------------------------------------
---------------------------------------------------------------------------------------------------------------------------------------------------------------------------------------
---------------------------------------------------------------------------------------------------------------------------------------------------------------------------------------0.67
β

15
3.3 Nomological validity
Nomological validity refers to how the PWI behaves with respect to related
constructs. That is, the extent to which it behaves as it should. As wellbeing is part
of a nomological net or system of constructs and relationships, the PWI should
correlate with alternative wellbeing measures. In addition, the domain indicators
should correlate highly with other measures tapping into the same domain. If this is
the case, we can be confident that the PWI does in fact measure what it is supposed
to measure.
Another well-known subjective multi-item wellbeing scale is the Satisfaction With
Life Scale (SWLS) developed by Diener et al. (1985), which consists of five items
measuring global life satisfaction. Whereas the PWI uses a numerical 11-point
response scale ranging from 0 to 10, the SWLS has a verbal 7-point response scale
range from “Strongly disagree” to “Strongly agree”. This discrepancy in response
scales may attribute to a lower correlation than if the same response scales had been
applied, due to differences in interpretations by the respondents. However, this scale
was used as it was before by Renn et al. (2009) to validate the PWI. Several
indicators of the scale correspond to PWI indicators. For example, “So far, I have
achieved the most important things in my life” is significantly correlated with
satisfaction with achievement in life (r = 0.50, p < 0.01). Further, the item “My
living conditions are excellent” is significantly correlated with satisfaction with
standard of life (r = 0.50, p < 0.01). The PWI scale as a whole correlates
significantly with the SWLS (r = 0.56). However, this correlation is lower than the
0.79 that Renn et al. (2009) report for Austria. In addition, the PWI scale (i.e.,
PWI2-PWI9) correlates more strongly with the quality of life as a whole (i.e., PWI1)
(r = 0.75, p < 0.01) than the SWLS scale (r = 0.55, p < 0.01).
Several other items from the Survey on Perceptions were also related to the PWI
indicators based on the domain on which they focus. Perceived health, a five-point
scale ranging from “Very bad” to “Very good”, and suffering from long-term
diseases, a Yes/ No question, are significantly related to satisfaction with health (r =
0.67, p < 0.01; r = 0.46, p < 0.01). Lastly, frequency of church attendance, a five-
point scale ranging from “Rarely or never” to “Once a week or more”, is
significantly related to satisfaction with religion (r = 0.41, p < 0.01). Each
correlation is in the expected direction. As expected, all correlations mentioned are
higher than correlations of the respective item with any of the other PWI indicators.

16
Several alternative dependent variables are tested in the regression analyses using
the eight PWI indicators as predictors. Each dependent variable is related to personal
wellbeing according to previous research (Renn et al. 2009; Diener et al. 1999). The
first is “How often did you feel happy [in the last four weeks]?” with response
options ranging from “Never” to “All the time” on a six-point scale. As with the
SWLS, the number of response options differs, which could deflate correlations.
Three PWI indicators do not have a significant relation with this dependent variable,
namely: feelings of safety, connectedness to the community, and religion. This could
be because these domains do not affect situational fluctuations of happiness, but do
affect the individual’s wellbeing baseline.
3.4 Factor analysis
The PWI indicators meet the criteria for exploratory factor analysis (Kaiser-Meyer-
Olkin = 0.90; Bartlett’s Test of Sphericity χ2(28) = 8086.17; p < 0.01). The Kaiser-
Meyer-Olkin test checks whether partial correlations among indicators are small,
high values indicate that factor analysis is appropriate. The Bartlett’s Test checks the
hypothesis that the variables in the population correlation matrix are uncorrelated. A
significant result rejects this hypothesis. These tests suggest that the eight domain
indicators can be combined into one construct instead of eight independent
measures.
Principal Components Analysis (PCA) was conducted using Varimax rotation to
explore the factor structure of the PWI. The eight domain indicators form one factor.
Factor loadings range from 0.45 for satisfaction with religion to 0.81 for satisfaction
with standard of living and achievement in life. Factor loadings above 0.40 are
relevant and can be included in the scale (Hair et al. 1998). The explained variance
of the indicators on the factor is 53 percent. Table 3 shows the results of the factor
analysis.
Cronbach’s alpha is 0.86, which is above the 0.70 threshold. Therefore, the PWI
scale shows sufficient construct reliability (Hair et al. 1998). If satisfaction with
religion were to be excluded alpha would increase. Since alpha is sufficient, all
indicators are included. Table 4 shows the mean and standard deviation of each
indicator.

17
3.4.1 Factor analysis ----------------------------------------------------------------------------------------------Indicator Factor loading Communality----------------------------------------------------------------------------------------------PWI2 living standard 0.81 0.65PWI3 health 0.72 0.52PWI4 achievements 0.81 0.66PWI5 relationships 0.73 0.53PWI6 safety 0.65 0.42PWI7 community 0.78 0.61PWI8 security 0.79 0.62PWI9 religion 0.45 0.20% explained variance component 1----------------------------------------------------------------------------------------------Note. PCA with Varimax rotation.
53
3.4.2 Descriptives ------------------------------------------------------------------------------------------------------------------------Indicator Unweighted Mean (SD) Weighted Mean (SD) N (%)------------------------------------------------------------------------------------------------------------------------PWI1 overall quality 76.19 (14.16) 75.94 (14.44) 3400 (99.94)PWI2 living standard 75.53 (15.31) 75.11 (15.69) 3395 (99.79)PWI3 health 74.09 (17.81) 73.96 (18.02) 3397 (99.85)PWI4 achievements 74.09 (16.11) 73.77 (16.41) 3388 (99.59)PWI5 relationships 78.53 (16.57) 78.14 (16.92) 3395 (99.79)PWI6 safety 72.13 (17.14) 72.20 (17.21) 3400 (99.94)PWI7 community 71.58 (15.49) 71.22 (15.71) 3389 (99.62)PWI8 security 67.80 (17.76) 67.62 (17.96) 3373 (99.15)PWI9 religion 69.75 (21.48) 70.20 (21.52) 2521 (74.10)------------------------------------------------------------------------------------------------------------------------
3.5 PWI scores
The overall PWI score is weighted to correct for sample selectivity with regard to
background characteristics. This ensures representative findings for the Dutch
population. The average PWI score is 72.98 (SD = 11.98), which is within the
normative range of 70 to 80 for Western countries.
When various groups are compared based on gender, age, ethnicity, education level,
marital status and perceived health the PWI scores are ranked as expected based on
previous happiness research (Gringhuis and Israëls 1999; Veenhoven 2008;
Vaughan et al. 1985; Witter et al. 1984) (Table 5). That is, young people score
higher on wellbeing than old people, native Dutch people score higher than

18
immigrants, higher educated score higher than lower educated people, and healthy
people score higher than people in poor health.
3.5.1 Ranking of groups on average weighted PWI scores -------------------------------------------------------------------------------------------
PWI (SD)-------------------------------------------------------------------------------------------
GenderMale 72.61 (12.02)Female 73.35 (11.93)
Age18-24 74.20 (9.48)25-44 74.17 (11.66)45-64 72.25 (12.58)65 and older 71.53 (12.27)
EthnicityDutch 73.34 (11.45)Western immigrant 72.76 (11.78)Non-western immigrant 70.42 (15.45)
Education levelTertiary II (university master, doctor) 77.49 (10.83)Tertiary I (hbo,university bachelor) 75.37 (10.22)Secondary (havo, vwo,mbo 2-4) 73.81 (10.49)Lower secondary (vmbo,mbo1,mavo onderb) 71.30 (11.91)Primary (primary education) 69.39 (14.11)
Marital statusMarried 74.06 (11.36)Divorced 69.19 (14.09)Widowed 70.10 (13.72)Unmarried 72.70 (11.60)
HealthVery good 78.88 (9.64)Good 73.59 (10.55)Mediocre 66.23 (11.70)Bad 58.19 (14.53)Very bad (N=13) 46.86 (23.23)-------------------------------------------------------------------------------------------Note. Minimum sample size is 100 unless indicated otherwise.

19
4 Reflection and conclusions
The purpose of this report is to show whether the PWI is a valid construct. Six of the
eight indicators are significantly related to the overall quality of life. Satisfaction
with religion is not related and is slightly different because of the “Not applicable”
answer option and the fact that many Dutch people are not religious, rendering the
item irrelevant. In addition, satisfaction with feelings of safety is not related either.
However, the internal consistency and factor structure show that these indicators do
not need to be excluded from the scale. That is, all indicators load onto one overall
factor and the construct validity is sufficient. Further, because of the high explained
variance of the overall quality of life (66 percent) we are confident that the eight
domains represent quality of life perceptions adequately. This explained variance is
also comparable to the explained variance that is reported in previous literature,
namely 65 percent compared to 68 percent (Fugl-Meyer, Braenholm, and Fugl-
Meyer 1991). This implies that the original PWI can be applied to the Netherlands.
We find that the first four indicators, namely satisfaction with living standard,
achievements in life, health, and personal relationships are the most important
indicators of the PWI in the Netherlands. The four indicators represent the items that
coincide with our own framework of dimensions of the quality of life. The finding
that the remaining four PWI indicators contribute less may be due to the difficulty
respondents seem to have with answering these questions instead of the limited
importance of the domains (see appendix B). For example, respondents were unsure
as to what community and the future refer to and the “Not applicable” option had to
be included for religion to enable respondents without religious denomination to
answer the question. The PWI can be used if the goal of a study is to explain
differences between people in wellbeing. That is, the information about domain
satisfaction can be used to target unhappy people in a specific way in order to
improve their wellbeing.
We believe that the conceptual basis of the PWI can be used to design a multi-
dimensional index for wellbeing that meets our own framework. The four PWI items
that coincide with the dimensions of our framework could be part of this. For the
other items that are not included in the PWI, appropriate semi-abstract items will
have to be conceptualised. We would prefer a multi-dimensional index that meets
the dimensions in our own framework to the PWI, since this corresponds with the
recommendations of the Stiglitz-report.

20
References Cummins, R. A. (1995), “On the Trail of the Gold Standard for Subjective Well-Being”, Social Indicators Research, 35 (2), 179-200. Cummins, R. A. (2009), “Subjective Wellbeing, Homeostatically Protected Mood and Depression: A Synthesis”, Journal of Happiness Studies, 11, 1–17. Cummins, R.A., M. P. McCabe, Y. Romeo, S. Reid, and L. Waters (1997), “An Initial Evaluation of the Comprehensive Quality of Life Scale—Intellectual Disability”, International Journal of Disability, Development and Education, 44 (1), 7-19. Cuppen, M., Laan, P. van der, Nunspeet, W. van (2011), “Re-engineering Dutch social surveys: From single-purpose surveys to an integrated design”, paper for the 58th ISI Congress (http://isi2011.congressplanner.eu/pdfs/450015.pdf)
Diener, E., R. E. Emmons, R. J. Larsen, and S. Griffin (1985), “The Satisfaction With Life Scale”, Journal of Personality Assessment, 49 (1), 71-75.
Diener, E., E. M. Suh, R. E. Lucas, H. L. Smith (1999), “Subjective Well-Being: Three Decades of Progress”, Psychological Bulletin, 125 (2), 276-302. Fugl-Meyer, A. R., I. B. Braenholm, and K. S. Fugl-Meyer (1991). “Happiness and domain-specific life satisfaction in adult northern Swedes”, Clinical Rehabilitation 5, 25-33. Gringhuis, G. and A. Israëls (1999), “Analyzing well-being in relation to characteristics in the population”, The Hague: Statistics Netherlands. Gullone, E. and R. A. Cummins (1999), “The Comprehensive Quality of Life Scale: A Psychometric Evaluation with an Adolescent Sample”, Behaviour Change, 16 (2), 127-139. Hair, J. F., Jr., Anderson, R. E., Tatham, R. L., and Black, W. C. (1998), “Multivariate data analysis with readings”, (5th ed.). Englewood Cliffs, NJ: Prentice-Hall. International Wellbeing Group (IWbG)(2006), “Personal Wellbeing Index – Adult, Manual 4th Edition”, Melbourne: Australian Centre on Quality of Life, Deakin University (http://www.deakin.edu.au/research/acqol/instruments/wellbeing_index.htm)
Janssen, B. (2010), “Web data collection for Household Survey at Statistics Netherlands”, The Hague/Heerlen: Statistics Netherlands, Internal document. Lau, A. L. D., R. A. Cummins, and W. McPherson (2005), “An Investigation into the Cross-Cultural Equivalence of the Personal Wellbeing Index”, Social Indicator Research, 72, 403-430. Mardia, K. V. (1975), “Assessment of Multinormality and the Robustness of Hotelling’s T2 Test”, Journal of the Royal Statistical Society, Series C (Applied Statistics), 24 (2), 163-171.

21
Renn, D. et al. (2009), “International Well-being Index: The Austrian Version”, Social Indicators Research, 90, 243-256. Stiglitz, J.E., A. Sen, and J.P. Fitoussi (2009), “Report by the Commission on the Measurement of Economic Performance and Social Progress”, CMEPSP. Available at: www.stiglitz-sen-fitoussi.fr.
Vaughan, D. A., J. B. Kashner, W. A. Stock, and M. Richards (1985), “A Structural Model of Well-Being: A Comparison of Ethnicity”, Social Indicators Research, 16 (3), 315-332. Veenhoven, R. (2008), “Sociological Theories of Subjective Well-being”, in M. Eid and R. Larsen (Eds.), The Science of Subjective Well-being: A tribute to Ed Diener.New York: Guilford Publications, 44-61. Wild, D., Grove, A., Martin, M., Eremenco, E.,McElroy, S., Verjee-Lorenz, A., Erikson, P. (2005), “Principles of Good Practice for the Translation and Cultural Adaptation Process for Patient-Reported Outcomes (PRO) Measures: Report of the ISPOR Task Force for Translation and Cultural Adaptation”, Value in Health, 8 (2), 94-104 Witter, R. A., M. A. Okun, W. A. Stock, and M. J. Haring (1984), “Education and Subjective Well-Being: A Meta-Analysis”, Educational Evaluation and Policy Analysis, 6 (2), 165-173.
22
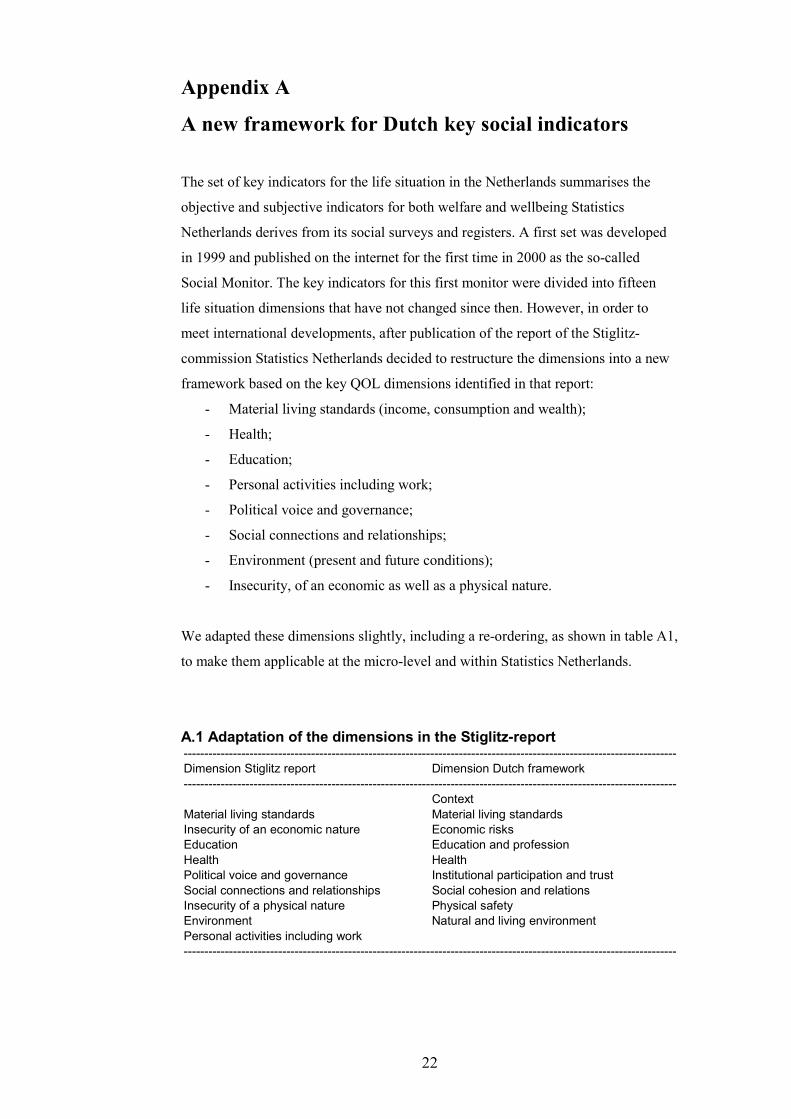
Appendix A
A new framework for Dutch key social indicators
The set of key indicators for the life situation in the Netherlands summarises the
objective and subjective indicators for both welfare and wellbeing Statistics
Netherlands derives from its social surveys and registers. A first set was developed
in 1999 and published on the internet for the first time in 2000 as the so-called
Social Monitor. The key indicators for this first monitor were divided into fifteen
life situation dimensions that have not changed since then. However, in order to
meet international developments, after publication of the report of the Stiglitz-
commission Statistics Netherlands decided to restructure the dimensions into a new
framework based on the key QOL dimensions identified in that report:
- Material living standards (income, consumption and wealth);
- Health;
- Education;
- Personal activities including work;
- Political voice and governance;
- Social connections and relationships;
- Environment (present and future conditions);
- Insecurity, of an economic as well as a physical nature.
We adapted these dimensions slightly, including a re-ordering, as shown in table A1,
to make them applicable at the micro-level and within Statistics Netherlands.
A.1 Adaptation of the dimensions in the Stiglitz-report ------------------------------------------------------------------------------------------------------------------------Dimension Stiglitz report Dimension Dutch framework------------------------------------------------------------------------------------------------------------------------
ContextMaterial living standards Material living standardsInsecurity of an economic nature Economic risksEducation Education and professionHealth HealthPolitical voice and governance Institutional participation and trustSocial connections and relationships Social cohesion and relationsInsecurity of a physical nature Physical safetyEnvironment Natural and living environmentPersonal activities including work------------------------------------------------------------------------------------------------------------------------

23
Although QOL is multi-dimensional, it is useful to have some indicators at an
overall level. Therefore, we added a context dimension. For example, the indicators
for the overall evaluation of life expressed in terms of happiness and satisfaction
with life will be assigned to this dimension.
The most important adaptation is the reassignment of the indicators relating to the
dimension “Personal activities including work” to the other dimensions. After all,
the personal activities dimension is the only one related to what people do, whereas
all other dimensions relate to what they have and the risks involved. By assigning
indicators for personal activities to other dimensions, we bring together having and
doing. In line with this we expanded the dimension “education” to “education and
occupation”, since in the Stiglitz-report indicators for paid work are assigned to the
personal activities dimension.
In the Stiglitz-report the dimensions “Political voice and governance” and
“Environment” are described mainly from a macro and international comparative
perspective. For application to the micro-level we changed these dimensions into
“Institutional participation and trust” and “Natural environment and living
environment”.
Lastly, we split the insecurity dimension into two, one for economic risks and one
for risks of a physical nature. This framework is the basis for the further exploration
and analysis of SWB at Statistics Netherlands.

24
Appendix B
Translating the PWI into Dutch
Introduction The Dutch version of the PWI used in the Survey on Perceptions was translated by
Statistics Netherlands using a back-translation procedure (Wild et al. 2005). First,
the PWI was translated into Dutch by a Dutch native speaker. Second, the Dutch
translation was translated back into English by an English native speaker.
Translating the PWI was rather difficult since it did not just involve translating the
words and sentences, but also translating the concepts captured by the index. Some
items are not a literal translation of the English text, but after discussions among the
translators and researchers a different translation was chosen deliberately.
In order to get an idea of how well the PWI was translated and how the Dutch items
would be interpreted , the Questionnaire Laboratory (Q-lab) of Statistics
Netherlands executed a small pretest among fourteen respondents who work at
Statistics Netherlands, but are not normally involved in household surveys or PWI-
like questions. To test how the concept of the PWI was interpreted the respondents
were initially asked to complete the PWI. They were encouraged not to think too
long about their answers and to record their initial reaction. After completing the
PWI, including the question on satisfaction with life as a whole, respondents were
asked to indicate for each item whether they thought it was difficult to answer and if
so to explain why. In addition, they could indicate for each of the items what they
thought of when they answered. Lastly, the respondents could write down any
general remarks they might have about the test, the PWI, or the questions.
Difficult to answer? None of the respondents thought the items satisfaction with life as a whole, standard
of living or personal health were difficult to answer. No remarks were made for
these items. For the other items several respondents made remarks. In general they
remarked upon the vagueness of the concepts. “What do you mean by ‘community’”,
“I’m not sure how to interpret this, the future is always uncertain.” The item about
religiousness elicited the most remarks, twelve in total. Five respondents gave the
neutral rating 5 for this item and two respondents left it blank. The remarks show
that the respondents do not know how to answer the question, because they do not
have a religion: “I’m afraid that if I tick satisfied, it may be interpreted as me
having a religion. Which I don’t, but I do have an ideology. So the question is

25
correct, but I had an awkward feeling and ticked neutral.”; “Is it possible to have a
not applicable here?”; “I don’t have a religion or ideology.”
What did you think of? Even though the respondents found several questions difficult to answer, they did
have a clear idea what the PWI is about. The questions seem vague, but all
respondents seem to record a similar vagueness.
Conclusions from the pretest From the pretest it was concluded that the translation was reliable. The items that
were deliberately different from the English version were interpreted as they were
intended to be in Dutch. Also, the concept was understood correctly. Apart from the
item on religiousness, the PWI could be answered by the test respondents. They
perceived a certain vagueness, but this did not prevent them interpreting the concept
and grading their satisfaction. This is in accordance with the conceptual basis of the
PWI for which a deliberately non-specific format was chosen (Cummins 2009). The
item on religiousness is very problematic. In theory a person can have no religion
and be very satisfied with that. Yet, as is clear from the remarks, the statement is not
always interpreted in that way. In the Australian version of the PWI an “opt out” is
added for persons with no spiritual or religious beliefs. It seems logical to do the
same in the Dutch version.
Final translation Based on the remarks made by the test respondents, the conclusions drawn from the
results and consultation of Prof. Dr. R. Cummins, some minor changes in the
translation were made. Furthermore, an “opt out” was added to the response scale
for the question on religion, because of the remarks of the respondents on this item.

26
B.1 Translation of the PWI in Dutch ------------------------------------------------------------------------------------------------------------------------How satisfied are you with ….. Hoe tevreden bent u met …..------------------------------------------------------------------------------------------------------------------------1. your life as a whole? 1. uw leven in het algemeen?2. your standard of living? 2. uw levensstandaard?3. your health? 3. uw gezondheid?
4. what you are achieving in life? 4. wat u op dit moment bereikt in uw leven?5. your personal relationships? 5. uw persoonlijke relaties?6. how safe you feel? 6. uw veiligheidsgevoel?
7. feeling part of your community?7. de mate waarin u zich onderdeel van uw gemeenschap voelt?
8. your future security? 8. uw zekerheid voor de toekomst?9. your spirituality or religion? 9. uw godsdienst of levensovertuiging?------------------------------------------------------------------------------------------------------------------------


