
The Philippine Educational System
O THE ENHANCED BASIC EDUCATION ACT OF 2013
O policy of the State that every graduate of basic education shall be an empowered individual
O The change from a 10-yr program to a 12-yr basic education program
The K to 12 Graduate
who has learned the
O foundations for learning throughout life;
O competence in work and be productive
O ability to coexist in fruitful harmony with communities
O capability to engage in creativity and critical thinking
O willingness to transform others and one’s self

O For this purpose, the State shall create
a functional basic education system
that will develop productive and
responsible citizens equipped with the
essential competencies, skills and
values for both life-long learning and
employment.

THE ISSUE
HOW CAN WE
MAKE A
DIFFERENCE IN
EDUCATION?
THE STANDARDS-APPROACH
AGREED: HAVING HIGH
STANDARDS
THE CHALLENGE:
HOW TO MAKE
STANDARDS WORK?
Why Standards?
Everyday we meet criterion!
O Criterion of service in restaurants
O Standards for service in eating places
O Criterion of strength in buildings
O Standards for construction of buildings
O Criterion in choosing a partner in life
O Standards of choosing a lifelong friend
Do we have a standard in education?
Why we need standards?
O Quality
Excellence
Productivity
Market competitive-
edge
Definition of Standard
O level of quality or excellence that is accepted by which actual attainments are judged or measured
(Microsoft Encarta Dictionary)

OUR CURRENT SITUATION..

Schools are not producing enough graduates with
good scientific, mathematical and reading skills.
What is our rank?
O Trends in International Mathematics and Science Study (TIMSS) - 1995, 1999, and 2003
O Progress in International Reading Literacy Study (PIRLS) - 2001

What are we going to do as educators?
NO QUALITY
NOT EXCELLENT
NO PRODUCTIVITY
NON COMPETITIVE GRADUATES
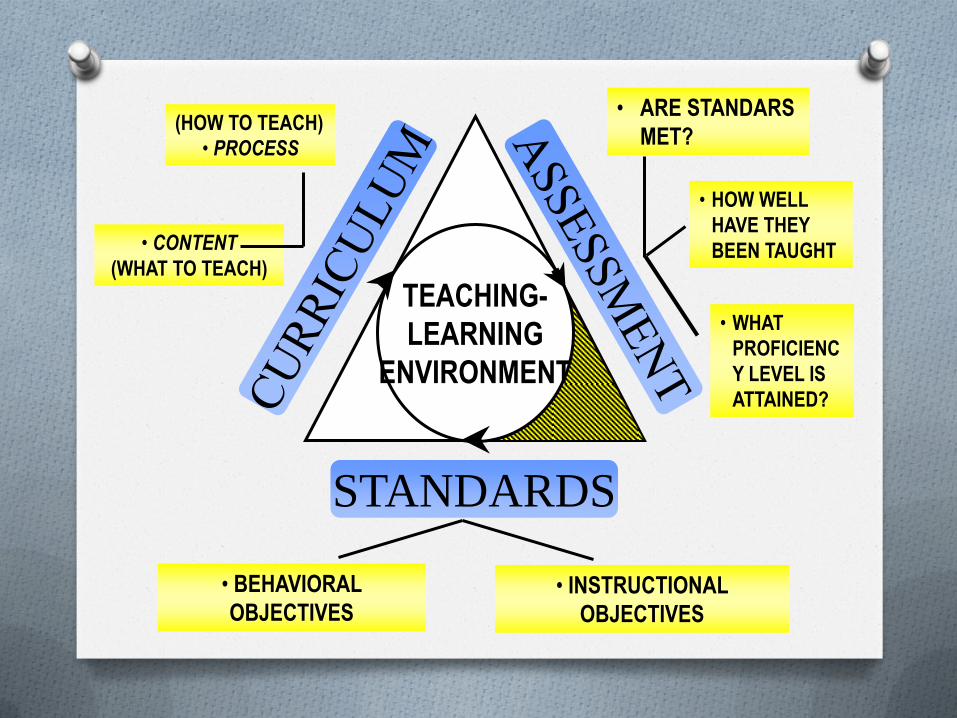
TEACHING- LEARNING
ENVIRONMENT
STANDARDS
(HOW TO TEACH) • PROCESS
• CONTENT
(WHAT TO TEACH)
• BEHAVIORAL OBJECTIVES
• INSTRUCTIONAL OBJECTIVES
• ARE STANDARS MET?
• HOW WELL HAVE THEY BEEN TAUGHT
• WHAT PROFICIENCY LEVEL IS ATTAINED?

Is there an academic standard?
Mid-continent Research for Education and Learning (McRel)
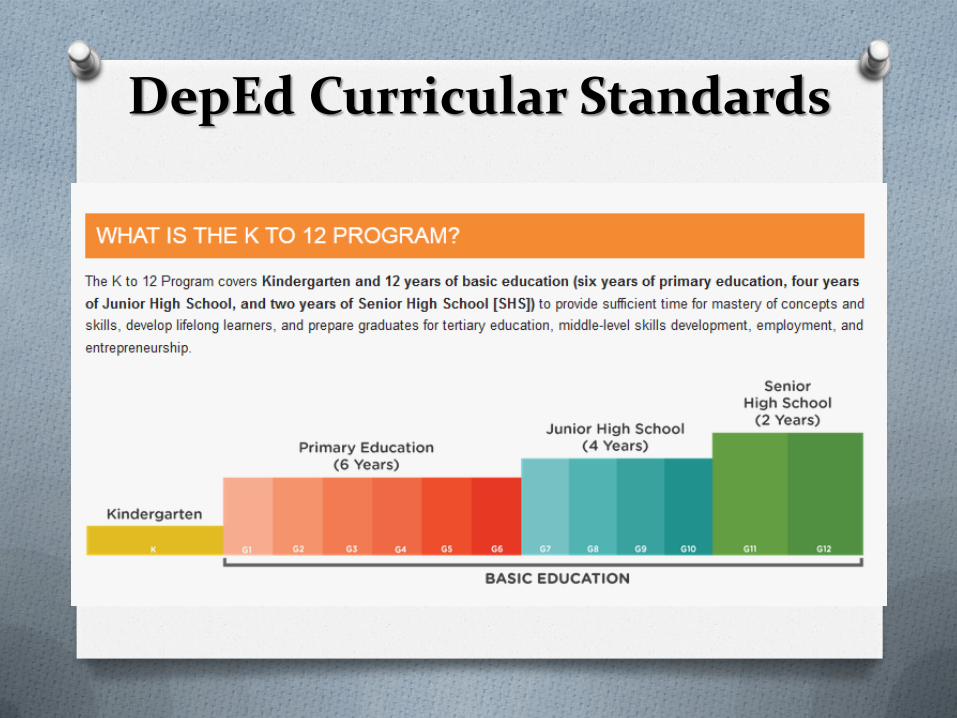
DepEd Curricular Standards
The APSA Standards-Based Test
O Developed in 2003, in response to the
need to change from a norm-referenced
testing to a standards-based testing.
Why Standards-Based Assessment and not Norm Assessment?
1. Standards
are fixed.
Norms move
Why Standards-Based Assessment and not Norm Assessment?
2. Standards are cooperative.
Norms are competitive.
3. Standards measure
proficiency.
Norms and their
counterparts
measure behavior
Why Standards-Based Assessment and not Norm Assessment?
O Standards raise the
bar of excellence by
developing intrinsic
motivation
The SBA tests of APSA is a form of
psychological or standardized tests. The
tests are for three (3) core areas:
• ENGLISH
• MATH
• SCIENCE
For all grade levels:
• Pre-elem
• Grades 1- 6
• Highschool Level I - IV
What are the features of SBA?
• Based on national curricular standards (DepEd) and international standards (McRel)
• More comprehensive reports
• Identifies the areas of strengths and developmental areas of the institution’s curriculum
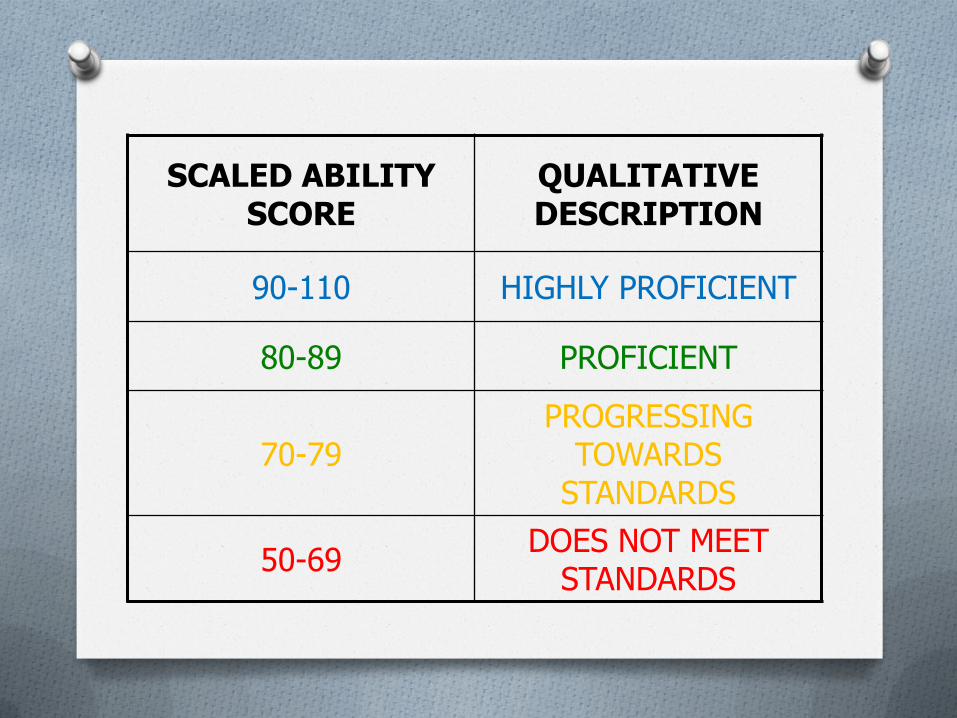
SCALED ABILITY SCORE
QUALITATIVE DESCRIPTION
90-110 HIGHLY PROFICIENT
80-89 PROFICIENT
70-79 PROGRESSING
TOWARDS STANDARDS
50-69 DOES NOT MEET
STANDARDS
What are the advantages of
using SBA?
• Provides objective and relevant feedback to school in terms of its quality and effectiveness of instruction
• Preponderance of HOTS in test items
• Pinpoints competencies of students and
learning gaps which serve as basis for learning
reinforcement or remediation
• Provides good feedback to the student on how
well he has learned and his readiness to move to
a higher educational level
What are the advantages
of using SBA?
Who has most to gain for the
use of SBA?
• Parents who can guide their children, to address learning gaps and reinforce strengths and competencies of their children
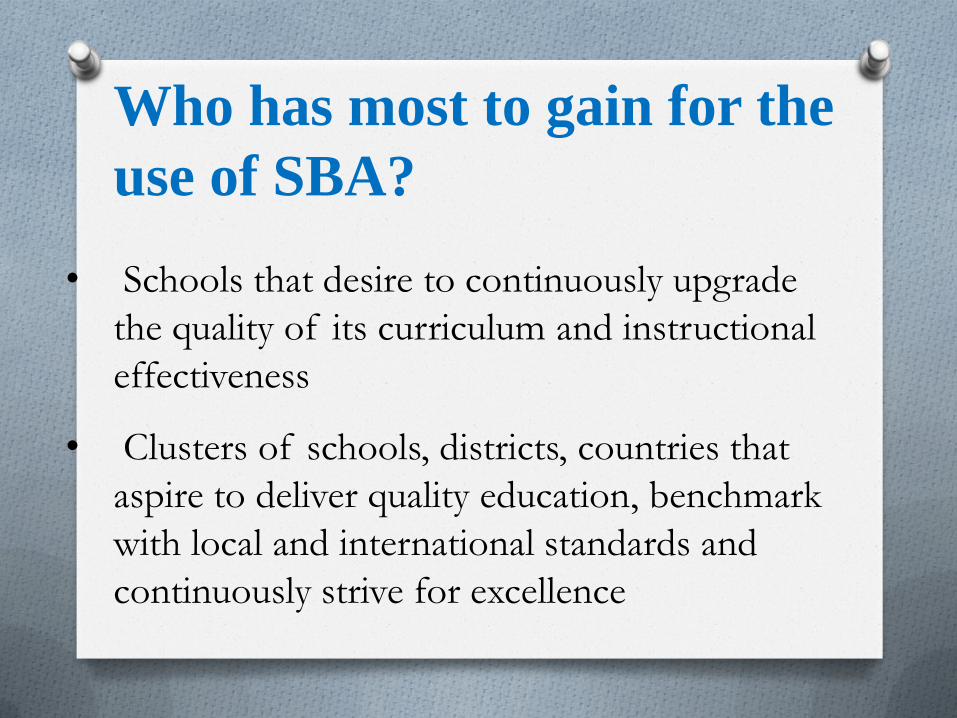
• Schools that desire to continuously upgrade
the quality of its curriculum and instructional
effectiveness
• Clusters of schools, districts, countries that
aspire to deliver quality education, benchmark
with local and international standards and
continuously strive for excellence
Who has most to gain for the
use of SBA?
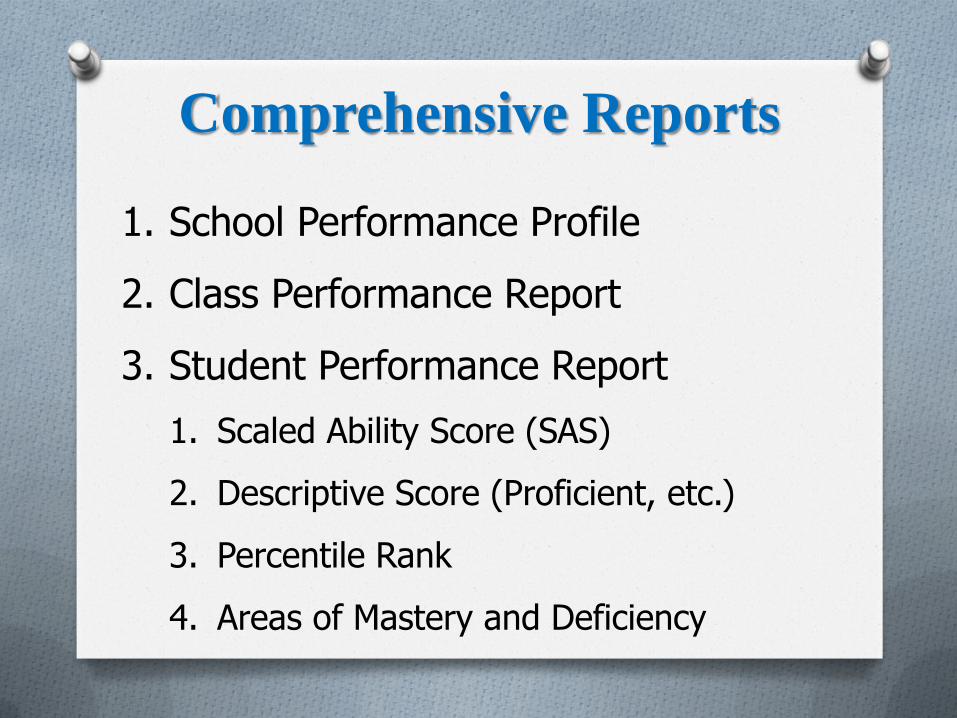
Comprehensive Reports
1. School Performance Profile
2. Class Performance Report
3. Student Performance Report
1. Scaled Ability Score (SAS)
2. Descriptive Score (Proficient, etc.)
3. Percentile Rank
4. Areas of Mastery and Deficiency
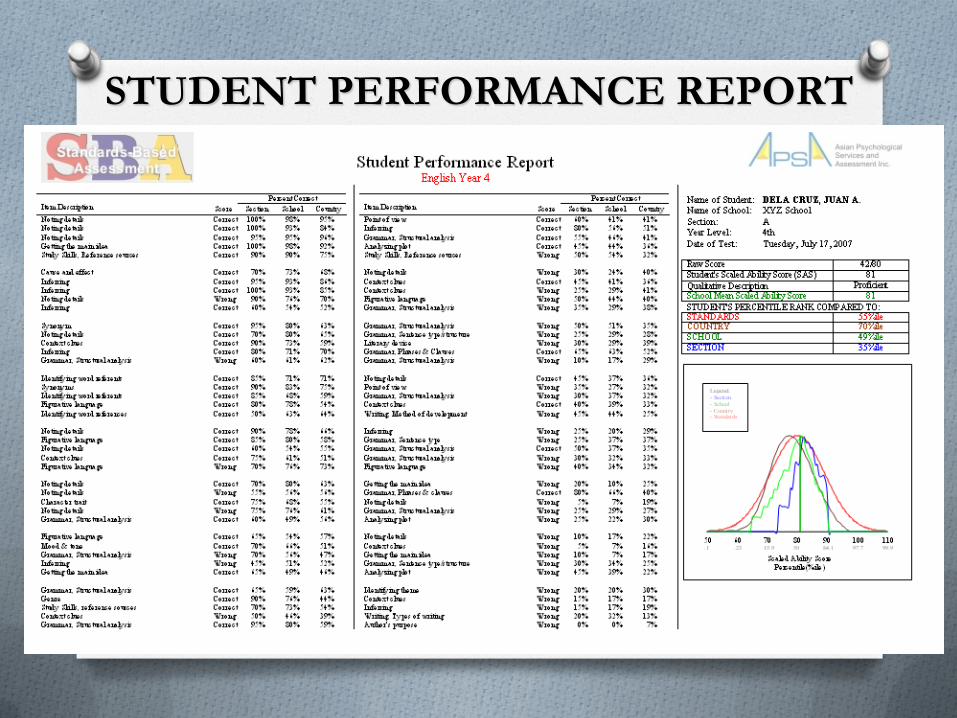
STUDENT PERFORMANCE REPORT
Standards Country School SectionDELA CRUZ, JUAN A. 84 64 84 35 57 ProficientDELA CRUZ, JUAN B. 76 33 52 6 10 Progressing towards standardsDELA CRUZ, JUAN C. 87 77 91 54 81 ProficientDELA CRUZ, JUAN D. 80 50 71 16 29 ProficientDELA CRUZ, JUAN E. 78 43 64 14 19 Progressing towards standardsDELA CRUZ, JUAN F. 84 64 84 35 57 ProficientDELA CRUZ, JUAN G. 88 80 93 61 86 ProficientDELA CRUZ, JUAN H. 84 67 87 38 62 ProficientDELA CRUZ, JUAN I. 93 90 97 83 95 Highly ProficientDELA CRUZ, JUAN J. 87 77 91 54 81 ProficientDELA CRUZ, JUAN K. 83 61 82 28 38 ProficientDELA CRUZ, JUAN L. 79 46 68 15 24 Progressing towards standardsDELA CRUZ, JUAN M. 82 57 79 22 33 Proficient
Name SAS %ile Rank Qualitative Description
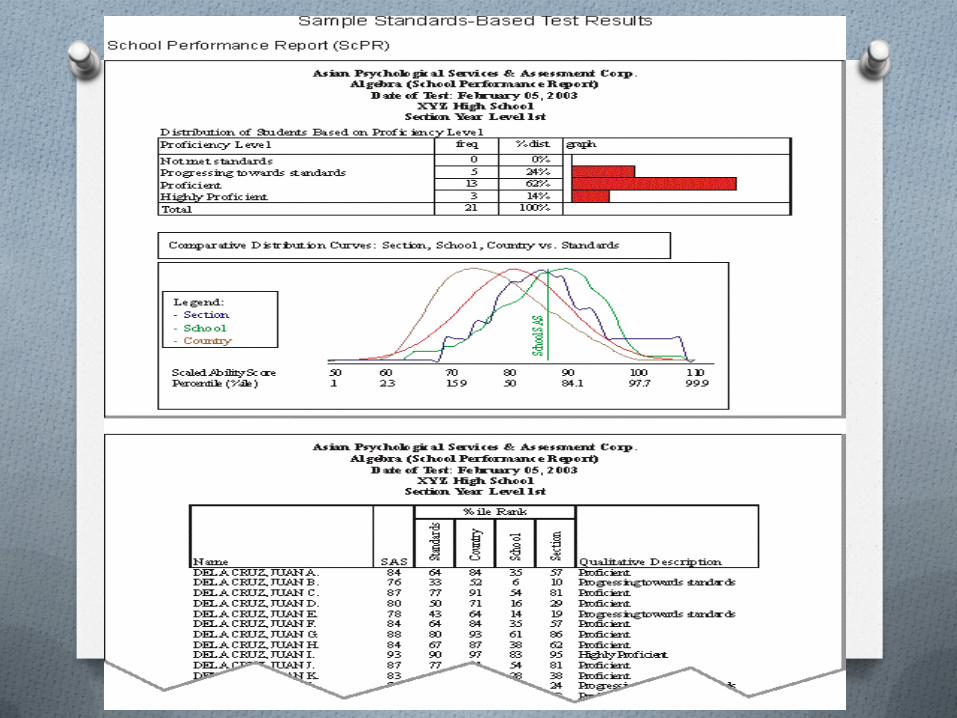
Asian Psychological Services & Assessment Corp.Algebra (School Performance Report)Date of Test: February 05, 2003XYZ High SchoolSection Year Level 1st
Distribution of Students Based on Proficiency LevelProficiency Level freq % dist graphNot met standards 0 0%Progressing towards standards 5 24%Proficient 13 62%Highly Proficient 3 14%Total 21 100%Comparative Distribution Curves: Section, School, Country vs. Standards
50.1 602.3 7015.9 8050 9084.1 10097.7 11099.9Scaled Ability ScorePercentile (%ile)Legend: - Section- School- Country School SAS
Asian Psychological Services & Assessment Corp.Algebra (School Performance Report)Date of Test: February 05, 2003XYZ High SchoolSection Year Level 1stSchool Performance Report (ScPR)Sample Standards-Based Test Results
Standards Country School SectionDELA CRUZ, JUAN A. 84 64 84 35 57 ProficientDELA CRUZ, JUAN B. 76 33 52 6 10 Progressing towards standardsDELA CRUZ, JUAN C. 87 77 91 54 81 ProficientDELA CRUZ, JUAN D. 80 50 71 16 29 ProficientDELA CRUZ, JUAN E. 78 43 64 14 19 Progressing towards standardsDELA CRUZ, JUAN F. 84 64 84 35 57 ProficientDELA CRUZ, JUAN G. 88 80 93 61 86 ProficientDELA CRUZ, JUAN H. 84 67 87 38 62 ProficientDELA CRUZ, JUAN I. 93 90 97 83 95 Highly ProficientDELA CRUZ, JUAN J. 87 77 91 54 81 ProficientDELA CRUZ, JUAN K. 83 61 82 28 38 ProficientDELA CRUZ, JUAN L. 79 46 68 15 24 Progressing towards standardsDELA CRUZ, JUAN M. 82 57 79 22 33 Proficient
Name SAS %ile Rank Qualitative Description
Asian Psychological Services & Assessment Corp.Algebra (School Performance Report)Date of Test: February 05, 2003XYZ High SchoolSection Year Level 1st
Distribution of Students Based on Proficiency LevelProficiency Level freq % dist graphNot met standards 0 0%Progressing towards standards 5 24%Proficient 13 62%Highly Proficient 3 14%Total 21 100%Comparative Distribution Curves: Section, School, Country vs. Standards
50.1 602.3 7015.9 8050 9084.1 10097.7 11099.9Scaled Ability ScorePercentile (%ile)Legend: - Section- School- Country School SAS
Asian Psychological Services & Assessment Corp.Algebra (School Performance Report)Date of Test: February 05, 2003XYZ High SchoolSection Year Level 1stSchool Performance Report (ScPR)Sample Standards-Based Test Results
SAMPLE OF SUMMARY REPORT XYZ UNIVERSITY
SY 2007-08
STANDARDS-BASED ASSESSMENT
in ENGLISH, MATH & SCIENCE GRADES 1 - 6 & YEAR 1 - 4
Asian Psychological Services and Assessment Corp. Making Standards Work!

English
Grade 1
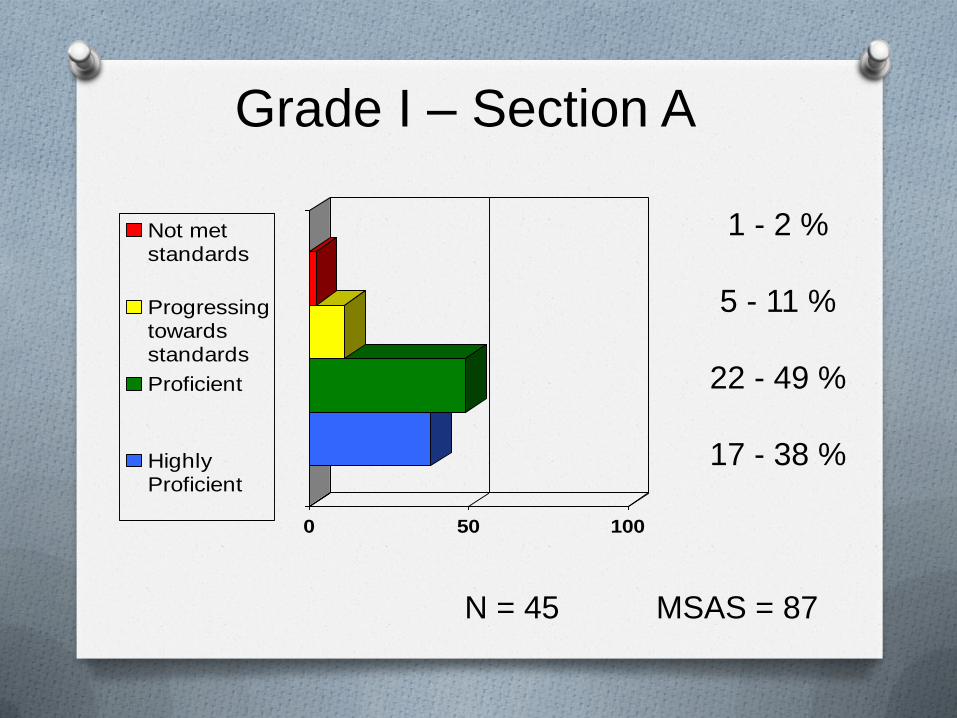
Grade I – Section A
0 50 100
Not metstandards
Progressingtowardsstandards
Proficient
HighlyProficient
1 - 2 %
5 - 11 %
22 - 49 %
17 - 38 %
N = 45 MSAS = 87
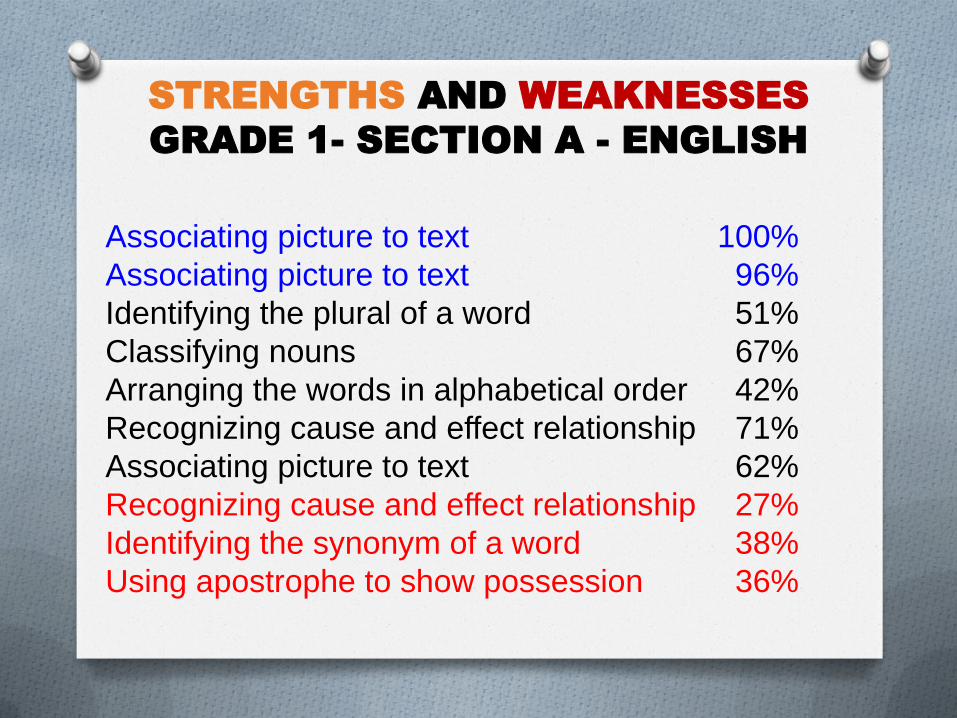
STRENGTHS AND WEAKNESSES
GRADE 1- SECTION A - ENGLISH
Associating picture to text 100%
Associating picture to text 96%
Identifying the plural of a word 51%
Classifying nouns 67%
Arranging the words in alphabetical order 42%
Recognizing cause and effect relationship 71%
Associating picture to text 62%
Recognizing cause and effect relationship 27%
Identifying the synonym of a word 38%
Using apostrophe to show possession 36%
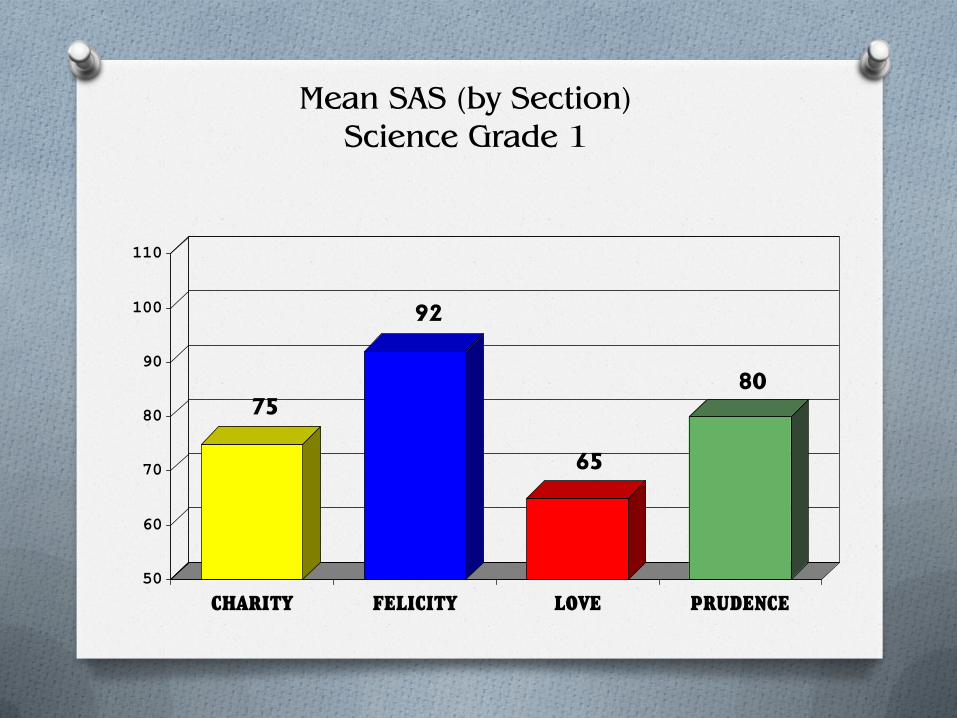
Mean SAS (by Section) Science Grade 1
75
92
65
80
50
60
70
80
90
100
110
CHARITY FELICITY LOVE PRUDENCE
Asian Psychological Services and Assessment Corp. Making Standards Work!
Summary of School Performance
SY 2012 – 2013 English- Math- Science
Grade I – Year 4
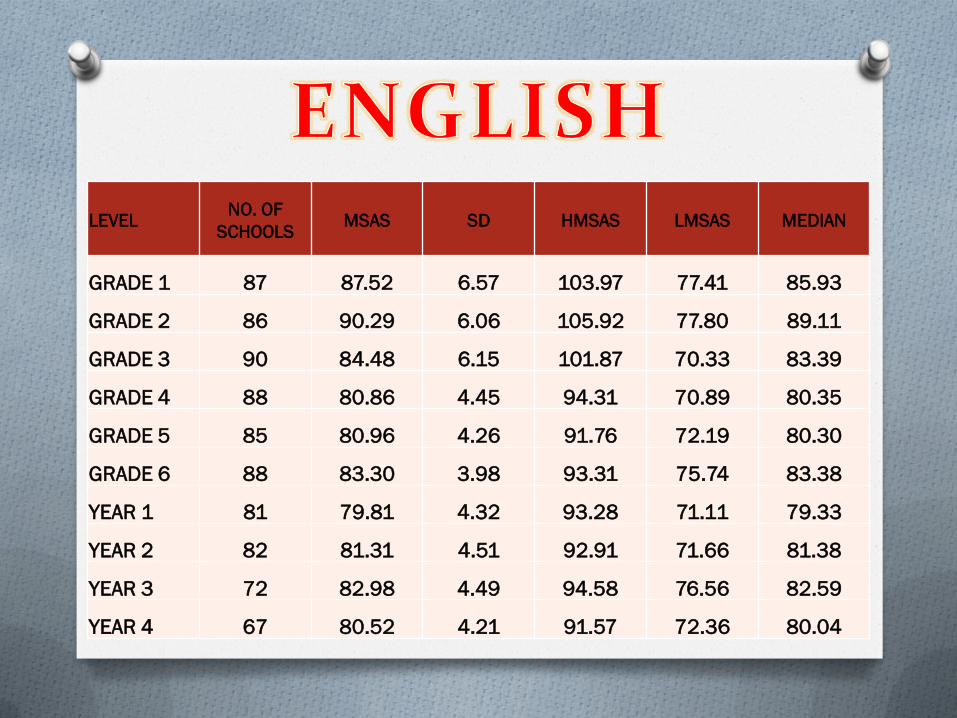
LEVEL NO. OF
SCHOOLS MSAS SD HMSAS LMSAS MEDIAN
GRADE 1 87 87.52 6.57 103.97 77.41 85.93
GRADE 2 86 90.29 6.06 105.92 77.80 89.11
GRADE 3 90 84.48 6.15 101.87 70.33 83.39
GRADE 4 88 80.86 4.45 94.31 70.89 80.35
GRADE 5 85 80.96 4.26 91.76 72.19 80.30
GRADE 6 88 83.30 3.98 93.31 75.74 83.38
YEAR 1 81 79.81 4.32 93.28 71.11 79.33
YEAR 2 82 81.31 4.51 92.91 71.66 81.38
YEAR 3 72 82.98 4.49 94.58 76.56 82.59
YEAR 4 67 80.52 4.21 91.57 72.36 80.04
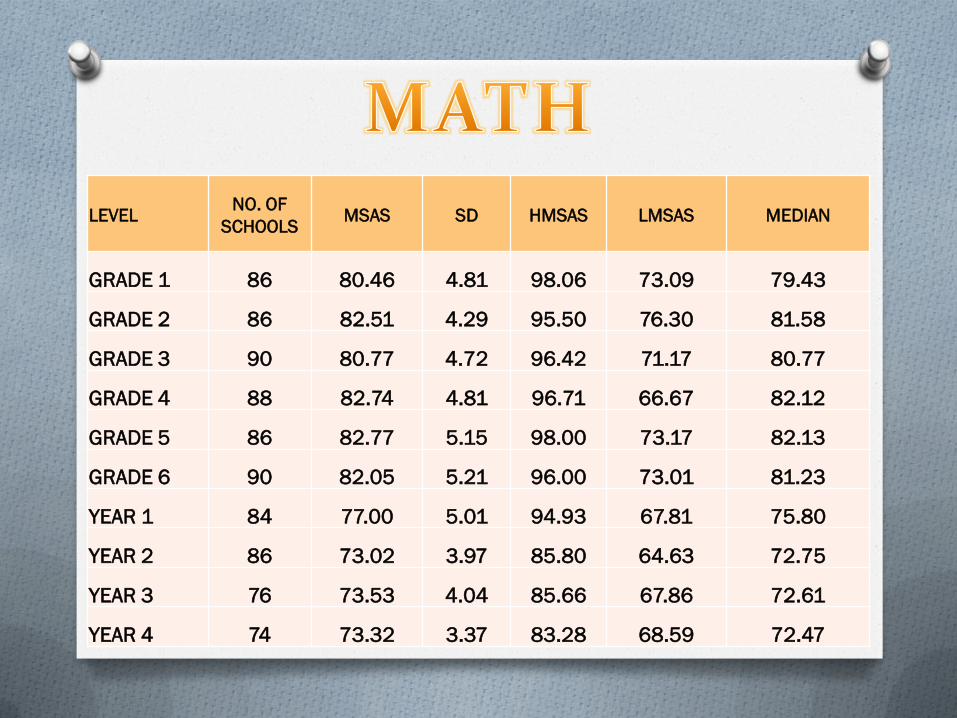
LEVEL NO. OF
SCHOOLS MSAS SD HMSAS LMSAS MEDIAN
GRADE 1 86 80.46 4.81 98.06 73.09 79.43
GRADE 2 86 82.51 4.29 95.50 76.30 81.58
GRADE 3 90 80.77 4.72 96.42 71.17 80.77
GRADE 4 88 82.74 4.81 96.71 66.67 82.12
GRADE 5 86 82.77 5.15 98.00 73.17 82.13
GRADE 6 90 82.05 5.21 96.00 73.01 81.23
YEAR 1 84 77.00 5.01 94.93 67.81 75.80
YEAR 2 86 73.02 3.97 85.80 64.63 72.75
YEAR 3 76 73.53 4.04 85.66 67.86 72.61
YEAR 4 74 73.32 3.37 83.28 68.59 72.47
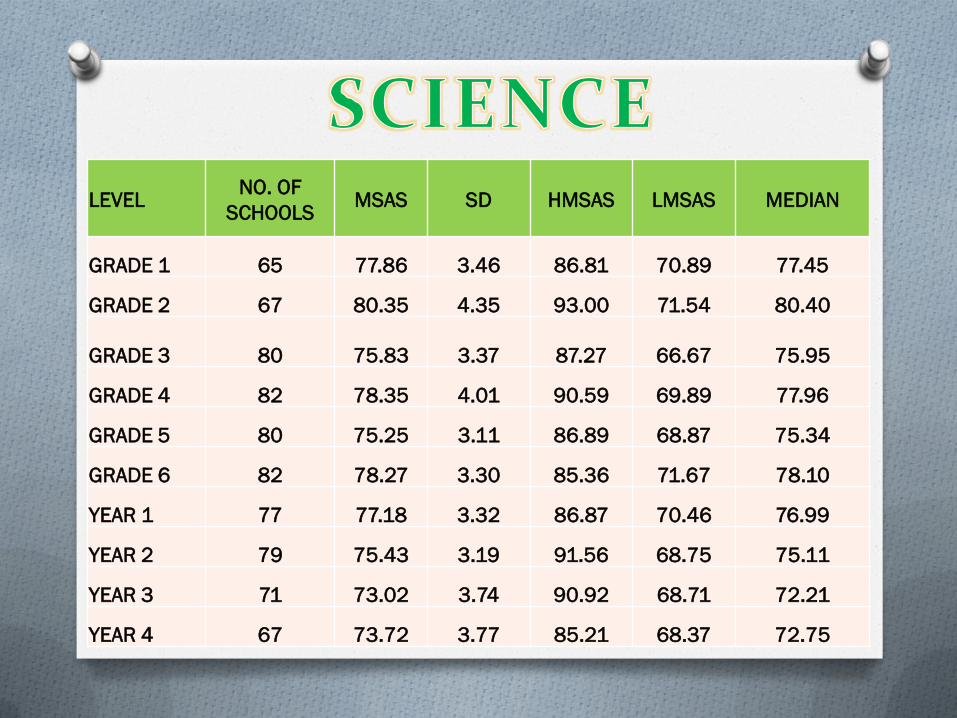
LEVEL NO. OF
SCHOOLS MSAS SD HMSAS LMSAS MEDIAN
GRADE 1 65 77.86 3.46 86.81 70.89 77.45
GRADE 2 67 80.35 4.35 93.00 71.54 80.40
GRADE 3 80 75.83 3.37 87.27 66.67 75.95
GRADE 4 82 78.35 4.01 90.59 69.89 77.96
GRADE 5 80 75.25 3.11 86.89 68.87 75.34
GRADE 6 82 78.27 3.30 85.36 71.67 78.10
YEAR 1 77 77.18 3.32 86.87 70.46 76.99
YEAR 2 79 75.43 3.19 91.56 68.75 75.11
YEAR 3 71 73.02 3.74 90.92 68.71 72.21
YEAR 4 67 73.72 3.77 85.21 68.37 72.75

For school administrators who want to reach a high
standard performance or achievement in their
educational output, the mentioned instruments are
available now for all educational institutions in our
country.
Thank your kindness in listening to this
presentation.


