
The Pricing of Structured Products – An Empirical
Investigation of the German Market
Sascha Wilkens, Carsten Erner, and Klaus Roder
University of Munster – Chair of Finance
Universitatsstraße 14-16, 48143 Munster, GERMANY
Phone: +49 251 83-22033, Fax : -22690, E-mail : [email protected]
Version:
2003-06-26
JEL classification:
G13, G24
Keywords :
Reverse Convertible, Discount Certificate, Implied Volatility, Market Microstructure
The Pricing of Structured Products – An Empirical
Investigation of the German Market
Abstract. This paper examines the issuer pricing of structured products during the ex-
change trade of November 2001. The daily closing quotes of roughly 170 reverse convert-
ibles and 740 discount certificates are compared to values based on duplication strategies
using call options traded on the Eurex (European Exchange). We investigate the average
price differences dependent on product type, issuer, and underlying. A special focus lies
on the possible influence of order flow, i. e. we analyze, using product life cycles and mon-
eyness as proxies, whether the price quotes depend on the expected volume of purchases
and sales. The study reveals significant differences in the pricing of structured products,
which can mostly be interpreted as being in favor of the issuing institution.
Version: 2003-06-26.
JEL classification: G13, G24.
Keywords: Reverse Convertible, Discount Certificate, Implied Volatility, Market Mi-
crostructure.

Contents
1 Introduction 1
2 Valuation by Duplication 4
3 Literature Review 7
4 Empirical Analysis of the German Market 9
4.1 Data Set . . . . . . . . . . . . . . . . . . . . . . . . . . . . . . . . . . . . . 9
4.2 Methodology . . . . . . . . . . . . . . . . . . . . . . . . . . . . . . . . . . 11
4.2.1 Product Matching . . . . . . . . . . . . . . . . . . . . . . . . . . . 11
4.2.2 Objects of Analysis . . . . . . . . . . . . . . . . . . . . . . . . . . . 13
4.3 Results . . . . . . . . . . . . . . . . . . . . . . . . . . . . . . . . . . . . . . 14
4.3.1 Average Price Deviations . . . . . . . . . . . . . . . . . . . . . . . . 14
4.3.2 Influence of the Order Flow . . . . . . . . . . . . . . . . . . . . . . 16
4.4 Critical Review . . . . . . . . . . . . . . . . . . . . . . . . . . . . . . . . . 21
5 Summary and Outlook 24
References 26
1
1 Introduction
Structured financial products became popular in the U. S. in the 1980s and found their
way to Europe in the mid-1990s during years of low interest rates. Meanwhile, the area
of ”financial engineering” has become an essential function in large investment firms and
commercial banks.1 In this article, we deal with two widespread forms of structured
products, namely reverse convertibles and the very similar discount certificates. Reverse
convertibles (or equity-linked notes without principal protection) were first introduced in
the U. S. by Bankers Trust in 1993. Blue-chip companies like Coca-Cola, Pfizer or John-
son & Johnson served as underlyings. The market in the U. S. for these types of securities
has since focussed on private wealth management for high net worth individuals.2
A reverse convertible has a fixed nominal value as well as an annual interest coupon,
which generally extensively exceeds the market interest rate for corresponding standard
bonds. While the interest coupons are normally due as regular payments, the special
product feature in comparison to ”normal” bonds is the issuer’s right of redemption by
either repayment of the bond’s nominal value or delivery of a previously fixed number
of specified shares at maturity. Discount certificates are a slightly modified version of
reverse convertibles: a discount certificate typically offers one or a bundle of shares at a
”discount” compared to the current market price. At maturity, these shares are physically
delivered to the holder of such a certificate if their total value does not exceed a previously
1 Structured products can generally be defined as combinations of elementary instruments from the spotand futures markets (e. g. stocks, interest rate products, derivatives). See e. g. Das (2000) for otherclassifications. In some definitions, even simple floaters are considered as structured products, sincethese can be formulated through several elements (forwards). Furthermore, in a different classification,asset backed securities are treated as structured products; see e. g. Fabozzi (1998), p. 3.
2 See Das (2000), pp. 532-533 and pp. 555-560. In contrast, the market focus for principal-protectedequity-linked notes is the retail market. For a brief history of the market development of structuredproducts in the U. S., see Toy/Ryan (2000), pp. 335-337.
2
fixed maximum repayment amount.3 Otherwise, the certificate pays this amount in cash,
i. e. in exchange for the discount, the owner of the certificate has a limited upside potential,
compared to the direct investment in stocks. A discount certificate bears the risk of a
total loss of capital, while a reverse convertible pays at least the interest coupon(s).
Reverse convertibles and discount certificates offer the attractive feature of facilitating
short positions in options without the need for access to options exchanges. There are no
explicit margin requirements, since the products’ nominal values serve as collateral for the
issuer. Thus, these securities are an easy means of implementing investment strategies
based on neutral or slightly pessimistic expectations of future price scenarios. When
trading structured products, transactions costs (e. g. bid-ask spreads) and commissions
for the private investor are usually lower, compared to the corresponding single trades
(buying bonds, selling options). This product category, therefore, generally offers a useful
extension to the capital markets.
However, all structured products face the risk of trades at prices that differ substantially
from the products’ fair values. Given that there would otherwise be no liquid trade in
the secondary market, issuers in general act as market makers for their own products
during the exchange trade. Alternatively, structured products can be bought/sold over-
the-counter from/to the issuing firm. As a consequence, almost any transaction involves
the product’s issuer as one partner of the trade. There is danger that, due to the rather
complex valuation method, unfavorable prices will be quoted. As a rule of thumb, the
higher the complexity of the products, the higher the margins incorporated in the quotes.
In the following we investigate the exchange trade of a broad range of reverse convertibles
and discount certificates in Germany during November 2001 – a randomly chosen time
period. Thereby, the main technique consists of comparing quoted product prices to costs
3 Instead of physical delivery of the underlying, contract conditions of both reverse convertibles anddiscount certificates occasionally provide cash settlements. For structured products on non-tradedassets, e. g. indices, this is the only alternative.
3
of duplication strategies using options from the Eurex, the German/Swiss futures and op-
tions exchange. Since future volatilities are unobservable, implied volatilities serve as the
most important indicators for the issuers’ pricing. We expose differences and similarities
among issuers, in order to provide insight into their pricing mechanisms. Additionally,
we identify relevant factors behind the issuers’ pricing policies. In particular, we propose
an ”order flow hypothesis” which states that the issuers orientate their pricing towards
the expected volume of purchases and sales. Due to the lack of data on traded volumes,
we rely on available variables that we believe to be most closely related to the trading
patterns. To the best of our knowledge, no comparable investigation has so far been
conducted in the German market.
Compared to appropriate duplication strategies, our study reveals an ”overpricing” of
both reverse convertibles and discount certificates. This result holds for almost all issu-
ing institutions. We identify the products’ relative life times and the moneyness of the
implicit options positions as two important parameters of the pricing policy and thus
provide evidence of the ”order flow hypothesis”. We conclude that potential buyers of
reverse convertibles and discount certificates are charged high premia for the issuers’ in-
termediation. These implicit commissions, as expected highest at issuance, have to be
compared carefully with the buyers’ alternative costs of duplication.
The paper is structured as follows: Section 2 describes the approach of valuation by
duplication. Section 3 provides a literature survey of recent studies on the market for
structured products. Our empirical analysis is presented in Section 4: after a description
of the data base, we give an overview of the methodology, e. g. the setup of duplication
strategies using options from the Eurex. The subsequent illustration of the results is
complemented by an analysis of the order flow hypothesis. Finally, Section 5 summarizes
the main results and considers future developments in the market for structured products,
as well as further research opportunities.

4
2 Valuation by Duplication
The valuation of reverse convertibles and discount certificates can be performed by the
principle of duplication, i. e. the reconstruction of the product payment profiles by means
of several single components. Leaving aside market frictions, e. g. transactions costs and
tax influences, we use the following notation:
F face value of a structured product;
T product maturity;
t current time;
τ time-to-maturity (τ = T − t);
rf riskless interest rate (continuously compounded);
rd interest rate adjusted for the default risk of bonds
(continuously compounded);
St market price of the underlying share at time t;
Di ith dividend payment on the underlying asset, i = 1, 2, . . . , n;
tDi date of the ith dividend payment, i = 1, 2, . . . , n with t ≤ tDi ≤ T ;
K strike price of an option;
σ volatility of the underlying asset
(i. e. standard deviation of the asset’s returns);
ct value of a European call option at time t;
pt value of a European put option at time t;
Ij jth interest coupon, j = 1, 2, . . . , m;
tIj date of the jth interest coupon payment, j = 1, 2, . . . , m with t ≤ tIj ≤ T ;
s number of deliverable shares;
Vt value of a structured product at time t.
5
We assume continuous compounding in all calculations and quote time periods as fractions
of a year. The most intuitive way of duplicating the profile of the reverse convertible is
the combination of a coupon-bearing bond and a short position in European put options.4
On valuation day t, assuming a flat term structure of interest rates, the coupon-bearing
bond has a value of Fe−rdτ +∑m
j=1 Ije−rd(tIj−t). The interest advantage of the reverse
convertible over a normal bond has to be offset with a short position in s put options
on the underlying shares with strike price K = Fs. If the terminal share price ST drops
below K, equivalent to a total value of underlying shares (s ·ST ) of less than the principle
value F , the issuer will choose repayment by s shares. In this case, the s put options will
be exercised against the product’s owner. Consequently, the theoretical product value Vt
at time t ≤ T is given by:
Vt = Fe−rdτ +m∑
j=1
Ije−rd(tIj−t) − s · pt. (1)
For purposes of option valuation, it is necessary to take dividend payments into account.
A common approach is the decomposition of the current stock price St into a risky com-
ponent S∗t and the present value of future dividend payments occuring until the option’s
maturity, i. e.∑n
i=1 Die−rf(tDi −t).5 Until the maturity of a European option, dividends will
be paid and therefore only S∗ is considered as the actual reference price of the underlying.6
In order to deal with the usage of call options, an alternative duplication strategy can be
derived. Replacing St by S∗t = St −∑n
i=1 Die−rf(tDi −t) and applying put-call parity for
4 The options bear no risk of default, since the structured products include short option positions andthe paid nominal value serves as collateral.
5 For simplification, we assume that there is no risk attached to dividends. Therefore, we use rf as theappropriate discount rate.
6 Thereby, it is generally assumed that the volatility of S∗t equals the one for St. See e. g. Hull (2003),p. 253.
6
European options,7 ct + Ke−rf τ = pt + S∗t , reveals:8
Vt = Fe−rdτ +m∑
j=1
Ije−rd(tIj−t) − s
(ct + Ke−rf τ − S∗t
)(2)
= F(e−rdτ − e−rf τ
)+ s (S∗t − ct) +
m∑j=1
Ije−rd(tIj−t).
The European options can easily be valued by the well-known Black/Scholes option pric-
ing model with ct = ct(S∗t , K, σ, rf , τ).9 For discount certificates, Ij = 0. Note that Vt
gives the dirty price of the structured product in monetary units (i. e. including accrued
interest), while during the exchange trade, at least in general, clean prices are quoted in
percent.10
In order to judge quoted product prices, implied option positions are compared to options
traded at the Eurex. However, stock options at the Eurex are American-style, i. e. they
offer exercise prior to maturity. The Black/Scholes model can only be applied to these
options, if it can be assured that early exercise is never optimal.11 In order to deal with
this aspect, we focus on American call options using the following relation: early exercise
can only be rational immediately prior to a dividend date tDi . If Di ≤ K(1− e−rf (tDi+1−tDi )
)
holds for all i < n and if Dn ≤ K(1− e−rf (T−tDn )
), it is never optimal to exercise American
call options before maturity.12 Only those Eurex options which satisfy these conditions
can be treated as pure European-style. Therefore, implied volatilities can be extracted –
with the current stock price St being replaced by S∗t .
7 See e. g. Hull (2003), pp. 174-175.
8 Note that for some products in the German market, the issuer must choose the type of redemption(repayment of the face value or delivery of stocks) one week before the product’s maturity. In thiscase, the remaining life time of the implicit options does not coincide with that of the product. Dueto its neglectable influence, however, we will abstract from this effect.
9 See Black/Scholes (1973). pt follows immediately from put-call-parity.
10 We apply the commonly accepted rule no. 251 of the ISMA (International Securities Markets Asso-ciation) for calculating accrued interest.
11 Otherwise, one would have to use numerical techniques, e. g. binomial trees.
12 See e. g. Hull (2003), pp. 254-255.
7
3 Literature Review
The market for structured products which is analyzed in this paper, has rarely been the
object of empirical study. Chen/Kensinger (1990) analyze ”Market-Index-Certificates of
Deposit” (MICD) in the U. S. market, which pay a guaranteed minimum interest rate and
a variable interest rate pegged to the performance of the S&P 500.13 Their sample includes
18 of these products in January 1988 and 25 in January 1989 issued by Chase Manhattan
and Murray Savings. A comparison of the implied volatility of the S&P 500 option with
the implied volatility concerning the option component of the MICDs, reveals significant
positive and negative differences between theoretical and market values. Chen/Kensinger
find inconsistencies in the pricing among issuers, as well as among MICDs of different
maturities and different types offered by the same issuer.
Chen/Sears (1990) investigate the ”S&P 500 Index Note” (SPIN) issued by Salomon
Brothers, which is very similar to the MICDs, but exchange-traded. They focus on devel-
opment over time in the pricing of this product between its issuance in September 1986
and December 1987. After computing the differences between market and model prices
(using ex-post, average implied and long-term implied volatilities), they diagnose over-
pricing in the first sub period of about 5 %. In the second and third sub period, the
product was underpriced. Following Chen/Sears, the first sub period could represent a
”seasoning” period for this new type of security.
Baubonis/Gastineau/Purcell (1993) analyze equity-linked certificates of deposit, similar
to the MICDs examined by Chen/Kensinger (1990). However, the focus of Baubo-
nis/Gastineau/Purcell is to provide a guide for banks. They discuss the functionality
of such products and consider hedging and tax implications. In addition, they take a
13 It should be noted that these products have convex payment profiles (fixed minimum returns –principal-protected equity-linked notes), in contrast to the concave ones of reverse convertibles anddiscount certificates (fixed maximum returns – equity-linked notes without principal protection).
8
closer look at the products’ cost structure. Using a Citicorp product as an example, they
demonstrate that the bank can earn a gross fee of 2.5 % to 4 % of the selling price in the
primary market. The authors argue that this might lead to criticism, since the fees are not
disclosed in the same way as for mutual funds. However, compared to other equity-linked
products, this fee seems appropriate.
With regard to overpricing at issuance and underpricing in the secondary market the re-
sults of Wasserfallen/Schenk (1996) are similar to those of Chen/Sears (1990). Wasser-
fallen/Schenk examine the pricing of 13 capital-protected products in the Swiss market,
issued between January 1991 and April 1992. The comparison of the products’ option
components with the historical and the implied volatility of the Swiss Market Index, shows
that the securities are sold slightly above their theoretical values. In the secondary mar-
ket, the model overpredicts observed prices. With relative errors generally below 10 %,
Wasserfallen/Schenk conclude that these products are generally fairly priced.
Another study for the Swiss market is conducted by Burth/Kraus/Wohlwend (2001),
who test the initial pricing of 199 reverse convertibles and 76 discount certificates that
were outstanding at August 1, 1999. Exchange-traded options are employed to assess
the product pricing. The mispricing, mostly in favor of the issuing institution, differs
among the 15 issuers. On average, the price differences between theoretical and market
values are 1.91 % with a standard deviation of 2.39 %. They also observe differences
in the pricing of fixed-coupon paying reverse convertibles (mean deviation: 3.22 %) and
discount certificates (mean deviation: 1.40 %). In addition, the existence of a co-lead
manager is identified as a significant factor influencing product prices at issuance.
9
4 Empirical Analysis of the German Market
4.1 Data Set
The timeframe of our analysis extends from November 1, 2001 through November 30, 2001,
thus covering twenty-two trading days.14 From a market point of view, this period is char-
acterized by a fairly steady market rebound. The German stock index DAX (Deutscher
Aktienindex), representing thirty of the largest corporations with respect to trading vol-
ume and market capitalization, rose 7.6 %, while the NEMAX All-Share Index as the
market indicator for the German high-tech market segment (Neuer Markt)15 climbed
12.6 %, both as part of the recovery from the September 11 losses.
General Data. For the risk-free interest rate, we assigned the one- to twelve-months
Euribor (Euro Interbank Offered Rate) to the respective time-to-maturity. For τ > 11.5
months, we applied the twelve-months rate. With respect to the appropriate default-
adjusted interest rates of corporate bonds, we refer to the bond indices of Lehman Broth-
ers16, which indicate average discrete credit spreads of approximately 100 basis points over
Euribor. For the underlying stocks, we used the daily closing prices from the XETRA
(Exchange Electronic Trading) system of the Frankfurt Stock Exchange. Since we had to
take dividends into account, we used estimations of expected dividends and of expected
payment dates until the business year 2003. Due to very unstable predictions of dividends
for the NEMAX stocks, we considered only dividends for DAX stocks. This is, however,
14 Euribor data and stock prices were taken from Datastream. Information on expected dividends wereobtained from the financial data provider OnVista (http://www.onvista.de), which also delivered thequote records for the structured products. We would like to thank Dr. Carsten Friedrichs for hisassistance in obtaining this part of the data. The quote records were originally gathered from differentdata vendors, e. g. Reuters. The Eurex options data was provided by Deutsche Borse.
15 DAX and NEMAX are comparable to the Dow Jones Industrial and the NASDAQ Composite in theU. S.
16 ”Pan-European Aggregate” – Corporate Bonds (one through three years to maturity) and CorporateBonds (AAA rating). Source: Datastream.
10
not critical since only a few NEMAX companies pay – very low – dividends. Pursuing
our duplication approach, we can examine only those underlyings for which options are
traded on the Eurex. Hence, the data sets for both the structured products and the Eurex
options refer to the thirty DAX companies and to eight NEMAX companies.17
Structured Products. Where obtainable, the data set includes the daily closing quotes
of the products (i. e. bid/ask prices). For our analysis, we use the mid-quotes calculated as
the arithmetic averages of the bid and ask quotes.18 We manually excluded quotes which
were obviously mistyped or otherwise inconsistent.19 The remaining data set covers only
those records for which a Eurex option could be assigned as a matching partner. We ex-
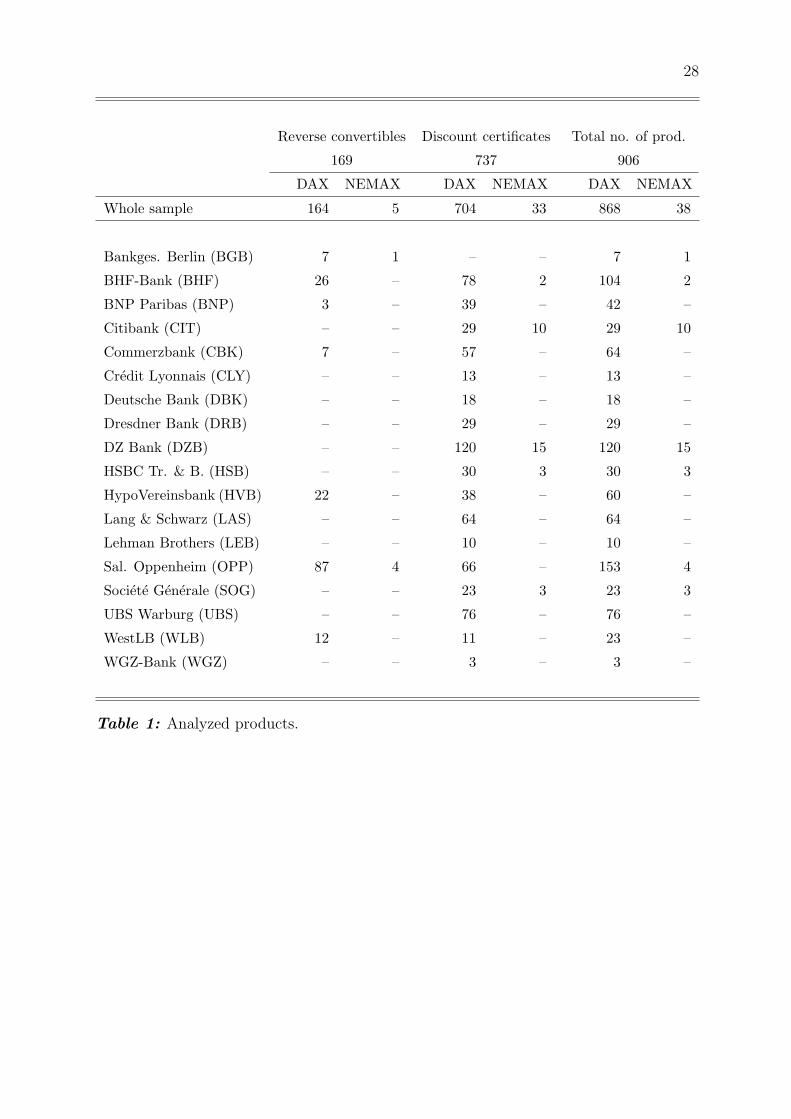
amine quote records of 169 different reverse convertibles and quote records of 737 different
discount certificates. The composite of this data set, with respect to issuers and stock
affiliation, can be obtained from Table 1.
[Insert Table 1 here . . . ]
Eurex Options. Following the duplication scheme from Section 2, we choose call op-
tions for rebuilding the product profiles. Transactions data were preferred to settlement
prices, since the latter do not always reflect real trading opportunities. We applied the
17 NEMAX companies: Aixtron, Broadvision, Consors, EM.TV, Intershop, Mobilcom, Qiagen and T-Online.
18 The average percentual spread is 0.27 % for the reverse convertibles and 0.58 % for the discountcertificates.
19 We eliminated those records where the implied options had either a time-to-maturity of less thanor equal to seven calendar days or a price of less than 10 Euro Cent. Records with implicit optionsviolating the upper (ct ≤ S∗t ) or lower (ct ≥ S∗t − Ke−rf τ ) arbitrage boundaries, see Hull (2003),pp. 171-174, were excluded. Additional records for which the implied volatility could not be specified,were deleted as well. In order to allow for a well-founded diagnosis, products with less than threeprice observations in November 2001 were removed from the data base. Since Goldman-Sachs aswell as J. P. Morgan offered only one structured product each, these two issuers were excluded fromour analysis. Occasionally, for the period of 22 trading days, there were less than 22 quote recordsavailable. This lead to an average of 18.2 (19.4) records per product for the reverse convertibles(discount certificates) in the data set resulting in a total number of 3,075 (14,308) records for thereverse convertibles (discount certificates).
11
same exclusion criteria as for the structured products.20 Since the options are American-
style and thus offer early exercise, we eliminated those options which did not fulfill the
dividend criterion discussed in Section 2. The remaining set contains 42,052 trade records
of which 41,141 belong to options with an underlying from the DAX and 911 with an
underlying from the NEMAX. The data set shows that in some underlyings, due to little
trading activity, there are only a few trade records available. That is especially true for
the NEMAX stocks: while there are on average 62.3 records per underlying and trading
day for the DAX options, we only have 5.2 records for the NEMAX options.
4.2 Methodology
4.2.1 Product Matching
First of all, a ”matching” procedure for structured products and exchange-traded op-
tions has to be established. Bearing in mind the well-documented empirical phenomena
concerning the implied volatilities of options – smile/smirk/sneer effect and term struc-
ture characteristic – the assignment should, in particular, minimize differences in both
strike price and time-to-maturity. The matching mechanism, however, is not straightfor-
ward, since in a one-dimensional grouping approach, priority must be given to either the
differences in strikes or in times-to-maturity. We employed a simple but, in our view,
reasonable assignment mechanism: since it is commonly known from empirical research
that the smile effect of implied volatility is much more evident than the term structure,21
we gave priority to the differences in strike prices. Hence, for any combination of prod-
uct and possible Eurex options as matching partners, we applied the following rules: in
the first step, those options are chosen that provide the lowest deviation in strike price.
20 In addition, we excluded violations of the law-of-one-price (i. e. identical options traded at the sametime at different prices).
21 See e. g. Hull (2003), pp. 334-337.
12
If there is more than one matching partner left, in the second step, the ones with the
slightest deviation in time-to-maturity are chosen from the remaining set. Thirdly, the
slightest deviation in trading time determined the choice between the matching partners
from the remaining set. Finally, in the rare case of still more than one potential matching
partner, one option was randomly selected.
The assignment procedure was conducted identically for both reverse convertibles and
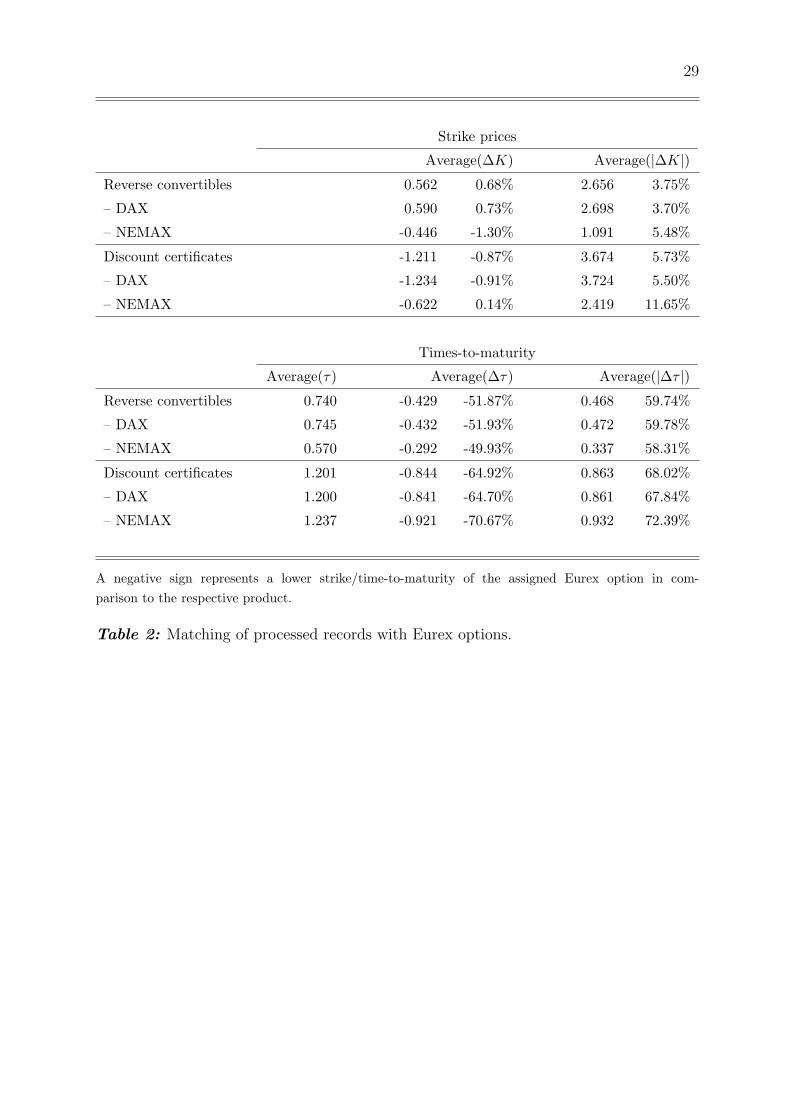
discount certificates. The results of the assignment of the Eurex options to the struc-
tured products is documented in Table 2. On average, we had approximately 100 Eurex
options as potential matching partners per record. It can be deducted that the mean
unsigned differences in strike prices (times-to-maturity) amount to 3.75 % (59.74 %) for
the reverse convertibles and to 5.73 % (68.02 %) for the discount certificates. From the
signed differences, one can obtain the fact that times-to-maturity of the assigned Eurex
options are lower than for the products. This is due to the fact that the Eurex options
have much shorter times-to-maturity than the structured products. With respect to the
signed differences in strike prices, one cannot derive any biases. This is not surprising,
since, in contrast to the times-to-maturity, the choice neither of the strikes of the Eurex
options nor of the products is restricted. It is interesting to note that although there is
little trading activity of the NEMAX options and we thus have fewer possible matching
partners, the deviations of the NEMAX underlyings do not differ substiantially from those
of the DAX products. The average deviation in trading time amounted to approximately
five hours for both reverse convertibles and discount certificates.
In combination of the two dimensions strike and time-to-maturity, the matching results
reflect the chosen matching approach. As we gave the strike the higher priority, it is
stringent that they show smaller deviations. The ratio of strike and time-to-maturity
deviations did not call into question the validity of our decision, since large deviations in
the times-to-maturity do not affect option prices as much as deviations in the strikes.
13
[Insert Table 2 here . . . ]
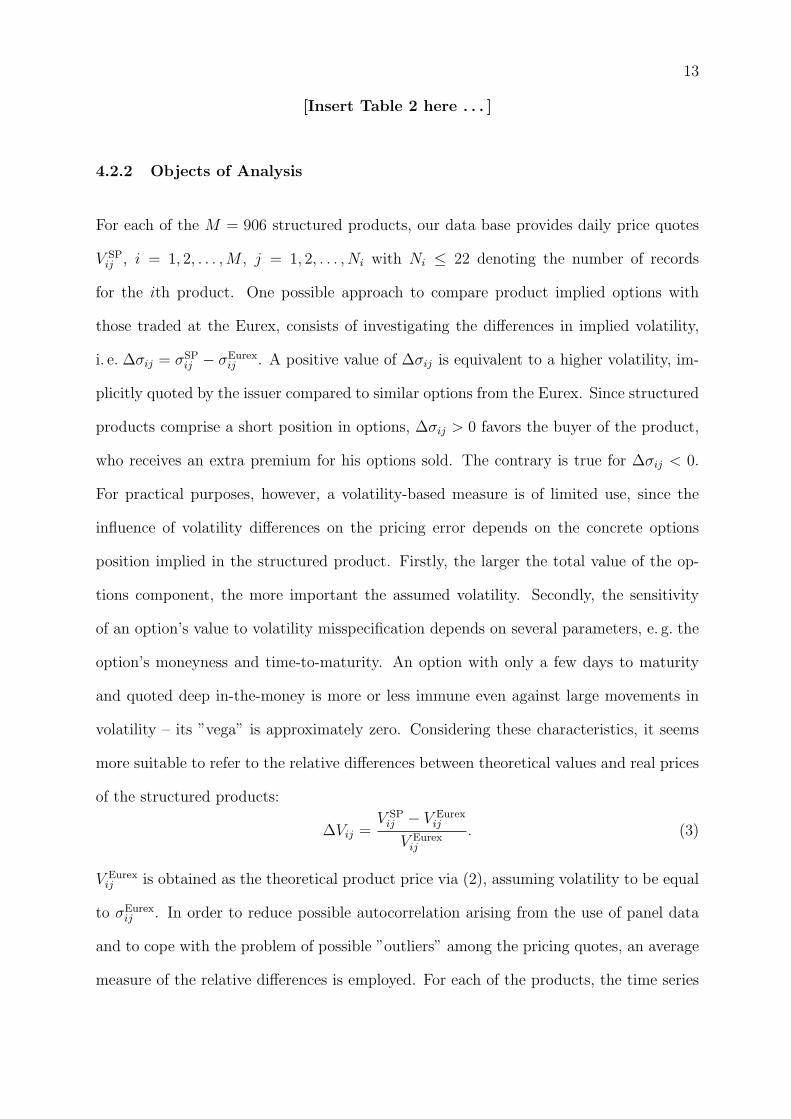
4.2.2 Objects of Analysis
For each of the M = 906 structured products, our data base provides daily price quotes
V SPij , i = 1, 2, . . . , M , j = 1, 2, . . . , Ni with Ni ≤ 22 denoting the number of records
for the ith product. One possible approach to compare product implied options with
those traded at the Eurex, consists of investigating the differences in implied volatility,
i. e. ∆σij = σSPij − σEurex
ij . A positive value of ∆σij is equivalent to a higher volatility, im-
plicitly quoted by the issuer compared to similar options from the Eurex. Since structured
products comprise a short position in options, ∆σij > 0 favors the buyer of the product,
who receives an extra premium for his options sold. The contrary is true for ∆σij < 0.
For practical purposes, however, a volatility-based measure is of limited use, since the
influence of volatility differences on the pricing error depends on the concrete options
position implied in the structured product. Firstly, the larger the total value of the op-
tions component, the more important the assumed volatility. Secondly, the sensitivity
of an option’s value to volatility misspecification depends on several parameters, e. g. the
option’s moneyness and time-to-maturity. An option with only a few days to maturity
and quoted deep in-the-money is more or less immune even against large movements in
volatility – its ”vega” is approximately zero. Considering these characteristics, it seems
more suitable to refer to the relative differences between theoretical values and real prices
of the structured products:
∆Vij =V SP
ij − V Eurexij
V Eurexij
. (3)
V Eurexij is obtained as the theoretical product price via (2), assuming volatility to be equal
to σEurexij . In order to reduce possible autocorrelation arising from the use of panel data
and to cope with the problem of possible ”outliers” among the pricing quotes, an average
measure of the relative differences is employed. For each of the products, the time series
14
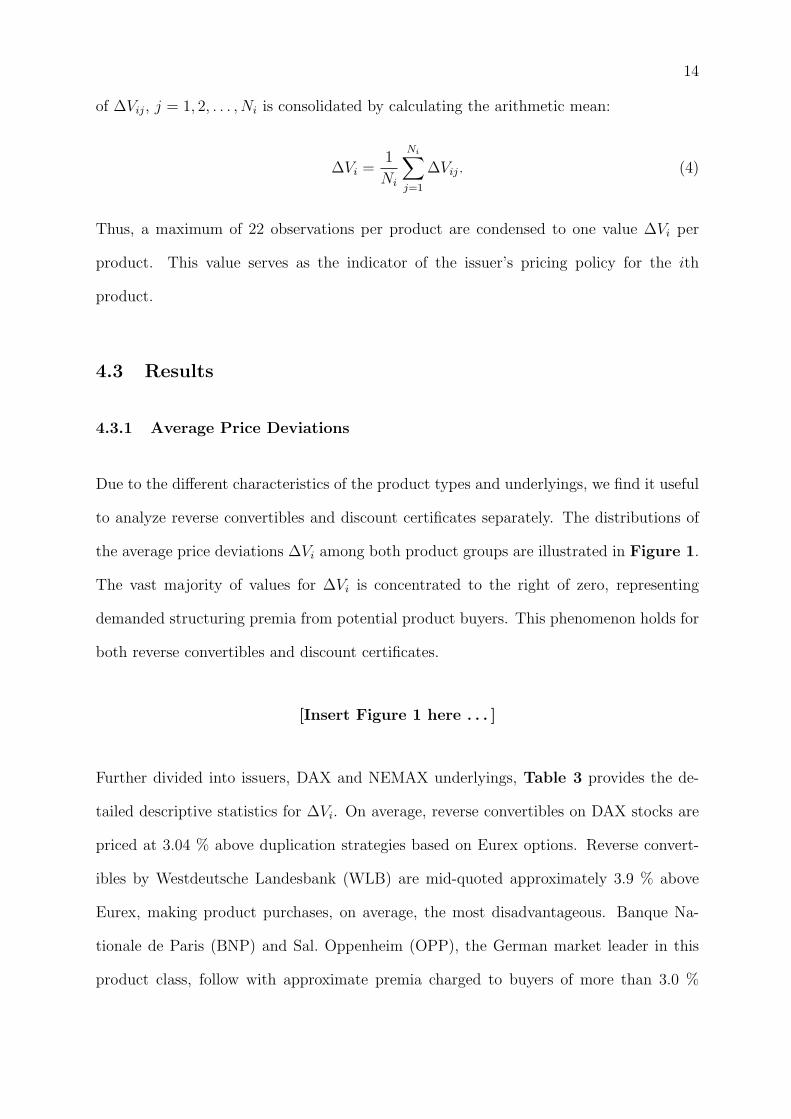
of ∆Vij, j = 1, 2, . . . , Ni is consolidated by calculating the arithmetic mean:
∆Vi =1
Ni
Ni∑j=1
∆Vij. (4)
Thus, a maximum of 22 observations per product are condensed to one value ∆Vi per
product. This value serves as the indicator of the issuer’s pricing policy for the ith
product.
4.3 Results
4.3.1 Average Price Deviations
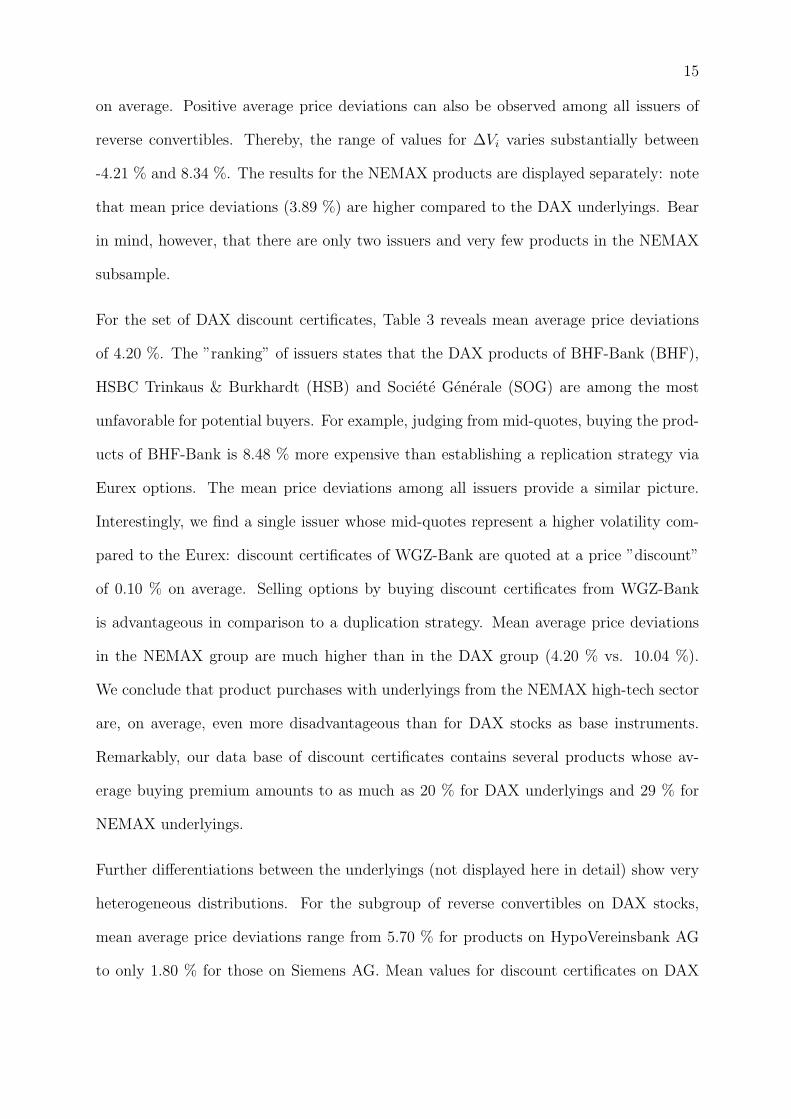
Due to the different characteristics of the product types and underlyings, we find it useful
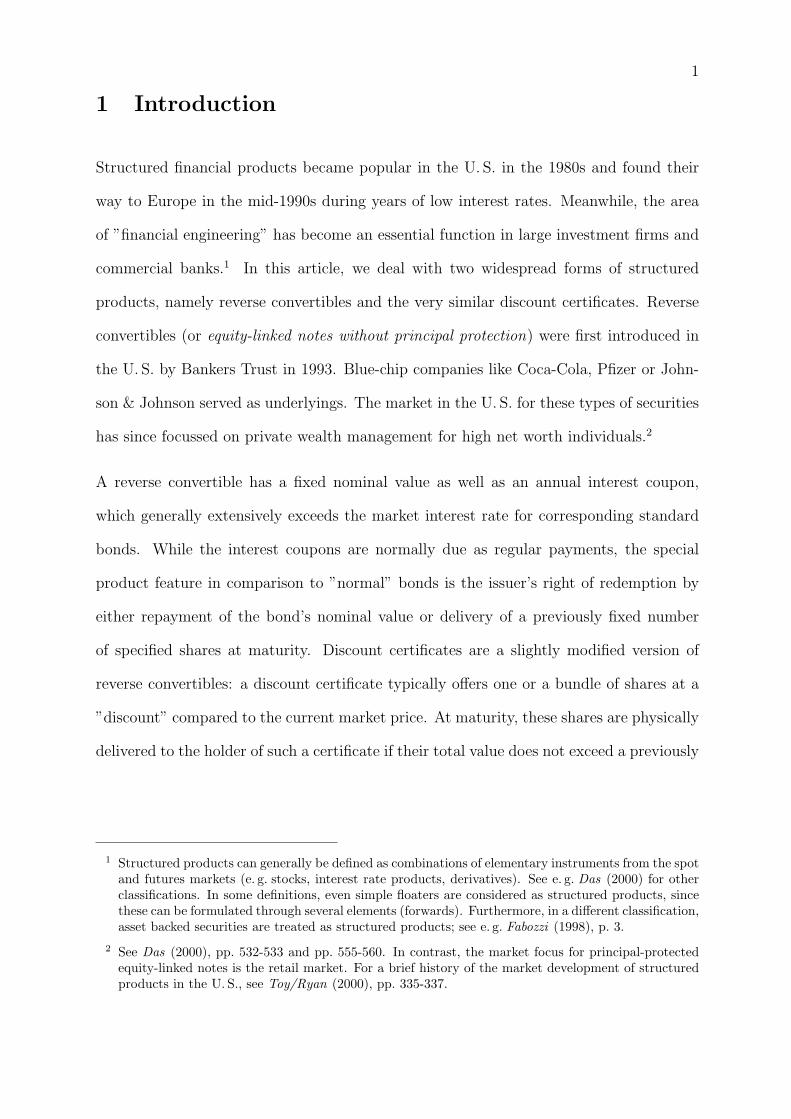
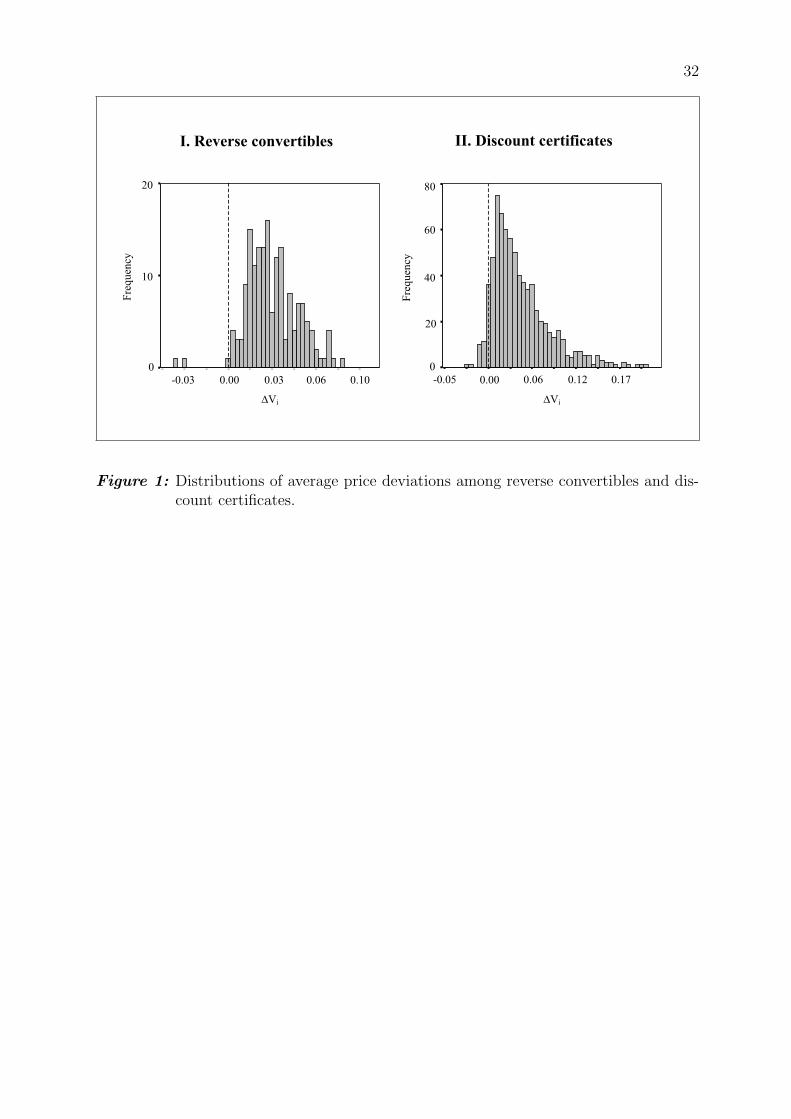
to analyze reverse convertibles and discount certificates separately. The distributions of
the average price deviations ∆Vi among both product groups are illustrated in Figure 1.
The vast majority of values for ∆Vi is concentrated to the right of zero, representing
demanded structuring premia from potential product buyers. This phenomenon holds for
both reverse convertibles and discount certificates.
[Insert Figure 1 here . . . ]
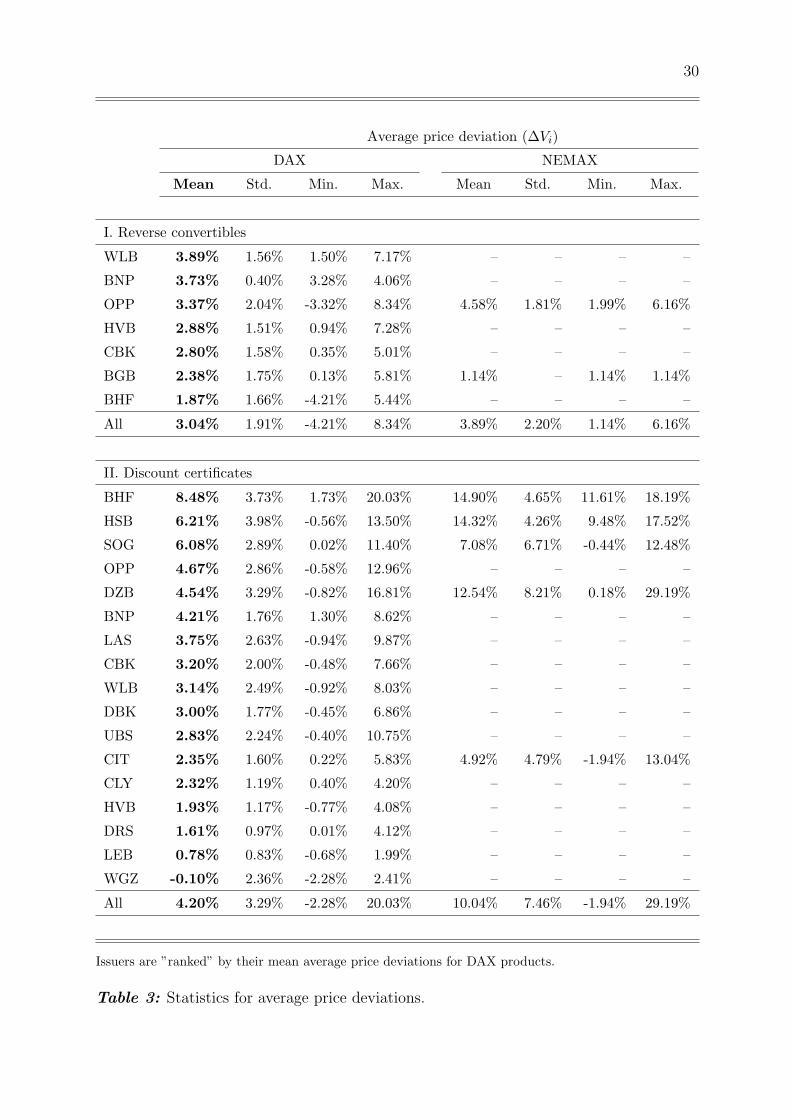
Further divided into issuers, DAX and NEMAX underlyings, Table 3 provides the de-
tailed descriptive statistics for ∆Vi. On average, reverse convertibles on DAX stocks are
priced at 3.04 % above duplication strategies based on Eurex options. Reverse convert-
ibles by Westdeutsche Landesbank (WLB) are mid-quoted approximately 3.9 % above
Eurex, making product purchases, on average, the most disadvantageous. Banque Na-
tionale de Paris (BNP) and Sal. Oppenheim (OPP), the German market leader in this
product class, follow with approximate premia charged to buyers of more than 3.0 %
15
on average. Positive average price deviations can also be observed among all issuers of
reverse convertibles. Thereby, the range of values for ∆Vi varies substantially between
-4.21 % and 8.34 %. The results for the NEMAX products are displayed separately: note
that mean price deviations (3.89 %) are higher compared to the DAX underlyings. Bear
in mind, however, that there are only two issuers and very few products in the NEMAX
subsample.
For the set of DAX discount certificates, Table 3 reveals mean average price deviations
of 4.20 %. The ”ranking” of issuers states that the DAX products of BHF-Bank (BHF),
HSBC Trinkaus & Burkhardt (HSB) and Societe Generale (SOG) are among the most
unfavorable for potential buyers. For example, judging from mid-quotes, buying the prod-
ucts of BHF-Bank is 8.48 % more expensive than establishing a replication strategy via
Eurex options. The mean price deviations among all issuers provide a similar picture.
Interestingly, we find a single issuer whose mid-quotes represent a higher volatility com-
pared to the Eurex: discount certificates of WGZ-Bank are quoted at a price ”discount”
of 0.10 % on average. Selling options by buying discount certificates from WGZ-Bank
is advantageous in comparison to a duplication strategy. Mean average price deviations
in the NEMAX group are much higher than in the DAX group (4.20 % vs. 10.04 %).
We conclude that product purchases with underlyings from the NEMAX high-tech sector
are, on average, even more disadvantageous than for DAX stocks as base instruments.
Remarkably, our data base of discount certificates contains several products whose av-
erage buying premium amounts to as much as 20 % for DAX underlyings and 29 % for
NEMAX underlyings.
Further differentiations between the underlyings (not displayed here in detail) show very
heterogeneous distributions. For the subgroup of reverse convertibles on DAX stocks,
mean average price deviations range from 5.70 % for products on HypoVereinsbank AG
to only 1.80 % for those on Siemens AG. Mean values for discount certificates on DAX

16
stocks vary between 9.46 % for HypoVereinsbank AG and 1.93 % for Schering AG as
underlyings. Among the small group of reverse convertibles and discount certificates with
NEMAX underlyings, the highest mean value of ∆Vi = 17.51 % is observed for products on
Consors AG. Finally, we take a brief look at differences between reverse convertibles and
discount certificates on the same underlyings: for eight stocks, we do not have products
in both classes. The remaining stocks do not permit a general statement. The largest
differences in means are diagnosed for T-Online AG (5.70 % for the reverse convertibles
vs. 12.83 % for the discount certificates) while products from both classes on E.ON AG
are almost identically ”mispriced” (3.51 % vs. 3.53 %).
[Insert Table 3 here . . . ]
In general, the analysis of quoted product prices shows, at least on average, that it would
be less costly to rebuild nearly any of the product profiles as illustrated in Section 2 than
to buy reverse convertibles and/or discount certificates at quoted (mid-)prices.
4.3.2 Influence of the Order Flow
As we have seen in the previous section, the pricing behavior among the issuers is, on av-
erage, clearly in favor of the product sellers. On the one hand, buying reverse convertibles
or discount certificates is disadvantageous compared to a duplication strategy via Eurex
options. On the other hand, issuers offer the possibility of buying back their products
before maturity.22 With the bid-ask prices being substantially different quoted from the
products’ fair values, issuers have to bear the risk of investors selling back their positions
at excessively high prices. Since the issuers do not know which kind of trade they are
22 According to the regulations of the market model of the European Warrant Exchange (EUWAX)in Stuttgart, the issuers have agreed to act as market makers. Hence, they always become thecounterpart of a trade whenever there is no direct partner for the transaction.
17
facing when quoting bid and ask prices, the diagnosed mispricing makes sense only if
there are on average, far more product sales than repurchases. Unfortunately, specific
information on both exchange and off-exchange trading volumes is usually not publicly
available.
[Insert Figure 2 here . . . ]
In order to derive a relationship between the issuers’ pricing policies and the order flow,
we have to rely on adequate ”proxies”. Firstly, the life cycle of the products is a variable
for which a close relation with the order flow can be fairly assumed. At issuance TIss,
only sales can occur from the issuers’ point of view. With maturity approaching, sales
decrease since (i) the issuance volume is limited and (ii) products with only a short time-
to-maturity are demanded less often than those that were issued recently. Moreover, as
time progresses, product repurchases tend to increase, since investors, probably due to
changed expectations concerning the future development of the underlying, prefer to offset
their positions. Based on this expected trading pattern and recent trading experience,
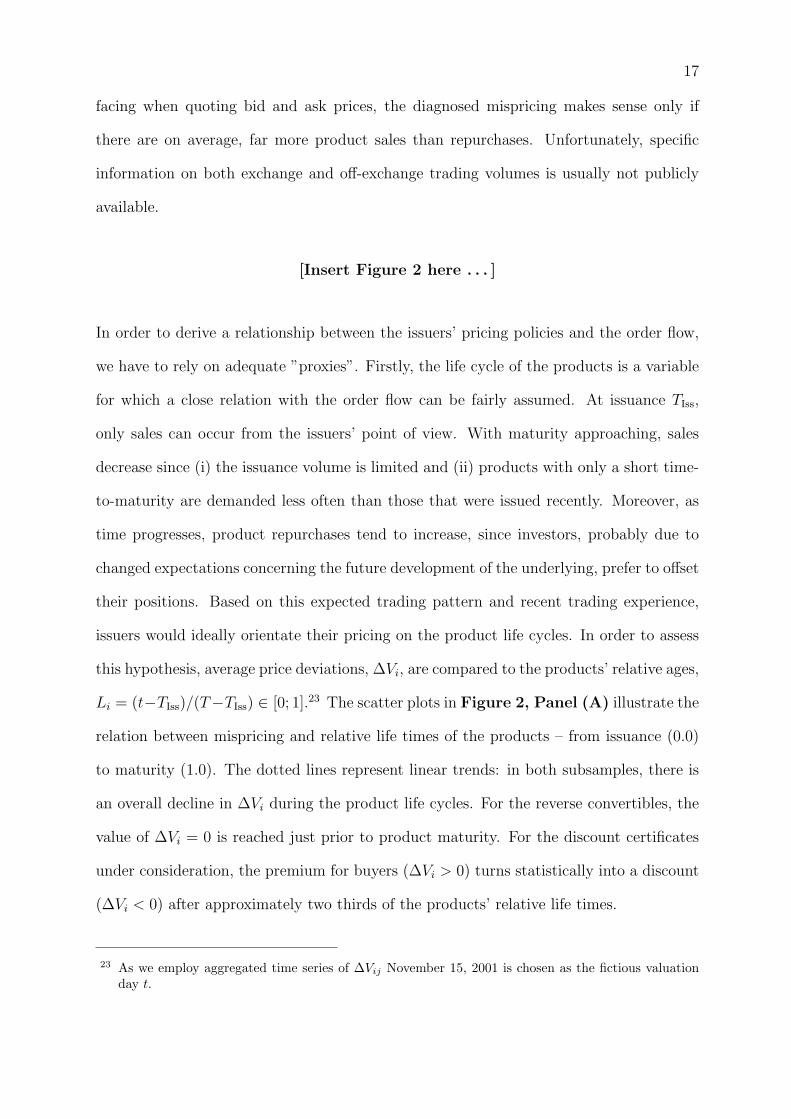
issuers would ideally orientate their pricing on the product life cycles. In order to assess
this hypothesis, average price deviations, ∆Vi, are compared to the products’ relative ages,
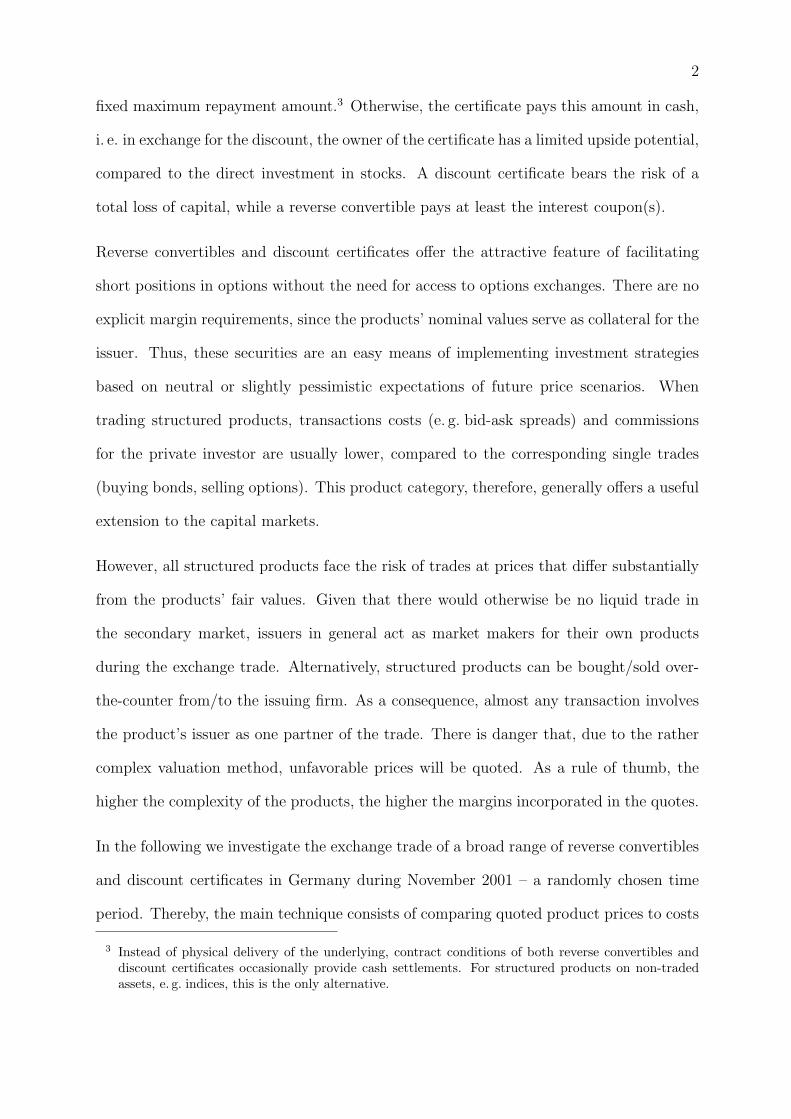
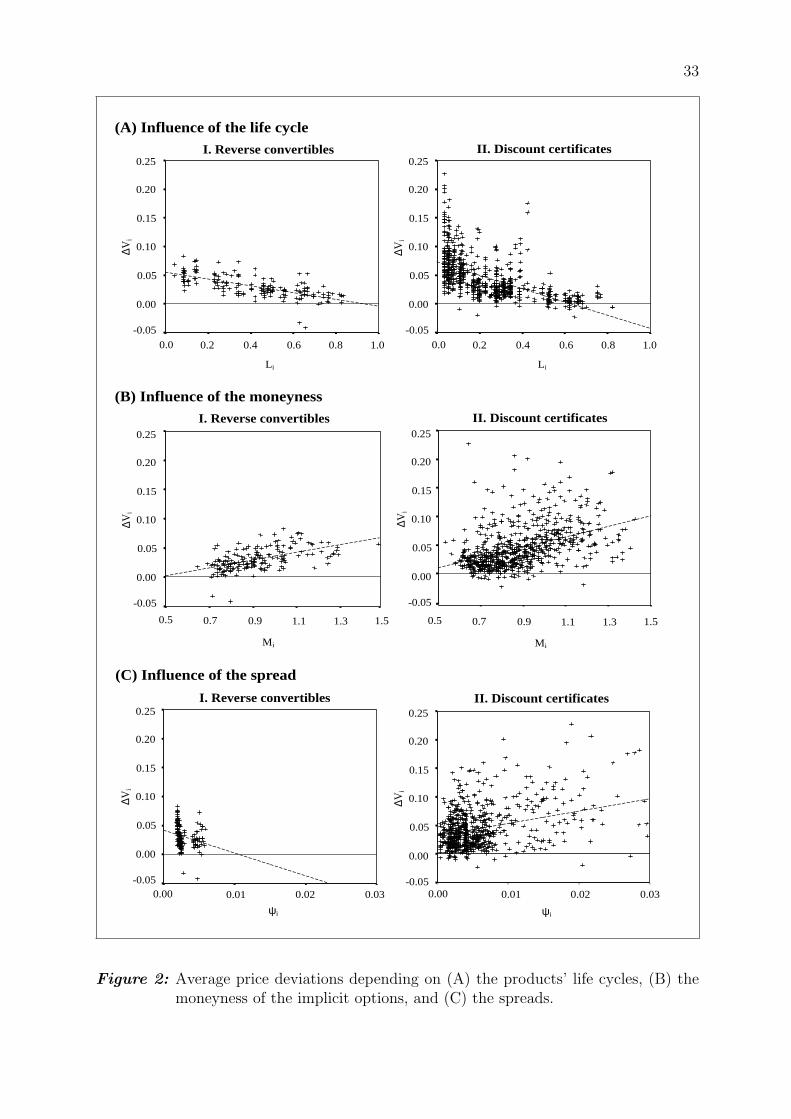
Li = (t−TIss)/(T−TIss) ∈ [0; 1].23 The scatter plots in Figure 2, Panel (A) illustrate the
relation between mispricing and relative life times of the products – from issuance (0.0)
to maturity (1.0). The dotted lines represent linear trends: in both subsamples, there is
an overall decline in ∆Vi during the product life cycles. For the reverse convertibles, the
value of ∆Vi = 0 is reached just prior to product maturity. For the discount certificates
under consideration, the premium for buyers (∆Vi > 0) turns statistically into a discount
(∆Vi < 0) after approximately two thirds of the products’ relative life times.
23 As we employ aggregated time series of ∆Vij November 15, 2001 is chosen as the fictious valuationday t.
18
Secondly, we assume that the moneyness of the implicit positions in put options might
be driving the observed pricing pattern, because it determines the product’s current risk
to be redeemed by shares. We define the options’ moneyness for product i on day j =
1, 2, . . . , Ni by Mij = St/Kij and condense the values to averages Mi, i = 1, 2, . . . , Ni
analog to (4). The relationship between Mi and ∆Vi is described in Figure 2, Panel (B).
Assuming a linear dependence, the average mispricing increases with the moneyness,
i. e. the reduction of the put options’ intrinsic values in both subsamples. Although the
appropriateness, especially of a linear relationship, can be called into question, the results
are plausible: as the implicit put options turn out-of-the-money, the probability of a
product redemption by shares decreases. Therefore, the issuers demand an extra-premium
when selling such products – a surcharge that cannot be justified however, if a hedging
via Eurex options is possible. On the contrary, products with in-the-money options and
an increased risk of a repayment by shares can be sold more easily when the structurers’
premia are reduced.
Thirdly, besides the absolute level of mid-quotes, bid/ask spreads serve as a second pricing
parameter for the issuers. The spreads can intensify or decrease the effect of intended
price deviations and they are the only variable that can be observed directly. The product
spreads, given by Ψij = (Ask quoteij − Bid quoteij)/Mid quoteij, are consolidated to
values Ψi, i = 1, 2, . . . , Ni similar to (4). Figure 2, Panel (C) illustrates the relation
between ∆Vi and Ψi: Contrary to Li and Mi, the influence of the spread on pricing
differences is less evident. Among the reverse convertibles, we observe declining price
deviations for large spreads. This phenomenon could be explained as follows: if large
price surcharges, given by ∆Vi > 0, are not appropriate for the issuers (e. g. in the case of
numerous expected repurchases), they could use widened spreads as alternative sources
of earnings.24 For the group of discount certificates, the results are more difficult to
24 It should be noted that according to the market model, spreads at the EUWAX are limited.
19
interpret, since premia charged to potential buyers coincide with large spreads.
[Insert Table 4 here . . . ]
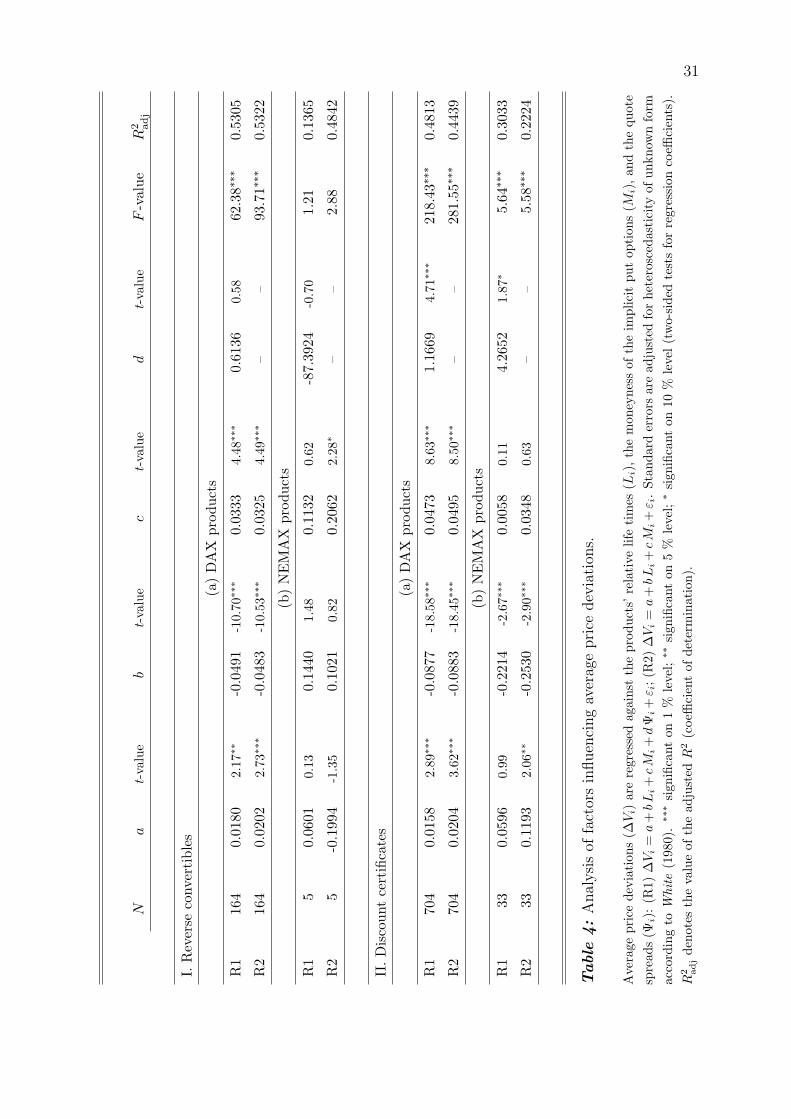
Combining our single graphical analyses from Figure 2 and assessing the order flow hy-
pothesis from a formal econometric point of view, average price deviations (∆Vi) are
jointly regressed against the products’ relative life times (Li), the moneyness of the im-
plicit put options (Mi), and the quote spreads (Ψi). In particular, we run the following
regression:
∆Vi = a + b Li + cMi + d Ψi + εi (5)
with a, b, c, d ∈ R.25 As we employ cross-sectional data, it should be considered whether
this approach effects confidence levels in regression (5). In particular, heteroscedasticity
causes usual confidence levels to be biased. In order to cope with this problem, standard
errors are adjusted for heteroscedasticity of unknown form according to White (1980).26
The results are given in Table 4. Due to the very small samples and the question of
statistical validity, we refrain from discussing results for NEMAX products. Strikingly,
the regression for DAX products leads to an adjusted coefficient of determination of
R2adj ≈ 0.53 (0.48) for the DAX reverse convertibles (discount certificates), indicating
the high explanatory power of our regression (5). Regression (5) reveals that for both
reverse convertibles and discount certificates on DAX underlyings, the life cycle and the
25 We verified in advance that the (up to three) explaining variables are linearly independent. Forexample, we could not detect any systematic adjustments of the spreads depending on the remaininglife time of the products. Spreads are neither systematically narrowed nor widened as maturityapproaches. With these preliminary analyses, we prevent large confidence intervals arising due tomulticollinearity among the regressors.
26 In general, a correction of standard errors according to White (1980) requires ”large” sam-ples. Note that even in case of heteroscedasticity and/or correlation of error terms, the OLSestimators of the regression coefficients are unbiased though not efficient. For further de-tails see Pindyck/Rubinfeld (2001), pp. 57-84, pp. 146-152 and pp. 250-260. The alternativeuse of cumbersome techniques for calculating standard errors, e. g. bootstrapping (see David-son/MacKinnon (1993), pp. 763-769), does not seem justified in the context of our investigation.
20
moneyness of the implicit put options are relevant factors for product pricing. Among
the reverse convertibles, an influence of the spread cannot be proved at the 10 % level.
Bearing in mind the questionable results for the influence of the spreads as discussed
earlier in this section, we are concerned about the economic relevance of the spread for
∆Vi. Therefore, we additionally run regression (6), excluding the regressor Ψi:
∆Vi = a + b Li + cMi + εi (6)
For both subsamples, reverse convertibles and discount certificates on DAX stocks, R2adj
is effected only slightly, compared to regression (5). Though not documented here in
detail, the results from regressions (5) and (6) are very similar for the single issuers. For
example, with only two exceptions, BHF-Bank (BHF) and Lehman Brothers (LEB), and
for sufficiently high numbers of products, we diagnose negative slope coefficients for the
life cycle (b < 0) among all issuers of reverse convertibles and discount certificates.27 We
thus find strong support for our order flow hypothesis.
As an important result, the rankings in Table 3 must be judged in the light of the com-
position of issuers’ product portfolios. Since Table 4 has delivered striking evidence of
systematic pricing policies according to the products’ remaining life times and moneyness,
direct comparisons of pricing biases among issuers should only be conducted for similar
portfolio structures.
27 From the perspective of the single issuers the coefficients for the moneyness and the spread are notalways statistically different from zero.
21
4.4 Critical Review
One might argue that our results cannot be generalized since they reflect only the market
conditions during November 2001.28 As support for our analysis, however, we cite a
very recent study by Stoimenov (2003), who conducted a similar investigation in the
German market. Although his primary goal is an analysis of ”exotic structured products”
(i. e. products with implicit positions in exotic options), the author also provides evidence
relating to the pricing of regular reverse convertibles and discount certificates in the
secondary market. As Stoimenov employs very similar methods and measures to our
own, his analysis of the average product pricing in October 2002 serves as a benchmark
for our results. Stoimenov reports mean average price deviations of 0.77 % across eight
issuers of DAX reverse convertibles (287 products in total) and 1.50 % for DAX discount
certificates issued by 19 firms (1,848 products in total). The work by Stoimenov provides
very similar results to our proposed ”order flow hypothesis”. He employs a regression of
the form ∆Vi = a+b Li+εi and finds significantly negative slope coefficients b.29 Summing
up, the results presented by Stoimenov support both our observed ”mispricing” pattern
as well as our life cycle hypothesis. This indicates that our results are obviously not
due only to unusual market conditions. Furthermore, for the most part, our results are
consistent with the findings of Burth/Kraus/Wohlwend (2001). They report a significant
pricing bias at issuance of both reverse convertibles and discount certificates in the Swiss
market. Their analysis, however, is more straightforward since they only consider the
primary market where there is no purchasing activity by issuers.
Another important point is the chosen matching procedure described in Section 4.2.1. As
the critical basis for our study, we carefully re-examined the linking mechanism between
the Eurex options and the structured products along two lines.
28 Please note that, due to the restricted availability of pricing data, the analysis cannot easily beextended to longer time periods.
29 Contrary to our analysis, Stoimenov does not correct standard errors for possible heteroscedasticity.
22
Firstly, we re-calculated pricing differences, giving the first priority to times-to-maturity
instead of strikes. The results proved stable and very similar to those presented in the
previous sections. Even with the possible presence of unusual patterns in the smile and
term structure of implied volatilities after September 11, 2001 the main conclusions from
our study remain valid. The findings are plausible, because, even in the case of a mod-
ified priority, large differences in times-to-maturity (cf. Table 2) cannot be avoided.
Additionally, we approached the problem of ”mismatches” from an econometric perspec-
tive: we added the consolidated relative differences in strike prices and times-to-maturity,
∆Ki = 1Ni
∑Ni
j=1(KEurexij − KSP
ij )/KEurexij and ∆τi = 1
Ni
∑Ni
j=1(τEurexij − τSP
ij )/τEurexij , as ex-
plaining variables to regressions (5) and (6). For both reverse convertibles and discount
certificates on DAX underlyings30, ∆τi emerged as a weakly significant factor with neg-
ative regression coefficients. This demonstrates that for structured products with longer
times-to-maturity compared to available Eurex options ((τEurexij − τSP
ij )/τEurexij < 0, on av-
erage), the value of ∆Vi tends to increase. The effect can be interpreted as a premium
demanded by the issuers for providing long-term products with implicit options for which
no analog products are available at the options exchange. For average relative differences
in strikes, expressed by ∆Ki, no similar impact on ∆Vi can be detected.
Secondly, we considered the use of weighted averages of implied volatilities, following
e. g. the calculation of the volatility index VIX at the Chicago Board Options Exchange
(CBOE) or the VDAX for Eurex options. Unfortunately, we are confronted with the lack
of appropriate data. Since we employ transactions data, we do not have many options
traded at the same time.31 Even if the differences in trading time are ignored, an inter-
polation of options’ implied volatilities faces the problem that there are many structured
products which comprise option positions (i) that are far out-of-the-money or far in-the-
30 In the NEMAX subgroups, there are too few observations to allow for profound statistical analysis.
31 Recall that we are concerned about using settlement prices instead, as these do not represent actualtrading opportunities – especially in less liquid single-equity options markets (cf. Section 4.1).
23
money and/or (ii) that have a much longer time-to-maturity than Eurex options. This
constellation would render the results from interpolations and extrapolations extremely
unreliable.32
32 For example, in case (i) two or more volatilities from Eurex options must be used for a one-dimensionallinear or non-linear extrapolation. This requires assumptions about the smile pattern beyond observ-able strikes. For ”intermediate” strike levels, interpolation of Eurex implied volatilities is feasiblethough of limited use: distances between Eurex strikes are rather small, so that interpolated val-ues do not promise much better estimates than those at observable strikes. For case (ii) especially,extrapolation is even more critical, since we require volatility estimates for long times-to-maturityfrom short-term Eurex options. Consequently, crucial assumptions on the volatility term structureare necessary. Following the VIX example, the joint two-dimensional interpolation/extrapolationalong both dimensions moneyness and time-to-maturity would probably be the best choice. However,linearity assumptions and large differences in both parameters due to Eurex options with strikesnear-the-money and rather short times-to-maturity call this technique into question.
24
5 Summary and Outlook
We briefly reviewed the principle valuation approach for a special class of structured
products, namely reverse convertibles and discount certificates. Comparing quoted prices
with the costs of duplication strategies using exchange-traded options, we find a strong
pricing bias favoring the product sellers. Both results hold for reverse convertibles and
discount certificates. Distinguishing between market segments, DAX and NEMAX, and
single underlyings, our analysis shows a generally heterogeneous picture. For the most
part, the high-tech segment is subject to higher price deviations. In assessing the driving
factors of the issuers’ pricing policies, we find strong evidence of our order flow hypothesis.
Clearly, issuers orientate their pricing towards the product life time and the incorporated
risk of a redemption by shares (given by the moneyness of the implicit options), bearing
in mind the volumes of sales and repurchases to be expected from issuance until maturity.
With respect to our valuation approach, the known deficiencies and simplifications of the
Black/Scholes option pricing model can be seen as critical. Fortunately, the used valuation
schemes are extendible so as to incorporate even more parameters (e. g. a non-trivial
structure of interest rates, stochastic volatility). However, the original Black/Scholes
model is by far the most popular pricing approach. Its use (with slight modifications)
among the issuers can, therefore, be reasonably assumed.
Bearing in mind the results presented in this paper, great care should be taken when
judging quoted prices. In spite of the very easy access to structured products, experienced
investors should still consider buying or selling options at derivatives exchanges with
liquid trade. Nevertheless, it has to be acknowledged that a useful ”packaging” of single
components could justify the implicitly demanded margins as compensation for the issuers’
structuring service for offering these products, including the commitment to provide liquid
trading of the products. Furthermore, an ”exact” replication of the payment profile via

25
options exchanges is not possible, e. g. in the case of long times-to-maturity. With the
help of structured products, however, the issuers provide access to non-standard options
positions, so that the observed premia can also be interpreted as commissions for this
market extension.
The market for structured products is still very attractive for issuers, due to the almost
total absence of restrictions with regard to underlyings and contract conditions. Examples
of recent developments in the German market for structured products are callable step-up
bonds, bull, bear and condor bonds, kick start certificates, barrier and two-asset products.
Further research could concentrate on product classes apart from the ones considered in
this paper, probably providing an even greater insight into the issuers’ pricing policies.
Wider investigations could consider the pricing stability over time. In addition, taking
transactions costs into account, an investigation of concrete arbitrage strategies between
the market for structured products and derivatives exchanges seems promising.
26
References
Baubonis, C., G. L. Gastineau, and D. Purcell. 1993. ”The Banker’s Guide to Equity-
Linked Certificates of Deposit.” The Journal of Derivatives, vol. 1, no. 2 (Winter):87-95.
Black, F., and M. Scholes. 1973. ”The Pricing of Options and Corporate Liabilities.”
Journal of Political Economy, vol. 81, no. 3:637-654.
Burth, S., T. Kraus, and H. Wohlwend. 2001. ”The Pricing of Structured Products in
the Swiss Market.” The Journal of Derivatives, vol. 9, no. 2 (Winter):30-40.
Chen, A. H., and J. W. Kensinger. 1990. ”An Analysis of Market-Index Certificates of
Deposit.” Journal of Financial Services Research, vol. 4, no. 2 (July):93-110.
Chen, A. H., and R. S. Sears. 1990. ”Pricing the SPIN.” Financial Management, vol. 19,
no. 2 (Summer):36-47.
Das, S. 2000. Structured Products and Hybrid Securities. 2nd ed. New York, NY:
John Wiley & Sons.
Davidson, R., and J. G. MacKinnon. 1993. Estimation and Inference in Econometrics.
New York, NY: Oxford University Press (USA).
Fabozzi, F. J. 1998. ”Overview.” In Handbook of Structured Financial Products. Edited
by F. J. Fabozzi. New Hope, PA: McGraw-Hill:1-5.
Hull, J. C. 2003. Options, Futures, and other Derivatives. 5th ed. Upper Saddle
River, NJ: Prentice Hall.
Pindyck, R. S., and D. L. Rubinfeld. 2001. Econometric Models and Economic Forecasts.
4th ed. New York, NY: McGraw-Hill.
Stoimenov, P. A. 2003. ”The Pricing of Exotic Structured Products. A Theoretical and
Empirical Analysis.” Master’s Thesis, University of Munster, Germany.

27
Toy, W. W., and M. D. Ryan. 2000. ”Public Equity-Linked Debt.” In The Handbook of
Equity Derivatives. Edited by J. C. Francis, W. W. Toy, and G. Whittaker. 2nd ed.
New York, NY: John Wiley & Sons:329-342.
Wasserfallen, W., and C. Schenk. 1996. ”Portfolio Insurance for the Small Investor in
Switzerland.” The Journal of Derivatives, vol. 3, no. 3 (Spring):37-43.
White, H. L. 1980. ”A Heteroskedasticity-Consistent Covariance Matrix Estimator and a
Direct Test for Heteroskedasticity.” Econometrica, vol. 48, no. 4 (May):817-838.
28
Reverse convertibles Discount certificates Total no. of prod.
169 737 906
DAX NEMAX DAX NEMAX DAX NEMAX
Whole sample 164 5 704 33 868 38
Bankges. Berlin (BGB) 7 1 – – 7 1
BHF-Bank (BHF) 26 – 78 2 104 2
BNP Paribas (BNP) 3 – 39 – 42 –
Citibank (CIT) – – 29 10 29 10
Commerzbank (CBK) 7 – 57 – 64 –
Credit Lyonnais (CLY) – – 13 – 13 –
Deutsche Bank (DBK) – – 18 – 18 –
Dresdner Bank (DRB) – – 29 – 29 –
DZ Bank (DZB) – – 120 15 120 15
HSBC Tr. & B. (HSB) – – 30 3 30 3
HypoVereinsbank (HVB) 22 – 38 – 60 –
Lang & Schwarz (LAS) – – 64 – 64 –
Lehman Brothers (LEB) – – 10 – 10 –
Sal. Oppenheim (OPP) 87 4 66 – 153 4
Societe Generale (SOG) – – 23 3 23 3
UBS Warburg (UBS) – – 76 – 76 –
WestLB (WLB) 12 – 11 – 23 –
WGZ-Bank (WGZ) – – 3 – 3 –
Table 1: Analyzed products.
29
Strike prices
Average(∆K) Average(|∆K|)Reverse convertibles 0.562 0.68% 2.656 3.75%
– DAX 0.590 0.73% 2.698 3.70%
– NEMAX -0.446 -1.30% 1.091 5.48%
Discount certificates -1.211 -0.87% 3.674 5.73%
– DAX -1.234 -0.91% 3.724 5.50%
– NEMAX -0.622 0.14% 2.419 11.65%
Times-to-maturity
Average(τ) Average(∆τ) Average(|∆τ |)Reverse convertibles 0.740 -0.429 -51.87% 0.468 59.74%
– DAX 0.745 -0.432 -51.93% 0.472 59.78%
– NEMAX 0.570 -0.292 -49.93% 0.337 58.31%
Discount certificates 1.201 -0.844 -64.92% 0.863 68.02%
– DAX 1.200 -0.841 -64.70% 0.861 67.84%
– NEMAX 1.237 -0.921 -70.67% 0.932 72.39%
A negative sign represents a lower strike/time-to-maturity of the assigned Eurex option in com-parison to the respective product.
Table 2: Matching of processed records with Eurex options.
30
Average price deviation (∆Vi)
DAX NEMAX
Mean Std. Min. Max. Mean Std. Min. Max.
I. Reverse convertibles
WLB 3.89% 1.56% 1.50% 7.17% – – – –
BNP 3.73% 0.40% 3.28% 4.06% – – – –
OPP 3.37% 2.04% -3.32% 8.34% 4.58% 1.81% 1.99% 6.16%
HVB 2.88% 1.51% 0.94% 7.28% – – – –
CBK 2.80% 1.58% 0.35% 5.01% – – – –
BGB 2.38% 1.75% 0.13% 5.81% 1.14% – 1.14% 1.14%
BHF 1.87% 1.66% -4.21% 5.44% – – – –
All 3.04% 1.91% -4.21% 8.34% 3.89% 2.20% 1.14% 6.16%
II. Discount certificates
BHF 8.48% 3.73% 1.73% 20.03% 14.90% 4.65% 11.61% 18.19%
HSB 6.21% 3.98% -0.56% 13.50% 14.32% 4.26% 9.48% 17.52%
SOG 6.08% 2.89% 0.02% 11.40% 7.08% 6.71% -0.44% 12.48%
OPP 4.67% 2.86% -0.58% 12.96% – – – –
DZB 4.54% 3.29% -0.82% 16.81% 12.54% 8.21% 0.18% 29.19%
BNP 4.21% 1.76% 1.30% 8.62% – – – –
LAS 3.75% 2.63% -0.94% 9.87% – – – –
CBK 3.20% 2.00% -0.48% 7.66% – – – –
WLB 3.14% 2.49% -0.92% 8.03% – – – –
DBK 3.00% 1.77% -0.45% 6.86% – – – –
UBS 2.83% 2.24% -0.40% 10.75% – – – –
CIT 2.35% 1.60% 0.22% 5.83% 4.92% 4.79% -1.94% 13.04%
CLY 2.32% 1.19% 0.40% 4.20% – – – –
HVB 1.93% 1.17% -0.77% 4.08% – – – –
DRS 1.61% 0.97% 0.01% 4.12% – – – –
LEB 0.78% 0.83% -0.68% 1.99% – – – –
WGZ -0.10% 2.36% -2.28% 2.41% – – – –
All 4.20% 3.29% -2.28% 20.03% 10.04% 7.46% -1.94% 29.19%
Issuers are ”ranked” by their mean average price deviations for DAX products.
Table 3: Statistics for average price deviations.
31
Na
t-va
lue
bt-
valu
ec
t-va
lue
dt-
valu
eF
-val
ueR
2 adj
I.R
ever
seco
nver
tibl
es
(a)
DA
Xpr
oduc
ts
R1
164
0.01
802.
17∗∗
-0.0
491
-10.
70∗∗∗
0.03
334.
48∗∗∗
0.61
360.
5862
.38∗∗∗
0.53
05
R2
164
0.02
022.
73∗∗∗
-0.0
483
-10.
53∗∗∗
0.03
254.
49∗∗∗
––
93.7
1∗∗∗
0.53
22
(b)
NE
MA
Xpr
oduc
ts
R1
50.
0601
0.13
0.14
401.
480.
1132
0.62
-87.
3924
-0.7
01.
210.
1365
R2
5-0
.199
4-1
.35
0.10
210.
820.
2062
2.28∗
––
2.88
0.48
42
II.D
isco
unt
cert
ifica
tes
(a)
DA
Xpr
oduc
ts
R1
704
0.01
582.
89∗∗∗
-0.0
877
-18.
58∗∗∗
0.04
738.
63∗∗∗
1.16
694.
71∗∗∗
218.
43∗∗∗
0.48
13
R2
704
0.02
043.
62∗∗∗
-0.0
883
-18.
45∗∗∗
0.04
958.
50∗∗∗
––
281.
55∗∗∗
0.44
39
(b)
NE
MA
Xpr
oduc
ts
R1
330.
0596
0.99
-0.2
214
-2.6
7∗∗∗
0.00
580.
114.
2652
1.87∗
5.64∗∗∗
0.30
33
R2
330.
1193
2.06∗∗
-0.2
530
-2.9
0∗∗∗
0.03
480.
63–
–5.
58∗∗∗
0.22
24
Table
4:
Anal
ysi
sof
fact
ors
influen
cing
aver
age
pri
cedev
iati
ons.
Ave
rage
pric
ede
viat
ions
(∆V
i)ar
ere
gres
sed
agai
nst
the
prod
ucts
’re
lati
velif
eti
mes
(Li)
,th
em
oney
ness
ofth
eim
plic
itpu
top
tion
s(M
i),an
dth
equ
ote
spre
ads
(Ψi)
:(R
1)∆
Vi=
a+
bL
i+
cM
i+
dΨ
i+
ε i;(
R2)
∆V
i=
a+
bL
i+
cM
i+
ε i.
Stan
dard
erro
rsar
ead
just
edfo
rhe
tero
sced
asti
city
ofun
know
nfo
rmac
cord
ing
toW
hite
(198
0).∗∗∗
sign
ifica
nton
1%
leve
l;∗∗
sign
ifica
nton
5%
leve
l;∗
sign
ifica
nton
10%
leve
l(t
wo-
side
dte
sts
for
regr
essi
onco
effici
ents
).R
2 adjde
note
sth
eva
lue
ofth
ead
just
edR
2(c
oeffi
cien
tof
dete
rmin
atio
n).
32
I. Reverse convertibles
DVi DVi
Fre
qu
ency
Fre
qu
ency
II. Discount certificates
0.100.060.030.00-0.03
20
10
00.170.120.060.00-0.05
80
60
40
20
0
Figure 1: Distributions of average price deviations among reverse convertibles and dis-count certificates.
33
I. Reverse convertibles
∆Vi
I. Reverse convertibles
Li
II. Discount certificates
1.00.80.60.40.20.0
0.25
0.20
0.15
0.10
0.05
0.00
-0.05
Li
1.00.80.60.40.20.0
0.25
0.20
0.15
0.10
0.05
0.00
-0.05
∆Vi
(A) Influence of the life cycle
1.51.31.10.90.70.5
∆Vi
0.25
0.20
0.15
0.10
0.05
0.00
-0.05
II. Discount certificates
(B) Influence of the moneyness
1.51.31.10.90.70.5
∆Vi
0.25
0.20
0.15
0.10
0.05
0.00
-0.05
I. Reverse convertibles II. Discount certificates
(C) Influence of the spread
Mi Mi
0.030.020.010.00
ψi ψi
∆Vi
0.25
0.20
0.15
0.10
0.05
0.00
-0.050.030.020.010.00
∆Vi
0.25
0.20
0.15
0.10
0.05
0.00
-0.05
Figure 2: Average price deviations depending on (A) the products’ life cycles, (B) themoneyness of the implicit options, and (C) the spreads.


