Download - THE REAL COST OF A CARBON TAX
Estimating the Impact of South Africa’s 2015 Carbon Tax with an Application to the Agricultural Sector of the Western Cape
Presentation prepared for National Treasury
Carbon Tax Modelling Workshop
Andrew Partridge
Leann Cloete-Beets
Vanessa Barends
THE REAL COST OF A CARBON TAX
October 2016
© Western Cape Government 2012 |
Presentation Overview
2 Go to Insert > Header & Footer > Enter presentation name into footer field
Background
Methodology
Impacts I – South African Economy
Impacts II – South African Agriculture
Impacts III - Other (Extensions)
Conclusions

Background
© Western Cape Government 2012 |
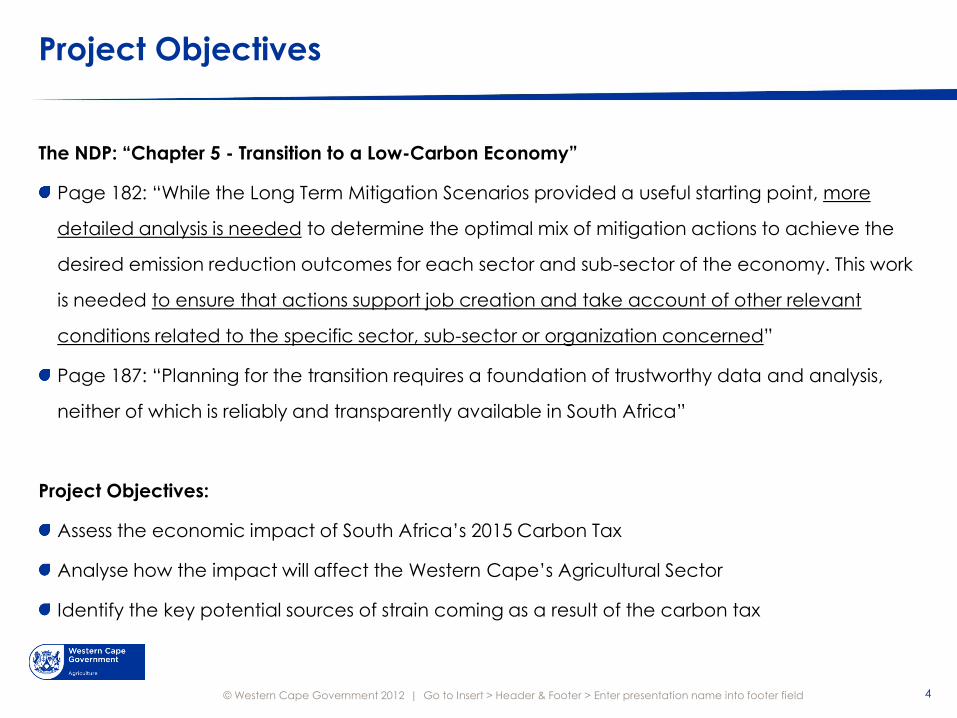
Project Objectives
4 Go to Insert > Header & Footer > Enter presentation name into footer field
The NDP: “Chapter 5 - Transition to a Low-Carbon Economy”
Page 182: “While the Long Term Mitigation Scenarios provided a useful starting point, more
detailed analysis is needed to determine the optimal mix of mitigation actions to achieve the
desired emission reduction outcomes for each sector and sub-sector of the economy. This work
is needed to ensure that actions support job creation and take account of other relevant
conditions related to the specific sector, sub-sector or organization concerned”
Page 187: “Planning for the transition requires a foundation of trustworthy data and analysis,
neither of which is reliably and transparently available in South Africa”
Project Objectives:
Assess the economic impact of South Africa’s 2015 Carbon Tax
Analyse how the impact will affect the Western Cape’s Agricultural Sector
Identify the key potential sources of strain coming as a result of the carbon tax
© Western Cape Government 2012 |
Project Outputs
5 Go to Insert > Header & Footer > Enter presentation name into footer field
Partridge, A., Cloete-Beets, L. & Barends, V. 2014. The Effect of a Carbon Tax an Agriculture: An Impact Assessment of South Africa’s Proposed Carbon Tax with an Application to the South African Agricultural Sector. Paper presented at the 5th World Congress of Environmental and Resource Economists, Istanbul, 28 June – 2 July 2014. Partridge, A., Cloete-Beets, L. & Barends, V. 2014. The Real Cost of a Carbon Tax: Estimating the Impact of South Africa’s 2015 Carbon Tax with an Application to the Agricultural Sector of the Western Cape. Paper presented at the 2014 Annual Conference of the Agricultural Economics Association of South Africa (AEASA), Mpekweni Beach Resort, 8 September to 01 October 2014. Partridge, A., Cloete-Beets, L. & Barends, V. 2014. The Real Cost of Going Clean: The Impact of a Carbon Tax on the Agricultural Sector of the Western Cape. Paper presented at the 9th Africa Farm Management Association (AFMA) Congress, Cape Town, 16 - 20 November 2014. Partridge, A., Cloete-Beets, L. & Barends, V. 2014. The Real Cost of Going Clean: The Potential Impact of South Africa's 2016 Carbon Tax on Agricultural Production. Professional Agricultural Workers Journal. 3 (1) : 11 Partridge, A. 2015. The Impact of South Africa’s Carbon Tax on Agri Processing. Elsenburg: Western Cape Department of Agriculture

Methodology
© Western Cape Government 2012 |
The Project Model
Model Details
7 Go to Insert > Header & Footer > Enter presentation name into footer field
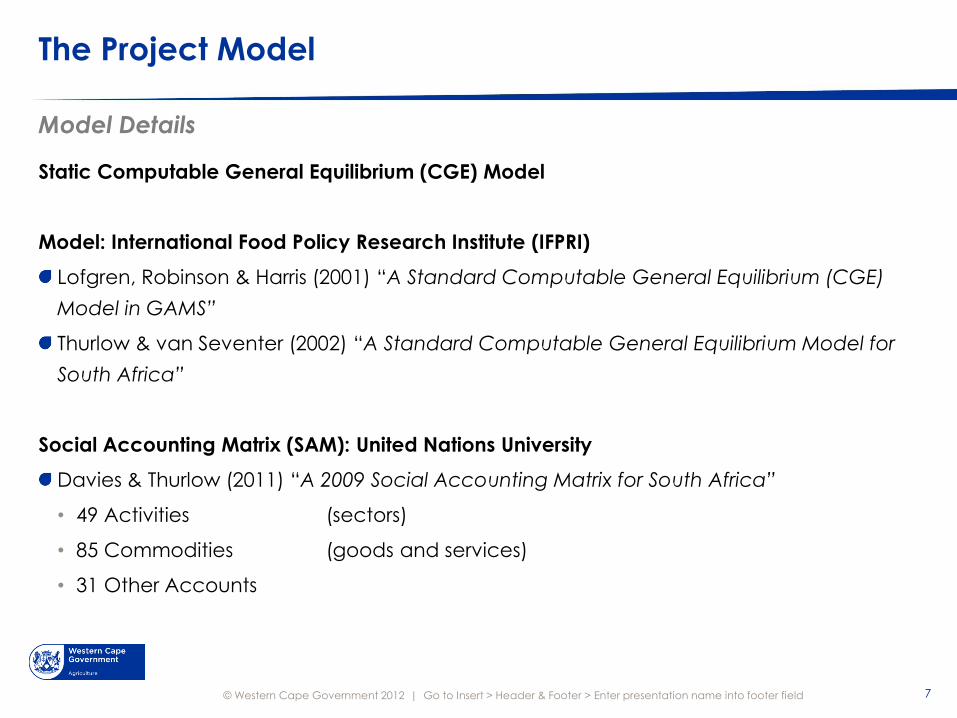
Static Computable General Equilibrium (CGE) Model
Model: International Food Policy Research Institute (IFPRI)
Lofgren, Robinson & Harris (2001) “A Standard Computable General Equilibrium (CGE)
Model in GAMS”
Thurlow & van Seventer (2002) “A Standard Computable General Equilibrium Model for
South Africa”
Social Accounting Matrix (SAM): United Nations University
Davies & Thurlow (2011) “A 2009 Social Accounting Matrix for South Africa”
• 49 Activities (sectors)
• 85 Commodities (goods and services)
• 31 Other Accounts
© Western Cape Government 2012 |
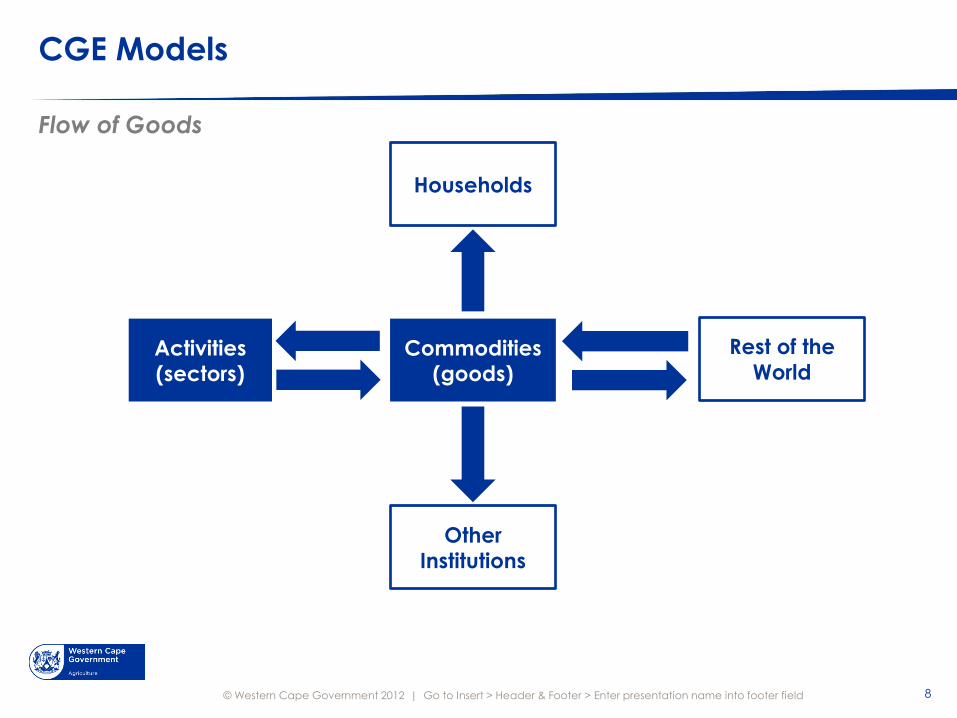
CGE Models
Flow of Goods
8 Go to Insert > Header & Footer > Enter presentation name into footer field
Activities
(sectors)
Commodities
(goods)
Other
Institutions
Rest of the
World
Households
© Western Cape Government 2012 |
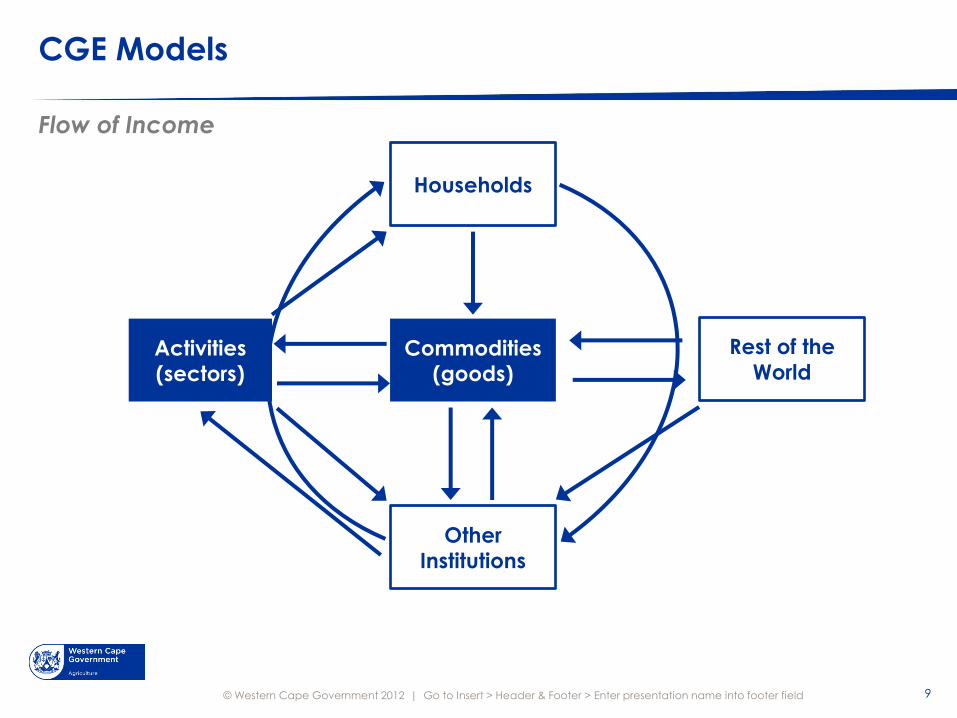
CGE Models
Flow of Income
9 Go to Insert > Header & Footer > Enter presentation name into footer field
Activities
(sectors)
Commodities
(goods)
Other
Institutions
Rest of the
World
Households
© Western Cape Government 2012 |
The Project Model
Model Details
10 Go to Insert > Header & Footer > Enter presentation name into footer field
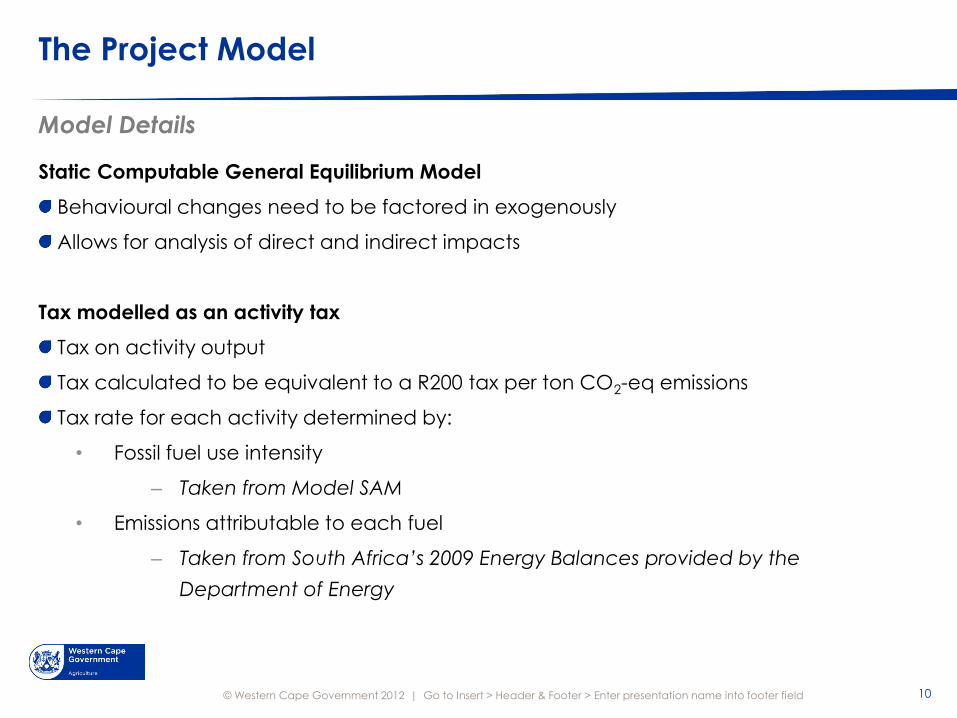
Static Computable General Equilibrium Model
Behavioural changes need to be factored in exogenously
Allows for analysis of direct and indirect impacts
Tax modelled as an activity tax
Tax on activity output
Tax calculated to be equivalent to a R200 tax per ton CO2-eq emissions
Tax rate for each activity determined by:
• Fossil fuel use intensity
– Taken from Model SAM
• Emissions attributable to each fuel
– Taken from South Africa’s 2009 Energy Balances provided by the
Department of Energy

© Western Cape Government 2012 |
Modelling a Carbon Tax
A Simplified Hypothetical Example
11 Go to Insert > Header & Footer > Enter presentation name into footer field
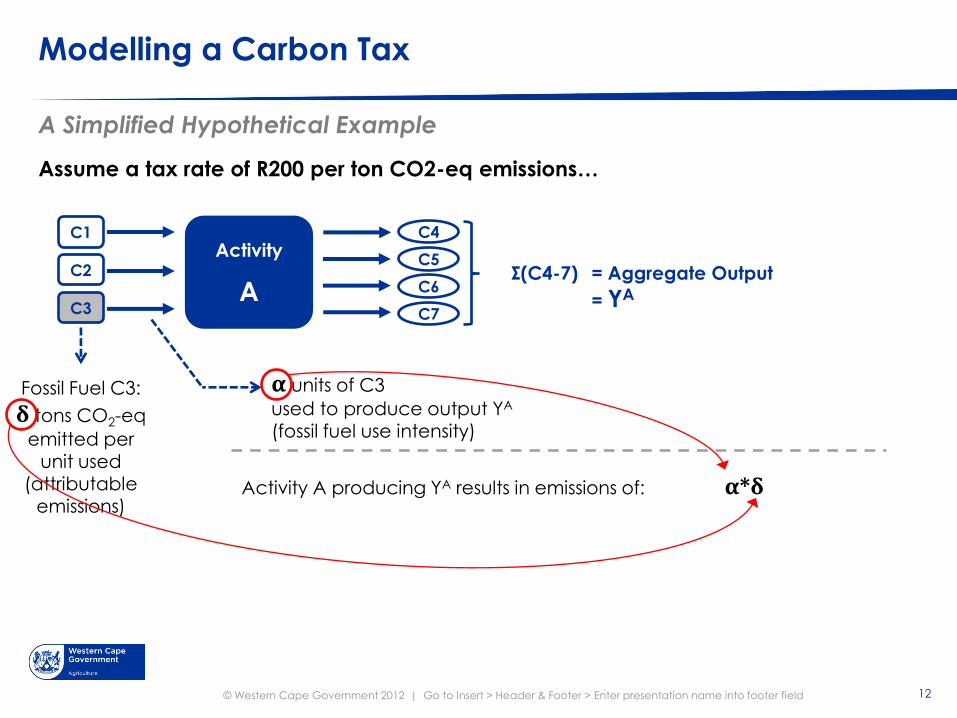
Assume a tax rate of R200 per ton CO2-eq emissions…
Activity
A
C1
C2
C3
C4
C5
C6
C7
Σ(C4-7) = Aggregate Output
= YA
© Western Cape Government 2012 |
Modelling a Carbon Tax
A Simplified Hypothetical Example
12 Go to Insert > Header & Footer > Enter presentation name into footer field
Assume a tax rate of R200 per ton CO2-eq emissions…
Activity
A
C1
C2
C3
C4
C5
C6
C7
Σ(C4-7) = Aggregate Output
= YA
α units of C3
used to produce output YA
(fossil fuel use intensity)
Fossil Fuel C3:
δ tons CO2-eq
emitted per unit used
(attributable emissions)
Activity A producing YA results in emissions of: α*δ
© Western Cape Government 2012 |
Modelling a Carbon Tax
A Simplified Hypothetical Example
13 Go to Insert > Header & Footer > Enter presentation name into footer field
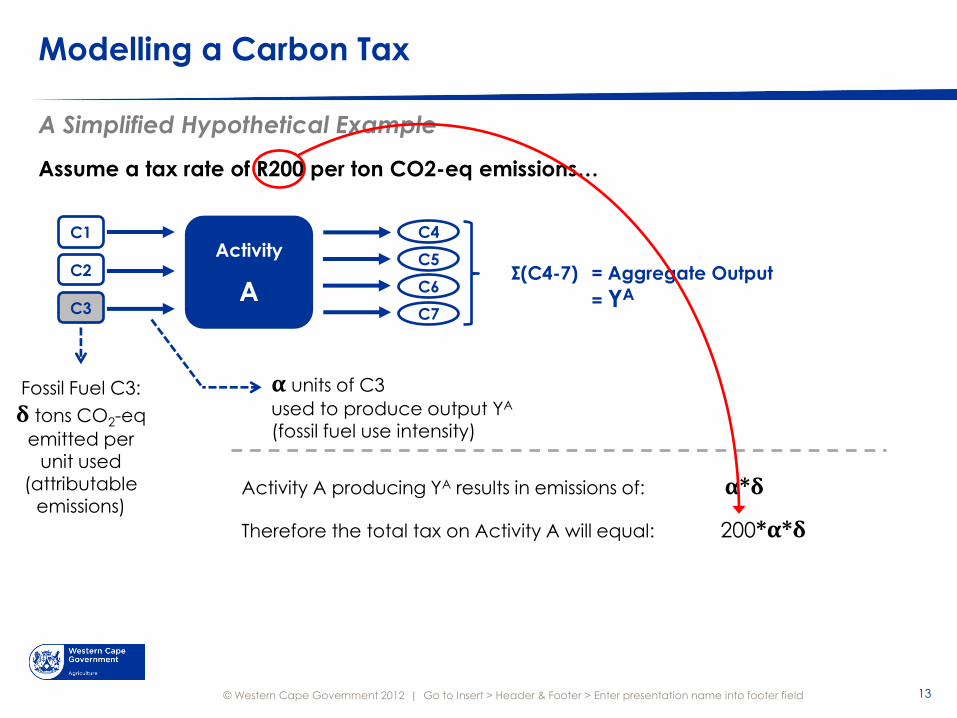
Assume a tax rate of R200 per ton CO2-eq emissions…
Activity
A
C1
C2
C3
C4
C5
C6
C7
Σ(C4-7) = Aggregate Output
= YA
α units of C3
used to produce output YA
(fossil fuel use intensity)
Fossil Fuel C3:
δ tons CO2-eq
emitted per unit used
(attributable emissions)
Activity A producing YA results in emissions of: α*δ
Therefore the total tax on Activity A will equal: 200*α*δ
© Western Cape Government 2012 |
Modelling a Carbon Tax
A Simplified Hypothetical Example
14 Go to Insert > Header & Footer > Enter presentation name into footer field
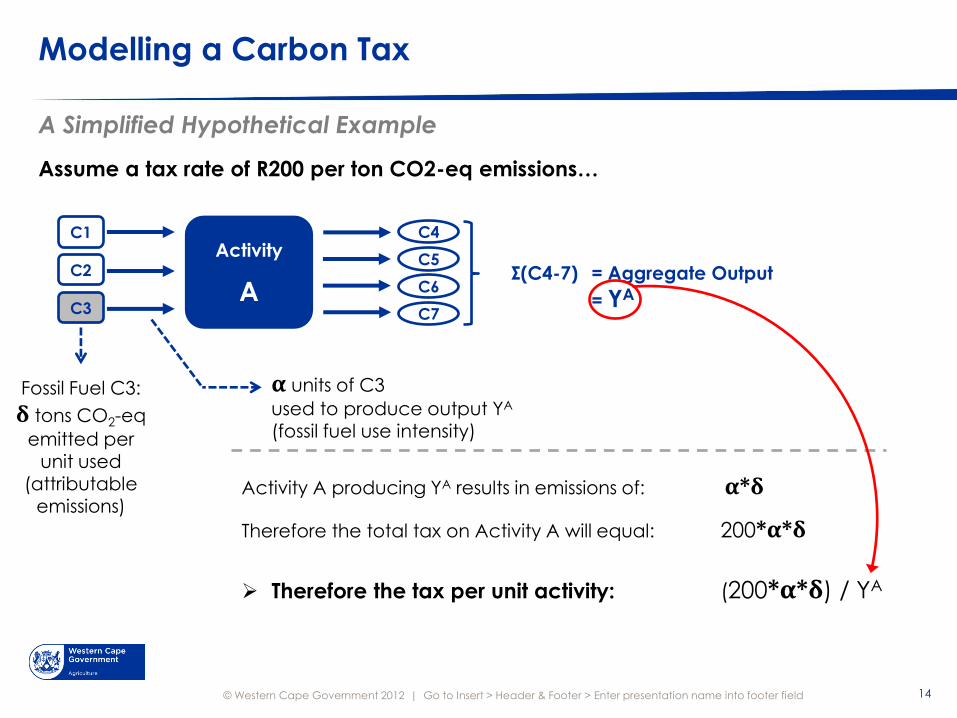
Assume a tax rate of R200 per ton CO2-eq emissions…
Activity
A
C1
C2
C3
C4
C5
C6
C7
Σ(C4-7) = Aggregate Output
= YA
α units of C3
used to produce output YA
(fossil fuel use intensity)
Fossil Fuel C3:
δ tons CO2-eq
emitted per unit used
(attributable emissions)
Activity A producing YA results in emissions of: α*δ
Therefore the total tax on Activity A will equal: 200*α*δ
Therefore the tax per unit activity: (200*α*δ) / YA
© Western Cape Government 2012 |
Project Scenarios
15 Go to Insert > Header & Footer > Enter presentation name into footer field
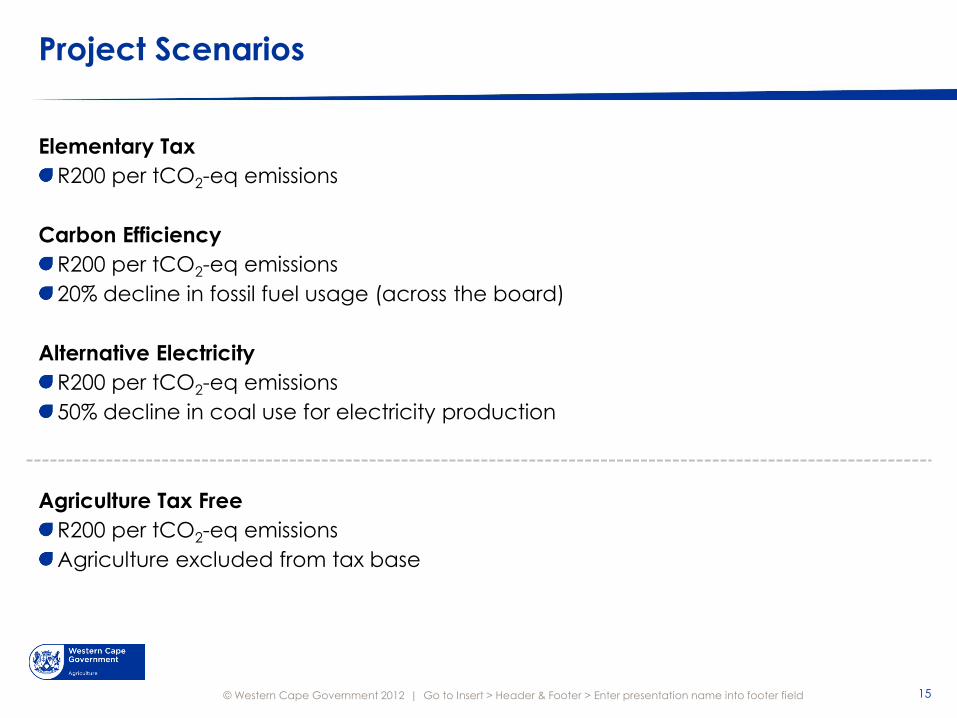
Elementary Tax
R200 per tCO2-eq emissions
Carbon Efficiency
R200 per tCO2-eq emissions
20% decline in fossil fuel usage (across the board)
Alternative Electricity
R200 per tCO2-eq emissions
50% decline in coal use for electricity production
Agriculture Tax Free
R200 per tCO2-eq emissions
Agriculture excluded from tax base

Impacts I – South African Economy
© Western Cape Government 2012 |
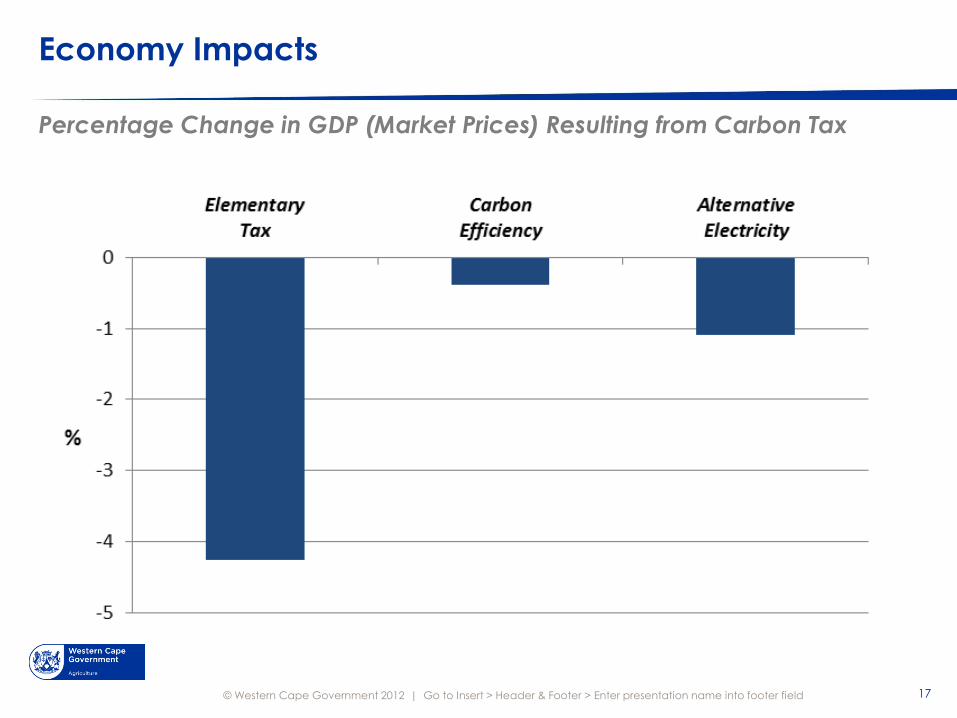
Economy Impacts
Percentage Change in GDP (Market Prices) Resulting from Carbon Tax
Go to Insert > Header & Footer > Enter presentation name into footer field 17

© Western Cape Government 2012 |
Economy Impacts
Percentage Change in Household Income by Income Decile
Go to Insert > Header & Footer > Enter presentation name into footer field 18
© Western Cape Government 2012 |
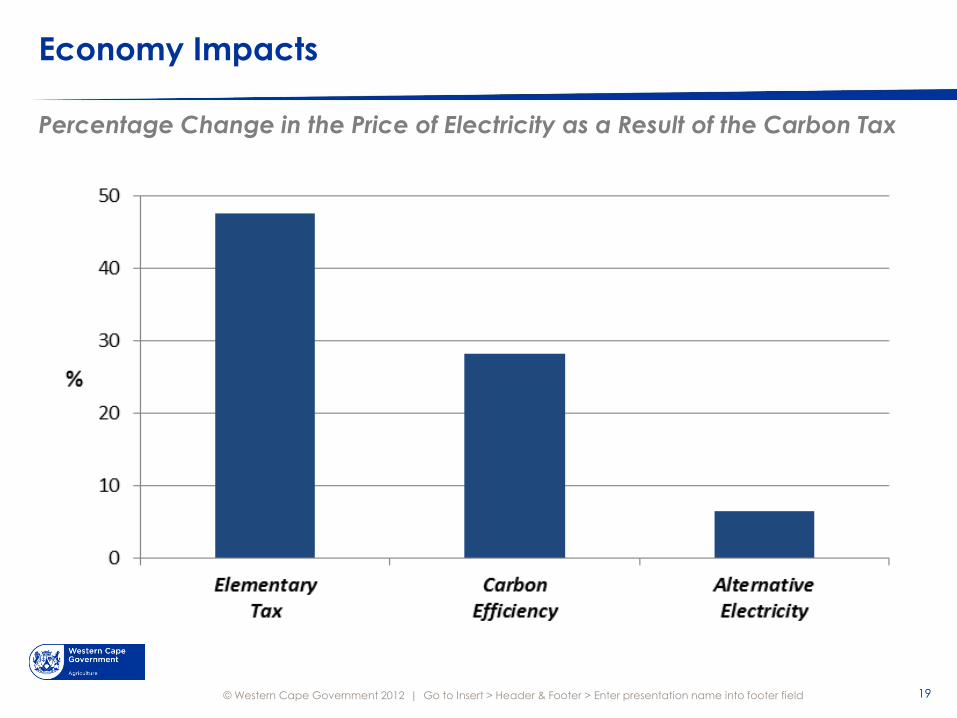
Economy Impacts
Percentage Change in the Price of Electricity as a Result of the Carbon Tax
Go to Insert > Header & Footer > Enter presentation name into footer field 19
Impacts II – South African Agriculture
© Western Cape Government 2012 |
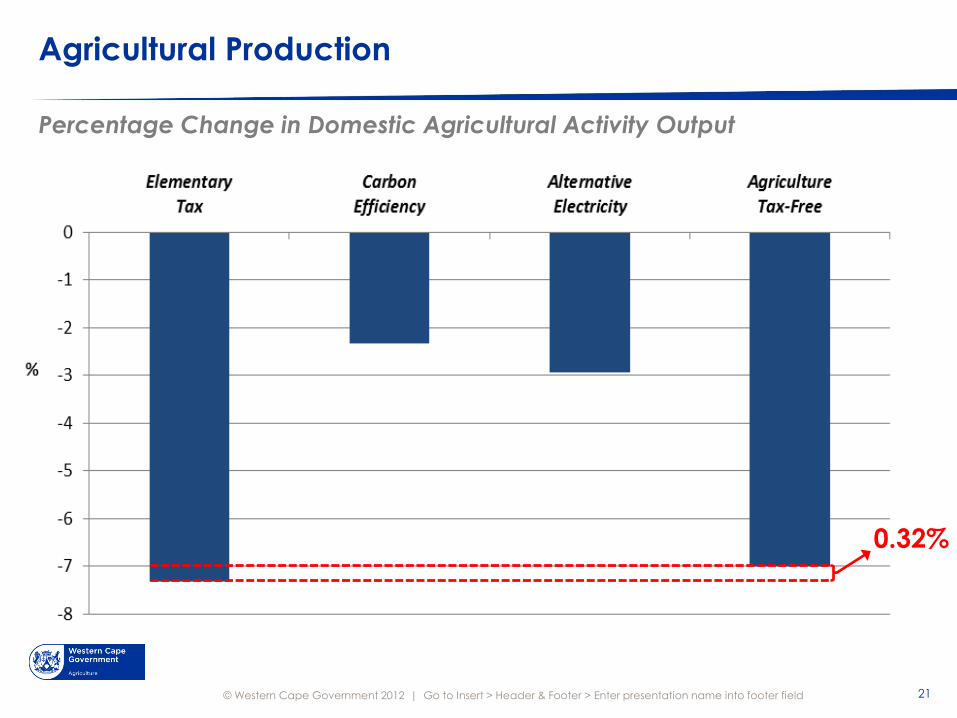
Agricultural Production
Percentage Change in Domestic Agricultural Activity Output
21 Go to Insert > Header & Footer > Enter presentation name into footer field
0.32%
© Western Cape Government 2012 |
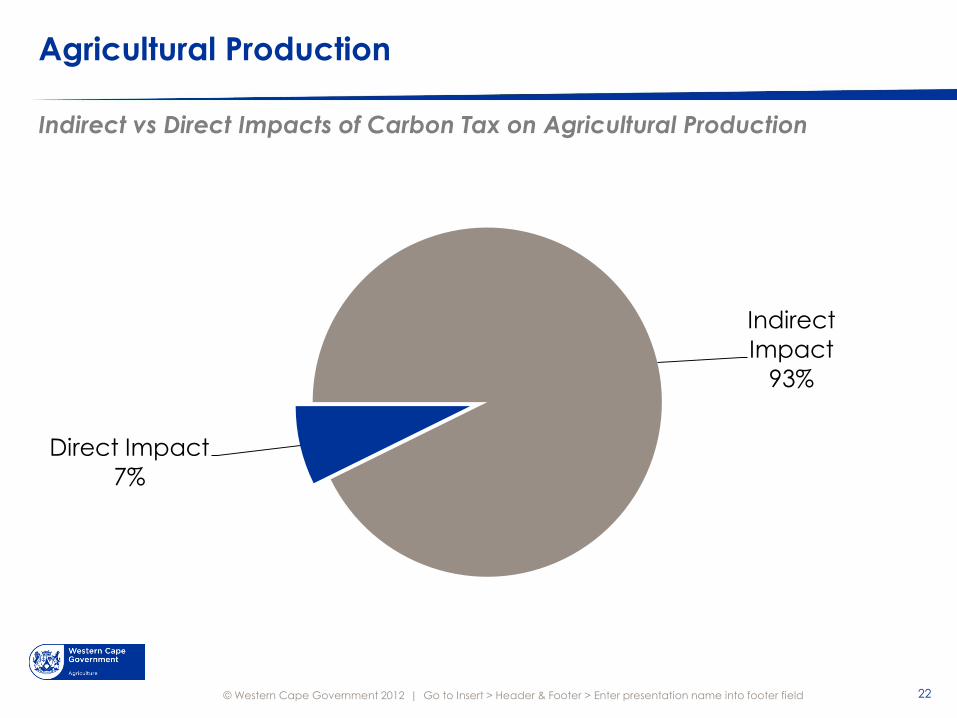
Agricultural Production
Indirect vs Direct Impacts of Carbon Tax on Agricultural Production
22 Go to Insert > Header & Footer > Enter presentation name into footer field
Indirect
Impact
93%
Direct Impact
7%
© Western Cape Government 2012 |
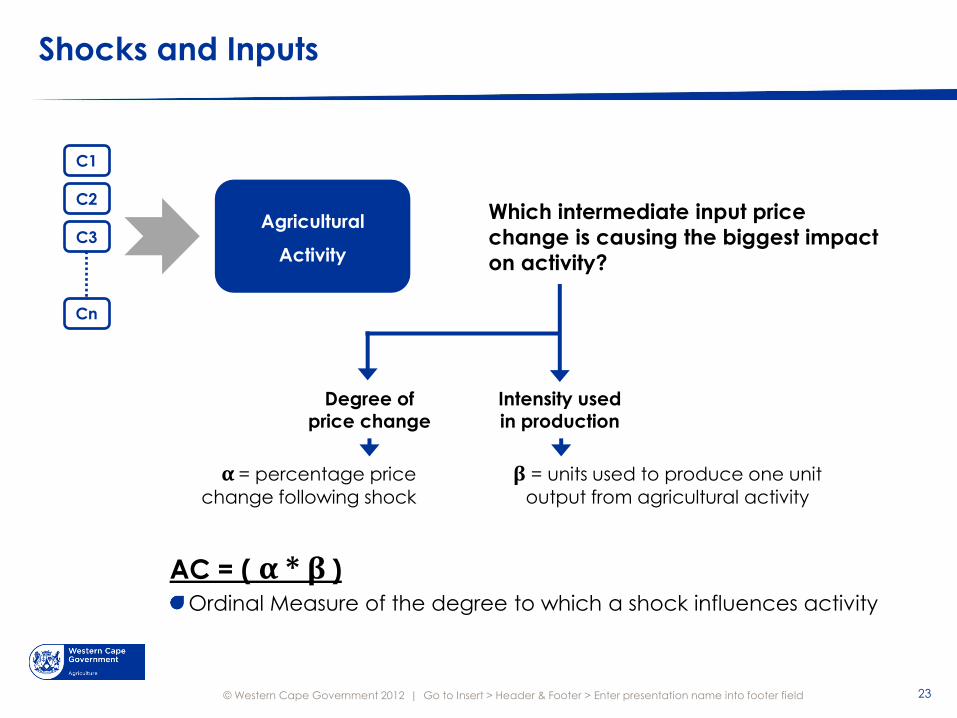
Shocks and Inputs
23 Go to Insert > Header & Footer > Enter presentation name into footer field
Agricultural
Activity
C1
C2
C3
Cn
Which intermediate input price
change is causing the biggest impact
on activity?
Degree of price change
Intensity used in production
α = percentage price
change following shock
β = units used to produce one unit
output from agricultural activity
AC = ( α * β ) Ordinal Measure of the degree to which a shock influences activity
© Western Cape Government 2012 |
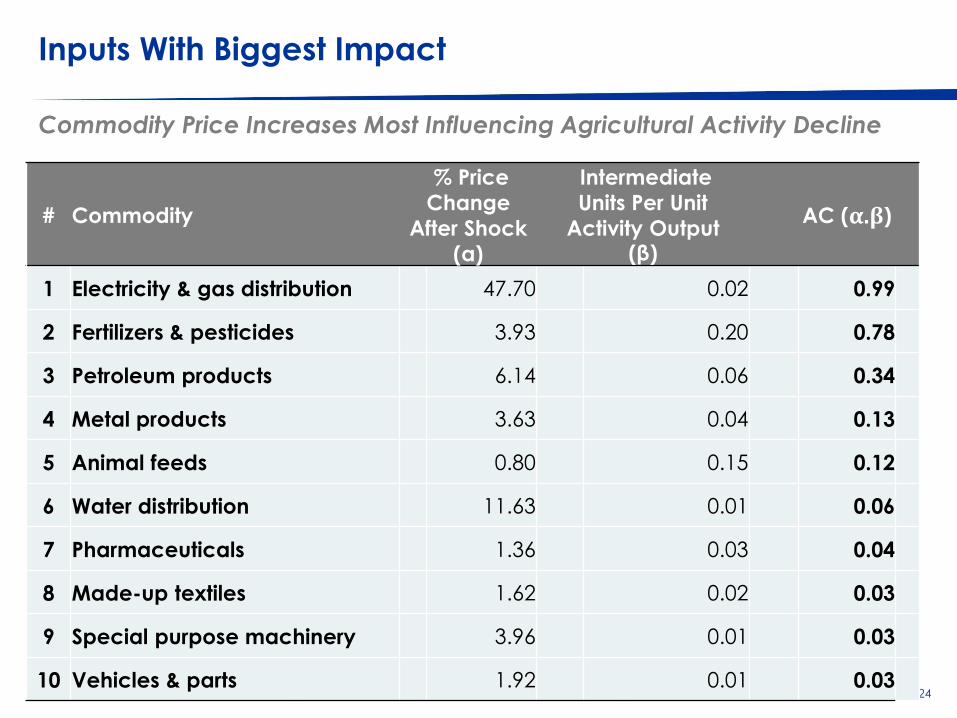
Inputs With Biggest Impact
Commodity Price Increases Most Influencing Agricultural Activity Decline
24 Go to Insert > Header & Footer > Enter presentation name into footer field
# Commodity
% Price
Change
After Shock
(α)
Intermediate
Units Per Unit
Activity Output (β)
AC (α.β)
1 Electricity & gas distribution 47.70 0.02 0.99
2 Fertilizers & pesticides 3.93 0.20 0.78
3 Petroleum products 6.14 0.06 0.34
4 Metal products 3.63 0.04 0.13
5 Animal feeds 0.80 0.15 0.12
6 Water distribution 11.63 0.01 0.06
7 Pharmaceuticals 1.36 0.03 0.04
8 Made-up textiles 1.62 0.02 0.03
9 Special purpose machinery 3.96 0.01 0.03
10 Vehicles & parts 1.92 0.01 0.03
© Western Cape Government 2012 |
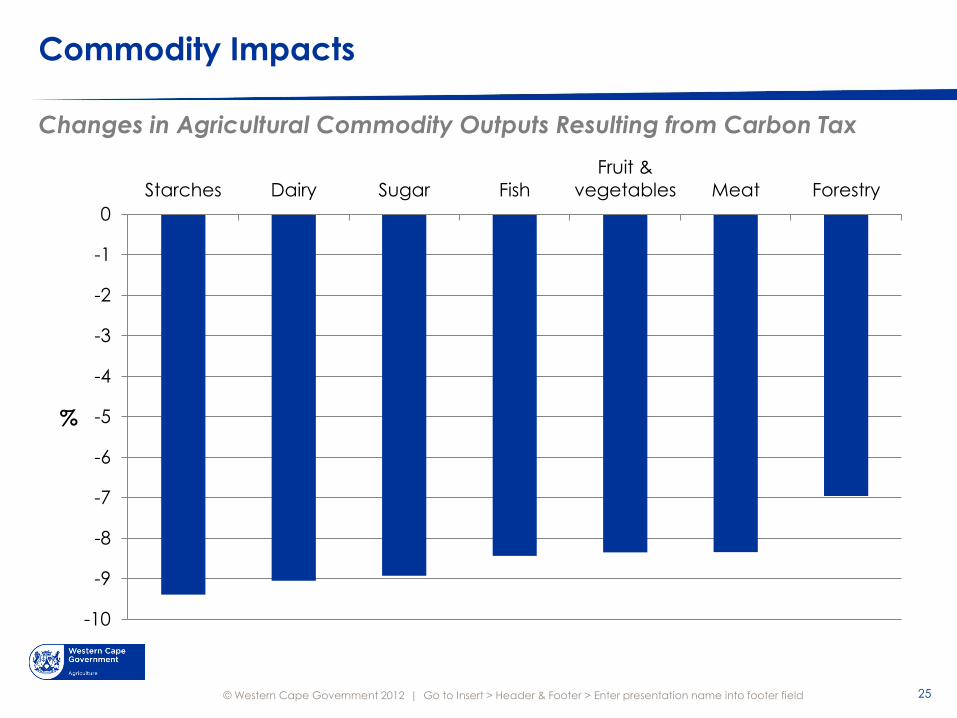
Commodity Impacts
Changes in Agricultural Commodity Outputs Resulting from Carbon Tax
25 Go to Insert > Header & Footer > Enter presentation name into footer field
-10
-9
-8
-7
-6
-5
-4
-3
-2
-1
0
Starches Dairy Sugar Fish
Fruit &
vegetables Meat Forestry
%
Impacts III - Other (Extensions)
26 Go to Insert > Header & Footer > Enter presentation name into footer field

© Western Cape Government 2012 |
Agri Processing
Changes in Agri Processing Output Resulting from Carbon Tax
27 Go to Insert > Header & Footer > Enter presentation name into footer field
-10
-9
-8
-7
-6
-5
-4
-3
-2
-1
0
Primary
Agriculture
Food
processing
Beverages
& tobacco
Leather
products
%
© Western Cape Government 2012 |
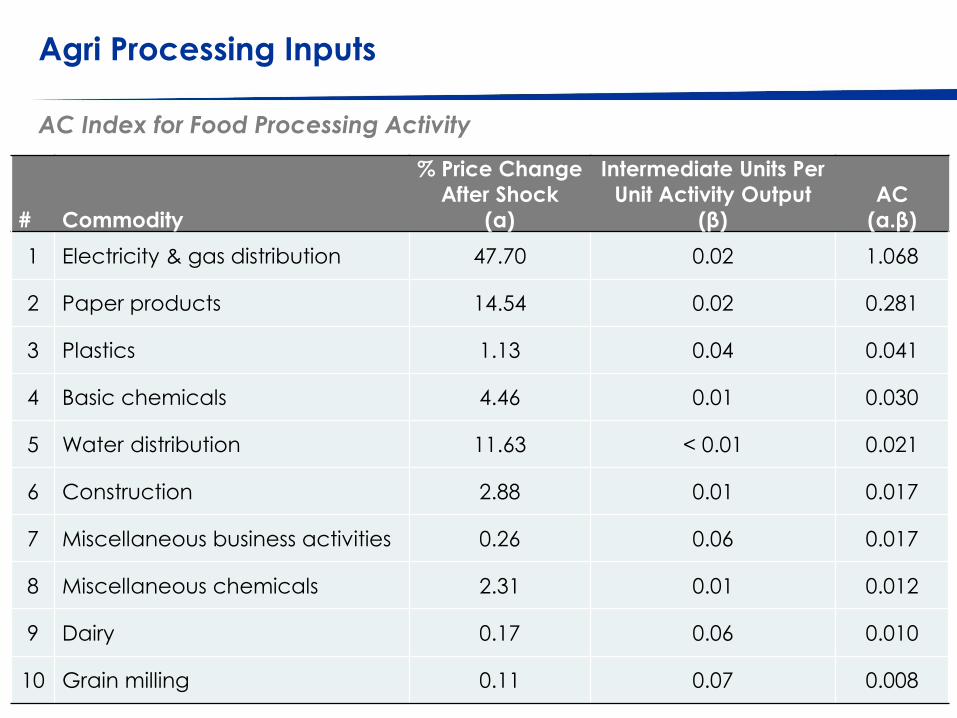
Agri Processing Inputs
AC Index for Food Processing Activity
# Commodity
% Price Change
After Shock
(α)
Intermediate Units Per
Unit Activity Output
(β)
AC
(α.β)
1 Electricity & gas distribution 47.70 0.02 1.068
2 Paper products 14.54 0.02 0.281
3 Plastics 1.13 0.04 0.041
4 Basic chemicals 4.46 0.01 0.030
5 Water distribution 11.63 < 0.01 0.021
6 Construction 2.88 0.01 0.017
7 Miscellaneous business activities 0.26 0.06 0.017
8 Miscellaneous chemicals 2.31 0.01 0.012
9 Dairy 0.17 0.06 0.010
10 Grain milling 0.11 0.07 0.008
© Western Cape Government 2012 |
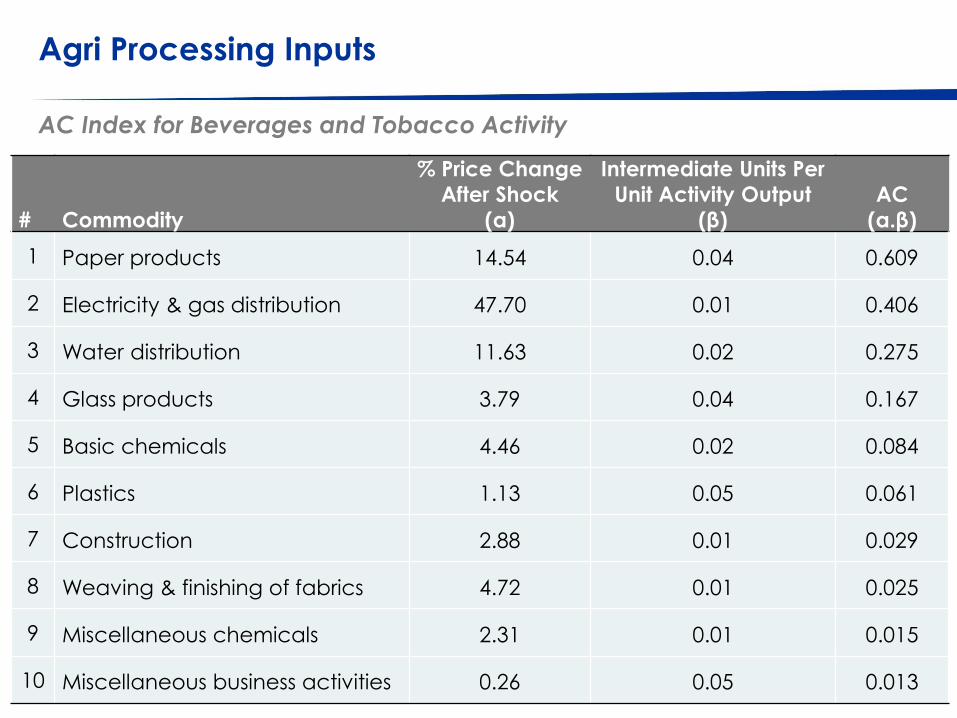
Agri Processing Inputs
AC Index for Beverages and Tobacco Activity
# Commodity
% Price Change
After Shock
(α)
Intermediate Units Per
Unit Activity Output
(β)
AC
(α.β)
1 Paper products 14.54 0.04 0.609
2 Electricity & gas distribution 47.70 0.01 0.406
3 Water distribution 11.63 0.02 0.275
4 Glass products 3.79 0.04 0.167
5 Basic chemicals 4.46 0.02 0.084
6 Plastics 1.13 0.05 0.061
7 Construction 2.88 0.01 0.029
8 Weaving & finishing of fabrics 4.72 0.01 0.025
9 Miscellaneous chemicals 2.31 0.01 0.015
10 Miscellaneous business activities 0.26 0.05 0.013
© Western Cape Government 2012 |
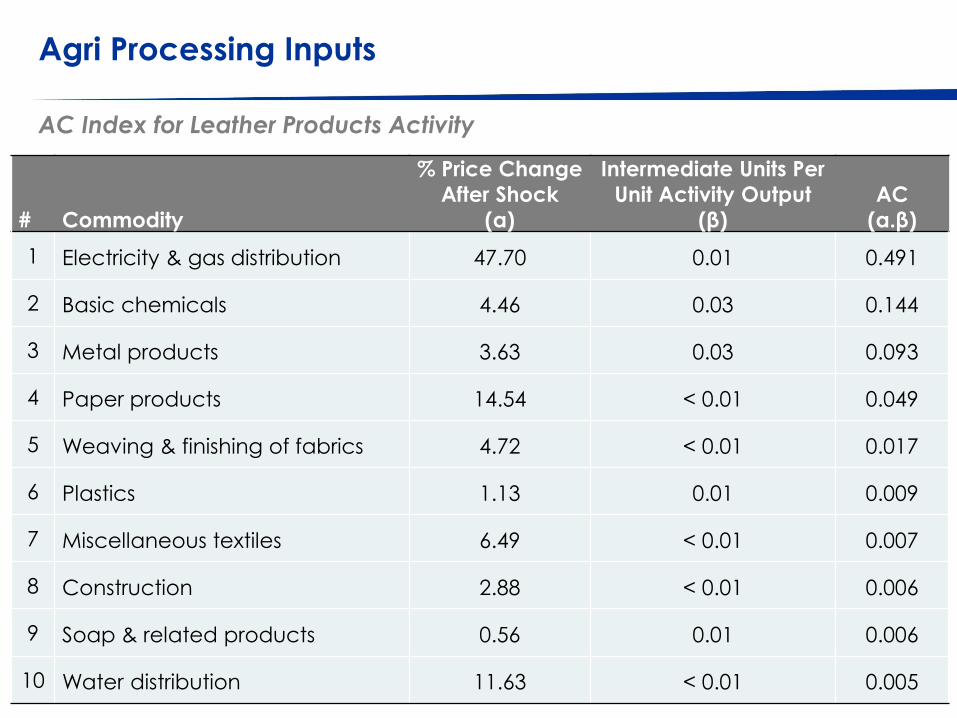
Agri Processing Inputs
AC Index for Leather Products Activity
# Commodity
% Price Change
After Shock
(α)
Intermediate Units Per
Unit Activity Output
(β)
AC
(α.β)
1 Electricity & gas distribution 47.70 0.01 0.491
2 Basic chemicals 4.46 0.03 0.144
3 Metal products 3.63 0.03 0.093
4 Paper products 14.54 < 0.01 0.049
5 Weaving & finishing of fabrics 4.72 < 0.01 0.017
6 Plastics 1.13 0.01 0.009
7 Miscellaneous textiles 6.49 < 0.01 0.007
8 Construction 2.88 < 0.01 0.006
9 Soap & related products 0.56 0.01 0.006
10 Water distribution 11.63 < 0.01 0.005
Conclusions
© Western Cape Government 2012 |
Conclusions… Difficulties / Short-comings
32 Go to Insert > Header & Footer > Enter presentation name into footer field
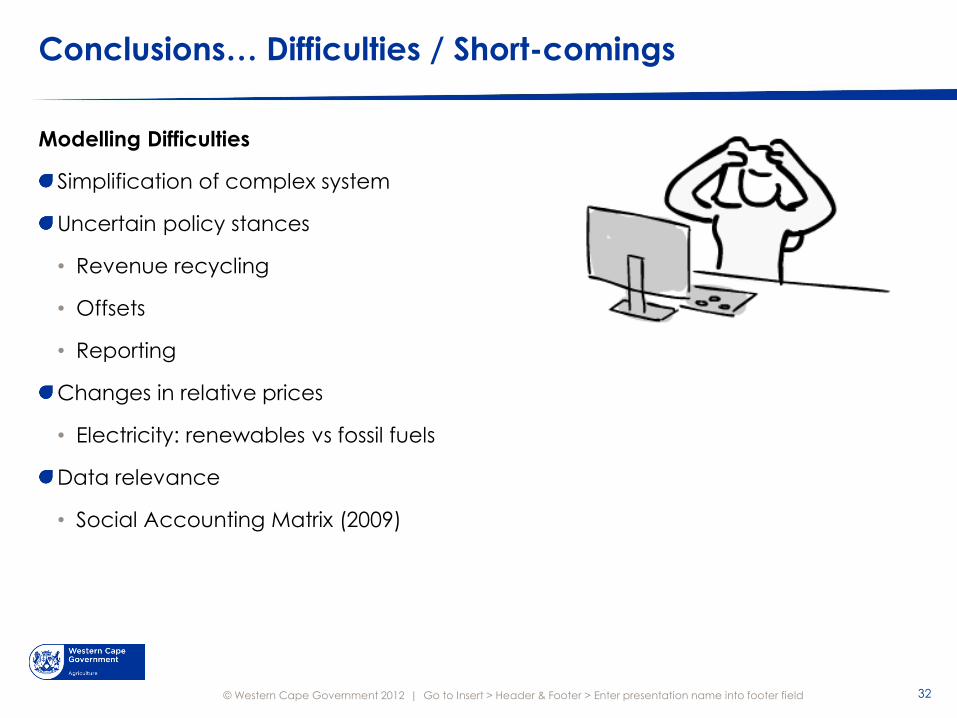
Modelling Difficulties
Simplification of complex system
Uncertain policy stances
• Revenue recycling
• Offsets
• Reporting
Changes in relative prices
• Electricity: renewables vs fossil fuels
Data relevance
• Social Accounting Matrix (2009)

© Western Cape Government 2012 |
Conclusions… Presentation Summary
33 Go to Insert > Header & Footer > Enter presentation name into footer field
Economic impacts of carbon tax worrying
Sharp drop in Gross Domestic Product
Disproportionately felt by middle income households
The key factor in the carbon tax impact will be the behavioural reaction
We have a good idea of how we want behaviour to react, uncertainty around how it will
Key factor: recycling of tax revenues
Negative impact of carbon tax can be mostly offset through an across the board decline in fossil
fuel use intensity
Feasibility?
Negative impacts can also be set off by a targeted intervention at South Africa’s Energy Sector
Reduced dependency on coal for electricity production
© Western Cape Government 2012 |
Conclusions… Presentation Summary
34 Go to Insert > Header & Footer > Enter presentation name into footer field
Carbon tax IS a serious threat to South Africa’s Agricultural Sector
Direct impact of tax negligible but it is still essential to look to reduce emissions in the sector
Constitutional mandate
What about post 2020?
• Potential for a tax on agricultural emissions
Substantial indirect impacts
Soaring electricity prices
• Electricity infrastructure already under strain
Strong impact also through rising prices of fertilizers and pesticides
To a lesser extent, but still significant impact from rising prices of petroleum products
Impact on key Western Cape agricultural products greater than the sector’s aggregate impact
© Western Cape Government 2012 |
Conclusions… The Way Forward
35 Go to Insert > Header & Footer > Enter presentation name into footer field
Produce more with less
Less electricity
• Small-scale on-farm electricity production
Less fertilizers and pesticides
• Or look to fertilizers and pesticides utilising different production methods
Agriculture could be a key player in transitioning to cleaner energy production
Biofuels
Solar, wind, hydro etc.
We don’t have much time to plan and the phase-in period has been shortened
Need to act NOW
Need to ensure of efficient monitoring systems to collect data to be reviewed regularly

Thank you

Tel: Fax:
www.elsenburg.com
Contact Us
Andrew Partridge
Macro & Resource Economic Services
(+27) 021 808 7633 (+27) 021 808 5210


