
FIW, a collaboration of WIFO (www.wifo.ac.at), wiiw (www.wiiw.ac.at) and WSR (www.wsr.ac.at)
FIW – Working Paper
The real exchange rate of an oil exporting economy: Empirical evidence from Nigeria
Hassan Suleiman, Zahid Muhammad1
In this study the long-run relationship between real oil price, real effective exchange rate and productivity differentials is examined using annual data for Nigeria over the period 1980 to 2010. We aim to investigate whether oil price fluctuations and productivity differentials affect the real effective exchange rate. The empirical results suggest that whereas real oil price exercise a significant positive effect on the real exchange rate in the long run. Productivity differentials exercise a significant negative influence on the real exchange rate. The study noted that, the real exchange rate appreciation of 2000-2010 was driven by oil prices. The findings of this study have important implications for exchange rate policy and are relevant to many developing economies where oil exports constitute a significant share of their exports. JEL: F31, C22 Keywords: Exchange rate, oil price, Nigerian economy
1 Corresponding author:[email protected], Phone:+44(0)1382 308423, Fax: +44(0)1382 308326, Address: Dundee Business School, University of Abertay Dundee, DD1 1HG, Scotland, UK
Abstract
The authors
FIW Working Paper N° 72 September 2011


The real exchange rate of an oil exporting economy: Empirical evidence from Nigeria
Hassan Suleiman and Dr.Zahid Muhammad *
Dundee Business School, University of Abertay Dundee, United Kingdom
August, 2011
*Corresponding author:[email protected]
Phone:+44(0)1382 308423
Fax: +44(0)1382 308326
Address: Dundee Business School, University of Abertay Dundee, DD1 1HG, Scotland, UK
Abstract: In this study the long-run relationship between real oil price, real effective
exchange rate and productivity differentials is examined using annual data for Nigeria
over the period 1980 to 2010. We aim to investigate whether oil price fluctuations and
productivity differentials affect the real effective exchange rate. The empirical results
suggest that whereas real oil price exercise a significant positive effect on the real
exchange rate in the long run. Productivity differentials exercise a significant negative
influence on the real exchange rate. The study noted that, the real exchange rate
appreciation of 2000-2010 was driven by oil prices. The findings of this study have
important implications for exchange rate policy and are relevant to many developing
economies where oil exports constitute a significant share of their exports.
Keywords: Exchange rate, oil price, Nigerian economy
JEL classifications: F31, C22

1. Introduction
The literature on oil price macroeconomic dynamics is vast; a large part of this literature
has looked at the influence of oil price on exchange rate movements which is the key
issue considered in this paper. Evidence of oil price fluctuations having a significant
impact on the exchange rate of oil producing nations has been reported for Nigeria
(Ozsoz and Akinkunmi,2011), Canada (Issa et al, 2008), Kazakhstan(Kutan and
Wyzan,2005), Russia (Spatafora and Stavrev, 2003; Oomes and Kalcheva, 2007), Algeria
(Koranchelian, 2005), Venezuela (Zalduendo, 2006), Egypt (Mongardini, 1998) and
OPEC countries (Korhonen and Juurikkala,2007). While insignificant results or negative
relationship has been reported for Norway (Bjornland and Hungnes, 2008; Akram, 2000,
2004; Habib and Kalamova, 2007), Canada (Amano and van norden, 1995a; Gauthier
and Tessier, 2002) and Saudi Arabia (Habib and Kalamova, 2007)
In this paper, we estimate the long run effects of real oil price on real exchange rate
using the Johansen framework based on annual data from 1980 to 2010. Testing
whether real oil price has an impact on real exchange rate in Nigeria. Following Habib
and Kalamova (2007), we construct Nigeria’s productivity differential against thirty
major trading partners and include it as an explanatory variable of the real exchange
rate model. Productivity differential is used to capture the Balassa Samuelson effect.
The list of major trading partners include Australia, Austria, Benin Brazil, Cameroun,
Canada, China, Cotedevoire, France, Germany, Ghana, India, Ireland, Italy, Japan,
Netherlands, New Zealand, Niger, Peru Portugal Senegal, South Africa, Spain, Sweden,
Switzerland , Thailand, Turkey, U.A.E, U.K and U.S constituting more than 86% of the
trade between Nigeria and the rest of the world.
According to the Balassa-Samuelson hypothesis formulated by Balassa (1964) and
Samuelson (1964), an improvement in the productivity of tradable’s relative to non
tradable’s if larger in other countries could lead to the appreciation of the real
exchange rate. The Balassa-Samuelson effect is thus the mechanism by which an
appreciation of the real exchange rate occurs owing to changes in relative
productivity (Coudert, 2004). Given that oil price is the main export good driving the
terms of trade in oil exporting countries, we use the real oil price as a proxy of the terms

of trade and examine the influence of oil price fluctuations and productivity
differentials on the real exchange rate. In practice, the price of the main exported
good is often used as an indicator of the terms of trade (Sossounov and Ushakov, 2009).
Nigeria is currently the second largest oil exporting country in the Organization of
Petroleum Exporting Countries (OPEC) and is heavily reliant on its crude oil exports
which accounts for 95% of its exports and foreign exchange earnings and about 80% of
Government revenue in annual budgets (EIA, 2010). Oil has been the dominant factor
in Nigeria’s economy since its discovery in 1956 (Budina et al, 2006). Variations in world
commodity prices tend to influence the currency values of resource exporting
economies (Clements et al, 2007). Oil exporting nations may experience exchange rate
appreciation when oil price rise, conversely exchange rate of oil exporting nations may
depreciate when oil price falls (see Akram, 2004 and Cashin et al, 2004).
Oil price is becoming increasingly volatile, between 2000 and 2008 oil price increased
more than 6 folds from $23 per barrel in January of 2000 to peak at an all time high at
$146 per barrel in July 2008 before crashing to $42 per barrel by December of 2008.
Prices then began the year 2009 at below $40 a barrel, averaging $61.73 per barrel for
the year peaking at $78 in November 2010. In 2011, the price of crude oil started the
year on a high note hitting a 2 year high selling at $95 a barrel. The price has continued
to trend upward as a result of political crisis in the Middle East.

Figure 1: Trend in Oil Prices
0
20
40
60
80
100
120
140
92 94 96 98 00 02 04 06 08
OILP
Figure 2 shows Nigeria’s real effective exchange rate over the period 1980 to 2010. From
1980 to 1985 following the oil price increase, we can observe an upward trend with the
real exchange rate appreciating significantly leading to loss of competitiveness for the
Nigerian economy. In 1986, Nigeria experienced a sharp decline in its real exchange
rate following declining oil prices and the Structural Adjustment Programme (SAP)
which led to the devaluation of the Nigerian currency- the Naira. Between 1993 to 2000,
there were substantial movements in the real exchange rate. Since then, the real
exchange rate index fluctuated around a constant trend with evidence of mild
appreciation of the real exchange rate. In recent years, owing to rising global oil prices
and increased oil exports, Nigeria experienced large foreign exchange inflows. The real
exchange appreciation could be described to be a response to the large foreign
exchange inflow that characterised the Nigerian economy or it could as well be a
response to productivity gains. The macroeconomic impacts of these fluctuations, the

recent upward trend of oil prices and foreign exchange inflow pose challenges for
exchange rate management in Nigeria.
Figure 2: Nigeria’s real effective exchange rate
0
100
200
300
400
500
600
700
1980 1985 1990 1995 2000 2005 2010
REER
The purpose of this empirical paper is therefore to discern the long run relationship
between oil price, productivity differentials and exchange rate in Nigeria. We aim to
contribute to the literature on the Nigerian economy. From a methodological point of
view, we construct Nigeria’s productivity differential against thirty (30) major trading
partners and include it as an explanatory variable in the real exchange rate model.
While a lot of research has been ongoing in this area, the largest part of the literature
has concentrated on developed economies. The study finds evidence that real oil
price and productivity differentials adequately captures innovations in the real
effective exchange rate but the Balassa-Samuelson effect is not of importance for real
exchange rate dynamics in Nigeria. The rest of this paper is organized as follows.
Following this introduction, section 2 presents the literature survey and theoretical

framework while section 3 describes the data and the econometric methodology. In
Section 4, we present the empirical results, while we summarize the major findings and
draws conclusions in section 5.
2.1 Literature Survey and theoretical framework
According to Chaudhuri and Daniel (1998), in an oil producing country the relative
price of the output bundle of commodities should rise when the relative price of oil
increases creating an increase in the oil producer’s real exchange rate. Consistent with
many papers that have established the importance of oil price changes on relative
prices, Cashin et al(2004) in a study of over 50 commodity exporting developing
countries finds a long-run relationship between exchange rate and the exported
commodity’s price in one third of their sample. In a recent study, Ozsoz and Akinkunmi
(2011) demonstrated the positive effects of world oil prices on Nigeria’s exchange rate.
Coleman et al (2011) using a pool of 13 African countries found no long run relationship
between real effective exchange rate and real oil price for Nigeria. In a study on Asian
economies, Tsen (2011) demonstrated evidence showing real oil price and productivity
differentials among others were important determinants of the real exchange in the
long run.
In a Panel of seven (7) OPEC countries including Nigeria, Nikbakht (2010) demonstrated
the important influence of oil prices on the real exchange rate. The author showed that
real oil prices have indeed been a dominant source of real exchange movement.
Earlier on, Chen and Chen (2007) in a panel study for G7 countries similarly
demonstrated that real oil have been the dominant source of real exchange
movements. However while Aziz(2009) found evidence of a positive and statistically
significant relationship between real oil price and real exchange rate for a panel of net
importing countries, he found no evidence of long run relationship between real oil
price and real exchange rates for a panel of net oil exporting countries.
Amano and van Norden(1996) noted the importance of real domestic oil prices for real
exchange rate movements for Germany, Japan and the united states in the post
bretton woods period. Chaudhuri and Daniel (1998) demonstrated that the non
stationary behaviour of oil prices was responsible for the non stationary behaviour of US

dollar real exchange rate over the post Bretton Woods era. Habib and Kalamova (2007)
established a long run positive relationship between real oil price and real exchange
rate for Russia and none for Russia and Saudi Arabia.
In a study of the Russian economy, Spatafora and Stavrev(2003) confirm the sensitivity
of Russia’s equilibrium real exchange rate to long run oil prices. Similarly, Suseeva(2010)
demonstrated a long run positive relationship between the real oil price and the real
bilateral exchange rate against Euro in Russia. Lizardo and Mollick(2010) provided
evidence that from the 1970s to 2008, oil prices significantly explained movements in
the value of the U.S dollar against major currencies. They found that when oil prices go
up currencies of oil importers such as Japan suffer a depreciation. On the other hand, in
net oil exporters such as Canada, Mexico and Russia, increase in oil prices leads to a
significant depreciation of the US dollar. Akram(2004) finds strong evidence of no linear
relationship between oil prices and the Norwegian exchange rates.
A number of papers have also previously suggested the potential role of productivity
differentials in exchange rate determination. Amano and Van norden (1996) noted that
earlier research on the role of relative productivity growth in explaining the behaviour of
real exchange rate had been mixed. They observed that relative productivity were
sufficiently small, gradual and therefore explained little of the overall movements in real
exchange rates over the previous decades. Focusing on a small open economy,
Pattichis and Kanaan (2004) provided considerable support for the Balassa Samuelson
hypothesis for cyprus. They established a long run positive relationship exists between
the relative price of non tradables and real income per capita. They found that both
real income and real oil price significantly affects the relative price of nontradables
consistent with the Balassa Samuelson hypothesis.
Choudhri and Khan(2004) using a panel of 16 developing countries provided strong
evidence workings of the Balassa Samuelson effects. Coudert (2004) surveyed
evidence that the trend appreciation in the real exchange rate observed in countries
of central and Eastern Europe during the early 2000 stemmed in fact from a Balassa
effect. The author noted that while other factors were equally responsible, the
estimated Balassa effect goes some way in explaining the real appreciation. Kutan and

Wyzan (2005) using an extended version of the Balassa-Samuelson model including oil
price finds evidence that changes in oil prices had a significant effect on the real
exchange rate during 1996 to 2003 and that the Balassa- Samuelson working through
productivity changes may be present though its economic significance may not be
large.
The theoretical underpinnings of this study are based on theoretical framework of
exchange rate determination developed by Cashin et al. (2004). In describing the
theoretical link, the authors considered a small open economy producing two different
types of goods, a nontradable good and an exportable good called “primary good”.
Labour is the only factor of production employed by firms in the export and non traded
sector to produce these goods. They also assume production is undertaken by
competitive firms which have access to constant returns to scale technology. Labour is
also mobile across sectors and this ensures that wages are equated across sectors. The
framework assumes only supply side factors were relevant and therefore abstracts from
demand side considerations and concentrate on the long run relative price
determination.
Both non traded and final tradable good which is imported and not produced locally
are consumed by domestic consumers. While foreign firms in the process of producing
the final tradable good employ the primary commodity along with an intermediate
good not produced locally but produced only abroad. The final tradable good and a
non traded good are consumed by foreign households. Cashin et al showed that the
determination of the real exchange rate may be summarised by the following relation:
γ
= *
**
*1* I
X
N
NX
PP
aa
aa
PEP 1
Where PX*/PI* denotes the commodity terms of trade measured in foreign prices( i.e the
price of the primary commodity in relation to the intermediate foreign good). while
aX/aI* accounts for the productivity differentials between the export and
import(foreign)sectors and aN*/aN corresponds to the productivity differentials between
the local and foreign non traded sectors. The last two terms embody the Balassa

Samuelson effect. An increase in the productivity in the commodity sector tend to
increase wages which leads to an increase in the price of the non traded good which
finally leads to an appreciation of the real exchange rate.
3.1 Data and its Properties
The study uses annual data on real effective exchange rate based on relative CPI and
average crude oil spot price obtained from IMF International Financial Statistics. The
annual data ranges from 1980 to 2010 for a total of 31 observations. The study period is
dictated by data availability. All variables were expressed in natural logarithms prior to
econometric analysis for better fit and to reduce the problem of heteroscedasticity.
Drawing on related existing literature, we construct the annual real oil price as the
nominal average price of crude in US Dollars deflated by the IMF index of the unit
value of world manufactured exports. This is in line with ( Cashin et al, 2004; Habib and
Kalamova,2007 and Suseeva,2010). Following Habib and Kalamova (2007), we use a
proxy to calculate the productivity differential variable defined as the trade weighted
relative productivity differential against trading partners productivity, where Productivity
is PPP GDP per capita. Data on GDP per capita based on PPP are from the World Bank
world economic indicators. Symbolically:
PROD=пj=1(productivityi/productivityj)wij, 2
Where productivityi and productivityj denotes productivities of Nigeria and the trading
partner. Average weighted productivity differential of 30 major countries who are
Nigeria’s partners in trade is calculated, for period t in the following way:
PROD=(GDPcit )Wit (GDPcit ) W2t … (GDPcit )w30t 3
The formula for calculating the weights is the following:
∑ ∑= =
+
+= n
i
n
iii
iii
MX
XMW
1 1
4

Where:
Wi = weight of country i in the overall trade volume of the country.
M= Import of Nigeria from country i; X= Export of Nigeria to country i
∑=
n
iiX
1
= Exports of Nigeria to 30 major trading partners;
∑=
n
iiM
1
= Imports of Nigeria from its 30 major trading partners
Weights are calculated for Nigeria’s thirty major trading partners based on the total
volume of trade using country specific trade shares as weights. The data is obtained
from the Direction of Trade statistics (DOTS).
A priori, we expect the coefficient of terms of trade (oil price) to have a positive effect
on the REER. An improvement in the terms of trade will tend to increase the real
exchange rate through income and wealth effects (AlShehabi and Shuang, 2008). The
coefficient of the productivity differential is expected to have a positive sign since
productivity gains are believed to lead to higher real exchange rate.
Table 1 presents the descriptive summary statistics for the Real exchange rate,
Productivity differential and real oil price. It is apparent from the standard deviation that
REER has the highest volatility even higher than the real oil price. The distributional
properties of our productivity differential variable appear to be non normal. The Jarque-
Bera statistic and its associated p value reject the null hypothesis that the variable is
normally distributed. All series have positive skewness and kurtosis indicate leptokurtic
distribution.

Table 1: Summary Statistics
LREER LROILPMUV LPROD
Maximum 6.432215 -0.463468 -0.964337
Minimum 4.059603 -2.268752 -1.490759
Std. Dev. 0.68024 0.510696 0.10791
Skewness 1.052754 0.335166 1.312051
Kurtosis 2.74319 1.901261 5.69312
Jarque-
Bera 5.623897(0.06) 2.070717(0.35) 17.67351(0.00)
3.2 Methodology,
The Johansen systems procedure is used to test for the presence of a long-run
relationship. The Johansen method for testing for cointegration is based on the
properties of a Vector Error Correction Model (VECM) and takes the form:
1
1
p
t t j t j tj
D− −=
∆ = Π + ∆ +∑z z z v 5
Where the vector of I(1) endogenous variables zt=[LNREERt, LNPRODt, LNROILPMUVt],
∆Ζ are all I(0) variables vt is a (3 x 1) vector of white noise error terms. D is a (3x3) matrix
of coefficients of deterministic terms. The п matrix contains information regarding the
long run relationships, it is decomposed into n x r matrices of α and β such that
βα ′=Π , with the /columns of matrices β representing the r linear combinations of Xt
that are stationary or cointegrated and the columns of α is the vector of speed of
adjustment to equilibrium coefficients(Asteriou and Hall, 2006). Johansen (1988, 1991)
proposed two statistics, the trace and maximum eigen value statistic which take the
form

)1()( ∑∧
−−= itrace InTr λλ and )1()1,( 1max +
∧
−−=+ rInTrr λλ 6
Where T is the number of observation, λi are the ordered eigenvalues and λr is the
eigenvalue corresponding to r cointegration vectors(Wang, 2003). The λtrace is a joint test
with the null that the number of cointegration is less than or equal to r against the
alternative that there are more than r. While λmax has as its null hypothesis that the
number of cointegrating vectors is r against the alternative of r+1 (Brooks, 2008). Since
there are three variables there can be at most two linearly independent cointegrating
vectors i.e. r ≤ 2.
Our empirical analysis proceeds as follows: We first investigate the integrational
properties of our variables and then search for any potential cointegrating relationship.
Assuming the real effective exchange rate, productivity differential and oil price are
stationary, we will then check if change in real oil price and productivity differential can
explain the REER.
4. Empirical analysis
The empirical analysis examines whether oil price fluctuations and productivity
differentials affect the real effective exchange rate using Johansen’s VAR technique.
Table 2 summarizes the results of the unit root tests based on the Augmented Dickey
Fuller (ADF) and Philips Perron (PP) test. We include both (i) an intercept and (ii) an
intercept and trend in the estimation. As noted by Habib and Kalamova (2007) and
Taylor (2003), identifying the integrational properties of the real exchange rate is a
difficult task due to their near unit root behaviour as both stationary and non stationary
data generating processes may characterise the real exchange rate. Using both ADF
and PP unit root tests, the common suggestion is that the real effective exchange rate
(REER) and real oil price (ROILP) and Productivity differentials(PROD) are non stationary
in their levels and stationary at their first difference. The result of the unit root test is
unequivocal regarding the order of integration.

Table .2: Augmented Dickey Fuller Test and Phillip Perron and DFGLS Variables ADF PP (i) (ii) (i) (ii) ____________________________________________________________________________________ LREER -1.66 -1.42 -1.78 -1.62 LROILP -0.94 -0.92 -0.93 -1.36 LPROD -1.91 -1.30 -3.79 -2.88
Proceeding with the cointegration analysis, Table 3 reports the results of the Johansen
cointegration test. We first estimated a VAR in levels to determine the optimal lag
length as cointegration is sensitive to lag length. Starting with two lags due to the limited
number of observations, we limited the maximum lag to one in the lag length selection
process based on LR, SC and HQ after having checked for the absence of residual
serial correlation. The VAR also satisfy other stability condition and there was no root
lying outside the unit circle. Table 3 displays results of the cointegration analysis. The
results of the λtrace and λmax statistics strongly suggest there exist one significant
cointegrating vector. The result rejects the null of no cointegration but cannot reject
the hypothesis that there is at most one cointegrating equation. On the basis of the
λtrace and λmax, there is evidence of one cointegrating vector and is significant at 5% and
1% respectively. The real exchange rate, real oil prices and productivity differential are
therefore linked together by a long run equilibrium relationship as real oil price and
productivity differential adequately capture innovations in the real effective exchange
rate.

Table 3: Johansen Maximal Eigenvalues Test and Trace Test
LNREER LNROILP LNPROD
_____________________________________________________________________________________ Null Hypothesis Alternative Test statistic p-value _____________________________________________________________________________________ Trace test r=0 1≤r 30.75 0.01 r=1 2≤r 2.64 0.88 r=2 3≤r 0.11 0.75 Max.eigenvalue test r=0 1≤r 28.11 0.00 r=1 2≤r 2.53 0.88 r=2 3≤r 0.11 0.78
Table 4: Cointegration vector ( t-Statistics [ ])
Cointegrating Eq: CointEq1 LREER(-1) 1.000000
LPROD(-1) 4.631069 [ 13.0967]
LROILPMUV(-1) -0.948019 [-3.26350]
The Johansen cointegration technique indicates that the three variables are linked
together by long run equilibrium relationship which is presented in table 4 above. The
long run parameters of the estimated system are given by the matrix after normalising

by the coefficient of the real effective exchange rate. In the long run oil price (LOILP)
exercises a significant positive influence on the real exchange rate (LREER). This long run
positive relationship is as expected, positive and relatively large; it could be explained
by the fact that Nigeria is an oil exporting country. This has been confirmed in a number
of similar studies (see e.g Olomola and Adejumo, 2006 etc). A 1% change in real oil
price will lead to a 0.94% increase in the real effective exchange rate. On the other
hand Productivity differential exerts a negative influence on real exchange rate. Thus in
Nigeria, the Balassa–Samuelson effects do not seem to play an important role in driving
the real exchange rate indicating that higher productivity in Nigeria’s traded goods
sector vis a vis its trading partners decreases the real exchange rate in the long run. A 1
% increase in productivity differential will lead to a 4.3% decrease in the real effective
exchange rate in the long run.
Over all, the findings suggest some significant dependency between oil price,
Productivity differential and the real effective exchange rate. Given the relatively short
time series, results should be interpreted with caution.
5. Conclusion
The paper examined whether the real exchange rate is affected by movements in the
real price of oil, controlling for the possible role of productivity differentials against 30
major trading partners. In recent years owing to high global oil prices and increased
exports, oil rich Nigeria experienced large inflows of foreign exchange. We observed a
modest appreciation of the CPI based REER since 2000(figure 2). The real appreciation
could be attributed to the large inflows of foreign exchange in the form of oil revenue
during that period, or a response to productivity gains.
Our results also indicate that the Nigerian currency- the Naira could be described as an
“oil currency” as results indicate a long run positive and significant relationship between
real exchange rate and real oil price. Real exchange rate commove with oil price and
productivity differentials in the long run. Secondly, there is a lack of support for the
Balassa-Samuelson effect as indicated by the negative and significant coefficient on

the productivity differential. The observed real exchange rate appreciation is
attributed to improvements in oil prices and not the Balassa Samuelson effect. Policy
makers need therefore to focus attention on the implication of real exchange rate
appreciation due to foreign exchange inflows arising from oil revenue which is an
indication of “Dutch disease” both in medium and long term.
Krugman (1983) and Gulub(1983) have long noted the influence of oil revenue through
wealth effects on the exchange rate(Coudert et al, 2008). The Nigerian economy is a
“commodity economy”, as oil exports have maintained the largest share of Nigeria’s
total exports for decades. Salehi-Isfahani (1989) had observed that real appreciation
rather increase in oil revenues was responsible for the phenomenal rise in Nigerian
imports in the 1970s. Nigeria’s real exchange rate needs to be moderated as a result of
oil price fluctuations. Some level of real appreciation is inevitable given high oil prices ,
Nigeria’s exchange rate policy has contributed to nations ‘boom and bust’ cycles over
the past 30 years (Budina, et al, 2006).

Reference
Akram, Q F., 2000. PPP Despite Real Shocks: An Empirical Analysis of the Norwegian Real
Exchange Rate. Norges Bank Working Paper, 7.
Akram, Q. F., 2004. Oil Prices and Exchange Rates: Norwegian Evidence. Econometrics
Journal, 7(2), 476-504.
AlShehabi, O., Shuang, D., 2008. Estimating Equilibrium Exchange Rates for Armenia and
Georgia. IMF working Paper WP/08/110.
Amano, R., Van Norden, A.S., 1995. Terms of Trade and Real Exchange Rates: The
Canadian Evidence. Journal of International Money and Finance, 14(1), 83-104.
Amano, R., Van Norden, A.S., 1996. Exchange Rates and Oil Prices. Bank of Canada
Working Paper 95-8
Asteriou, D., Hall,S.G.,. 2006. Applied Econometrics. China: Palgrave macmillan.
Aziz, M. I. A., 2009. Oil Price and Exchange Rate: A Comparative Study between Net Oil
Exporting and Net Oil Importing Countries. ESDS International Annual Conference 2009.
London.
Balassa, B., 1964. The Purchasing Power Parity Doctrine: A Reappraisal. Journal of
Political Economy. Vol. 72, 584–596.
Budina, N., Pang, G., Van Wijnbergen, S., 2006. Nigeria: Dutch Disease or Debt
Overhang? Diagnosing the Past, Lessons for the Future . Available:
http://siteresources.worldbank.org/INTDEBTDEPT/Resources/20061012_06.pdf

Bjornland, H. C., Hungnes, H., 2008. The Commodity Currency Puzzle. The ICFAI Journal
of Monetary Economics, 0(2), 7-30.
Brooks, C., 2008. Introductory Econometrics for Finance, 2nd ed. Cambridge Univesity
Press, Newyork.
Cashin, P., Luis, F.C., Sahay,R., 2004. Commodity Currencies and the Real Exchange
Rate. Journal of Development Economics, 75(1), pp. 239-68.
Chaudhuri, K., Daniel, B. C., 1998. Long-run equilibrium real exchanges and oil prices.
Economic Letters, 58, 231-238.
Choudhri, E.U., Khan,M.S., 2004. Real Exchanges Rates in Developing Countries: Are the
Balassa-Samuelson Effects Present? IMF working paperWP/04/188.
Clements, K., Yihui, L., John R., 2008. Exchange Rate Economics for the Resource Sector.
Resources Policy, 33, 102-17.
Coleman, S., Cuestas, J. C., Mourelle,E., Cuestas,J., 2011. Investigating the oil price-
exchange nexus: Evidence from Africa. Sheffield Economic Research Paper Series SERP:
2011015 University of Sheffield, Sheffield.
Coudert, V., 2004. Measuring the Balassa-Samuelson Effect for the Countries of Central
and Eastern Europe? Banque de France Bulletin Digest No122, 23-43.
Coudert, V., Couharde, C., Mignon,V., 2008. Do Terms of Trade Drive Real Exchange
Rates? Comparing Oil and Commodity Currencies, In CEPII Working paper. Centre
D'Etudes Prospectives Et D'Informations Internationales CEPII.
EIA.,2010. Country Analysis Briefs:Nigeria. Energy Information Administration.

Gauthier, C., Tessier, D., 2002. Supply Shocks and Real Exchange Rate Dynamics:
Canadian. Bank of Canada working Paper 02-31.
Habib, M.M., Kalamova,M. M., 2007. Are There Oil Currencies? The Real Exchange Rate
of Oil Exporting Countries. European Central Bank working Paper 839.
Issa, R, Lafrance,R., Murray,J., 2006., The Turning Black Tide: Energy Prices: Energy Prices
and the Canadian Dollar. Bank of Canada working paper series.
Johansen, S.,1988. Statistical Analysis of Cointegration Vectors. Journal of Economic
Dynamics and Control. No. 12. P. 231–254.
Johansen, S., Juselius,K.,1990. Maximum Likelihood Estimation and Inference on
Cointegration – with Applications to the Demand for Money. Oxford Bulletin of
Economics and Statistics. Vol. 52. P. 169–210.
Koranchelian, T., 2005. The Equilibrium Real Exchange Rate in a Commidty Exporting
Country: Algeria's Experience. IMF working Papers, 5(131).
Korhonen, I.,Juurikkala,T., 2009. Equilibrium Exchange Rates in Oil-Exporting Countries.
Journal of Economics and Finance, 33, pp. 71-79
Kozhan, Roman., 2010. Financial Econometrics-with Eviews, In. BOOKBOON.
Kutan, A. M., Michael., L. W., 2005. Explaining the Real Exchange Rate in Kazakhtan,
1996-2003:Is Kazakhstan Vulnerable to the Dutch Disease?. Economic Systems, 29, pp.
242-55.
Lizardo, R. A., Mollick,A.V., 2010. Oil price fluctuations and U.S. dollar exchange rates,
Energy Economics 32, 399-408.

Mongardini, J., 1998. Estimating Egypts Equilibrium Real Exchange Rate. IMF working
Pap
er 98(5).
Nikbakht, L .,2010. Oil Prices and Exchange Rates: The Case of Opec. Business
Intelligence Journal, 3(1).
Olomola, A. V. Adejumo,P.A., 2006. Oil Price Shocks and Macroeconomic Activities in
Nigeria. International Research Journal of Finance and Economics, 3.
Oomes, N., Kalcheva.,K., 2007. Diagnosing Dutch Disease: Does Russia Have the
Symptoms, In BOFIT Discussion Paper 7.
Ozsoz, E., Akinkunmi, M. 2011. An Evaluation of Price Based Determinants of Nigeria s
Real Exchange Rate. SSRN eLibrary.
Pattichis, C., Kanaan., M. 2004. The Balassa- Samuelson Hypothesis and Oil Price Shocks
in a Small Open Economy: Evidence from Cyprus. Open economies review, 15, 45-56.
Salehi-Isfahani, D., 1989. Oil Exports, Real Exchange Rate Appreciation, and Demand for
Imports in Nigeria. Economic Development and Cultural Change, 37, 495-512.
Samuelson, P.,1964. Theoretical Notes and Trade Problems. Review of Economic
Statistics. Vol. 46. P. 145–154.
Sossounov, K., Ushakov, N., 2009.Determination of the real exchange rate of rouble and
assessment of long run policy of real exchange targeting. Munich Personal RePEc 18549
Spatafora, N., Stavrev,E., 2003. The Equilibrium Real Exchange Rate in a Commodity
Exporting Country: The Case of Russia, In IMF working Paper 03/93.

Suseeva, N., 2010. The Real Exchange Rate of an Oil Exporting Country: The Case of
Russia, In. Paris: Erasmus Mundus
Taylor, M. P., 2003. Is official exchange rate intervention effective? Discussion Paper.
Centre for Economic Policy Research , London.
Tsen, W. H., 2011. The real exchange rate determination: An empirical investigation,
International Review of Economics and Finance 20, 800-811.
Wang, P., 2003. Financial Econometrics: Methods and Models. London: Routledge
Taylor and Francis Group.
Zalduendo, J., 2006. Determinants of Venezuella's Equilibrium Real Exchange. IMF
working paper 06/74.

APPENDIX A: DIAGNOSTIC STATISTICS
(1) VAR LAG ORGER SELECTION CRITERIA:
Lag length: 1 lag is indicated by LR, SC and HQ while 2 lags is indicated by FPE and
AIC. Only lag 1 is mathematically stable
( 2) ROOTS OF THE COMPANION MATRIX
Root Modulus 0.790048 - 0.170935i 0.808328
0.790048 + 0.170935i 0.808328 0.797599 0.797599
( 3) Residuals:
Normal distribution test
Equation J-B Statistic Kurtosis LREER 3.41 [0.18] 4.25[0.16] LPROD 0.49 [0.78] 2.43[0.53] LROILP 3.22 [0.19] 3.17[ 0.85] Vector 7.13[0.30] Vector tests Hetero AR(4) LM(χ2(29)) 4.32(0.88) χ2(36) 45.15[0.14]
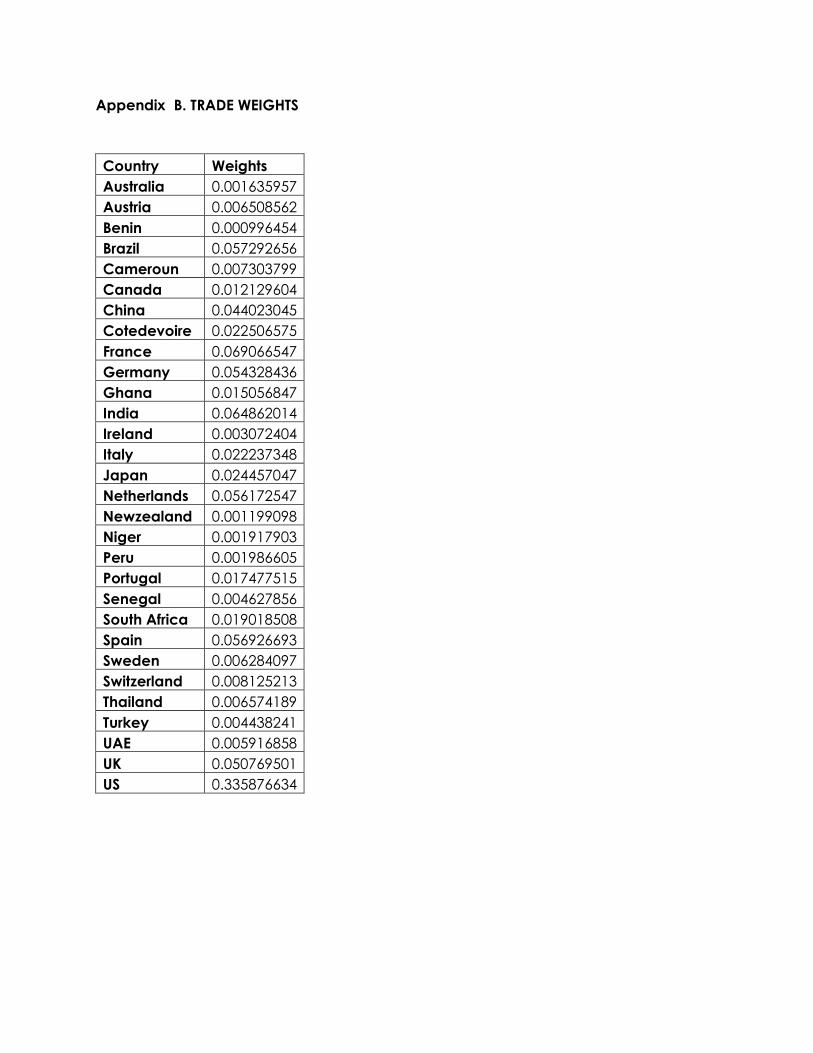
Appendix B. TRADE WEIGHTS
Country Weights Australia 0.001635957 Austria 0.006508562 Benin 0.000996454 Brazil 0.057292656 Cameroun 0.007303799 Canada 0.012129604 China 0.044023045 Cotedevoire 0.022506575 France 0.069066547 Germany 0.054328436 Ghana 0.015056847 India 0.064862014 Ireland 0.003072404 Italy 0.022237348 Japan 0.024457047 Netherlands 0.056172547 Newzealand 0.001199098 Niger 0.001917903 Peru 0.001986605 Portugal 0.017477515 Senegal 0.004627856 South Africa 0.019018508 Spain 0.056926693 Sweden 0.006284097 Switzerland 0.008125213 Thailand 0.006574189 Turkey 0.004438241 UAE 0.005916858 UK 0.050769501 US 0.335876634


