University of Wisconsin MilwaukeeUWM Digital Commons
Theses and Dissertations
August 2013
The Relationship Between the FunctionalMovement Screen™ and Countermovement JumpHeightJoshua Keegan ConlonUniversity of Wisconsin-Milwaukee
Follow this and additional works at: https://dc.uwm.edu/etdPart of the Kinesiology Commons
This Thesis is brought to you for free and open access by UWM Digital Commons. It has been accepted for inclusion in Theses and Dissertations by anauthorized administrator of UWM Digital Commons. For more information, please contact [email protected].
Recommended CitationConlon, Joshua Keegan, "The Relationship Between the Functional Movement Screen™ and Countermovement Jump Height" (2013).Theses and Dissertations. 213.https://dc.uwm.edu/etd/213
THE RELATIONSHIP BETWEEN THE FUNCTIONAL MOVEMENT SCREENTM
AND COUNTERMOVEMENT JUMP HEIGHT
by
Joshua K. Conlon
A Thesis Submitted in
Partial Fulfillment of the
Requirements for the Degree of
Master of Science
in Kinesiology
at
The University of Wisconsin – Milwaukee
August 2013
ii
ABSTRACT
THE RELATIONSHIP BETWEEN THE FUNCTIONAL MOVEMENT SCREENTM AND COUNTERMOVEMENT JUMP HEIGHT
by
Joshua K. Conlon
The University of Wisconsin-Milwaukee, 2013 Under the Supervision of Professor Kyle T. Ebersole, Ph.D., ATC
Introduction: Pre-participation measures of functional movement and functional
performance are commonly used to gauge injury risk and performance baselines before
engaging in activity. Functional movement can be evaluated using the Functional
Movement Screen™ (FMS™). Performance on the FMS™ has been shown to be related
to injury risk by previous researchers. Functional performance can be evaluated with
countermovement jump (CMJ) testing; performance on a CMJ demonstrates transferable
power to athletic tasks. Performance literature has shown that there are movement
factors that influence CMJ height. However, to date a significant relationship between
performance on functional movement and functional performance tests has not been
found. Therefore, the primary purpose of this study was to examine the relationship
between the FMS™ total score, scored on a 100-point and 21-point scale, and CMJ
height. The secondary purpose of the study was to perform an exploratory analysis
examining the relationship of the 21-point live scoring method as well as a 21-point video
scoring method of the FMS™. Methods: This study examined the relationship between
functional movement and functional performance of 36 participants. Functional

iii
movement was evaluated with the FMS™. The FMS™ was scored on three scoring
scales: 21-point live, 21-point video and 100-point. Functional performance was
quantified with CMJ height. Performance height of the CMJ was examined through the
use of a Myotest Sport unit. Bivariate Pearson correlations were used to examine the
relationships among all tested variables. Results: All FMS™ scoring methods were
significantly related to CMJ height. Each of the FMS™ scoring scales were also
significantly related to one another. Conclusions: Functional movement appears to be
related to functional performance regardless of the scale used to score the FMS™.
Additionally, the strong relationship shown between the scoring scales suggests that the
scales evaluate movement patterns similarly. However, more research is needed to better
understand the relationship between these two variables. Further research is also needed
to determine the validity of the FMS™ scoring scales and identify if the component tests
are scored differently on each scale.
iv
TABLE OF CONTENTS
Chapter Page LIST OF FIGURES ..................................................................................................... vii LIST OF TABLES ...................................................................................................... viii ACKNOWLEDGEMENTS ........................................................................................... ix I INTRODUCTION .............................................................................................. 1 Background ................................................................................................... 1 Purpose .......................................................................................................... 4 Hypotheses .................................................................................................... 4 Significance................................................................................................... 5 Scientific Significance ............................................................................ 5 Practical Significance.............................................................................. 5 Delimitations ................................................................................................. 6 Assumptions .................................................................................................. 8 Limitations .................................................................................................... 8 II LITERATURE REVIEW ................................................................................... 9 Introduction ................................................................................................... 9 The Functional Movement ScreenTM .......................................................... 10 Description of tests and scoring ............................................................ 11 Scoring ............................................................................................ 12 Deep Squat ...................................................................................... 12 Hurdle Step ..................................................................................... 13 In-line Lunge ................................................................................... 14 Shoulder Mobility ........................................................................... 15 Active Straight Leg Raise ............................................................... 16 Trunk Stability Push Up.................................................................. 16 Rotary Stability ............................................................................... 17 FMS™ populations ............................................................................... 18 Gender ............................................................................................. 19 Injury identification .............................................................................. 21 Cut-off score ................................................................................... 21 Reliability of the Functional Movement Screen™ ............................... 23 100-point scale ....................................................................................... 25 Itemization ...................................................................................... 26 Movement tiers ............................................................................... 26 Bilateral Assessment ....................................................................... 27 Video analysis ................................................................................. 28 Reliability ........................................................................................ 28 Functional performance .............................................................................. 29 Vertical jump performance ................................................................... 30
v
Measurement ......................................................................................... 31 Vertec .............................................................................................. 32 MyoTest .......................................................................................... 34 Factors for successful vertical jump ..................................................... 35 Squat depth....................................................................................... 36 Stiffness............................................................................................ 38 Stretch-shortening cycle................................................................... 41 Arm swing ........................................................................................ 43 Jump practice ................................................................................... 43 FMS™ and CMJ ......................................................................................... 45 Conclusion .................................................................................................. 50 III METHODS ....................................................................................................... 52 Introduction ................................................................................................. 52 Participants .................................................................................................. 52 Criteria for Exclusion ............................................................................ 53 Gender ............................................................................................. 53 Age .................................................................................................. 54 BMI ................................................................................................. 55 Activity Level ................................................................................. 55 Participants recruited ............................................................................ 56 Participant characteristics ..................................................................... 57 Study Design ............................................................................................... 57 Day 1 ..................................................................................................... 57 Height and weight ........................................................................... 58 FMS™ ............................................................................................. 60 Deep Squat ................................................................................. 61 Hurdle Step ................................................................................ 61 In-line Lunge .............................................................................. 61 Shoulder Mobility ...................................................................... 61 Active Straight Leg Raise .......................................................... 62 Trunk Stability Push Up............................................................. 62 Rotary Stability .......................................................................... 62 Countermovement jump.................................................................. 62 CMJ practice .............................................................................. 62 CMJ script .................................................................................. 63 Day 2 ...................................................................................................... 64 CMJ practice .................................................................................... 64 CMJ trials ......................................................................................... 64 Statistical Analysis ................................................................................ 65 IV RESULTS ......................................................................................................... 66 Introduction ................................................................................................. 66 Outcomes of interest ........................................................................ 66 FMS™ scores .............................................................................................. 67 CMJ height .................................................................................................. 67

vi
Primary outcome ......................................................................................... 67 FMS™ and CMJ correlations ..................................................................... 68 Secondary outcome ..................................................................................... 69 FMS™ scoring correlations ........................................................................ 70 V DISCUSSION ................................................................................................... 71 Introduction ................................................................................................. 71 Literature comparisons................................................................................ 72 FMS™ .............................................................................................. 72 CMJ .................................................................................................. 73 BMI .................................................................................................. 74 FMS™ and CMJ ......................................................................................... 75 Population characteristics ................................................................ 75 Power task ........................................................................................ 78 Scoring method ................................................................................ 80 FMS™ scoring relationship ........................................................................ 81 Conclusions ................................................................................................. 83 Limitations .................................................................................................. 84 Significance................................................................................................. 86 Scientific .......................................................................................... 86 Practical............................................................................................ 86 REFERENCES ................................................................................................. 88 APPENDICIES ................................................................................................. 96 A: Recruitment Flyer .................................................................................. 97 B: Description of testing protocol ............................................................... 99 C: Criteria for exclusion............................................................................ 102 D: Informed Consent................................................................................. 104 E: Exercise History Questionnaire ............................................................ 112 F: Institutional Review Board Protocol Summary .................................... 115 G: Example FMS™ 21-point Data Sheet ................................................. 132 H: Example FMS™ 100-point Data Sheet ............................................... 134 I: Example CMJ data sheet ....................................................................... 137 J: Functional Pyramid ............................................................................... 139 K: Participant descriptive data .................................................................. 141 L: Participant performance data ................................................................ 143

vii
LIST OF FIGURES
Figure Page
Figure 1. Flowchart of participant recruitment............................................................ 56 Figure 2. FMS™ 21 Live vs Mean CMJ Height (cm)................................................. 68 Figure 3. FMS™ 100 Live vs Mean CMJ Height (cm) .............................................. 69

viii
LIST OF TABLES
Table Page
Table 1. Descriptive Statistics for the FMS™ and CMJ Results. ................................ 67 Table 2. Counter Movement Jump Normalized Muscle Activity.................................. 68 Table 3. FMS™ Scoring Method Correlations. ........................................................... 70

ix
ACKNOWLEDGEMENTS
The successful completion of this thesis project was not possible without the
assistance of many supportive individuals. I would first like to give thanks to my primary
advisor, Dr. Kyle Ebersole. Without his professional guidance and academic enthusiasm,
this project would not have evolved the way that it had. I am most grateful to him for the
real-life experiences that he has given to me outside the classroom. I would also like to
acknowledge the other members of my committee, Drs. Jennifer Earl and Barbara Meyer.
Each provided a unique perspective and diligent feedback that was very helpful to my
own development as well as the development of this project. The students of the Human
Performance and Sport Physiology and Sport Psychology and Performance Excellence
Laboratories were tremendously helpful. They were my lean-to for problem solving and
the perfect comrades for this process. The Klotsche Center staff was also instrumental in
this project. Their flexibility was much appreciated as they assisted with the non-student
participants in this study. I would also like to thank my friends and family for their
never-ending love and support throughout this project. They continue to be the backbone
of who I am. Lastly, I would like to thank all those who participated in this study.
Without them I would have nothing to share.

1
CHAPTER I: INTRODUCTION
Background
It is widely accepted that sport participation and exercise are methods by which
individuals stay active and physically fit. It is recommended that prior to participation in
physical activity, active persons utilize pre-participation measures to gauge injury risk
and performance baselines before engaging in activity (Cook, Burton, & Hoogenboom,
2006a). The use of injury risk and athletic performance field tests have become integral
elements in the pre-participation evaluation process for exercisers and athletes (Kiesel,
Plisky & Voight, 2007; Minick et al., 2010). These field testing methods are commonly
used to assess the risk of injury for an individual as well as track training adaptations.
Both injury risk and athletic performance tests can be used as a guideline for inclusion
and exclusion in sport participation. Despite the possible benefits of each method of
evaluation, a single method of evaluating both injury risk and athletic performance has
not been developed to be used in field testing. This provides an opportunity to research
how current tools for injury assessment could be used to evaluate athletic performance.
Pre-participation screening assessments are used by researchers, clinicians and
coaches to establish baseline performance values. An injury risk field testing method that
has grown in popularity is the Functional Movement Screen™ (FMS™). It was
developed as a method to evaluate the balance of mobility and stability within an
individual’s movements, which may lead to injury (Cook et al., 2006a; Cook, Burton, &
Hoogenboom, 2006b). The FMS™ is a series of seven tests that purposefully place
participants in positions representing fundamental movement patterns, in an attempt to
isolate a segment, or segments, that are deficient in, or have asymmetric (O’Connor,
2
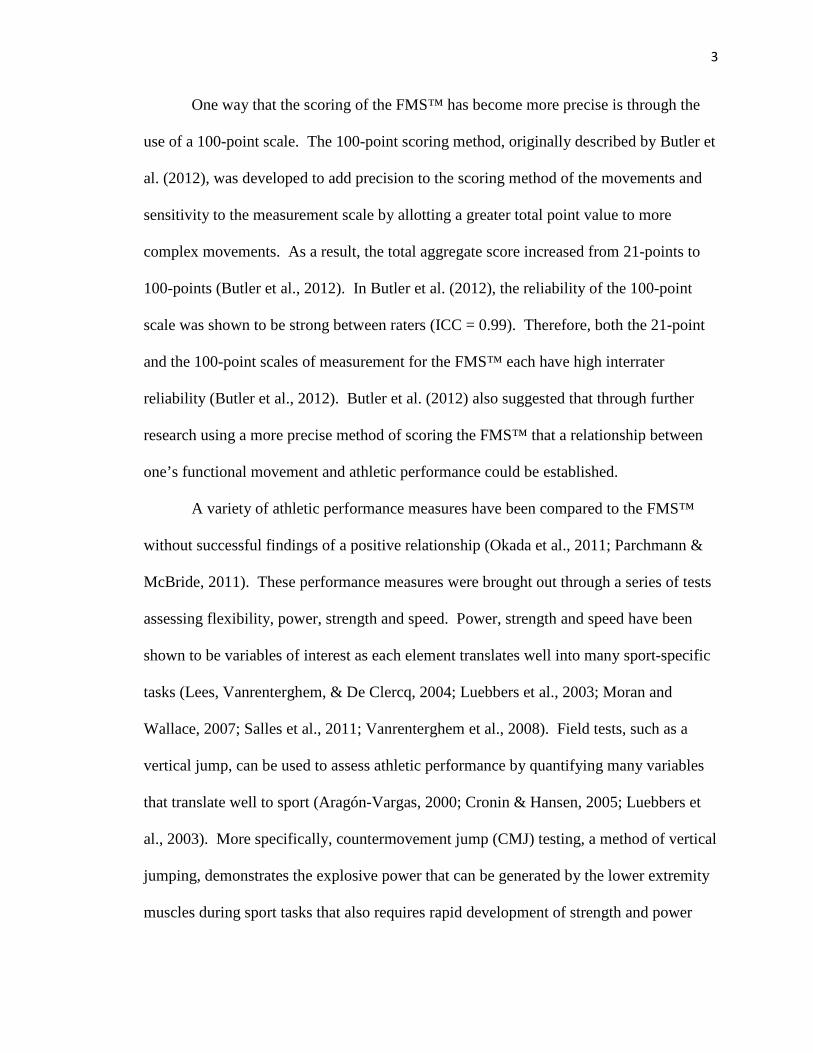
Deuster, Davis, Pappas & Knapik, 2011) amounts of strength, stability, and balance
(Kiesel et al., 2007). The seven tests of the FMS™ include a Deep Squat, Hurdle Step,
In-line Lunge, Shoulder Mobility, Active Straight Leg Raise, Trunk Stability Push Up,
and Rotary Stability. These tests were designed to identify areas of limitation,
asymmetry and imbalance within movement patterns (Cook et al., 2006a; Cook et al.,
2006b). Although pre-participation screening may improve identification of injury risk
(cite), a relationship between performance on pre-participation screening and athletic
performance has yet to be established.
The Functional Movement Screen™ is a reliable tool (Chorba, Chorba, Bouillon,
Overmyer & Landis, 2010; Kiesel et al., 2007; Peate, Bates, Lunda, Francis & Bellamy,
2007) for the identification of injury risk and has been used on a variety of active
populations (i.e., firefighters, collegiate athletes, military officer candidates). It provides
observable data of an individual’s movement patterns where compensatory motions exist
to mask current limitations. Previous literature has attempted to find a relationship
between FMS™ and athletic performance; however, these papers were unsuccessful
(Okada, Huxel & Nesser, 2011; Parchmann & McBride, 2011). In the studies that
attempted to show a relationship between functional movement and athletic performance,
the 21-point scale was used to score all seven tests. Despite the varying movement
complexities, each of the movement tests was scored out of the same total number of
points. By treating each test similarly, the 21-point scale may limit the precision of the
FMS™ as it serves to identify large movement limitations. Improved specificity of the
scoring system used with the FMS™ may provide a more precise relationship between
movement and athletic performance.
3
One way that the scoring of the FMS™ has become more precise is through the
use of a 100-point scale. The 100-point scoring method, originally described by Butler et
al. (2012), was developed to add precision to the scoring method of the movements and
sensitivity to the measurement scale by allotting a greater total point value to more
complex movements. As a result, the total aggregate score increased from 21-points to
100-points (Butler et al., 2012). In Butler et al. (2012), the reliability of the 100-point
scale was shown to be strong between raters (ICC = 0.99). Therefore, both the 21-point
and the 100-point scales of measurement for the FMS™ each have high interrater
reliability (Butler et al., 2012). Butler et al. (2012) also suggested that through further
research using a more precise method of scoring the FMS™ that a relationship between
one’s functional movement and athletic performance could be established.
A variety of athletic performance measures have been compared to the FMS™
without successful findings of a positive relationship (Okada et al., 2011; Parchmann &
McBride, 2011). These performance measures were brought out through a series of tests
assessing flexibility, power, strength and speed. Power, strength and speed have been
shown to be variables of interest as each element translates well into many sport-specific
tasks (Lees, Vanrenterghem, & De Clercq, 2004; Luebbers et al., 2003; Moran and
Wallace, 2007; Salles et al., 2011; Vanrenterghem et al., 2008). Field tests, such as a
vertical jump, can be used to assess athletic performance by quantifying many variables
that translate well to sport (Aragón-Vargas, 2000; Cronin & Hansen, 2005; Luebbers et
al., 2003). More specifically, countermovement jump (CMJ) testing, a method of vertical
jumping, demonstrates the explosive power that can be generated by the lower extremity
muscles during sport tasks that also requires rapid development of strength and power

4
(Domire & Challis, 2007; Hartmann et al., 2012; Vanezis & Lees, 2005). Methods of
jump height measurement exist as ways to quantify the power generated by the lower
extremity. Of the methods available, the MyoTest Sport Unit will be used for this study
as it is both a valid and reliable method of measuring jump height (Bubanj, Stankovic,
Bubanj, Bojic, Dindic, & Dimic, 2010; Casartelli, Mueller, & Maffiuletti, 2010; Nuzzo et
al., 2011).
The use of the FMS™ is well-documented as a pre-participation risk assessment
tool; yet, previous findings have been unable to find a relationship between functional
movement ability and athletic performance tasks (Okada et al., 2011; Parchmann &
McBride, 2011). This review suggests that the FMS™ may be related to
countermovement jump performance when scored on a scale that provides a greater
amount of detail from the tests. The ensuing results may provide evidence toward a
relationship between functional movement capacity and functional performance.
Purpose
The primary purpose of this study was to examine the relationship between the
FMS™ total score, scored on a 100-point and 21-point scale, and CMJ height. The
secondary purpose of the study was to perform an exploratory analysis examining the
relationship of the 21-point live scoring method and the 21-point video scoring method of
the FMS™.
Hypotheses
A 21-point scale does not provide enough detail on various physiological and
biomechanical measures that would contribute to underlying performance; however, the
100-point scoring scale for the FMS™ has a higher degree of precision to evaluate a

5
participant’s movement patterns in more detail. It was hypothesized that those who
perform better on the FMS™, when scored on a 100-point scale, will demonstrate a
positive relationship with countermovement jump height. It was also hypothesized that a
relationship exists between the scoring scales of the FMS™ (i.e., 21-point live, 21-point
video, 100-point).
Significance
Scientific significance. This study offers scientific significance as it was the first
study to test the possible relationship between functional movement, measured by the
FMS™ on a 100-point scale, and functional performance (i.e., CMJ peak height). The
MyoTest SPORT unit was used to determine CMJ performance so that the influence that
functional movement has on peak height could be evaluated. Additional significance can
be taken from this study as it offered a comparison of two methods of scoring the FMS™
21-point scales. If the two methods are significantly correlated to one another, FMS™
scoring on a 21-point scale could be compared despite different methods of tests
evaluation.
Practical significance. This study was the first to delve into the relationship
between functional movement, which is defined as the total FMS™ score, and functional
performance, defined as CMJ height. This study provides a contribution to a current gap
in the literature, by attempting to understand how performance markers could be
influenced by one’s ability to move. The results of this study may shed light on how
athletes who have greater amounts of mobility and dynamic stability, as well as fewer
compensatory movement patterns, may be better performers in a jumping task. A
relationship already exists between functional movement and injury risk assists. If a

6
relationship is found between the FMS™ and a functional performance task (i.e., CMJ
height), a case could be made that a relationship may exist between injury risk and
athletic performance. This potential relationship would suggest that someone that has
greater movement ability will not only perform better in an explosive movement task, but
will also be less likely to sustain an injury during their performance. Significance may
also be found by comparing two methods of scoring the 21-point scale. A comparison of
the two scoring methods, live and video assessment, was examined to determine the
reliability of the compared methods. If a relationship is found between each of the
methods of scoring, practitioners and clinicians using the FMS™ will be able to use live
and post hoc video analysis interchangeably.
Delimitations
The delimitations of this study were put in place to reduce the influence of factors
(i.e., injury history, gender, age, physical activity level, body mass index, FMS™
experience) that may influence an individual’s performance in both FMS™ and CMJ
testing. In an attempt to reduce injury risk during data collection, all participants that had
recently had an injury, surgery, or bone abnormalities (i.e., of the shoulder, hip, knee,
and/ or the ankle), were currently taking medication for illness, had a heart condition and/
or chest pain, suffered from dizziness, and/ or had a hearing impairment (due to the need
to hear the auditory stimulus from the MyoTest), were not be allowed to participate in
this study. Another variable that was being controlled was gender. Only male
participants were evaluated in this study in an attempt to build on the previous primary
research that has used the FMS™ (Frost, Beach, Callaghan, & McGill, 2012; Goss,
Christopher, Faulk, & Moore, 2009; Kiesel et al., 2007; Kiesel, Plisky, & Butler, 2011;

7
O’Connor et al., 2011). In addition, while evidence demonstrates a lack of significant
difference between males and females in total aggregate FMS™ score on a 21-point
scale, differences existed within the individual component test scores that make up the
total FMS™ score (Schneiders, Davidsson, Hörman, & Sullivan, 2011). Since the
FMS™ scored on a 100-point scale does not have identical total scores for each of the
tests and allows for a wider range of achievable points, it is possible that the individual
test score differences may become more prominent through the use of a more precise
scoring method; therefore, only males were be recruited for this study. Age was also a
potential influencing factor to an individual’s FMS™ and CMJ performance. To remain
consistent with the age range of populations used in the current literature, all participants
were between the ages of 18-30 years old (Butler et al., 2010; Chorba et al., 2010; Frost
et al., 2012; Goss et al., 2009; Onate et al., 2012). Age can have additional effects on
performance. Evidence exists to support age-related tendon degeneration as early as 30
years of age (Bosco & Komi, 1980). Furthermore, to reduce the influence that training
had on jump height, only participants that self-identified as exercising at least to the
American College of Sports Medicine (ACSM) guidelines were included in this study.
Athletes and those currently participating in organized training to actively improve their
vertical jump performance were excluded. Lastly, those who have had previous
experience with the FMS™ were excluded from this study in an attempt to control for the
learning effect that one may have from previous experience with the component tests. By
following this set of inclusion criteria, the results of this study are not generalizable
beyond those who do not fit the populous examined; therefore, further research in this
area is needed in order to make more global conclusions.

8
Assumptions
This study made the following assumptions: (a) participants answered the
Inclusion Criteria and the Exercise History Questionnaire honestly; (b) participants met
the minimum weekly requirement of physical activity, as set by the ACSM guidelines, (c)
participants refrained from smoking (or the use of any tobacco products) and the intake of
caffeine within the four hours prior to testing, and heavy resistance exercise in the 24-48
hours that separate the two days of testing; (d) participants performed a maximum effort
jump for each of the CMJ trials; and (e) perform the FMS™ to their best ability.
Limitations
Major limitations of this study included possible experimenter and equipment
error. Experimenter error may have resulted from the subjective interpretation that is
involved with scoring the FMS™ as well as errors in the measurement of the
anthropometric data. Anthropometric errors may influence the equipment used to
determine jump height. The MyoTest accelerometer measured jump height through a
programmed equation that takes the participant’s weight into account when determining
flight time.

9
CHAPTER II: LITERATURE REVIEW
Introduction
Active populations such as athletes, both professional and tactical, make use of
injury risk and athletic performance field tests (Cook et al., 2006a; Cook et al., 2006b).
Performance testing and injury risk assessment testing are used to establish baseline
performance levels and measure the effectiveness of training (Kiesel et al., 2007; Minick
et al., 2010). Such information may be useful in research and clinical settings to improve
the performance of participants, clients, and patients during exercise. Despite the
prevalence of each of these tests, a gap exists in the current literature as to how with the
FMS™ total score relates with athletic performance.
One test that is used to assess an individual’s injury risk is the Functional
Movement Screen™ (FMS™). The FMS™ is a reliable tool used for identifying injury
risk and has been used in a variety of active populations (i.e., firefighters, collegiate
athletes, military officer candidates) (Chorba et al., 2010; Kiesel et al., 2007; Peate et al.,
2007). This pre-participation screen grades individual’s on their movement patterns and
compensatory motions that exist due to functional limitations (Cook et al., 2006a).
Previous literature has attempted to find a relationship between the FMS™ and athletic
performance (Okada et al., 2011; Parchmann & McBride, 2011). These papers used the
21-point scale to score each of the functional movement tests. Despite a variety of
athletic performance tasks, there were no significant relationships made between the total
FMS™ score and any athletic performance measures. It is possible that the 21-point
scale lacks the precision to distinguish a relationship between FMS™ score and athletic
performance as all seven tests are scored equally despite representing varying levels of

10
complexity across the tests (Butler et al., 2012; Frost et al., 2012). This review will
describe a FMS™ scale that has a greater amount of precision with an attempt to 100-
point scale of measurement.
One commonly used measure of athletic performance that demonstrates a
representation of power, strength and speed is vertical jump testing (Aragon-Vargas,
2000; Luebbers et al., 2003). For this review, sport performance is defined as mean jump
height and will be further elaborated upon in this study. Specifically, this review will
focus on a countermovement jump (CMJ) as a sport performance. The use of a CMJ test
during pre-participation screening provides insight to performance variables that are
transferrable to sport such as power, strength and speed (Cronin & Hansen, 2005;
Vanezis & Lees, 2005). Performance on CMJ is indicative of the explosive power that
can be generated during a rapid full body movement (Domire & Challis, 2007; Hartmann
et al., 2012; Vanezis & Lees, 2005). It is proposed in this study that an individual’s
ability to jump is influenced by their ability to move. The current literature has not
successfully shown a relationship between functional movement (i.e., FMS™) and
functional performance (i.e., CMJ). It is possible that this lack of a relationship is due the
over-simplified 21-point scale of measurement for the movement tests and that a more
precise method of measurement is needed to identify movement deficiencies that
influence athletic performance. This review will provide evidence toward the possible
relationship between the FMS™, assessed on a 100-point scale, and CMJ height.
The Functional Movement Screen™
Traditionally, prior to the participation in athletics, athletes and exercisers have
undergone pre-training physicals and performance assessments (Cook et al., 2006a).
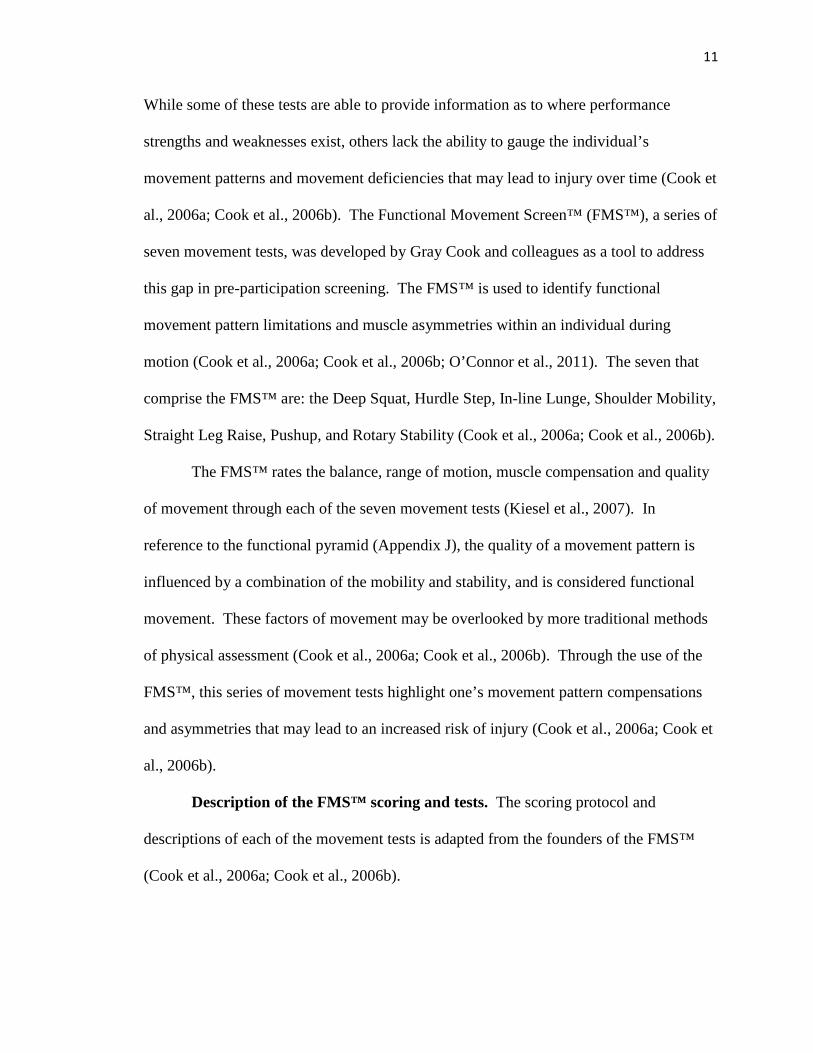
11
While some of these tests are able to provide information as to where performance
strengths and weaknesses exist, others lack the ability to gauge the individual’s
movement patterns and movement deficiencies that may lead to injury over time (Cook et
al., 2006a; Cook et al., 2006b). The Functional Movement Screen™ (FMS™), a series of
seven movement tests, was developed by Gray Cook and colleagues as a tool to address
this gap in pre-participation screening. The FMS™ is used to identify functional
movement pattern limitations and muscle asymmetries within an individual during
motion (Cook et al., 2006a; Cook et al., 2006b; O’Connor et al., 2011). The seven that
comprise the FMS™ are: the Deep Squat, Hurdle Step, In-line Lunge, Shoulder Mobility,
Straight Leg Raise, Pushup, and Rotary Stability (Cook et al., 2006a; Cook et al., 2006b).
The FMS™ rates the balance, range of motion, muscle compensation and quality
of movement through each of the seven movement tests (Kiesel et al., 2007). In
reference to the functional pyramid (Appendix J), the quality of a movement pattern is
influenced by a combination of the mobility and stability, and is considered functional
movement. These factors of movement may be overlooked by more traditional methods
of physical assessment (Cook et al., 2006a; Cook et al., 2006b). Through the use of the
FMS™, this series of movement tests highlight one’s movement pattern compensations
and asymmetries that may lead to an increased risk of injury (Cook et al., 2006a; Cook et
al., 2006b).
Description of the FMS™ scoring and tests. The scoring protocol and
descriptions of each of the movement tests is adapted from the founders of the FMS™
(Cook et al., 2006a; Cook et al., 2006b).
12
Scoring. The scoring method that was originally developed for the FMS™ was a
live, in real time scoring of the seven tests, 21-point scale. Each of the seven tests is
scored on a subset of a zero to three points, where a score of three is deemed a maximum
score. A score of three is given to an individual that performs the correct movement
pattern without asymmetries or compensations. A score of two is given when an
individual performs the correct movement pattern(s) with the recruitment of at least one
compensation or asymmetry. A score of one is given when the individual cannot achieve
the proper movement pattern despite the recruitment of compensatory movements, but
doesn’t experience any pain through the range of motion. If during any of the
movements pain is experienced by the participant, the resulting score is a zero (Cook et
al., 2006a; Cook et al., 2006b). The seven tests that comprise the FMS™ are the Deep
Squat, Hurdle Step, In-line Lunge, Shoulder Mobility, Active Straight Leg Raise, Trunk
Stability Push Up, and Rotary Stability (Cook et al., 2006a; Cook et al., 2006b).
Deep squat. The Deep Squat test is performed to lowest depth without pain with
a dowel overhead. To begin the test, the individual stands straight with their feet
shoulder width apart, toes facing forward. From this position, the dowel is extended
overhead so that the arms and back are straight. Next, the individual squats to their
lowest depth without pain, while attempting to maintain their arms overhead, a straight
back that is parallel to the tibia, and the knees behind the toes. Throughout the test, the
individual should remain with their feet fully on the ground. The test consists of five
slow and controlled squats with the rater assessing their movements from their front, side,
and back before proceeding to the next motion.

13
Impairments that can be identified from the Deep Squat include limited hip, trunk,
and shoulder mobility, poor hip, knee, and ankle flexion, and low stability. In the event
that an individual is not able to elicit the targeted motion during the Deep Squat, the
FMS™ board is placed under the heels, with the toes on the ground, to adjust the initial
position of the Deep Squat. By doing so, less ankle dorsiflexion is required to squat to a
greater depth. The individual would repeat the movement up to five times before moving
to the next motion.
Hurdle step. The Hurdle Step is performed with a dowel across the shoulders,
parallel to the ground, as the individual steps over hurdle. To start the test, the height of
the individual’s tibial tuberosity is taken to set the height of a rubber strap; this strap is
used as the crossbar of the hurdle and is adjusted to standardize for the height of the
individual. The test begins with the dowel laid across the shoulders behind the head and
the individual’s feet together, behind the hurdle with the toes in contact with the base.
The individual is then instructed to raise a foot off the ground and reach it over the hurdle
so that they can lightly tap their heel to the ground on the opposite side of the hurdle.
They are not allowed to look down at the rubber strap nor may they shift their weight
forward onto the lead heel. They are then instructed to bring their foot back over the
hurdle to the initial position.
Impairments from the Hurdle Step that may be found may result from poor
movement patterns opposed to a single limb’s movements. Poor bilateral, asymmetric
hip stability and dynamic stability as well as poor single-limb stance are major
contributing factors to decreased performance on the Hurdle Step test. The Hurdle Step

14
also assesses both the left and the right side separately, providing a left-right comparison
that identifies asymmetrical movement patterns within the movement pattern.
In-line Lunge. The In-line Lunge is a controlled lowering task that requires
spinal and pelvic stability while the upper body maintains a neutral position, with respect
to the lower body. To begin this test, the height of the tibial tuberosity is measured. The
individual begins in the stride position with one foot behind the start line on the FMS™
board, and the other foot is standing firmly on the FMS™ board. The distance between
the start line and the heel of the lead foot should be equal to the length of the tibial
tuberosity. The arm positioning is in a reciprocal pattern to the leg position. With a
dowel positioned in parallel with the individual’s spine, one arm is raised overhead to
grasp the dowel near the neck while the other arm reaches behind the back near the
lumbar spine to hold the dowel near the small of the back. The individual is then
instructed to lunge forward so that the rear knee makes contact with the lead heel and
board, while maintaining a straight back and with the dowel in contact with the lumbar
spine, between the shoulder blades, and the back of the head. These three points help the
observer gauge how well the participant is able to limit the lunging movement to the
sagittal plane.
Impairments that are observed during the In-line Lunge may relate to ankle, knee,
or hip mobility, trunk flexibility, and dynamic stability on a small base of support.
Deficiencies may result in a forward lean of the torso, a rise in the heels off the board, or
a compensatory twist in the trunk to assist the contact of the rear knee and lead heel. The
In-line Lunge is another test where both the left and right side are assessed independently
for asymmetrical movement patterns.

15
Shoulder Mobility. The Shoulder Mobility test is used to assess the relationship
between the spine and shoulders during a reciprocal arm motion. Prior to the start of the
Shoulder Mobility test, a clearance test is performed to identify pain in the joint that is
otherwise missed during the screen movement. For this test, the hand is raised to the
opposite shoulder so that the palm comes in contact with the shoulder near the clavicle.
The elbow is then raised so that it points forward while keeping the palm in contact with
the shoulder. If no pain is felt, a (-) is marked and the participant is allowed to perform
the Shoulder Mobility test. If pain is felt, however, a (+) is marked next to Shoulder
Mobility, and the individual receives a zero. The participant skips the Shoulder Mobility
test and proceeds to the next test.
To begin the Shoulder Mobility test, the individual’s hand must be measured as
the length of the hand is used as the landmark for flexibility. The measurement is taken
from the most distal crease of the wrist to the tip of the middle finger. With the feet
positioned together and an erect posture, the individual makes fists by wrapping their
fingers around their thumbs. In one smooth motion, the arms move in unison. The
participant will reach each hand, as a fist, toward the center of the back, one over the top
and one underneath, to bring them as close together as possible in one fluid motion. The
goal of this test is to have the measured distance less than or equal to the length of the
hand. This test is repeated up to five times for each side.
Factors that may affect an individual’s performance on the Shoulder Mobility test
include shoulder and trunk mobility as well as postural and core stability. A lack in any
of these areas will increase the distance measured between the two fists. Additionally,
16
overdevelopment of the abdominals and chest muscles may exhibit as a rounding of the
shoulders that decreases the mobility of the glenohumeral joint.
Active Straight Leg Raise. The Active Straight Leg Raise is a movement that
assesses the amount of flexibility the individual has in their legs when the legs are
separated in an unloaded position. To begin the test, the individual will lay supine with
the palms up and the FMS™ placed underneath the knees. The dowel is positioned
vertically between the anterior superior iliac spine and the joint line of the knee. While
keeping the feet at a 90° angle, one leg is raised off the ground while the other leg
remains flat on the floor. At the leg’s peak position, the malleolus position with respect
to the dowel is assessed and scored appropriately. The goal of this test is to have the
malleolus at least reach the position of the dowel. This test is repeated a maximum of
five times before assessing the opposite side. This test assesses each side of the body
independently to provide a left-right comparison of the scores.
Limitations that are found during the Active Straight Leg Raise result from poor
flexibility of the gluteal muscles, hamstrings, and iliotibial band, poor core stability, and
limited extension of the opposite hip. In the event that the individual has movement
limitations that do not allow for the malleolus to surpass the dowel, the dowel is placed
on the superior side of the board, just above the knee, and the Active Straight Leg Raise
is repeated. If the malleolus still cannot pass the dowel, the dowel is repositioned to the
inferior portion of the board. The test is then repeated.
Trunk Stability Push Up. This test assesses core stability more than upper body
strength. This test begins with a clearance test to protect the participant from painful
motions. This clearance test is similar to the cobra stretch. Prone on the ground with

17
their legs together and palms flat on the mat, the individual then pushes the upper body
up into a spinal extension bringing the head toward the ceiling. If pain is recorded, a (+)
is marked for the Trunk Stability Push Up and the test is scored as a zero. The Trunk
Stability Push Up is then skipped and the participant proceeds to the next test.
The Trunk Stability Push Up test is similar to a standard push up except for a
modification to the placement of the hands. The participant will begin this test prone on
the ground with the legs and feet extended together and the hands on the ground with
fanned fingers. Men will begin with their thumbs in line with their forehead and women
will begin with their thumbs in line with their chin. Next, the individual will position the
toes into the ground, raising the legs and hips off the ground. When instructed, the
individual will push into the ground and raise the shoulders and back in one motion. This
test is done to a maximum of three times.
Poor performance on the Trunk Stability Push Up may result from poor
stabilization of the core muscles, insufficient upper body strength and/ or scapular
stability, and reduced hip and thoracic spine stability. As a result of such insufficiencies,
the shoulders and back will not rise in unison. If the individual is not able to lift their
body as a single entity, the hand placement can be adjusted lower, closer to standard push
up position. For men, the hand placement would be lowered to the chin, and women’s
hands would be lowered to the clavicle.
Rotary Stability. The Rotary Stability test is a coordination test that assesses the
individual’s ability to maintain core stability in the quadruped position. A clearance test
is performed prior to the beginning of this test to identify pain that the participant may
have. From the quadruped position, the individual would flex the neck bringing the head

18
to the chest while simultaneously arching the back. If pain is observed, a (+) is marked
for the Rotary Stability test and a zero is recorded for the score. If no pain is observed, a
(-) is marked and the participant proceeds with the Rotary Stability test.
To begin the test, the FMS™ board is positioned underneath and in parallel with
the individual’s spine so the hands and knees are on the ground on either side and in
contact with the board, while in the quadruped position. The test requires the individual
to raise their ipsilateral hand and knee so that the raised elbow and knee can make
contact, above the ground, before the hand and knee return back to the initial position.
Factors that may limit one’s performance on the Rotary Stability test include
reduced shoulder, spine, hip, and knee mobility, poor scapular and hip stability, and
reflexive stability of the trunk and core muscles. These deficiencies result in a rounding
of the hips and shoulders as the individual attempts to touch elbow to knee without
falling. If compensations are observed due to the above deficiencies, the test can be
modified to a diagonal motion of opposite shoulder and hip motion, which result in
contact between the knee and the elbow over the board.
FMS™ populations. While the use of the FMS™ is still in its relative infancy, it
has thus far been used on a variety of populations. In particular, the 21-point FMS™ has
been used to assess risk of injury (Chorba et al., 2010; Goss et al., 2009; Kiesel et al.,
2007; Kiesel et al., 2011; O’Connor et al., 2011; Peate et al., 2007) as well as the
effectiveness of training interventions (Frost et al., 2012). Populations of interest
included female volleyball, basketball, and soccer players (Chorba et al., 2010), male and
female firefighters (Frost et al., 2012; Peate et al., 2007), male and female Special
Operations Soldiers (Goss et al., 2009), male American football players (Kiesel et al.,

19
2007; Kiesel et al., 2011), male Marine officer candidates (O’Connor et al., 2011), and
collegiate male and female golfers (Parchmann & McBride, 2011).
Gender. The FMS™ has been used on many different active populations; the
populations, while predominantly male, have included both genders. In an effort to
determine gender differences in FMS™ testing, a study was designed to establish
normative values for both males and females in the FMS™ using the 21-point scale
(Schneiders et al., 2011). No significant differences were observed between genders and
FMS™ total score (males x̄ = 15.8 ± 1.8; females x̄ = 15.6 ± 2.0) leading the researchers
to the conclusion that the FMS™ can be used on mixed-gender populations effectively
(Schneiders et al., 2011). Despite the lack of significant differences between the genders
in the total score, significant differences were observed within the FMS™ comparing the
individual component test scores between genders (Schneiders et al., 2011). In particular,
females performed significantly better than males on the shoulder mobility test (χ2 =
17.238, p = 0.001) and the Active Straight Leg Raise (χ2 = 42.097, p < 0.001).
Subsequently, males significantly outperformed females on the Trunk Stability Push Up
(χ2 = 64.475, p < 0.001) and the Rotary Stability test (χ2 = 7.230, p = 0.027) (Schneiders
et al., 2011). This may have occurred as some of the tests rely more heavily on either
strength or flexibility; both strength and flexibility are variables that are not congruent for
males and females (Kibler, Chandler & Maddux, 1989). Males scored better on the
Trunk Stability Push Up and the Rotary Stability tests; females in the study scored better
on the Active Straight Leg Raise and Shoulder Mobility tests (Schneiders et al., 2011).
The Trunk Stability Push Up and the Rotary Stability test are representational of
gender differences in muscular strength (Schneiders et al., 2011). Each of these tests
20
require adequate stabilizing strength of the trunk with concomitant motion in either the
upper and/or lower extremity (Cook et al., 2006b). Kibler and colleagues supported this
idea by examining the gender differences for flexibility and strength tests. Females
demonstrated greater flexibility than males while males exhibited greater muscular
strength than females (Kibler et al., 1989). These muscular strength differences may
provide further evidence to the scoring differences observed by Schneiders and
colleagues (2011) on the FMS™ trunk and Rotary Stability tests between males and
females.
The Active Straight Leg Raise and Shoulder Mobility tests differences may also
result from innate gender differences in flexibility. In Kibler et al. (1989), of the
participants examined (n=2107), females were significantly more flexible than males.
These observed differences in flexibility may have influenced the results observed by
Schneiders and others (2011). Females were observed to have higher scores on the
Active Straight Leg Raise and Shoulder Mobility tests than males. Both of these tests are
designed to test the active functional range of motion that an individual has in their
hamstrings and shoulder complex, respectively. With a greater amount of flexibility the
resulting component score for the FMS™ was better (Cook et al., 2006b). Gender
differences may support the findings that females scored better on flexibility FMS™ tests
than males (Schneiders et al., 2011).
Aggregate FMS™ scores on a 21-point scale can be compared with mixed gender
populations. However, due to gender differences in muscular strength and flexibility, the
ability to compare individual component scores of the FMS™ is limited. As a result,
researchers and clinicians whom utilize the FMS™ for assessing injury risk are restricted
21
to comparing homogeneous gender groups. In order to prevent gender differences from
influencing the relationship between functional movement and functional performance,
only males will be allowed to participate in this study.
Injury identification. The FMS™ was originally developed as a tool to screen
active populations and assess risk for injury by evaluating a series of functional
movement patterns prior to participation in sport (Cook et al., 2006a). At the time of its
inception, a standardized test to evaluate injury risk in active populations had not been
developed. The FMS™ was designed to challenge the functional movement of the
kinetic chain as well as proprioceptive function and assess the interaction between the
mobility and stability of the individual (Chorba et al., 2011; Cook et al., 2006a; Cook et
al., 2006b). The 21-point FMS™ scoring method has shown that a significant correlation
exists between 21-point total score and injury risk in active populations (r = -.7676)
(Chorba et al., 2010). Therefore, those that have a lower FMS™ score are at a higher risk
of injury due to the limitations observed within the functional movement patterns.
Further research took a more in-depth look at the relationship between the FMS™ score
and injury risk which resulted in the development of an athletic cut-off score (Kiesel et
al., 2007).
Cut-off score. In an effort to find the relationship between FMS™ and injury,
Kiesel et al. (2007) used the FMS™ as a preseason screening tool with a professional
American football team. Although a cause-effect relationship wasn’t established, a cut-
off score for athletic clearance for sport participation was identified. Based on the
FMS™ total score, professional football athletes who scored less than or equal to 14 on
the FMS™ were 11 times more likely to suffer a serious injury during the season

22
opposed to players that scored greater than a 14 (Kiesel et al., 2007). Serious injury was
defined as an injury that relegated the athlete to the injured-reserve for a minimum three
weeks. Of the professional athletes used, the odds ratio formulated from the results
presented a 15% probability of an injury with an FMS™ score above 14. However,
football players that scored a 14 or below had an elevated probability (51%) of suffering
a time-loss injury. The idea of a cut-off score was further corroborated in additional
research (Chorba et al., 2010; O’Connor et al., 2011).
In order to determine if the presence of compensatory movements within a given
movement pattern was related to injury risk, the FMS™ was used in a population of
female Division One athletes (n=38) (Chorba et al., 2011). The FMS™ was used as a
tool to identify movement compensations. Of the athletes that scored a total of 14 or less
on the 21-point scale, 69% suffered an injury and had a 4-fold increase in injury risk
(Chorba et al., 2011). These findings supported the cut-off score originally discovered by
Kiesel et al. (2007), despite the differences in the activity and gender of the population
recruited.
The existence of a cut-off score was further supported in O’Connor et al. (2011).
A population of male Marine officer candidates (n = 874) were pre-screened with the
FMS™ prior to inclusion in either a short cycle (six week) or long cycle (ten week)
training interventions. Those that scored 14 or less on the FMS™ 21-point scale had a
1.91 times (95% confidence interval (CI) = 1.21–3.01, P < 0.01) higher any injury
incidence rate compared with a score > 14. When both the short and long cycles of
training were combined, the relative risk of injury in an officer candidate was 150%
23
greater in those with an FMS™ ≤ 14 compared to those with a total score > 14
(O’Connor et al., 2011).
The FMS™ cut-off score provides a relative baseline for inclusion in an athletic
activity for both competitive and tactical athletes. However, the FMS™ is a tool that is
subjectively scored following a previously established set of criteria formatted by the
founders of the FMS™. The reliability of the testers to properly evaluate each movement
may limit the utility of the FMS™ if the reliability between raters or subsequent tests is
poor.
Reliability of the Functional Movement Screen™. The FMS™ can be used to
risk stratify athletes based on the aggregate score that is scored based on their functional
movement patterns (Chorba et al., 2011; Kiesel et al., 2007; O’Connor et al., 2011). The
scoring system for the FMS™, while directed by guidelines of the testing protocol, may
be subject to the training level and interpretation of the rater (Minick et al., 2010; Onate
et al., 2012; Teyhen et al., 2012). Although the movement tests follow preset guidelines,
raters subjectively score the movement patterns (Teyhen et al., 2012). Due to the
subjective nature of the scoring system, confirmation of the reliability of the FMS™ was
needed for the findings to hold value to further populations. Previous reliability studies
have supported the levels of reliability that exist within raters and between sessions for
the FMS™ (Gribble, Brigle, Pietrosimone, Pfile, & Webster, 2013; Minick et al., 2010;
Onate et al., 2012; Smith, Chimera, Wright, & Warren, 2013; Teyhen et al., 2012).
Interrater reliability is a method of determining the consistency of scoring
between different raters. Onate et al. (2012) examined the interrater reliability of raters
using a population (n = 19) of physically active men and women that were scored by two

24
raters; one was a FMS™-certified rater while the other was not. Onate et al. (2012)
confirmed that the FMS™ was highly reliable test (ICC of 0.98 (κ = 0.25)) when scored
by raters with differing levels of experience (Onate et al., 2012). While Onate and
colleagues used a small population of raters to compare (n = 2), strong reliability was
shown between raters for six of the seven tests. The results were surprising as one of the
raters had no experience using the FMS™. It may be concluded from these results that
those familiar with varying exercise movement patterns will be able to score a FMS™
similar to a scorer that is certified.
In addition to the reliability between those with and without FMS™ certifications,
interrater reliability has also been examined comparing novice and expert level raters.
Minick et al. (2010) described novice raters as FMS™-certified raters with less than one
year of testing experience. Expert raters were defined as having more than 10 years of
testing experience. In order to examine the reliability of the FMS™, both novice and
expert level raters viewed video footage of 40 healthy males performing the seven tests of
the FMS™ (Minick et al., 2010). The seven tests were divided into 17 components; both
the right and the left side of the test were treated as an independent component.
Substantial to excellent agreement (κ = 0.69-1.00) was found between the novice raters
on 14 of the 17 tests. Additionally, substantial to excellent agreement (κ = 0.60-0.95)
was recorded on 13 of the 17 components between the expert raters. Further analysis was
done to measure the amount of agreement in scoring between the novice and the expert
raters. Substantial to excellent agreement was seen for all 17 components tested (κ =
0.74-1.00). When the standard FMS™ testing procedure is used, the reliability of the
scoring mechanism is strong (Minick et al., 2010).
25
The interrater and intrarater reliability of the FMS™ were further examined in
Teyhen et al. (2012). Using a population (n = 64) of armed service workers, the seven
FMS™ tests were scored by eight novice raters. Testing sessions were separated by 48-
72 hours. Interrater reliability was examined by comparing the scores that any two
testers had for a particular participant. The interrater reliability was identified as
moderate to excellent by weighted Kappa values (κw ≥ 60%) on six of the seven tests
(Teyhen et al., 2012). The In-line Lunge (ILL) test was not included among the tests that
had moderate to excellent Kappa values suggesting that there is enough variability within
the ILL to raise concerns about the reliability of this component (Teyhen et al., 2012).
Intrarater reliability was established through the comparison of the scores of the raters
between the first and the second test day. The standard error of the measurement for both
the interrater and intrarater reliability was less than one point for a 21-point scale, while
the minimal detectable change ranged between 2.1-2.5 points on the 21-point scale
(Teyhen et al., 2012).
The FMS™ can be a reliable method of assessing injury risk in participants, both
within and between raters. Despite the precision that raters have while reviewing each of
the movements, the FMS™ on a 21-point scale is limited to observing to detecting large
movement limitations (Butler et al., 2012). In response to the lack of specificity, a more
precise method of measurement was developed; this method was the 100-point scale.
The 100-point scale. As an injury risk assessment tool, the FMS™ was designed
to examine how an individual moves through large gross movement task as a means of
identifying dysfunctional movement patterns (Butler et al., 2012). While the live 21-
point scoring method is both a valid and reliable method of scoring the FMS™ (Minick

26
et al., 2010; Onate et al., 2012; Teyhen et al., 2012), it is a basic method that lacks the
precision to identify risk beyond large movement dysfunction (Butler et al., 2012). To
improve on the precision that is provided from the 21-point scale, the 100-point scale was
developed as an alternative form of scoring that provides more precision by itemizing
each movement and scoring bilateral movements separately by side.
Movement test itemization. The 100-point scale has improved precision over the
21-point by itemizing each test into varying point values (Butler et al., 2012). The
scoring rubric for the 100-point scale itemizes the individual components of each
movement test (i.e., upper torso is parallel with tibia or toward vertical; knees aligned
over feet; dowel aligned overhead) and provides a point value to each component.
Component itemization allows for a broader continuum of scores for each of the
movement tests and may provide a more in-depth interpretation of the total score beyond
a 0-3 ranking (Butler et al., 2012). Itemization may improve the sensitivity of the scoring
scale and may become a better reflection of the individual.
Unlike the 21-point scale, not all seven tests are worth an equal number of points
on the 100-point scale. The total score of each of the tests is based around the overall
complexity of the movements (Butler et al., 2012). The movement tests with a lower
complexity (i.e. Shoulder Mobility) are worth less total points than more complicated
movements (i.e., Deep Squat) on the 100-point scale (Butler et al., 2012).
Movement test tiers: Tier I. The lowest tier of test complexity consists of the
joint mobility tests (Butler et al., 2012). These tests, when compared to others, have least
amount of simultaneous stabilization. The Shoulder Mobility has a maximum score of 8
27
points, 4 for each side, and the Active Straight Leg Raise has a maximum of 10 points, 5
for each side (Butler et al., 2012).
Movement test tiers: Tier II. The mid-level of the FMS™ tests consists of the
core stability tests. These movement tests require stabilization of the trunk in succession
with an upper and/ or lower extremity movement(s). This tier includes both the Trunk
Stability Push Up and Rotary Stability; the maximum score for each of these tests is 12.
While the Trunk Stability Push Up is a whole body movement, the Rotary Stability is
bilateral which scores each side separately at 6 points per side (Butler et al., 2012).
Movement test tiers: Tier III. The highest tier of tests includes the Deep Squat,
the Hurdle Step and the In-line Lunge. Each of these tests requires multi-joint motion as
well as trunk stability over the course of the movement. The Deep Squat and the Hurdle
Step each have a maximum score of 18; the Hurdle Step is a bilateral test, where each
side has a maximum score of 9 points. The In-line Lunge is worth 20 points that are
divided into a score for each bilateral movement. This movement test is scored as the
most valuable because of the amount of eccentric control used during the flexion of the
lunge on a narrow base of support (Butler et al., 2012).
Bilateral test assessment. The 100-point scale adds further specificity to the
FMS™ by independently rating bilateral movements into separate scores (Butler et al.,
2012). In each of the five bilateral tests, both the right and the left side are given separate
scores. Once each side is rated, these scores are summed together to provide a total
component score for the given movement. The 100-point scale provides greater detail
assessing bilateral tasks as it highlights existing asymmetries that a participant has
between each side of a given movement (Butler et al., 2012).
28
Video analysis. In order to score the FMS™ with a more precise scale, video
analysis is recommended. Scoring of the FMS™ on the 100-point scale is done post hoc
by recording video footage of all seven tests and rating the movement tests (Butler et al.,
2012; Frost et al., 2012). Video camera position has been standardized in the
perpendicular and sagittal planes of the participant (Butler et al., 2012; Frost et al., 2012).
Scoring in such a way allows the rater to view each of the seven tests with a greater
amount of detail than the 21-point scale. While this is an advantage of the use of the 100-
point scale, it is also time intensive as it involves the FMS™ tests as well as the post hoc
scoring. For this reason, the use of the 100-point scale has been shown to be
disadvantageous in its use because of the time needed to be performed and scored (Butler
et al., 2012).
100-point reliability. Like the 21-point scale, the 100-point scale is scored
subjectively by the rater administering the FMS™. The 21-point scale has been shown to
have high validity and reliability between raters (Minick et al., 2010; Onate et al., 2012;
Teyhen et al., 2012). To determine the repeatability of the 100-point scale, the interrater
reliability of the 100-point scale was examined (Butler et al., 2012). Of the seven
movement tests, six of the movements had high interrater reliability (ICC = 0.98). The
In-line Lunge had an ICC of 0.98 or higher. The In-line Lunge on the left side was
slightly lower, however still highly reliable across the raters, with an ICC of 0.91 (Butler
et al., 2012). These ICC values showed high reliability for the 100-point scale as ICC
values greater than 0.8 are seen as near perfect agreements.
The 100-point scale was developed to further build upon the precision of the
FMS™. Movement itemization and independent bilateral scoring or movement test may

29
improve the interpretations for injury risk that are made from the total score by
identifying the limiting component of the most limited movement pattern (Butler et al.,
2012). These scoring modifications increase the precision of evaluating the FMS™ and
may assist in the development of a link between functional movement and functional
performance.
Functional Performance
The Functional Movement Screen™ provides clinicians and sports medicine
professionals some insight into the quality of the movement used by an individual. In
reference to the functional pyramid (Appendix J), functional movement is the base of an
individual’s movement and a combination of both mobility and stability. The conversion
of this functional motion into goal-orientated movement is considered functional
performance (Cook, 2010). An individual’s functional movement directly affects their
risk of injury as has been shown with the FMS™ (Chorba et al., 2011; Cook et al., 2006a;
Cook et al., 2006b). Functional movement may also affect an individual’s ability to
convert their available movement into a performance task.
Previous research has attempted to find a relationship between functional
movement and functional performance using the FMS™ and the 21-point scoring
method. In Parchmann and McBride (2011), 25 mixed-gender NCAA Division I golfers
were examined in both general athletic and specific performance measures (i.e., sprint
time, vertical jump height, T-test agility, and club head swing velocity) as well as
functional movement. Results indicated that there were no significant findings between
any of the general or sport-specific performance measures and the FMS™ (p > 0.05)
(Parchmann & McBride, 2011). This may be a result of the lack of precision from the

30
21-point FMS™ scoring method as it pertains to functional limitations that exist within
an individual.
Functional movement and functional performance were also compared in a review
by Okada and colleagues (2011). Participating individuals were measured on a 21-point
FMS™ scale and a variety of physical performance measures (i.e., backwards overhead
medicine ball throw (BOMB throw), single-leg squat and T-run agility test). While a few
individual tests of the FMS™ (Shoulder Mobility, Hurdle Step, and In-line Lunge) had
significant positive correlations with the BOMB throw, it was suggested that the total
score of the FMS™ was not effective in predicting athletic performance (Okada et al.,
2011). These results may also be due to the nature of the FMS™ 21-point scale as an
identifier of large movements. With the use of the 100-point scoring method, the
precision of the FMS™ may improve to identify a link between an individual’s
movement capacity and conversion of functional movement into functional performance.
Vertical jump performance. Functional performance may be limited by the
mobility and stability of an individual. Vertical jumping is an example of converting the
available functional movement that an individual has into a powerful functional task
(Cook, 2010). This athletic task provides measureable, transferrable elements of many
sports such as strength, speed, and power (Lees et al., 2004; Luebbers, Potteiger, Hulver,
Thyfault, Carper, & Lockwood, 2003; Moran & Wallace, 2007; Salles, Baltzopoulos, &
Rittweger, 2011; Vanrenterghem, Lees, & De Clercq, 2008). In particular, one method of
vertical jump that is used to measure the amount of power that can be produced by the
lower extremities, and mimics actions relevant to sport, is the counter movement jump
(CMJ) (Markovic, Dizdar, Jukic, & Cardinale, 2004; Vanezis & Lees, 2005). A CMJ is a

31
vertical jump that begins in the standing then lowered eccentrically into a squatted
position and followed by a concentric rising phase into take-off. The sport-specific
expression of power, strength and speed make CMJ testing a worthwhile approach for
measuring functional performance.
The use of a CMJ is not only useful as an expression of lower extremity power,
strength and speed, but it is also a reliable test to use across participants (Markovic et al.,
2004). In Markovic (2004), seven different explosive tests including five vertical
jumping tests and two horizontal jumping tests. Both the squat jump and the CMJ were
the most reliable (α = 0.97 and 0.98, respectively) of the power tests. Furthermore, the
CMJ had the greatest average intertrial correlation (AVR) and ICC among all jump tests
(0.94 and 0.98, respectively) (Markovic et al., 2004).
The motions used to execute a CMJ are similar to those in a variety of sports that
require power, strength and speed (Lees et al., 2004; Luebbers et al., 2003; Moran and
Wallace, 2007; Salles et al., 2011; Vanrenterghem et al., 2008) as well as reproducible
across participants (Markovic et al., 2004). In order to appropriately quantify CMJ trials
across participants, reliable methods of measurement are needed to ensure the reliability
of data for comparison.
Measurement. The peak heights of the CMJ tests can be measured in a variety of
methods. The use of these techniques are often dependent on the amount of available
space, finances, accuracy of measurements and the ease of transport of the testing device.
Often, the need for transport and cost limit the equipment that is used to measure the
height of a CMJ. The reliability of each testing method is compared to motion capture
32
analysis, the gold standard for measuring the height of a CMJ (Leard et al., 2007; Nuzzo,
Anning, & Scharfenberg, 2011).
The most accurate and valid way of measuring vertical jump height is with a
video motion capture system. It has been deemed the gold standard of vertical jump
measurement (Aragon-Vargas, 2000; Casartelli et al., 2010; Leard et al., 2007; Nuzzo et
al., 2011). Through the use of reflective markers, a motion capture system determines the
height of a jump by tracking the displacement of one’s center of gravity through the
phases of a vertical jump (Leard et al., 2007). While the motion capture system is
effective, it is costly, immovable and requires extensive calibration and training to
accurately measure jump heights (Casartelli et al., 2010; Leard et al., 2007; Nuzzo et al.,
2011).
Less costly methods of vertical jump measurement have been produced that have
improved the utility of the vertical jump test without sacrificing validity of the jump
height. Two of the more prevalent methods of vertical jump measurement are the Vertec
(Vertec, Sports Imports, Hillard, OH) and the MyoTest (Myotest Inc., Durango, CO)
systems. With the addition of being easily transported and relatively simple to use
(Bubanj et al., 2010; Casartelli et al., 2010; Leard et al., 2007; Nuzzo et al., 2011) both
the Vertec and MyoTest accurately measure jump height.
Vertec. The Vertec is one method of vertical jump measurement that is available
to be used in field testing. This system consists of an adjustable metal pole with plastic
swiveling panes, each representing a height increase of 0.0127 meters. Jump height is
determined through the subtraction of a standing, two-handed maximal vertical reach
height from the height of highest displaced pane’s height on the Vertec pole (Klavora,
33
2000 from Leard et al., 2007). Each of these heights is measured by counting the number
of displaced panes and adding it to the starting height of the Vertec pole. In a
comparative study, Leard and colleagues examined the accuracy of the Vertec test for
peak height as it related to the height recorded from a motion-capture system. The peak
height validity of the Vertec test was shown to have a strong correlation to the height
recorded by the motion-capture system (r = 0.906) (Leard et al., 2007) illustrating the
validity of jump height when measured by the Vertec measuring system.
Despite the measured jump height validity, the Vertec has less accuracy when
predicting jump height. One flaw of the Vertec measurement method that has been noted
was the significant difference in the measured height of jumps that were found in a
comparison of the Vertec and the motion capture system (Leard et al., 2007). The Vertec
method is also sensitive to the accuracies of the tester’s measurements (Leard et al., 2007;
Nuzzo et al., 2011). Both the standing, two-handed reaching height and the jumping
height are measured manually by the tester and are subject to errors in counting. Lastly,
the Vertec test is limited by the innate movement coordination pattern of the jump test.
In order for the Vertec to be an accurately measure jump height, the participant must
strike the panes of the Vertec pole at the peak of the jump. That is, after the complex
multi-joint movement of the vertical jump, the participant must swing their arms
vertically, while in flight, to the highest point and strike the panes to signify the apex of
the jump. The added arm swing may reduce the level of accuracy for measuring jump
height by increasing the level of difficulty of the technique needed. An added arm swing
may also decrease the accuracy of measurement as it requires adequate shoulder mobility
to swing, reach, and strike the panes of the (Leard et al., 2007; Nuzzo et al., 2011).
34
The use of the Vertec system for measuring jump height is a low cost method of
measuring the peak height of a vertical jump that is portable and gauges jump height
similarly to a 3-camera motion-capture system (Leard et al., 2007). While the validity of
this equipment is high when compared to a motion-capture system, there are other
devices that record jump heights more reliably between participants.
Myotest. In addition to the Vertec, the MyoTest is another cost-effective, portable
method of measuring jump height (Casartelli et al., 2010; Leard et al., 2007; Nuzzo et al.,
2011). The MyoTest SPORT unit (Myotest Inc., Durango, CO) is an accelerometer that
collects flight time and acceleration data used to calculate jump height. Peak heights are
measured through the recorded displacement height of the device during a jump. The
recorded accelerations are integrated to find vertical velocity by which the overall jump
height is estimated. Jump height is calculated through two methods (Casartelli et al.,
2010). The first method estimates peak height by interpreting flight time through the use
of the equation (Height = [g x flight time2]/8). The second method of calculating peak
height uses takeoff velocity through the use of the equation (Height = max vertical
velocity2/ [2 x g]) (Casartelli et al., 2010).
Evidence exists in the literature to support the test-retest reliability of the
MyoTest’s ability to estimate peak height (ICC = 0.92-0.96) (Bubanj et al., 2010;
Casartelli et al., 2010; Nuzzo et al., 2011). Nuzzo and colleagues (2011) examined three
methods of measurement for peak vertical jump height. Of the three methods, the
MyoTest was the most reliable with the lowest percent variation of the examined
methods (3.3%-3.9% opposed to 4.2%-5.5% for other methods) (Nuzzo et al., 2011).

35
The MyoTest is not without limitations that may restrict the measurement of a
true peak vertical jump height. The MyoTest equipment uses the acceleration of the
jump and the mass of the individual to determine jump height; therefore, the accuracy of
the mass entered into the MyoTest may compromise the reliability of the equipment
(Nuzzo et al., 2011). The mass values that are entered into the MyoTest increase in
increments of 0.2kg which may result in an over or underestimation of the individuals
mass. Furthermore, while the MyoTest is a highly valid and reliable method of
determining peak jump height, it has low validity in determining the velocity of a vertical
jump (Casartelli et al., 2010). It is possible that the MyoTest-measured velocity may be
invalid due to the timing of the measured maximal velocity. To calculate the overall
jump height, the MyoTest, while capable of identifying instants of takeoff and landing,
incorrectly uses the positive peak of the vertical velocity of the jump instead of the
velocity at takeoff (Casartelli et al., 2010).
Equipment summary. In order to compare jump heights within a sample, it is
necessary that the reliability of the measurement tool is high. The MyoTest Sport Unit is
a tool that is not only valid and reliable between trials for jump height, but is also an
accurate tool that compares well to the motion capture system. The jump measurement
equipment of choice for this study was the MyoTest Sport Unit.
Factors for successful vertical jumping. Successful performance of a vertical
jump requires the hips, knees, and ankles to generate a powerful movement in order to
reach a maximum height (Lees et al., 2004; Parchmann & McBride, 2011). The powerful
movement that is generated from the legs and hips may be dependent on multiple factors
that may affect the overall height of a vertical jump. The factors that will be discussed in
36
the following section that affect vertical jump performance, defined as jump height, in
this study will be squat depth, muscular stiffness, the stretch-shortening cycle, and jump
practice (Domire & Challis, 2007; Fukashiro, Hay and Nagano, 2006; Kubo et al., 1999;
Moran & Wallace, 2007).
Squat depth. The depth to which someone can squat depth may be a limiting
factor in one’s ability to achieve maximum jump performance (Domire & Challis, 2007;
Hartmann et al., 2012; Kubo et al., 1999; Moran & Wallace, 2007; Salles et al., 2011;
Vanrenterghem et al., 2008). Evidence is available in the literature to support the notion
that muscle length and flexibility of the muscles involved in squatting will affect the
depth of a squat and influence jump height. More specifically, the amount that a muscle
can lengthen during the eccentric phase of a CMJ influences the joint angle that is created
at the hip and knee (Domire & Challis, 2007; Salles et al., 2011). In a study that focused
on the influence of squat depth and its relationship to vertical jump height, it was stated
that the deeper a participant was able to squat in a CMJ, the higher the participants were
able to jump (Domire & Challis, 2007). By increasing the depth of the squat, the time
that the contributing muscles could generate force increased (Domire & Challis, 2007)
which may ultimately increase the peak height that is achieved in a vertical jump.
These findings were further corroborated in an intervention study using both deep
and quarter squats (Hartman et al., 2012). In Hartman and colleagues, after 10 weeks of
resistance training, 1-repetition maximum (1RM) improved angle specific strength for the
¼ squat group; however, no significant peak jump height changes or dynamic strength
changes were established (Hartman et al., 2012). Those that trained through a greater
range of motion were able to produce greater amounts of strength that could be converted
37
into a greater peak height during a CMJ (Hartmann et al., 2012). It can be demonstrated
that increases in the length of the muscle will allow a deeper squat in the eccentric
lowering portion of the vertical jump (Kubo et al., 1999; Moran & Wallace, 2007; Salles
et al., 2011; Vanrenterghem et al., 2008). Ultimately, a deeper squat may result in a
greater peak vertical jump.
Squat depth during a CMJ may also be affected by the flexibility of the muscles
involved with the extension of the hips, knees, and ankles (Domire & Challis, 2007; Kritz
et al., 2009; Moran & Wallace, 2007; Salles et al., 2011). A deeper squat requires a
greater angle of hip flexion and knee flexion (Domire & Challis, 2007; Kritz et al., 2009;
Moran & Wallace, 2007; Salles et al., 2011). Salles et al. (2011) examined squat depths
of 25°, 50°, 70°, and 90° of knee flexion and the effect that the squat depth had on
countermovement jumps height. Angles of knee flexion were used with respect to 0°
where 0° was defined as standing knee extension. The deeper countermovement jumps
resulted in higher recorded jumps (Salles et al., 2011). It was noted in this study that
increases in knee flexion increased the angle of hip flexion, the primary power source of
a vertical jump, and resulted in an increase in peak jump height. These findings were
further supported by Moran and Wallace (2007) whom examined three types of jump
(i.e., drop, countermovement, and squat) at both 70° and 90° of knee flexion. For each
type of jump used, greater heights were recorded when a greater amount of knee flexion
was utilized (Moran & Wallace, 2007).
Squat depth has been shown the influence the peak height achieved during jump
performance (cite). More specifically, the use of a deeper squat in the eccentric phase of
a CMJ has been shown to have a positive impact on peak jump height when compared to

38
shallow squats. Greater flexibility in the lower extremity may allow an individual to
lower to a greater extent in the eccentric phase of a squat and increase jump performance
(Domire & Challis, 2007; Moran & Wallace, 2007; Salles et al., 2011). The stiffness of
the connective tissue surrounding the muscles during the eccentric phase may be an
influencing factor on jump performance.
Stiffness. Another factor that may limit an individual’s ability to reach maximal
vertical jump height is the stiffness of the elastic components of the muscle. The greater
the stretch of the elastic components of the muscle, the greater the maximal vertical jump
height (Domire & Challis, 2007; Fukashiro et al., 2006; Kubo et al., 1999; Nagano et al.,
2004). The stiffness, or tension, is produced from two sources: the parallel elastic
component (PEC) and the series elastic component (SEC). The PEC structure is aligned
in parallel with the SEC. Both the PEC and SEC are described with reference to the
contractile component (CC), the thin actin and thick myosin filaments that are
responsible for muscular contraction.
The PEC, SEC, and CC are all components of the Hill three-component model of
the muscle. The PEC refers to the interstitial connective tissue (i.e., epimysium,
perimysium, endomysium) which surrounds and runs parallel to the contracting muscle
fibers and associated sarcolemma membrane (Dean, 1988; MacIntosh & MacNaughton,
2005). The SEC refers to the tendon and aponeurosis of the muscle (Fukashiro et al.,
2006; Kubo et al., 1999; MacIntosh & MacNaughton, 2005; Nagano et al., 2004a) and is
positioned in series to the CC. The SEC is responsible for returning the muscle to its
original resting length after contraction. The combination of these two elastic
components with the active muscle creates the muscle-tendon complex (MTC).

39
Compliance of the entire MTC has been shown to increase the benefits of a
countermovement motion in an explosive task (Nagano et al., 2004a). These results
regarding jump height and the compliance of the elastic components of muscle were
corroborated in other literature as well (Bobbert, 2001; Fukashiro et al., 2006; Kubo et
al., 1999; Lichtwark & Wilson, 2005).
The PEC is responsible for some of the passive tension that is present in the
muscle at rest. When the active muscle fiber lengthens, the PEC is stretched, increasing
the amount of tension within the PEC (MacIntosh & MacNaughton, 2005). Despite the
amount of tension that resides in the PEC in resting muscle, the influence that it has on
the height of a vertical jump is questionable (Kurokawa, Fukunaga & Fukashiro, 2001).
As such, this review will not emphasize the PEC.
While the MTC as a whole is able to store elastic energy, the majority of this
energy is stored specifically in the tendon, or the SEC. The elasticity, or compliance, of
this structure directly affects the height of a participant’s jump (Domire & Challis, 2007;
Fukashiro et al., 2006; Kubo et al., 1999; Nagano et al., 2004). In Nagano and colleagues
(2004), a computer model was used to simulate the CC, SEC, and the PEC to determine
how to raise an inertial body to its highest point. It was found that more elasticity in the
SEC resulted in the highest jump height of the body.
Through the use of a computer simulation investigating the compliance of the
triceps surae, jump height was shown to be at its highest when the corresponding SEC
compliance was also at its highest (Bobbert, 2001). In this study, compliance was
determined by the percent of SEC strain at a maximum isometric force. At the highest
strain, 10%, jump height improved the most, 9cm (Bobbert, 2001). Additionally, Bobbert

40
and colleagues reported an increase in the efficiency ratio, the ratio of energy transferred
into the jump to the total amount of work done, with an increase in SEC compliance.
This may relate back to the MTC. It has been shown that a more compliant MTC will
increase the use of elastic energy as well as increase the performance of a vertical jump
(Kubo et al., 1999). Therefore, an increase in SEC compliance may improve the height
of a vertical jump through an increase in the capacity and efficiency of use of the stored
strain energy (Bobbert, 2001; Fukashiro et al., 2006; Kubo et al., 1999).
Along with tendon compliance, the length of a tendon also contributes to vertical
jump performance (Fukashiro et al., 2006). The length that a tendon can achieve is
important because vertical jump height will increase as the tendon stretch increases
(Domire & Challis, 2007). A tendon with a greater amount of compliance and an
increased length will also have more elastic behavior leading to a greater peak jump
height (Fukashiro et al., 2006). As the elastic behavior increases in the MTC, a relatively
longer SEC has more elastic behavior than a MTC with a relatively shorter SEC
(Fukashiro et al., 2006). Elastic, or spring-like, behavior during a stretch-shortening
cycle was defined by the length and compliance of the tendon of the MTC. A larger
amount of tendon compliance and a longer length of tendon result in more spring-like
tendinous behavior (Nagano et al., 2004b).
The amount of stiffness within the tendon and aponeurosis of the muscles of the
lower extremity may influence CMJ performance. The amount to which the SEC can
stretch in particular may influence an individual’s performance. More specifically, the
elastic energy that is stored in the SEC is greater when the tendon and aponeurosis can
41
store energy through a larger phase of movement. The conversion of the elastic energy
into CMJ performance is accomplished through the stretch-shortening cycle.
Stretch-shortening cycle. Seldom does functional performance result purely from
concentric contraction. Movement often requires a countermovement where the active
muscle is stretched immediately prior to contraction. This countermovement is an
example of how the stretch-shortening is used in performance tasks. The stretch-
shortening cycle (SSC) may be a factor that influences CMJ performance (Hartmann et
al., 2012; Luebbers et al., 2003; Luhtanen & Komi, 1980; Moran & Wallace, 2007;
Yamauchi & Ishi, 2007).
The presence of a countermovement may improve vertical jump performance
through the storage of elastic energy during the SSC (Cavanga & Citterio, 1974; Moran
& Wallace, 2007; Nagano et al., 2004a). Elastic energy is stored within the SEC of the
active muscle and immediately released during the concentric muscle contraction to
produce more power during the CMJ (Cavanga & Citterio, 1974). This expression of
power has been shown to increase jump performance over jump trials where no
countermovement was used (Moran & Wallace, 2007).
Peak jump performance improves with an initial countermovement as elastic
energy is stored during the eccentric loading phase (Asmussen & Bonde-Petersen, 1974;
Moran & Wallace, 2007; Nagano et al., 2004a). Nagano et al. (2004a) suggested that an
increase in the SEC compliance may illicit a larger countermovement. This in turn may
influence the possible jump height that is achieved.
Using a countermovement prior to a vertical jump has been shown to improve
performance when compared to vertical jumps with an isometric initial position (Bosco,
42
Viitasalo, Komi, & Luhtanen, 1982; Kubo et al., 1999; Moran & Wallace, 2007;
Luebbers et al., 2003; Luhtanen & Komi, 1980; Yamauchi & Ishi, 2007). Moran and
Wallace (2007) examined the influence that the SSC had on jump performance.
Participants jumped from a variety of squat depths in order to achieve differing ranges
through which the SSC was active for each CMJ. As the range of motion increased
during the eccentric phase of the SSC, a greater peak jump height was recorded for the
tested CMJ. The eccentric load was controlled through the use of 70° and 90° of knee
flexion. Jump height increased by 17.4% in the countermovement jump with greater
eccentric loading (Moran & Wallace, 2007).
The ability to store elastic energy during the SSC is partially dependent on the
elastic behavior of the tendon (Kubo et al., 1999). In particular, an increase in the
elasticity of the SEC will increase the power output and efficiency of the concentric
motion of the SSC (Lichtwark & Wilson, 2005). Increases in SEC elastic compliance
were found to relate to earlier muscle activation in the SSC with an increase in SEC
compliance (Lichtwark & Wilson, 2005). With an increase in the elasticity of the SEC,
the magnitude of optimal countermovement phase motion increases resulting in a greater
storage of elastic energy that is transferred into the CMJ (Nagano et al., 2004a).
The height that can be achieved during a CMJ may be improved by utilizing a
countermovement and activating the SSC. If the MTC has a greater amount of
compliance, the capacity for utilization of the elastic energy during the SSC will increase
(Kubo et al., 1999). In particular, the creation, storage and conversion of elastic energy
during the SSC into power output influences CMJ performance. The larger the SSC, the
greater the ensuing power output generated for a CMJ.
43
Arm swing. Use of an arm swing may also influence the height of a CMJ Arm
swing use in a CMJ was assessed in one study that divided players (Vanezis & Lees,
2005), in a homogeneous soccer team population, into high and low jump height groups.
When allowed to use an arm swing, jump height increased similarly across the groups.
The improvement benefits of an arm swing were further supported in a jump study by
Gerodimos et al. (2008). In an effort to examine the effects of arm swing on CMJ
performance, four groups male basketball players, divided by age, were studied. The
addition of an arm swing to a CMJ increased the height significantly (p < 0.05) within
each of the four age ranges (Gerodimos et al., 2008). Height increases were 4-7cm or a
16-20% increase in all age groups. The use of an arm swing during a CMJ will improve
the height achieved during a CMJ (Gerodimos et al., 2008; Vanezis & Lees, 2005). It is
possible that lack of shoulder movement ability will negatively impact the influence of
the arm swing on a CMJ.
Jump practice. Jump performance may be influenced by neuromuscular factors
as well as the biomechanical and physiological factors of the muscle. Specifically, the
quantity of practice jumps provided prior to data collection trials may influence peak
jump performance. In literature that has used practice trials to reduce the learning effect
of a CMJ task in inexperienced jumpers, no more than five practice jumps were used
prior to data collection (Aragon-Vargas, 2000; Gerodimos et al., 2008; Harman,
Rosenstein, Frykman & Rosenstein, 1990; Luhtanen & Komi, 1980). These trials are
often used by the researcher to provide feedback on the quality of the movement (i.e.,
proper hip, knee, and ankle flexion; trunk flexion; arm and hand position). Research
providing specific evidence to support the amount of practice trials needed for an

44
individual to learn a CMJ task is limited; however, the rationale for the use of practice
jumps can be substantiated.
The use of explosive warm-up may prepare the neuromuscular innervations of the
lower extremity. Practice jumps as a warm-up for explosive jump performance were
shown to have a positive influence on jump performance (Young & Behm, 2003). The
optimal number of jumps that is necessary to maximize performance may be task
dependent, but the rehearsal of the task during a warm-up may facilitate motor unit
activation. Increased facilitation of the motor unit was described as an opening of the
site-specific neural pathway. These findings were further evidenced by Trimble and
Harp (1998). It was shown that the performance of maximal voluntary contractions may
create a post-activation potentiation of the motor unit that may result in a decreased
recruitment threshold (Trimble & Harp, 1998). Task-specific, explosive warm-ups
increase the ensuing performance on a jump test by facilitating motor unit activation of
the lower extremity.
Complex explosive tasks are multifactorial in the influences that can affect
performance. Biomechanical, physiological and neuromuscular factors all contribute to
the performance of a CMJ. Similarly, the FMS™ has been used in athletic populations to
gauge the overall quality of an individual’s movement patterns by examining full body
mobility and stability. Poor movement patterns may be a result of inefficient
biomechanical, physiological and neuromuscular factors that also affect jump
performance. It is possible that the same underlying factors that inhibit quality
movement patterns that leave individuals at a higher risk of injury may also inhibit CMJ
performance.

45
FMS™ and CMJ
The factors that may affect the achievable height from a vertical jump are the
squat depth, tension of the elastic components of muscle, the SSC, and CMJ practice
(Domire & Challis, 2007; Fukashiro et al., 2006; Kubo et al., 1999; Moran & Wallace,
2007; Young & Behm, 2003). When limitations exist in the above factors, vertical jump
performance suffers. The FMS™ is a tool that may provide detail as to some current
limitations that a participant may have that would inhibit jump performance.
Deep Squat. The first test of the FMS™ is the Deep Squat. A crucial element of
the Deep Squat is whether or not the participant is able to squat low enough so that their
knees are bent to at least 90°. Limitations in flexibility may be related to tightness in key
hip flexors such as the iliopsoas, sartorius, and rectus femoris as these muscles may limit
one’s ability to lower into a deep squat. When one cannot squat to or below this cut off
of 90°, a limitation is present that may affect the performance on a vertical jump through
a deficient amount of eccentric loading during the SSC. A 90° knee angle has been
shown to be the optimal angle for maximal jump height (Moran & Wallace, 2007; Salles
et al., 2011). Additionally, optimal performance on the Deep Squat requires that both the
trunk and tibia are parallel to one another at the bottom of the squat. Failure to maintain
this posture becomes evident with an excessive amount of forward flexion beyond
parallel with the tibia. This is not to say that an erect spine is needed throughout the
Deep Squat. Research has shown that an optimal squatting position has some trunk
flexion in order to maximize the hip extension muscles (Kritz et al., 2009;
Vanrenterghem et al., 2008). Furthermore, the SEC of the quadriceps muscles and the
calf muscles must be complaint enough for the individual to complete the test. For
46
example, without adequate Achilles SEC compliance, the participant will not be able to
keep their heels on the ground during the Deep Squat. In such testing cases, the FMS™
reflects the elastic insufficiency in the scoring. It is possible that someone may perform
poorly on the vertical jump if they have a low score on the FMS™ Deep Squat.
Hurdle Step. The Hurdle Step test from the FMS™ is another test that provides
relevant information for a vertical jump. In order to perform the Hurdle Step test
appropriately, the participant needs hip flexion, single-leg stability, and spinal stability to
complete the test. Comparable to the Deep Squat, the iliopsoas and rectus femoris
require sufficient flexibility and contralateral stability to properly perform this movement
test. Insufficient amounts of hip flexion would be evident in the Hurdle Step test as the
participant would struggle to flex their thigh to their torso as they raise the leg up and
over the rubber band. Inferences could be made through this test that inadequate hip
flexion to raise the leg over the rubber band may lead to a reduction in squat depth and
lower amounts of eccentric loading for a vertical jump. In such cases, observable
compensatory movement patterns, such as hip eversion, are utilized to lift the thigh up to
the set height for foot clearance. A participant that lacks sufficient hip flexion to perform
the Hurdle Step test may struggle to generate enough hip flexion in the eccentric phase of
their vertical jump to reach a maximum height.
In-line Lunge. The In-line Lunge may show limitations that would affect a
participant’s ability to perform a vertical jump. Like both the Deep Squat and the Hurdle
Step, the In-line Lunge requires hip flexion to complete the task; however, the stabilizing
muscles of the task must be active simultaneously during spinal extension. Poor
performance in the In-line Lunge test may result from inadequate hip flexion, low rectus

47
femoris flexibility, and an imbalance in the hip abductor’s and adductor’s flexibility and
strength. Insufficiencies may exist either in the lead or rear leg that can affect an
individual’s performance on the in-line lunge test. Low mobility of the hips that would
be evidenced by the In-line Lunge may reflect a reduced depth of a squat in the eccentric
phase of a vertical jump. Unlike the Deep Squat, the spine must remain erect through this
movement. A common adaptation seen in the In-line Lunge is a forward lean of the trunk
during the lunging movement. This may describe a lack of mobility in the hip flexors in
the lead leg that would be used during the eccentric phase of the SSC where elastic
energy is stored; on the other hand, if caused by the rear leg, decreased mobility of the
hip extensors may allude to a decrease in the efficiency of the use of the stored elastic
energy during the concentric take off in the SSC. If a participant performs poorly on the
In-line lunge, they may also perform poorly on a maximal vertical jump.
Shoulder Mobility. The Shoulder Mobility test’s primary effect on a CMJ
relates to the level of shoulder extension during an arm swing that one can utilize during
the eccentric loading phase. Arm swing during a CMJ leads to an increase in the amount
of eccentric load applied to the lower extremity by an increase in the amount of forward
flexion of the trunk (Vanezis & Lees, 2005). Limited mobility seen in the Shoulder
Mobility test may have a negative effect on the maximum height that can be achieved in a
jump as it reduces the arm swing. A decreased amount of shoulder extension used during
the arm swing may result in a smaller vertical height. Muscular limitations that are found
through the Shoulder Mobility test may be responsible for decreased performance in a
maximal CMJ. One limiting factor of the Shoulder Mobility test may be tightness in the
latissimus dorsi. Observed tightness in the latissimus dorsi may limit the amount of
48
forward flexion of the trunk that one can produce during the eccentric phase of the SSC.
This may occur in the CMJ tests that are performed with and without an arm swing.
Active Straight Leg Raise. The Active Straight Leg Raise may also provide
insight as to how well a participant will perform a CMJ. This test measures the amount
of active flexibility that a participant has in the hamstrings as well as hip mobility in the
contralateral leg. Limitations that arise during this test may relate to one’s ability to
perform a maximal CMJ. For example, poor mobility of the hip may lead to a decreased
ability to lower into a deep squat during the eccentric portion of the CMJ. Furthermore,
reduced functional flexibility of the hamstrings, as seen by the inability to flex the
hamstring to the desired height, may also limit maximal CMJ height. At the bottom of
the deep squat, before the amortization phase, the hamstrings are contracted. At the
initiation of the concentric phase, the hamstrings actively lengthen as the quadriceps
drive the body up into the takeoff of the CMJ. A reduction in the functional flexibility of
the hamstrings may prevent the quadriceps from fully contracting, reducing the amount
of work that can be done at the hip, the most important joint for jump height production
(Vanezis & Lees, 2005), during a CMJ.
Trunk Stability Push Up. The Trunk Stability Push Up test provides
information regarding the strength as well as the stability of the trunk and abdominal
muscles. Core stability may be useful in the production of height in a CMJ; especially
during trials where an arm swing is used. Failure to perform an appropriate Trunk
Stability Push Up may relate to poor core strength as well as poor upper body strength.
During the Push Up, an individual is encouraged to brace or tighten the abdominal
muscles to execute a proper movement. Failure to raise the body as one unit, shoulders

49
and trunk, may be a consequence of reduced core strength and stability. In the midst of a
CMJ with an arm swing, the trunk flexion recruited increases, which leads to an increase
in jump height (Vanezis & Lees, 2005). If the individual has limited amounts of core
strength, the amount of trunk flexion during an arm swing may become too great, and
result in a limitation in the height of the CMJ. While other FMS™ tests are able to
illustrate limitations to one’s ability to have appropriate trunk flexion during a CMJ, such
as the Deep Squat, Hurdle Step and In-line Lunge, the Trunk Stability Push Up identifies
weaknesses in the core that can lead to excessive forward lean opposed to the other tests
that allude to abdominal weakness or hip flexor tightness.
Rotary Stability. Similar to the Trunk Stability Push Up, the Rotary Stability
test may also identify weakness in the trunk and core muscles that may prove to be a
hindrance to performance. To be successful in this FMS™ test, a participant is required
to flex and hold the muscles in the core to stabilize the trunk during contralateral and
ipsilateral movements of the shoulders and hips. Failure to maintain this flexion may
lead to poor CMJ performance. During a CMJ, some trunk flexion in the eccentric
portion of the SSC improves jump height. Without the ability to control the amount of
hip and trunk flexion in the eccentric phase, the flexion may become too great, and
decrease the performance of the jump. Unlike the Deep Squat, Hurdle Step and the In-
line Lunge, that all can denote excessive forward lean, this test can identify weaknesses
specific to the core muscles, like the Trunk Stability Push Up, that lead to trunk stability
limitations during jump performances.
The FMS™ and CMJ tests are each field tools that can be used to benefit athletes
and exercisers to identify injury risk and to assess performance. The tightness, weakness,

50
and muscular asymmetries that can be noted throughout the FMS™, with either scoring
method, are contributing factors that may indicate how movement impairments ultimately
affect performance. A common theme can be demonstrated between measures of
functional movement and functional performance when utilizing the FMS™ for CMJ
performance.
Conclusion
Functional performance testing, such as measuring CMJ peak height, is a
commonly used method to assess the amount of power, strength, and speed that an
individual can produce in the lower extremities (Lees et al., 2004; Luebbers et al., 2003;
Moran & Wallace, 2007; Parchmann & McBride, 2011; Salles et al., 2011;
Vanrenterghem et al., 2008). Peak performance in a CMJ may be limited by one’s ability
to achieve depth in the eccentric phase of a CMJ, stiffness in the SEC of the muscle, the
effectiveness of the SSC to use elastic energy and the amount of jump practice prior to
testing. It is possible that the FMS™ may be able to identify some of these limiting
factors that affect CMJ performance.
The relationship between the FMS™ and athletic performance has been attempted
with little success; however, previous literature has used a 21-point scale to score the
FMS™, a less specific method of grading movement patterns. In an attempt to bridge the
gap in the literature between the FMS™ and performance, future research should identify
if a relationship exists between athletic performance measures and the FMS™ 100-point
scale. Through the use of the 100-point scale, those with greater mobility and stability as
scored on the FMS™ may have the capacity to achieve higher peak CMJ heights.

51
The primary purpose of this study was to examine the relationship between the
FMS™ total score, scored on a 100-point and 21-point scale, and CMJ height. The
secondary purpose of the study was to perform an exploratory analysis examining the
relationship of the 21-point live scoring method as well as a 21-point video scoring
method of the FMS™.
52
CHAPTER III: METHODS
Introduction
The primary purpose of this study was to examine the relationship between a
Functional Movement Screen™ (FMS™) total score, scored on a 100-point and 21-point
scale, and countermovement jump (CMJ) height. The secondary purpose of the study
was to perform an exploratory analysis examining the relationship of the 21-point live
scoring method as well as a 21-point video scoring method of the FMS™. This study
was the first of its kind to assess the possible relationship between the FMS™, scored on
a 100-point scale, and athletic performance. The findings of this study provide new
insight for a tool that is currently a reliable tool used for injury risk stratification as well
as build a foundation for functional strength training to improve athletic performance.
The methodology utilized in this study was consistent with the purposes of this study,
including the participants, instrumentation and equipment, measurement procedures, and
data processing, and will be described in the following sections. This study was
approved by the Institutional Review Board (IRB) of the University of Wisconsin-
Milwaukee (UW-M) on April 1, 2013 (IRB Protocol Number = 13.313).
Participants
A sample of 36 male participants participated in the study. The results from an
estimated power analysis using G-Power (Faul, Erdfelder, Lang & Buchner, 2007) based
on a power of 0.8 and a moderate effect size of 0.5, indicated that the sample size would
need to be at least 27. This study exceeded the minimum number of participants to
provide more power for additional analyses; a total of 36 participants were recruited. The
participants for this study were recruited from the UW-M campus and the surrounding
53
Milwaukee, WI area. Details of this study were advertised through the use of flyers
(Appendix A), undergraduate student lecture announcements, and word of mouth.
Selection for this study was contingent upon the Criteria for Inclusion. Participants did
not receive monetary compensation for their participation in this study.
Criteria for exclusion. Prior to explanation of study details, participation
eligibility was dictated by a set of exclusion criteria. A participant was ineligible for this
study if: (a) he had a bone abnormality; (b) had an injury, orthopedic surgery, or had
received rehabilitation services for an injury within the last year (i.e., of the shoulder, hip,
knee, and/ or ankle); (c) had been told by a medical professional that he should avoid
jumping, landing, and/ or running exercise; (d) had a current heart condition and/ or chest
pain; (e) suffered from dizziness; (f) had a hearing impairment (participants needed to be
able to hear the auditory stimulus from the MyoTest to begin CMJ trials); (g) had
previous experience using the FMS™; (h) was taking prescribed medication for an
illness; (i) was at the time or had ever been an intercollegiate Division I athlete; (j) was
taking part in organized training to actively increase vertical jump height, or; (k) did not
meet any of the following gender, age, body mass index, and/ or activity level criteria for
this study.
Gender. Only males were recruited for participation this study. In the literature,
FMS™ total scores on a 21-point scale between males and females have not shown
differences between genders; however, differences existed within the individual
component test scores that made up the total score (Schneiders et al., 2011). Researchers
examining the FMS™ as a method of movement pattern assessment have recruited both
males and females; however, males are typically more heavily represented, if not

54
exclusively represented, in the populations studied (Frost et al., 2012; Goss et al., 2009;
Kiesel et al., 2007; Kiesel et al., 2011; O’Connor et al., 2011). The results of these
studies are more generalizable to men than they are to women. While there is literature
in existence on the female performance on the FMS™, males were solely recruited for
this study to add to the primary literature regarding the FMS™.
The total score of a FMS™ may be similar on the 21-point scale between genders.
However, gender could be a confounding variable when considering functional
performance. Males were recruited in an attempt to remove gender as a confounding
variable in this study and provide greater relevance for comparing the 21-point score to
the 100-point score within the context of the current literature. Evidence is available in
the literature that demonstrates that differences exist between male and female jump
heights. In Cardinale & Stone (2006), comparisons were made between CMJ heights and
gender. Males were shown to have significantly (p < 0.001) higher vertical jump heights
than females (Cardinale & Stone, 2006). Mixed-gender samples may mislead the
relationship between functional movement and functional performance. In order to
reduce the influence that gender may have on the relationship of the FMS™ and CMJ
height, only males will be recruited in this proposed study.
Age. The age of the participants recruited was a criterion for inclusion; age of
participants was limited to a range of 18-30 years. The majority of the current literature
that uses the FMS™ as a method of movement assessment has recruited participants
within the age range of 18-30 years (Butler et al., 2010; Chorba et al., 2010; Frost et al.,
2012; Goss et al., 2009; Onate et al., 2012). In an attempt to build upon the previously
55
established research, participants for this study were also recruited within a similar age
range.
Age may also be a factor that may affect performance. With age, the structure and
function of tendons has been shown to decrease with age (Tuite et al., 1997). Reports of
age-related degeneration have been identified as early as one’s early 30’s (Bosco &
Komi, 1980). By this rationale, this study narrowed the age range of participants to 18-
30 years to limit the subsequent impact that age had on the relationship between the
FMS™ score and CMJ height measurements.
Body mass index. Participation in this study was also dependent on the
individual’s Body Mass Index (BMI). A negative correlation has been identified in the
literature between BMI and FMS™ total score (Perry & Koehle, 2013). Individuals that
have a BMI > 30 have been shown to have significantly lower scores on the FMS™ than
participants with a BMI under 30 (Perry & Koehle, 2013). To remove the effects that
body size has been shown to have on the relationship between the FMS™ total score and
CMJ height, only those with a BMI < 30 were included in this study.
Activity level. The amount of activity and level of fitness was also controlled for
in those who participated in this study. All participants for this study provided a self-
report of how often they engaged in regular exercise based on the American College of
Sports Medicine (ACSM) minimum guidelines. Participants needed to meet the
minimum exercise requirements (i.e., ≥ 30 min of moderate intensity exercise five days/
week or ≥ 20 min vigorous exercise three days/ week; Garber et al., 2011) for at least the
six consecutive months prior to participation in this study in order to be eligible. This
was gauged with an exercise history questionnaire. Within this questionnaire,

56
participants were asked to describe through what type(s) of activity they met the
minimum ACSM guidelines.
Participants Recruited. The recruitment process of participants for this
study is illustrated in Figure 1. A total of 45 participants were recruited for this study.
Of these 45, 37 underwent and completed Phase I of this study. The nine that did not
advance through the first phase of testing were excluded due to a: BMI outside the
inclusion criteria (n = 2), activity level outside the inclusion criteria (n = 1), change in
health status (n = 2), or were a no show to Phase I (n = 4). Of the 37 that completed
Phase I, 36 advanced through and completed Phase II of this study. The individual that
did not advance to Phase II voluntarily withdrew from the study after Phase I. All
participants were recruited from UW-Milwaukee (UW-M) campus and the Greater
Milwaukee area.
Figure 1. Flowchart of participant recruitment
n = 45Contacted with interest
and scheduled
n = 37Meet Criteria for
Inclusion and advance through Phase I
n = 36Complete Phase II
n = 1Dropped out prior to
Phase II
n = 8Did not meet Criteria for
Inclusion

57
Participant characteristics. The mean age of the participants that completed
this study was 21.8 (± 1.6) years. Mean height of the participants was 177.9 (±7.0)
centimeters (cm), mean bodyweight was 78.1 (±11.5) kilograms (kg), and mean body
mass index (BMI) was 24.6 (±2.7).
Correlational Design
This study took place over the course of two days. Each of the test days was
conducted in the Human Performance and Sport Physiology (HPSP) Laboratory, located
within the UW-M Pavilion, Room 365 (3409 N. Downer Ave, Milwaukee, WI 53211).
Criteria for inclusion were met by the participants before the beginning of Day 1.
Participants were asked to refrain from smoking (or use of any other tobacco product) as
well as caffeine intake 4 hours prior to participation in this study. Furthermore,
participants were asked to abstain from heavy weightlifting and/ or maximal aerobic
exercise, for the 24-48 hours between testing days. To maintain the highest amount of
accuracy throughout this study, all measurements of the anthropometrics, FMS™, and
countermovement jumps were be conducted by the primary student investigator (Joshua
K. Conlon).
Day 1. On the first day of testing, the participant was given an Informed Consent
Document (Appendix D) to read and complete prior to the study explanation detail.
Participants were also given an exercise history questionnaire (Appendix E) to read and
complete that verified that the participant fit within the range of physical activity that was
recruited. The exercise questionnaire was not included into the data analysis; however,
rather it was used to assess the mode and quantity of exercise that an individual partook
in on a weekly basis. This information was used to better describe the physical activity

58
history of the participants and to verify that participants had fulfilled the minimum
activity level requested in the Criteria for Inclusion.
Height and weight. Both height and weight measurements were be taken with a
weigh beam eye-level physician scale and mounted stadiometer (Deteco, Webb City,
MO). Height was recorded to the nearest centimeter (cm) and weight in kilograms (kg)
to the nearest tenth. From the anthropometric data, body mass index (BMI) was
calculated by dividing weight (kg) by height squared (m2). The BMI score was rounded
to the nearest tenth decimal place. Height and weight measurements were used to
confirm the self-reported height and weight used to estimate BMI as part of the Criteria
for Inclusion Questionnaire.
Functional Movement Screen™. All seven tasks of the FMS™ were
subjectively scored by the primary investigator. The participant was instructed to
perform each of the seven movement tests to the best of their ability as described by the
investigator. The movements were scored on a 21-point live scale with a paper and
pencil scoring sheet that followed the guidelines of the 21-point scale. The seven
movement tests were also video recorded to be later rescored on a 21-point and 100-point
scale. The seven tasks that were performed were: Deep Squat, Hurdle Step, In-line
Lunge, Shoulder Mobility, Active Straight Leg Raise, Trunk Stability Push Up, and
Rotary Stability. While the 21-point scale has a maximum of 3 points per test, the 100-
point scale maximum score ranges were between 8-20 possible points depending on the
component test.
21-point scale. The current study included a 21-point scoring that evaluated both
live as well as a post hoc video review of the live movement tests. The live 21-point

59
scale was scored in person on the first day of testing by the student PI as the participant
executed each movement. The tests were simultaneously video recorded. After the first
day of testing, the tests were then be rescored through a review of the video recording of
the live tests on an identical 21-point scale. Scoring for the 21-point scale followed the
guidelines laid out in previous literature (Cook et al., 2006a; Cook et al., 2006b).
100-point scale. The study also used the 100-point scoring scale to add more
precision to the scoring of the live movement tests. The total 100-point scoring method
was evaluated post hoc using the video recorded FMS™ tests. The scoring rubric for this
method was identical to that outlined in previous literature (Butler et al., 2012). The 100-
point scale scoring guidelines evaluate the movements similarly to the 21-point scale;
however, test point values are weighted more heavily based on the individual test’s
complexity.
Video recording: All seven of the FMS™ tests were video recorded on the first
day of testing. The tests were video recorded with an iPad-imbedded camera from three
different perspectives (i.e., from the front, from the side, from behind) in both the frontal
and sagittal planes (Butler et al., 2012; Frost et al., 2012). The video recorded
movements were used to re-score the live FMS™ tests post hoc on both a total 21-point
and 100-point scale. The video-rated 21-point scale was used for an exploratory analysis
to determine if differences were present between the results of the 21-point live and 21-
point video-rated scoring procedures. Previous literature using the 100-point scale for
scoring the FMS™ tests has used video to record the movement tests. This allowed the
reviewer(s) adequate time and frequency of viewings in order to score with the more
involved scale with the depth that is required (Butler et al., 2012; Frost et al., 2012).

60
Description of the FMS™ tests. Each of the tests for the FMS™ is described
below as the participant was instructed and is adapted from the literature that originated
the 100-point scale (Butler et al., 2012). Each movement was completed by the
participant to the best of his ability.
Deep Squat: This test required the participant to hold a light weight plastic dowel
rod over the head with arms extended throughout a squat motion. The participant was
asked to squat down as low as they comfortably could. This task was repeated up to five
times (18-point maximum).
Hurdle Step: A test which involved holding the aforementioned dowel rod across
the shoulders with a concomitant step, one leg at a time, over a rubber tube that was
anchored to two stationary poles. The height of the rubber band was level with the tibial
tuberosity, just below the knee. This task was repeated up to five times. Each side was
scored separately (18-point maximum; 9 per side).
In-line Lunge: This test involved the participant lunging forward while standing
on top of the FMS™ board. The participants were asked to touch the knee of the back
leg to the heel of the front foot while extending the back. This was repeated up to five
times. Each side was scored separately (20-point maximum; 10 per side).
Shoulder Mobility: This test was preceded by a clearance test that assessed for
pain that would inhibit the completion of the test. The clearance test required the
participant to reach a hand to the opposite shoulder so that the palm came in contact with
the shoulder near the clavicle. The elbow was then raised so that it pointed forward while
keeping the palm in contact with the shoulder. This occurred for both sides. If no pain
was felt, the (YES) was circled, inferring that they passed the test, and the participant was

61
allowed to perform the Shoulder Mobility test. However, if pain was felt, the (NO) was
circled next to Shoulder Mobility, and the individual did not perform the Shoulder
Mobility test. The Shoulder Mobility test was used to assess the range of motion of the
shoulder. The participant reached each hand, as a fist, toward the center of the back, one
over the top and one underneath, to bring them as close together as possible in a single
motion. The distance that separated the two hands was measured. This test was repeated
three times. Both shoulders were assessed and each side was scored separately (8-point
maximum; 4 per side).
Active Straight Leg Raise: A single, straight-leg raise, which involved the
participant lying on his back and raising one leg up from the ground while the knee was
kept flat on the ground. This test was repeated up to five times. Both legs were assessed
and scored separately (12-point maximum; 6 per side).
Trunk Stability Push Up: This movement test was preceded by a clearance test
that assessed for pain. This clearance test is similar to a cobra stretch. Prone on the
ground in a standard push up position, the individual will push the upper body up into a
spinal extension as the arms extend. If pain was noted, the (NO) was circled next to the
Trunk Stability Push Up and the test was scored as a zero. This test was primarily a
strength task, involving the performance of a push-up with the hands placed at the level
of the chin or clavicle. This task was repeated up to five times (12-point maximum).
Rotary Stability: This test was preceded by a clearance test and assessed for pain
prior to the execution of this test. This clearance test was initiated from the quadruped
position (arms and legs) in contact with the ground. The participant flexed the neck
bringing their chin toward their chest while simultaneously arching the back. The rotary

62
Stability test was a measure of core strength and stability, which involved the participant
being positioned in a quadruped stance and trying to bring an elbow to the ipsilateral
knee. This was repeated up to five times for each side and each side was scored
separately (12-point maximum; 6 per side).
Countermovement Jump
Countermovement jump practice trials. At the end of the first testing day, the
participant was given basic instructions for how to complete the CMJ as well as an
example jump from the primary student investigator. The participant then conducted five
practice trials while wearing the MyoTest SPORT unit device to gain experience on
performing the task within the confines of the equipment. These practice trials were used
in an attempt to diminish the learning effect of performing a CMJ task. The CMJ
technique was described to the participant in accordance with the testing protocol
(Appendix B).
Myotest SPORT unit. The measurement device that was used to record
maximum jump height during the CMJ was the MyoTest SPORT unit. The MyoTest
SPORT unit (Myotest Inc., Durango, CO) is an accelerometer that stores flight time and
acceleration data that was used to calculate peak jump height. The recorded accelerations
were integrated to find vertical velocity by which the overall jump height was estimated
(Casartelli et al., 2010). Jump height was calculated through two methods utilized by the
MyoTest SPORT unit (Casartelli et al., 2010). The first method estimated peak height by
interpreting flight time through the use of the equation (Height = [g x flight time2]/8).
The second method of calculating peak height used takeoff velocity through the use of
the equation (Height = max vertical velocity2/ [2 x g]) (Casartelli et al., 2010). In the

63
literature, the test-retest reliability of the MyoTest’s ability to estimate peak height
through the use of flight time, was high (ICC = 0.92-0.96) (Casartelli et al., 2010). For
this study, the MyoTest data were downloaded to a computer for later analysis and to
determine the jump height using MyoTest Software. For consistency, the MyoTest
device was worn by the participant for all practice trials as well as the data collection
trials in this study.
CMJ practice script. The participant was instructed on four main points of the
CMJ: the eccentric squatting motion, backward arm swing extension, maintenance of a
straight back during the task, and the upward arm swing. The participant was also
instructed that each of the jumps that were collected would be a maximal effort. With the
MyoTest SPORT unit firmly around the waist, the participant stood upright with their
arms down at the sides, feet shoulder width apart, and awaited the initiation beep
(Myotest). At the sound of a beep, the participant lowered himself into a squat, swung
his arms back into an extension, followed by an immediate jump with a concomitant
upward arm swing driving them to a maximum jump height. The depth at which the
participant squatted was not controlled for; however, the participant was instructed to
squat to a depth that would provide the greatest jump height. The participant was
encouraged to land with bent knees at the end of each practice trial. The participant was
given five practice jumps or until they felt comfortable with the movements of the task.
In literature that has used practice trials to reduce the learning effect of a CMJ task in
inexperienced jumpers, no more than five practice jumps were used prior to data
collection (Aragon-Vargas, 2000; Gerodimos et al., 2008; Harman et al., 1990; Luhtanen
& Komi, 1980).

64
Day 2. Day 2 was scheduled no more than 48 hours after Day 1. At the start of
the second day, participants warmed up with a 5-minute cycling bout at a self-selected
intensity and pace on a stationary Monark Ergomedic 828E bicycle ergometer (Monark
Exercise, Vansboro, Sweden). Upon completion of the warm-up, the participant was re-
equipped with the MyoTest SPORT unit and then given the opportunity to practice the
CMJ movement again.
CMJ practice. The participant was reminded of the jump parameters from Day 1
and given five practice CMJ attempts. These attempts served to further familiarize the
participant with the CMJ protocol as well as allow the participant to become more
comfortable with the CMJ motion within the confines of the equipment. After the five
practice jumps were completed, the participant was given a 1-3 minute rest and then
advanced to the data collection of the jump trials.
Countermovement jump trials. The participant performed three maximal effort
CMJ trials. The MyoTest unit was secured to the belt above the participant’s left hip.
Once the participant and student PI were ready, the student PI activated the MyoTest for
the beginning of the trial. When the beep was heard, the participant followed the
practiced jump protocol from Day 1 and Day 2. The participant was instructed to jump
as quickly and powerfully as possible and again reminded to land with bent knees at the
end of each trial. Upon the completion of a successful CMJ trial, the MyoTest unit saved
the peak height value for each participant trial by way of the MyoTest SPORT unit.
Peak height was recorded by the MyoTest for each successful trial. A CMJ trial
was deemed unsuccessful if the participant started the jump before the beep (i.e., false
start), if the MyoTest SPORT unit was bumped during the arm swing of the jump, or if
65
the MyoTest was not able to properly record the trial. To guarantee that each trial was a
maximal jump, participants received verbal encouragement and feedback both before and
after each trial from the student PI. After three successful trials were recorded, the
MyoTest Sport unit was removed and the participant’s commitment to the study was
finished. The jump data was downloaded to a password-protected computer for
subsequent jump height analysis.
Statistical Analysis
All statistical analyses were calculated using IBM SPSS Statistics 21 software
(IBM Corporation, Armonk, New York). Pearson correlations were performed between
CMJ height and each of the FMS™ scoring scales (100 point, 21 live, 21 video). An
exploratory analysis was also conducted as a follow-up comparison between the FMS™
scoring scales. Pearson correlations were performed to examine the relationship between
each of the scoring scales of the FMS™. An alpha level of significance was set at 0.05
for all comparisons.
66
CHAPTER IV: RESULTS
Introduction
The primary purpose of this study was to examine the relationship between
the Functional Movement Screen™ (FMS™) score on a 100-point scale and the height
achieved by a countermovement jump (CMJ). The secondary purpose of the study was to
perform an exploratory analysis examining the relationship of the 21-point live scoring
method as well as a 21-point video scoring method of the FMS™. It was hypothesized
that greater functional movement, scored on the FMS™, would result in greater
functional performance, quantified by CMJ height. It was also hypothesized that the
FMS™ scored on a live 21-point scale would have a positive correlation to the 21-point
video scoring method.
In order to test these hypotheses, a correlational design was used to examine
the variables of interest (i.e., functional movement and functional performance). After
participants proved to be eligible for participation by fulfilling adequate physical activity,
BMI, age and gender requirements, they completed the seven FMS™ movement tests.
These tests were scored live on a 21-point scale. Throughout the testing session, each of
the movements was videotaped from anterior, lateral, and posterior angles for post hoc
scoring on the 100-point scale. The participants were then instructed on how to perform
a CMJ and given five practice trials. Test trials were recorded within 48 hours of the first
testing session for a total of three maximal CMJ trials.
Outcomes of interest. The primary outcome of interest was the relationship
between the measures of functional movement (i.e., FMS™) and functional performance
(i.e., CMJ height). The secondary outcome was the relationship between the scoring
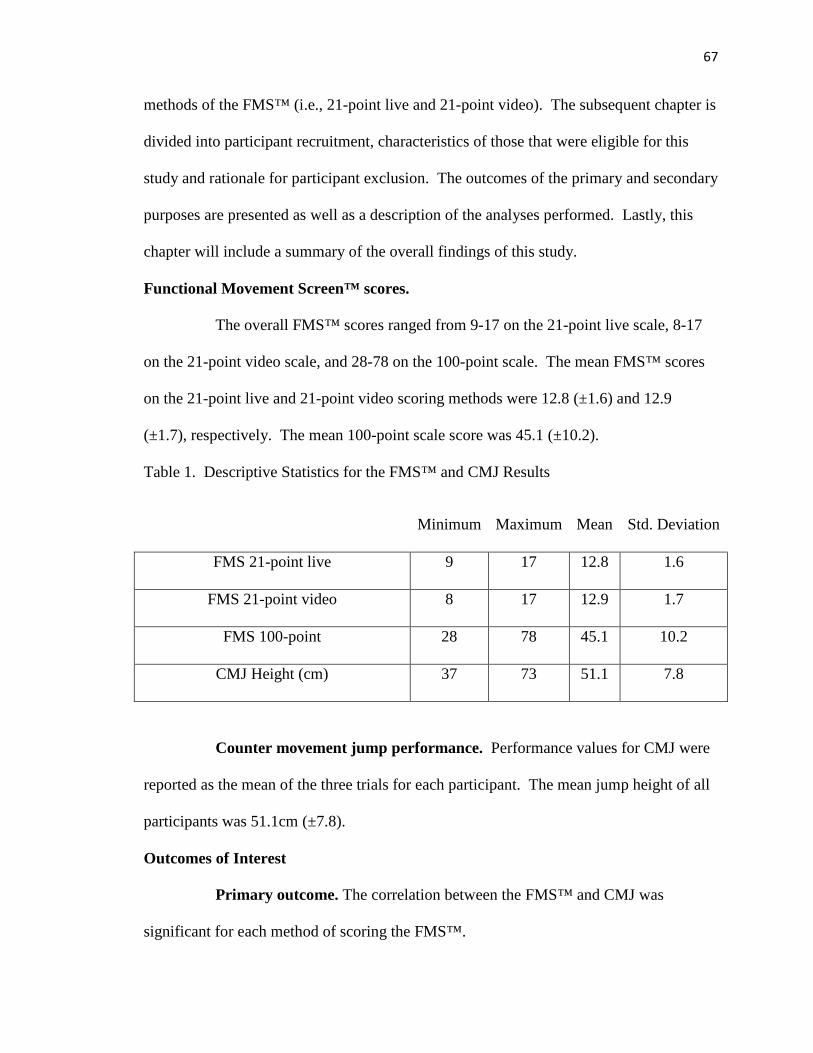
67
methods of the FMS™ (i.e., 21-point live and 21-point video). The subsequent chapter is
divided into participant recruitment, characteristics of those that were eligible for this
study and rationale for participant exclusion. The outcomes of the primary and secondary
purposes are presented as well as a description of the analyses performed. Lastly, this
chapter will include a summary of the overall findings of this study.
Functional Movement Screen™ scores.
The overall FMS™ scores ranged from 9-17 on the 21-point live scale, 8-17
on the 21-point video scale, and 28-78 on the 100-point scale. The mean FMS™ scores
on the 21-point live and 21-point video scoring methods were 12.8 (±1.6) and 12.9
(±1.7), respectively. The mean 100-point scale score was 45.1 (±10.2).
Table 1. Descriptive Statistics for the FMS™ and CMJ Results
Minimum Maximum Mean Std. Deviation
FMS 21-point live 9 17 12.8 1.6
FMS 21-point video 8 17 12.9 1.7
FMS 100-point 28 78 45.1 10.2
CMJ Height (cm) 37 73 51.1 7.8
Counter movement jump performance. Performance values for CMJ were
reported as the mean of the three trials for each participant. The mean jump height of all
participants was 51.1cm (±7.8).
Outcomes of Interest
Primary outcome. The correlation between the FMS™ and CMJ was
significant for each method of scoring the FMS™.

68
Table 2. FMS™ and CMJ Correlations
FMS CMJ height (cm)
21-point live r = 0.346, p = 0.039
21-point video r = 0.436, p = 0.008
100-point r = 0.428, p = 0.009
*p < 0.05. Correlation matrix of primary outcome variables. Each FMS™ scoring
method has a significant relationship to CMJ height.
Figure 2. Aggregate FMS™ 21-point live score vs. CMJ Height (cm). FMS™ 21-
point live score was not significantly correlated to Mean CMJ Height (r = 0.346, p =
0.039).
0
10
20
30
40
50
60
70
80
6 8 10 12 14 16 18 20
Me
an
CM
J H
eig
ht
(cm
)
FMS™ 21-point Live Score
FMS™ 21 Live vs Mean CMJ Height (cm)
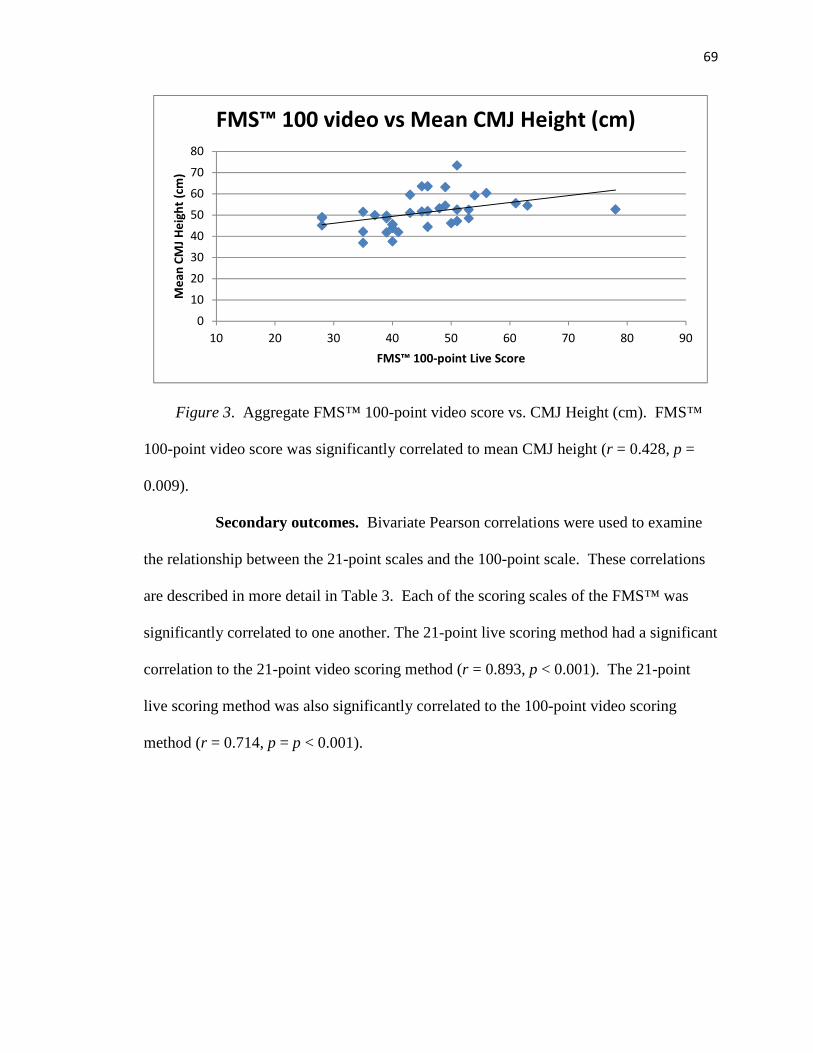
69
Figure 3. Aggregate FMS™ 100-point video score vs. CMJ Height (cm). FMS™
100-point video score was significantly correlated to mean CMJ height (r = 0.428, p =
0.009).
Secondary outcomes. Bivariate Pearson correlations were used to examine
the relationship between the 21-point scales and the 100-point scale. These correlations
are described in more detail in Table 3. Each of the scoring scales of the FMS™ was
significantly correlated to one another. The 21-point live scoring method had a significant
correlation to the 21-point video scoring method (r = 0.893, p < 0.001). The 21-point
live scoring method was also significantly correlated to the 100-point video scoring
method (r = 0.714, p = p < 0.001).
0
10
20
30
40
50
60
70
80
10 20 30 40 50 60 70 80 90
Me
an
CM
J H
eig
ht
(cm
)
FMS™ 100-point Live Score
FMS™ 100 video vs Mean CMJ Height (cm)
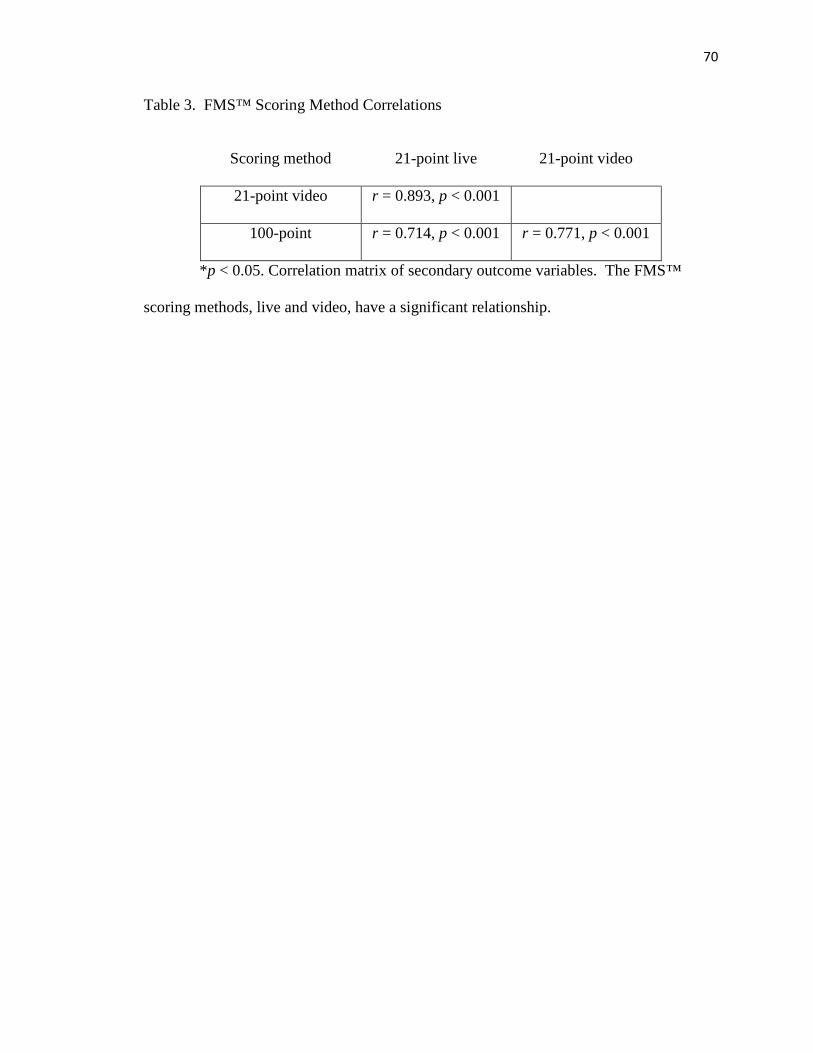
70
Table 3. FMS™ Scoring Method Correlations
Scoring method 21-point live 21-point video
21-point video r = 0.893, p < 0.001
100-point r = 0.714, p < 0.001 r = 0.771, p < 0.001
*p < 0.05. Correlation matrix of secondary outcome variables. The FMS™
scoring methods, live and video, have a significant relationship.

71
Chapter V: Discussion
Introduction
The use of both functional movement and functional performance testing prior to
activity participation is well documented (Cook et al., 2006a; Cook et al., 2006b;
Hoffman, Tenenbaum, Maresh & Kraemer, 1996). However, it is unclear whether
performance on these two tests is related. Researchers have previously examined the
relationship between functional movement and functional performance, and have
demonstrated minimal overlap between the Functional Movement Screen™ (FMS™) and
measures of performance (i.e., countermovement jump height) (Okada et al., 2011;
Parchmann & McBride, 2011).The aim of this study was to examine the relationship
between measures of functional movement and functional performance with a more
precise method of scoring for the FMS™. The primary purpose of this study was to
examine the relationship between the FMS™ total score, scored on a 100-point and 21-
point scale, and CMJ height. The secondary purpose of the study was to perform an
exploratory analysis examining the relationship of the 21-point live scoring method as
well as a 21-point video scoring method of the FMS™.
This study was organized into two phases of data collection. Phase I began with
collection of the anthropometric data as well as the successful completion of the FMS™,
concluding with an introduction to the countermovement jump (CMJ) which included
five practice trials jumps. Phase II was conducted within 48 hours of Phase I, in which
participants performed a warm-up, five practice CMJ trials, and three CMJ data trials. A

72
total of 45 participants were recruited for this study, with 37 advancing through Phase I
and 36 completing Phase II.
The results of the current study for total FMS™ scores (Gribble, Brigle,
Pietrosimone, Pfile & Webster, 2013; Schneiders et al., 2011; Smith, Chimera, Wright &
Warren, 2013) and BMI (Duncan & Stanley, 2012; Duncan, Stanley & Wright, 2013;
Perry & Koehle, 2013) for the sample recruited were not similar to previously established
norms. However, CMJ height reported for the current study was within established
norms for similar samples (Nuñez et al., 2008; Nuzzo et al., 2011; Vanezis & Lees,
2005). Differences in the population, power task and scoring method of the FMS™ may
have resulted in differing results between the current study and previously reported
results. The following discussion will establish: (a) how the sample population recruited
relates to those that have been recruited in previous literature and (b) how limitations in
previous literature enhanced the exclusion criteria for the current study.
Comparison of sample to previous literature
Functional movement screen™. The mean score for the live FMS™ 21-point
scale, post hoc video 21-point scale, and 100-point scale were 12.8±1.6, 12.9±1.7, and
45.1±10.2, respectively. The mean values for the 21-point scale are below what has been
deemed the athletic cut-off (≤14) for participation without risk for injury (Chorba et al.,
2011; Kiesel et al., 2007; Kiesel et al., 2011; O’Connor et al., 2011).
The reported mean FMS™ total scores were also below previously established
normal total scores. Schneiders et al. (2011) reported mean FMS™ values for the 21-
point live scale of 15.8±1.8. Smith et al. (2013) reported mean FMS™ scores for the 21-
point live scale of 14.3±1.5. Gribble et al. (2013) reported mean FMS™ scores for the

73
21-point video scale of 13.69±0.98. Comparatively, the FMS™ scores from the current
study were lower than those reported in previous research.
The FMS™ total score means from the current study were lower than previously
established means for each of the scales used. The previously established athletic
participation cut-off score (≤14) was created from highly athletic populations (i.e.,
professional football; collegiate athletes; military officers). The current sample may have
been below this cut-off due to differences in physical activity then those used to establish
this cut-off for athletic participation. Mean FMS™ total scores were also lower than
means reported from recreationally active populations. It is possible that the primary
investigator was strict in following the scoring rubric of the FMS™. However, it should
be noted that this level of movement criticism was maintained for both 21-point scales.
To date, adult norms for the FMS™ 100-point scale have not been established. Butler et
al. (2012), reported mean values for the FMS™ 100-point scale of 57.2±1.9 for middle
school aged children. The results from the current study address an immediate gap in the
literature by presenting a set of 100-point scale values for recreationally active adult
males.
Countermovement jump. The mean CMJ height for male participants in the
current study was 51.1±7.8 cm. These results were within the range of jump
performances reported in by previous researchers. (Nuñez et al., 2008; Nuzzo et al.,
2011; Vanezis & Lees, 2005). Nuzzo et al. (2011) reported CMJ trial means using the
Myotest Sport Unit with lower heights of 44.2±7.5 cm, 44.1±7.5 cm and 44.8±7.4 cm for
males. Conversely, Vanezis and Lees (2005) recorded CMJ heights of 57.9±2.1 cm.
Nuñez et al. (2008) reported male CMJ mean heights that most closely resembled the
74
results of this study 52.7±4.8 cm. Similar to the present study, the CMJ trials for these
studies required participants to utilize an arm swing. The CMJ results from the current
study were consistent with those of prior studies suggesting that the CMJ task used as the
comparative task for FMS was at least consistent with prior studies.
Body mass index. A BMI of 30 or greater was an exclusion criteria for
participating in this study. The mean BMI of the subjects for the current study was
24.6±2.7. Researchers have established a negative correlation between BMI and FMS™
stating that BMI is a confounding variable to FMS™ performance (Duncan & Stanley,
2011; Duncan et al., 2013; Perry & Koehle, 2013). Perry and Koehle (2013) established
BMI norms for adults between 20-39 years of age at 26.0±3.9 (Perry & Koehle, 2013).
The established adult norms from Perry and Koehle were of a mixed gender population
and may infer that a strictly male adult population of the same age demographic would be
greater than 26. Schneiders et al. (2011) also reported a mean BMI of 25.0±2.9 for
active, healthy males between the ages of 18-40 years of age. The participants of the
present study were below this established norm as well.
A Pearson correlation was conducted to examine the relationship in the present
study between BMI and FMS™ scores. The relationship was not found to be significant
between BMI and the FMS™ 100-point (r = -0.011, p = 0.951), live 21-point (r = -0.023,
p = 0.895), and video 21-point (r = 0.183, p = 0.285). However, the implications may
need to be taken with caution. Unlike other FMS™ research, the population in the
current study was designed to exclude BMI’s greater than 29. The lack of significant
correlation between BMI and FMS score in the current study may be due to the small
amount of variability in the population BMI in this study.

75
Sample comparison summary. The sample recruited for the current study
performed similarly in CMJ performance to other reported means despite lower mean
FMS™ performance and a lower mean BMI. The physical activity restrictions, BMI
restriction and gender restriction may have influenced the mean reported values for
FMS™ performance. With an understanding of how the current participant populations
compares to that of previous research, the subsequent discussion sections will examine
the relationship between FMS™ and CMJ and the influence of FMS™ scoring method.
FMS™ and CMJ
Previous researchers have been unable to establish a relationship between these
two variables (Okada et al., 2011; Parchmann & McBride, 2011), however the results of
the current study indicate that functional movement may influence performance. The
current study found a significant relationship between CMJ and FMS™ as measured by
the 100-point scale (r = 0.428, p = 0.009), the 21-point live scale (r = 0.346, p = 0.039),
and the 21-point video scale (r = 0.436, p = 0.008). Thus there was a significant
relationship between the FMS™ and CMJ regardless of the scale used to score the
FMS™. The current study was the first to find a significant relationship between
functional movement and functional performance, regardless of the scoring method used
for the FMS™. It is possible that the differences in population, power task, and
measurement method contributed to the current results.
Population characteristics. Unlike previous literature that examined the
relationship between the FMS™ and CMJ height (Okada et al., 2011; Parchmann &
McBride, 2011), the current study established both minimum (i.e., American College of
Sports Medicine guidelines) and maximum (i.e., non-athletes; non-jump training)

76
physical activity parameters as a requirement for participation. This restriction was
established in order to reduce the influence that physical activity extremes would have on
performance for either the FMS™ or CMJ height. Other potentially influential factors
may have included gender and body mass index (BMI).
Gender may have been a factor that limited the relationship between functional
movement and functional performance. Okada et al. (2011) recruited a recreationally
active population of males and females that were injury free for at least one year prior to
participation and there were not exclusion criteria based on BMI. Parchmann and
McBride (2011) also recruited an athletic population with no history of time-loss due to
injury in the last 12 months to examine the relationship between functional movement
and functional performance. However, unlike in Okada et al. (2011), the population
recruited was a mixed gender sample of Division I golf athletes opposed to recreationally
active healthy adults. Athletes were not excluded for any BMI values. Performance on
the FMS™ for these populations may not have been significantly correlated to CMJ
height because of the mixed-gender samples or the inclusion of all BMI values.
Mixed-gender samples that were recruited may have added another confounding
variable to the relationship between the FMS™ and CMJ height. Schneiders et al.
(2011), stated that total FMS™ scores are not significantly different between genders
when scored on a live 21-point scale; however, CMJ heights are significantly different
between genders (Alegre, Lara, Elvira & Aguado, 2009). The similar FMS™ total scores
within a mixed-gender sample and wide range of CMJ heights may cloud the influence
that functional movement has on functional performance. Therefore, the inclusion of
another variable (i.e., gender) to the relationship between functional movement and

77
functional performance may have hindered the significance of the relationships in
previous research.
In the current study, BMI was a restriction for participation. A Pearson
correlation was used to examine the relationship between BMI and FMS™ performance
on the current sample. A significant relationship was not found between BMI and the 21-
live (r = -0.011, p = 0.951), 21-video (r = -0.023, p = 0.895), and 100-point scales (r =
0.183, p = 0.285). The low correlation coefficient suggests that BMI did not influence
FMS™ performance in the current study and was successfully controlled for in the
current study.
The BMI of those recruited in previous studies may have influenced performance
on the FMS™. Perry et al. (2013) found a significant negative correlation between the
FMS™ and BMI when controlled for age (r = -0.24, p < 0.001). Duncan and Stanley
(2012) have found similar relationships between the FMS™ and BMI in an adolescent
population. It is possible that a participant’s BMI (i.e., ≥30) may have decreased FMS™
performance and compromised the relationship that was found between movement and
performance in previous studies.
The exclusion criteria for participation in the current study narrowed and limited
participation to a more homogenous group than what was recruited by other researchers.
The restriction of BMI and gender, which have been noted to have influence on the
variables of interest (i.e., functional movement and performance), may have resulted in
the significant relationship between functional movement and functional performance. In
order to establish a relationship between the FMS™ and CMJ height, a more restrictive
criteria for inclusion may be necessary.

78
Power task. The method of quantifying functional performance may have
resulted in the significant findings of the current study that were not found in other
literature. In the current study, a CMJ with an arm swing was the power task used to
quantify an individual’s functional performance. This task is representative of a full body
power task as it involves motion in both the upper and lower extremity to achieve a quick
displacement of one’s center of mass to a maximum height. Since the FMS™ is a full
body movement screen, a full body power task was used for to measure functional
performance. Researchers that examined the relationship between functional movement
and functional performance may have not established a relationship because of the power
task used.
In Okada et al. (2011), the relationship between functional movement and
functional performance was examined. The measure of power used was a backwards
overhead medicine ball (BOMB) throw. Functional movement was assessed using the
live FMS™ 21-point scale. While some of the component scores of the FMS™ tests
were found to have a significant relationship to BOMB throw performance (i.e., right side
Hurdle Step (r = 0.415), Trunk Stability Push Up (r = 0.407), right side Rotary Stability
(r = 0.391)), the total score was not significantly correlated to performance (Okada et al.,
2011). While the BOMB throw is a full body power task, this task may be more
dependent on upper extremity mobility, stability and power.
The disparity between Okada et al. (2011) and the current study may reside in this
task difference. Okada et al. (2011) used the BOMB throw as a power performance
measure while a three-trial mean of CMJ height with arm swing was used to assess power
in the current study. While each is a designed to be an explosive task that recruits power

79
from a full body movement, it may be that the BOMB throw is more dependent on upper
body mobility, stability and power whereas the CMJ relies more heavily on lower body
mobility, stability and power. It is possible that the component tests of the FMS™ may
relate more favorably to performance tasks that rely on lower body functional movement
and performance opposed to that of the upper body. Like Okada et al. (2011), Parchmann
and McBride (2011) also examined the potential relationship between movement and
performance.
The relationship between functional movement and functional performance was
also examined by Parchmann and McBride (2011). In Parchmann and McBride (2011) a
non-significant relationship was suggested between the FMS™ 21-point live scale and
CMJ height (r = 0.249) (Parchmann & McBride, 2011). While Parchmann and McBride
used the same power task as the current study, each differed in the initial position of the
arms prior to an arm swing. There is the potential that the initial position of the arms
prior to the execution of a CMJ may have influenced the relationship between CMJ
height and FMS™ performance.
There is the potential that a difference in the initial position of the arms prior to
CMJ performance may have influenced the relationship between functional movement
and functional performance. Part of the FMS™ is the Shoulder Mobility test that
examines an individual’s shoulder and latissimus dorsi mobility. It is possible that
restriction in the upper extremity, as seen in the Shoulder Mobility test, could reduce arm
swing follow through and reduce CMJ performance.
A moderate correlation existed in the current study between the FMS™ and CMJ
height. However, it is possible that those recruited may have been able to compensate for

80
movement dysfunction in a CMJ test. For example, poor FMS™ deep squat scores may
not have been reflected in CMJ performance as compensatory movement patterns could
mask dysfunctional movement in an acute task. Since the FMS™ evaluates movement
patterns for chronic injury risk, a stronger correlation may result from a more prolonged
power task as movement compensation may affect performance over time (i.e., shuttle
runs; sprints; cone drills). It is possible that a more precise power task may have
correlated better to functional movement, similar to how the 100-point scale may
correlate better to functional performance.
Scoring method. The method that was used to score the FMS™ may have
limited the relationship between functional movement and functional performance. In the
current study the FMS™ was used as a measure of an individual’s functional movement
and scored with a 21-point live, 21-point video and 100-point scale. Previous research
had used the original 21-point live scale for functional movement assessment. The 100-
point scale was used as a more precise scoring method of the FMS™ and may have
improved the ability of the FMS™ total score to correlate to functional performance (i.e.,
CMJ).
The method of scoring used in Okada and colleagues (2011) may have limited the
relationship between functional movement and performance. Okada et al. (2011) scored
each of the bilateral FMS™ component tests separately by side. A significant
relationship between the right side Hurdle Step and right side Rotary Stability was noted
to performance (i.e., BOMB throw). However, the total score was not significantly
correlated to BOMB throw performance. All FMS™ measurements were done with the
21-point live scale.
81
Parchmann and McBride (2011) also used the live 21-point scoring method to rate
FMS™ performance. While all recruited participants were rated by the same
administrator, the use of the 21-point live scale to correlate functional movement to
performance may have been a limitation. Like Okada et al. (2011), FMS™ total score
and CMJ height were not significantly correlated to one another. The method of scoring
in both studies may limited the relationship between the FMS™ and CMJ height as 21-
point live scale may lack the precision to inform regarding performance capacity. In
addition to the 21-point live scale, the 21-point video and the 100-point scales were used
in the current study to score the FMS™.
A moderately significant relationship was found in the current study between all
scales of the FMS™ and CMJ height. The ability to pause, rewind and replay the
component tests of the FMS™ may have improved the precision of the scoring in the 21-
point video and 100-point scales. Opposed to live scoring, freezing a movement in time
while viewing a video allows the rater to verify multiple limb locations at a given time to
better score according to the standardized rubric.
FMS™ scoring relationship.
The secondary purpose of the current study was to perform an exploratory
analysis examining the relationship of the 21-point live scoring method as well as a 21-
point video scoring method of the FMS™. Previous literature has established a
relationship between the 21-point live and 21-point video scales (Shultz, Anderson,
Matheson, Marcello & Besier, 2013). However, the literature cannot support a
relationship between either of the 21-point scales and the 100-point FMS™ scoring
method.

82
The current study examined the relationship between the two 21-point scales of
measurement for the FMS™ (i.e., live and post hoc video). Video was recorded during
the live evaluation of the FMS™ movements from the anterior, lateral, and posterior
sides. The current study demonstrated a strong correlation between the two 21-point
scales (r = 0.893, p < 0.001). The findings of the present study add further support to the
relationship between each method of scoring on a 21-point scale, allowing implications
of the 21-point scale to be applicable regardless of the scoring method used.
The current study corroborates what has been evidenced in previous literature.
The reliability between the two methods of measurement for the 21-point scale (i.e., live
and video) was examined in the FMS™ literature (Shultz et al., 2013). Shultz et al.
(2013) examined the consistency that both the live and video 21-point scales scored the
FMS™. The findings from Shultz et al. (2013) demonstrated excellent reliability
between the two testing methods (ICC = 0.92). Similar to Shultz et al. (2013), the current
study demonstrated excellent reliability (ICC = 0.95) between the two methods of scoring
on the 21-point scale.
The 100-point scale is a more precise method of scoring the FMS™; however, it
has not been determined if a relationship exists between 100-point and 21-point scales.
The 21-point scale is both a valid and reliable method of rating the quality of movement
patterns. Despite the validity and reliability, the 21-point scale is limited in its ability to
rate overall movement without identifying specific limiting components of a movement.
Therefore, the 100-point scale was developed to address the need for a more precise
method of rating movement patterns (Butler et al., 2012). Butler et al. (2012), found that

83
the 100-point scale had high reliability between raters for both the total score (ICC =
0.99) and the component scores of each test (ICC = 0.91-1.00) (Butler et al., 2012).
In the current study, a strong correlation was found between the 100-point scale
and the live 21-point (r = 0.714, p < 0.001) and video 21-point (r = 0.771, p < 0.001)
scales. The 100-point and 21-point scales have a strong relationship which demonstrates
that a rater using either scale may be able to identify movement pattern limitations
precisely regardless of the scale used. This study was the first to provide new
significance to the current body of literature as this relationship between the 100-point
and 21-point scales had not been previously established.
Conclusions
Performance on the FMS™ and CMJ height were significantly correlated to one
another which supported the primary purpose of the current study. The implications that
can be drawn from the primary purpose provide evidence that movement efficiency and
greater amount of functional movement may not only be related to reduced injury risk,
but also greater performance on a jump task. Overall, greater functional movement may
lead to greater acute power production while reducing injury risk.
The scales of scoring the FMS™ were significantly correlated to one another
supporting the secondary purpose of the current study. The strong relationship between
the scales of the FMS™ signifies that each of the scales evaluate movement function
similarly. Despite the significance that was established in this study, the current study
was not without limitations.

84
Limitations
Like other research, the current study was not without its share of limitations.
Given the small sample size (n = 36), the generalizability to active populations beyond
the sample recruited is limited. Future research should continue to identify the
relationship between functional movement and functional performance. This could be
accomplished by examining this relationship within larger groups of recreationally active
males using the parameters of the current study.
Another limitation to the current study was the inclusion of a male-only
population. In the future, researchers should consider expanding to an active female
population to determine if the relationship between functional movement and functional
performance exists for females as well. The current study excluded both Division I
athletes and those with a BMI of 30 or greater from participation. These exclusions
resulted in a narrow population of interest. Researchers building upon the current study
should investigate the relationship between functional performance of higher athletic
populations and the FMS™. It may also be relevant to investigate athletic populations
with a BMI greater than 30 to further investigate the influence that BMI has on FMS™
and athletic performance. This may aid in identifying how BMI is a confounding
variable for the FMS™. For example, in order to identify the relationship between the
FMS™ and BMI in a recreationally active population, a follow-up to the current study
could be conducted with males with a BMI of 30 or greater.
The current study was also limited as functional performance was defined and
measured with a single power task (i.e., CMJ height) as opposed to multiple expressions
of power. Including additional power tasks (i.e., BOMB throw, standing long jump,
85
sprint speed, sport-specific power expression) may assist in gaining a greater
understanding of the relationship between functional movement and functional
performance. In particular, more specific power tasks could be used that better represent
the recruited sample. For example, the use of a mannequin drag for firefighters or the
power that a football player hits a sled would not only better inform researchers to the
relationship between functional movement and functional performance, but also better
assist the population achieve greater performance.
The FMS™ may also have been a limiting factor in the current study. While the
student PI was the only administrator of the FMS™, the instructions prior to each of the
FMS™ component tests were not completely standardized. Future research should
standardize the instructions that are given to each subject and reduce the possible
variability in the instructions. This could be accomplished by providing participants with
either a written or video set of instructions for each component test. Similar means were
reported for both of the 21-point scales. While each was significant to performance, the
21-video scale had a stronger relationship to CMJ height. Individual differences between
aggregate score on the 21-point scales may have accounted for the similarities in the
means but differences in significance. Researchers should pursue the validity of the two
21-point scales and identify if the component tests are scored differently on each scale.
While it can be seen as a strength that the same student PI was the administrator of the
FMS™ and rater for each subject and scale, future research should include multiple raters
for each subject and each scale to strengthen the relationship between the FMS™ and a
performance variable. The mean total FMS™ scores were lower for the 21-point scale
than reported means from other research (Gribble et al., 2013; Schneiders et al., 2011;
86
Smith et al., 2013). The student PI for this study may have been more critical of
movement patterns than previous researchers. In order to remedy this, future research
should delve in a consistent method of training raters. For example, utilizing both the
live and video scales to evaluate and improve the test-retest reliability for identical
movements. This could create a potential acceptable cut-off of test-retest reliability score
for researchers ensuring the strength of future findings.
Significance
Scientific significance. The current study provides practical significance to the
body of literature by identifying a strong correlation between the scales of the FMS™
(i.e., live 21-point, video 21-point, 100-point). However, only scoring methods rated
using video analysis were significantly correlated to functional performance. From an
injury risk perspective, the current study supports the use of any scoring method of the
FMS™ for injury identification. This indicates that regardless of the methods that
researchers have at their disposal to assess movement patterns, when administered
correctly, the FMS™ is reliable across all scales. Despite the significant relationship, the
nature of the relationship between functional movement and functional performance is
still unknown.
Practical significance. The current study also has practical significance that can
be gleaned. First of all, a new potential influencing factor to functional performance was
identified, functional movement. Unlike findings from previous research, a significant
relationship was found between functional movement and functional performance for
recreationally active males in the current study. Therefore, strength coaches and
clinicians should take particular note in not only a clients’ performance, but also the

87
functional baseline of movement that their clients have. The FMS™ is a well-established
tool for injury risk identification (Chorba et al., 2010; Kiesel et al., 2007; Kiesel et al.,
2011; O’Connor et al., 2011). As identified by the current study, there is a significant,
albeit moderate, relationship between functional movement and performance. It is
encouraged that the FMS™ be used in scouting and combine-style testing as a time
efficient and portable screen that provides insight on both injury risk as well as functional
performance.

88
REFERENCES
Aargón-Vargas, L. (2000). Evaluation of four vertical jump tests: Methodology,
reliability, validity, and accuracy. Measurement in Physical Education and
Exercise Science, 4(4), 215-228.
Alegre, L., Lara, A., Elvira, J., & Aguado, X. (2009). Muscle morphology and jump
performance: gender and intermuscular variability. Journal of Sports Medicine
and Physical Fitness, 49(3), 320-326.
Asmussen, E., & Bonde-Petersen, F. (1974). Storage of elatic energy in skeletal muscles
in man. Acta Physiologica Scandinavica, 91(3), 385-392.
Bobbert, M. (2001). Dependence of human squat jump performance on the series elastic
compliance of the triceps surae: a simulation study. The Journal of Experimental
Biology, 204, 533-542.
Bosco, C., & Komi, P. (1980). Influence of aging on mechanical behavior of leg extensor
muscles. European Journal of Applied Physiology, 45(2-3), 209-219.
Bosco, C., Viitasalo, T., Komi, P., & Luhtanen, P. (1982). Combined effect of
elasticenergy and myoelectrical potentiation during stretch-shortening cycle
exercise. Acta Physiologica Scandinavica, 114, 557-565.
Bubanj, S., Stanković, R., Bubnaj, R., Bojić, I., Dindić, B., & Dimić, A. (2010).
Reliability of myotest tested by a countermovement jump. Acta Kinesiologica,
4(2), 46-48.
Butler, R., Plisky, P., & Kiesel, K. (2012). Interrater reliability of videotaped
performance on the functional movement screen using the 100-point scoring
scale. Athletic Training & Sports Health Care, 4(3), 2012.

89
Cardinale, M., & Stone, M. (2006). Is testosterone influencing explosive performance?.
Journal of Strength and Conditioning Research, 20(1), 103-107.
Casartelli, N., Müeller, R., & Maffiuletti, N. (2010). Validity and reliability of the
Myotest accelerometric system for the assessment of vertical jump height.
Journal of Strength and Conditioning Research, 24(11), 3186-3193.
Cavagna, G., & Citterio, G. (1974). Effects of stretching on the elastic characteristics and
the contractile component of frog striated muscle. Journal of Physiology, 239, 1-
14.
Chorba, R., Chorba, D., Bouillon, L., Overmyer, C., & Landis, J. (2010). Use of a
functional movement screening tool to determine injury risk in female collegiate
athletes. North American Journal of Sports Physical Therapy, 5(2), 2010.
Cook, G. (2010). Movement: Functional movement systems. (pp. 220-225).
Cook, G., Burton, L., & Hoogenboom, B. (2006). Pre-participation screening: the use of
fundamental movements as an assessment of function - part 1. North America
Journal of Sports Physical Therapy, 1(2), 62-72.
Cook, G., Burton, L., & Hoogenboom, B. (2006). Pre-participation screening: the use of
fundamental movements as an assessment of function - part 2. North American
Journal of Sports Physical Therapy, 1(3), 132-139.
Cronin, J., & Hansen, K. (2005). Strength and power predictors of sports speed. Journal
of Strength and Conditioning Research, 19(2), 349-357.
Domire, Z., & Challis, J. (2007). The influence of squat depth on maximal vertical jump
performance. Journal of Sports Sciences, 25(2), 193-200.
Duncan, M., & Stanley, M. (2012). Functional movement is negatively associated with
weight status and positively associated with physical activity in British primary
school children. Journal of Obesity, 2012.

90
Duncan, M., Stanley, M., & Wright, S. (2013). The association between functional
movement and overweight and obesity in British primary school children. BMC
Sports Science, Medicine, and Rehabilitation, 5(11).
Faul, F., Erdfelder, E., Lang, A., & Buchner, A. (2007). G*power 3: a flexible statistical
power analysis program for the social, behavioral, and biomedical sciences.
Behavior Research Methods, 39(2), 175-191.
Frost, D., Beach, T., Callaghan, J., & McGill, S. (2012). Using the Functional Movement
Screen™ to evaluate the effectiveness of training. Journal of Strength and
Conditioning Research, 26(6), 1620-1630.
Fukashiro, S., Hay, D., & Nagano, A. (2006). Biomechanical behavior of muscle-tendon
complex during dynamic human movements. Journal of Applied Biomechanics,
22, 131-147.
Garber, C., Blissmer, B., Deschenes, M., Franklin, B., Lamonte, M., Lee, I., Nieman, D.,
& Swain, D. (2011). Quantity and quality of exercise for developing and
maintaining cardiorespiratory, musculoskeletal, and neuromotor fitness in
apparently healthy adults: Guidance for prescribing exercise. Medicine & Science
in Sports & Exercise, 1334-1359.
Gerodimos, V., Zafeiridis, A., Perkos, S., Dipla, K., Manou, V., & Kellis, S. (2008). The
contribution of stretch-shortening cycle and arm-swing to vertical jumping
performance in children, adolescents, and adult basketball players. Pediatric
Exercise Science, 20, 379-389.
Goss, D., Christopher, G., Faulk, R., & Moore, J. (2009). Functional training program
bridges rehabilitation and return to duty. Journal of Special Operations Medicine,
9(2), 29-48.
91
Gribble, P., Brigle, J., Pietrosimone, B., Pfile, K., & Webster, K. (2013). Intrarater
reliability of the Functional Movement Screen. Journal of Strength and
Conditioning Research, 27(4), 978-981.
Harman, E., Rosenstein, M., Frykman, P., & Rosenstein, R. (1990). The effects of arms
and countermovement on vertical jumping. Medicine and Science in Sports and
Exercise, 22(6), 825-833.
Hartmann, H., Wirth, K., Klusemann, M., Dalic, J., Matuschek, C., & Schmidtbleicher,
D. (2012). Influence of squatting depth on jumping performance. Journal of
Strength and Conditioning Research, 26(12), 3243-3261.
Hoffman, J., Tenenbaum, G., Maresh, C., & Kraemer, W. (1996). Relationship between
athletic performance tests and playing time in elite college basketball players.
Journal of Strength and Conditioning Research, 10(2), 67-71.
Kibler, W., Chandler, T., Uhl, T., & Maddux, R. (1989). The musculoskeletal approach
to the preparticipation physical examination. The American Journal of Sports
Medicine, 17(4), 525-531.
Kiesel, K., Plisky, P., & Voight, M. (2007). Can serious injury in professional football be
predicted by a preseason functional movement screen? North America Journal of
Sports Physical Therapy, 2(3), 147-158.
Kiesel, K., Plisky, P., & Butler, R. (2011). Functional movement test scores improve
following a standardized off-season intervention program in professional football
players. Scandinavian Journal of Medicine & Science in Sports, 21, 287-292.
Kritz, M., Cronin, J., & Hume, P. (2009). The bodyweight squat: a movement screen for
the squat pattern. National Strength and Conditioning Association, 31(1), 76-85.
Kubo, K., Kawakami, Y., & Fukunaga, T. (1999). Influence of elastic properties of
tendon structures of jump performance in humans. The American Physiology
Society, 2090-2096.

92
Kurokawa, S., Fukunaga, T., & Fukashiro, S. (2001). Behavior of fascicles and tendinous
structure of human gastrocnemius during vertical jumping. The Jouranal of
Applied Physiology, 90, 1349-1358.
Leard, J., Cirillo, M., Katsnelson, E., Kimiatek, D., Miller, T., Trebincevic, K., &
Garbalosa, J. (2007). Validity of two alternative systems for measuring vertical
jump height. Journal of Strength and Conditioning Research, 21(4), 1296-1299.
Lees, A., Jos, V., & De Clercq, D. (2004). The maximal and submaximal vertical jump:
implications for strength and conditioning. Journal of Strength and Conditioning
Research, 18(4), 787-791.
Lichtwark, G., & Wilson, A. (2005). Effects of series elasticity and activation conditions
on muscle power output and efficiency. The Journal of Experimental Biology,
208, 2845-2853.
Luebbers, P., Potteiger, J., Hulver, M., Thyfault, J., Carper, M., & Lockwood, R. (2003).
Effects of plyometric training and recovery on vertical jump performance and
anaerobic power. Journal of Strength and Conditioning Research, 17(4), 704-709.
Luhtanen, P., & Komi, P. (1980). Force-, power-, and elasticity-velocity relationships in
walking, running, and jumping. European Journal of Applied Physiology, 44,
279-289.
MacIntosh, B., & MacNaughton, M. (2005). The length dependence of muscle active
force: considerations for parallel elastic properties. Journal of Applied
Physiology, 1666-1673.
Markovic, G., Dizdar, D., Jukic, I., & Cardinale, M. (2004). Reliability and factorial
validity of squat and countermovement jump tests. Journal of Strength and
Conditioning Research, 18(3), 551-555.

93
Minick, K., Kiesel, K., Burton, L., Taylor, A., Plisky, P., & Butler, R. (2010). Interrater
reliability of the Functional Movement Screen. Journal of Strength and
Conditioning Research, 24(2), 479-486.
Moran, K., & Wallace, E. (2007). Eccentric loading and range of knee joint motion
effects on performance enhancement in vertical jumping. Human Movement
Science, 26, 824-840.
Nagano, A., Komura, T., & Fukashiro, S. (2004a). Effects of series elasticity of the
muscle tendon complex on an explosive activity performance with a counter
movement. Journal of Applied Biomechanics, 20, 85-94.
Nagano, A., Komura, T., & Fukashiro, S. (2004b). Effects of the length ratio between the
contractile element and the series elastic element on an explosive muscular
performance. Journal of Electromyography and Kinesiology, 14, 197-203.
Nuñez, V., Da Silva-Grigoletto, M., Castillo, E., Poblador, M., & Lancho, J. (2008).
Effects of training exercises for the development of strength and endurance in
soccer. Journal of Strength and Conditioning Research, 22(2), 518-523.
O'Connor, F., Deuster, P., Davis, J., Pappas, C., & Knapik, J. (2011). Functional
movement screening: predicting injuries in officer candidates. Medicine &
Science in Sports & Exercise, 2224-2230.
Okada, T., Huxel, K., & Nesser, T. (2011). Relationship between core stability,
functional movement, and performance. Journal of Strength and Conditioning
Research, 25(1), 252-261.
Onate, J., Dewey, T., Kollock, R., Thomas, K., Van Lunen, B., DeMaio, M., & Ringleb,
S. (2012). Real-time intersession and interrater reliability of the functional
movement screen. Journal of Strength and Conditioning Research, 26(2), 408-
415.

94
Parchmann, C., & McBride, J. (2011). Relationship between functional movement screen
and athletic performance. Journal of Strength and Conditioning Research, 25(12),
3378-3384.
Peate, W., Bates, G., Lunda, K., Francis, S., & Bellamy, K. (2007). Core strength: a new
model for injury prediction and prevention. Journal of Occupational Medicine
and Toxicology, 2(3)
Perry, F., & Koehle, M. (2013). Normative data for the Functional Movement Screen in
middle-aged adults. Journal of Strength and Conditioning Research, 27(2), 458-
462.
Salles, A., Baltzopoulos, V., & Rittweger, J. (2011). Differential effects of
countermovement magnitude and volitional effort on vertical jumping. European
Journal of Applied Physiology, 111, 441-448.
Schneiders, A., Davidsson, Å., Hörman, E., & Sullivan, S. (2011). Functional Movement
Screen™ normative values in a young, active population. The International
Journal of Sports Physical Therapy, 6(2), 75-82.
Shultz, R., Anderson, S., Matheson, G., Marcello, B., & Besier, T. (2013). Test-retest and
interrater reliability of the functional movement screen. Journal of Athletic
Training, 48(3), 331-336.
Smith, C., Chimera, N., Wright, N., & Warren, M. (2013). Interrater and intrarater
reliability of the Functional Movement Screen. Journal of Strength and
Conditioning Research, 27(4), 982-987.
Teyhen, D., Shaffer, S., Lorenson, C., Halfpap, J., Donofry, D., Walker, M., Dugan, J., &
Childs, J. (2012). The Functional Movement Screen: A reliability study. Journal
of Orthopaedic & Sports Physical Therapy, 42(6), 530-537.
Trimble, M., & Harp, S. (1998). Postexercise potentiation of the h-reflex in humans.
Medicine & Science in Sports & Exercise, 30(6), 933-941.
95
Tuite, D., Renström, P., & O'Brien, M. (1997). The aging tendon. Scandinavian Journal
of Medicine & Science in Sports, 7, 72-77.
Vanezis, A., & Lees, A. (2005). A biomechanical analysis of good and poor performers
on the vertical jump. Ergonomics, 48(11), 1594-1603.
Vanrenterghem, J., Lees, A., & De Clercq, D. (2008). Effect of forward trunk inclination
on joint power output in vertical jumping. Journal of Strength and Conditioning
Research, 22(3), 708-714.
Yamauchi, J., & Ishi, N. (2007). Relations between force-velocity characteristics of the
knee-hip extension movement and vertical jump performance. Journal of Strength
and Conditioning Research, 21(3), 703-709.
Young, W., & Behm, D. (2003). Effects of running, static stretching and practice jumps
on explosive force production and jumping performance. Journal of Sports
Medicine and Physical Fitness, 43(1), 21-27.

96
APPENDICES

97
APPENDIX A
Recruitment Flyer

98
PARTICIPANTS NEEDED!
A study investigating the relationship between the Functional Movement Screen™ (FMS™) and peak counter movement jump height is being conducted by researchers in
the Human Performance & Sport Physiology Lab PAV 365
• Eligible Participants Include: o MALES between 18-30 years of age. o Individuals who:
� Engage in regular exercise (e.g., 150 minutes/ week of moderate or 75 minutes/ week of vigorous exercise).
� Are not a member of a competitive, elite level sports team (e.g., UWM athletics team).
� Are not taking prescribed medication for a symptomatic illness, have not had an injury, surgery, or bone abnormalities on their knees, hips, or ankles, have not had recent (one year) physical rehabilitation, do not have a heart condition or any chest pain, do not suffer from dizziness, do not have prior experience with the Functional Movement Screen™ (FMS™) and/or do not have hearing impairments.
� Must have a BMI less than 30 • This study will take place over two total testing sessions. Estimated total
commitment time is 1.5 – 2 hours. Approximately 45 minutes per day. • Participants will perform a series of 7 movement screen tests including a Deep
Squat, Hurdle Step, In-line Lunge, Shoulder Mobility, Active Straight Leg Raise, Trunk Stability Push Up, and a Rotary Stability test.
• Participants will perform a counter movement jump (vertical jump) and researchers will measure various performance variables.
• This study is completely non-invasive & no side effects/injuries are expected.
Please contact Josh Conlon ([email protected]) if you are interested in participating. All testing sessions will be held in the Human Performance & Sport Physiology Lab in Room 365 of the Pavilion.
Fu
nct
ion
al M
ove
men
t S
cree
n S
tud
y
Josh
K. C
onlo
n jk
conl
on@
uwm
.edu
Fu
nct
ion
al M
ove
men
t S
cree
n S
tud
y
Josh
K. C
onlo
n jk
conl
on@
uwm
.edu
Fu
nct
ion
al M
ove
men
t S
cree
n S
tud
y
Josh
K. C
onlo
n jk
conl
on@
uwm
.edu
Fu
nct
ion
al M
ove
men
t S
cree
n S
tud
y
Josh
K. C
onlo
n jk
conl
on@
uwm
.edu
Fu
nct
ion
al M
ove
men
t S
cree
n S
tud
y
Josh
K. C
onlo
n jk
conl
on@
uwm
.edu
Fu
nct
ion
al M
ove
men
t S
cree
n S
tud
y Jo
sh K
. Con
lon
jkco
nlon
@uw
m.e
du
Fu
nct
ion
al M
ove
men
t S
cree
n S
tud
y
Josh
K. C
onlo
n jk
conl
on@
uwm
.edu

99
APPENDIX B
Description of Testing Protocol
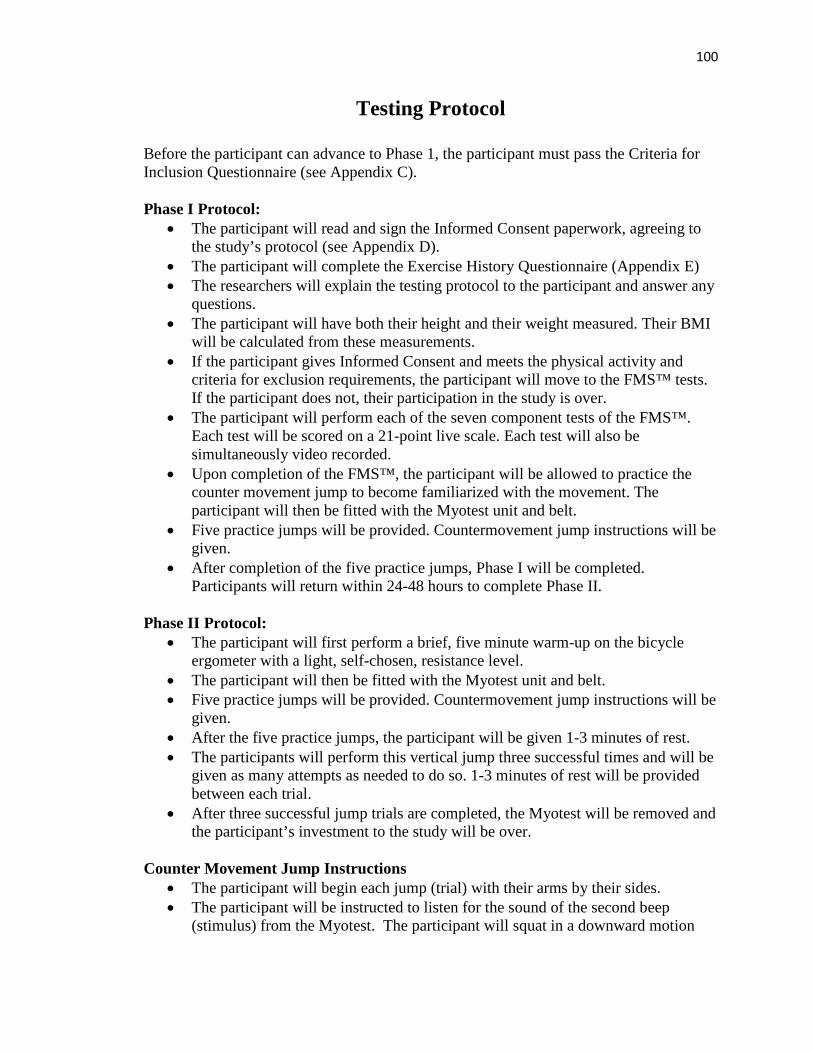
100
Testing Protocol
Before the participant can advance to Phase 1, the participant must pass the Criteria for Inclusion Questionnaire (see Appendix C). Phase I Protocol:
• The participant will read and sign the Informed Consent paperwork, agreeing to the study’s protocol (see Appendix D).
• The participant will complete the Exercise History Questionnaire (Appendix E) • The researchers will explain the testing protocol to the participant and answer any
questions. • The participant will have both their height and their weight measured. Their BMI
will be calculated from these measurements. • If the participant gives Informed Consent and meets the physical activity and
criteria for exclusion requirements, the participant will move to the FMS™ tests. If the participant does not, their participation in the study is over.
• The participant will perform each of the seven component tests of the FMS™. Each test will be scored on a 21-point live scale. Each test will also be simultaneously video recorded.
• Upon completion of the FMS™, the participant will be allowed to practice the counter movement jump to become familiarized with the movement. The participant will then be fitted with the Myotest unit and belt.
• Five practice jumps will be provided. Countermovement jump instructions will be given.
• After completion of the five practice jumps, Phase I will be completed. Participants will return within 24-48 hours to complete Phase II.
Phase II Protocol:
• The participant will first perform a brief, five minute warm-up on the bicycle ergometer with a light, self-chosen, resistance level.
• The participant will then be fitted with the Myotest unit and belt. • Five practice jumps will be provided. Countermovement jump instructions will be
given. • After the five practice jumps, the participant will be given 1-3 minutes of rest. • The participants will perform this vertical jump three successful times and will be
given as many attempts as needed to do so. 1-3 minutes of rest will be provided between each trial.
• After three successful jump trials are completed, the Myotest will be removed and the participant’s investment to the study will be over.
Counter Movement Jump Instructions
• The participant will begin each jump (trial) with their arms by their sides. • The participant will be instructed to listen for the sound of the second beep
(stimulus) from the Myotest. The participant will squat in a downward motion

101
and propel themselves upward, and jump off the ground as high and as fast as they can, with their hands remaining on their hips.
• A trial will be considered unsuccessful and will be subsequently discarded if: o The participant starts their movement before the proper stimulus (false
start) o The participant initial movement of their arms is forward. o The Myotest unit cannot properly assess the trial

102
APPENDIX C
Criteria for Exclusion
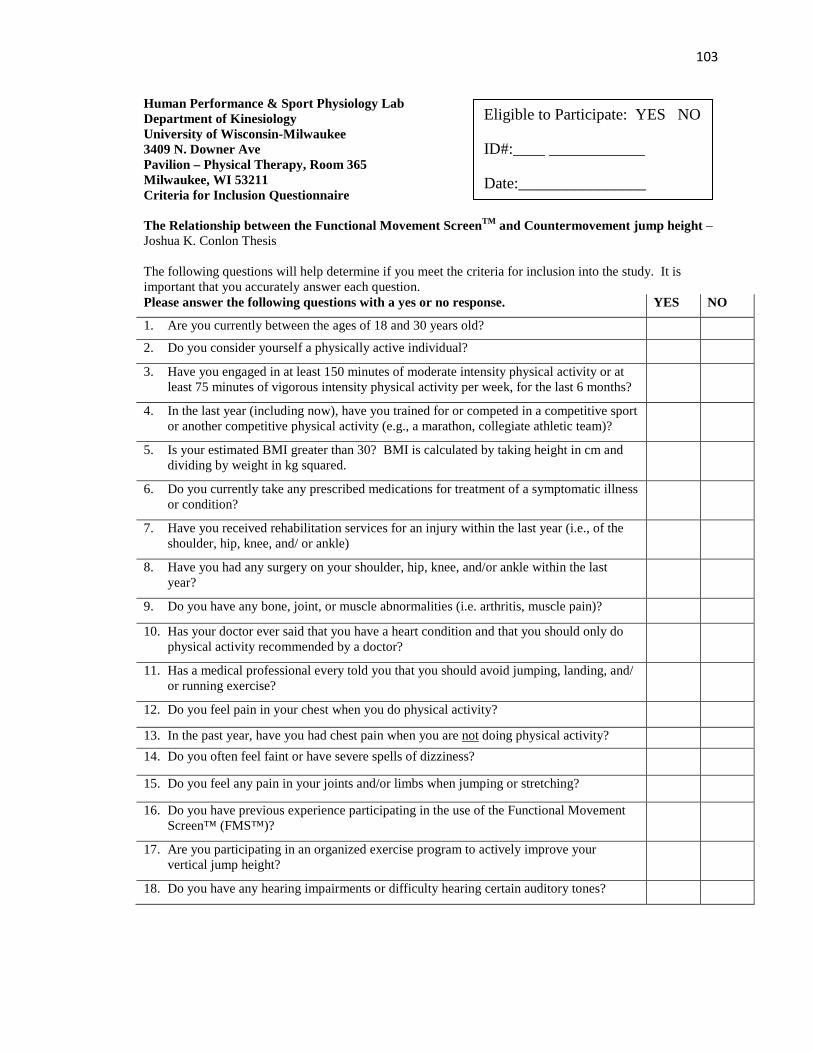
103
Human Performance & Sport Physiology Lab Department of Kinesiology University of Wisconsin-Milwaukee 3409 N. Downer Ave Pavilion – Physical Therapy, Room 365 Milwaukee, WI 53211 Criteria for Inclusion Questionnaire The Relationship between the Functional Movement ScreenTM and Countermovement jump height – Joshua K. Conlon Thesis The following questions will help determine if you meet the criteria for inclusion into the study. It is important that you accurately answer each question. Please answer the following questions with a yes or no response. YES NO
1. Are you currently between the ages of 18 and 30 years old?
2. Do you consider yourself a physically active individual?
3. Have you engaged in at least 150 minutes of moderate intensity physical activity or at least 75 minutes of vigorous intensity physical activity per week, for the last 6 months?
4. In the last year (including now), have you trained for or competed in a competitive sport or another competitive physical activity (e.g., a marathon, collegiate athletic team)?
5. Is your estimated BMI greater than 30? BMI is calculated by taking height in cm and dividing by weight in kg squared.
6. Do you currently take any prescribed medications for treatment of a symptomatic illness or condition?
7. Have you received rehabilitation services for an injury within the last year (i.e., of the shoulder, hip, knee, and/ or ankle)
8. Have you had any surgery on your shoulder, hip, knee, and/or ankle within the last year?
9. Do you have any bone, joint, or muscle abnormalities (i.e. arthritis, muscle pain)?
10. Has your doctor ever said that you have a heart condition and that you should only do physical activity recommended by a doctor?
11. Has a medical professional every told you that you should avoid jumping, landing, and/ or running exercise?
12. Do you feel pain in your chest when you do physical activity?
13. In the past year, have you had chest pain when you are not doing physical activity?
14. Do you often feel faint or have severe spells of dizziness?
15. Do you feel any pain in your joints and/or limbs when jumping or stretching?
16. Do you have previous experience participating in the use of the Functional Movement Screen™ (FMS™)?
17. Are you participating in an organized exercise program to actively improve your vertical jump height?
18. Do you have any hearing impairments or difficulty hearing certain auditory tones?
Eligible to Participate: YES NO
ID#:____ ____________
Date:________________

104
APPENDIX D
Informed Consent Document

105
UNIVERSITY OF WISCONSIN – MILWAUKEE CONSENT TO PARTICIPATE IN RESEARCH
1. General Information
Study title: The Relationship between the Functional Movement ScreenTM and Countermovement jump height
Person in Charge of Study (Principal Investigator): Kyle T. Ebersole, Ph.D., LAT (PI/Adviser) Associate Professor, Department of Kinesiology College of Health Sciences Joshua K. Conlon, B.S., CSCS (Thesis) Masters of Kinesiology Graduate Student, Department of Kinesiology College of Health Sciences
2. Study Description
You are being asked to participate in a research study. Your participation is completely voluntary. You do not have to participate if you do not want to. Study description: The primary purpose of the proposed study is to determine the relationship between a Functional Movement Screen™ (FMS™) total score, scored on a 100-point and 21-point scale, and peak countermovement jump (CMJ, which is like a vertical jump) height. The secondary purpose of this proposed study is to perform an exploratory analysis examining the validity of the 21-point live scoring method as well as a 21-point video scoring method of the FMS™. This will be accomplished by examining the differences in various physiological measurements (i.e., height and weight) and FMS™ scores. It is possible that how well someone can move may be related to how well they can perform the jump task. The goal of this study is to examine the possible relationship between the FMS™ (a test of how well someone can move) and CMJ peak height by using a more detailed scale of measurement when scoring the FMS™. All activities in this study will take place in the Human Performance & Sport Physiology Laboratory (HPSPL) located in Room 365 of the Pavilion. This study will take place over the course of two days. Participants will be recruited until a total of 60 have completed all tests through the two days. The 60 participants will all be males between the ages of 18 to 30 and have a BMI (body mass index) of less than 30. Participants will be recreationally active, but not currently training for or competing in a competitive sport (e.g., a NCAA Division I sport) or activity (e.g., a marathon). The time commitment for participants will depend on how far they advance through the study’s phases. On Day 1 the participants will complete all required paperwork such as the Consent Form and the Exercise History Questionnaire. This is expected to last 10-15 minutes. Day 1 will then include height and weight measurements. Body mass index (BMI) will be calculated from this data. Participants will then be introduced to the FMS™ and
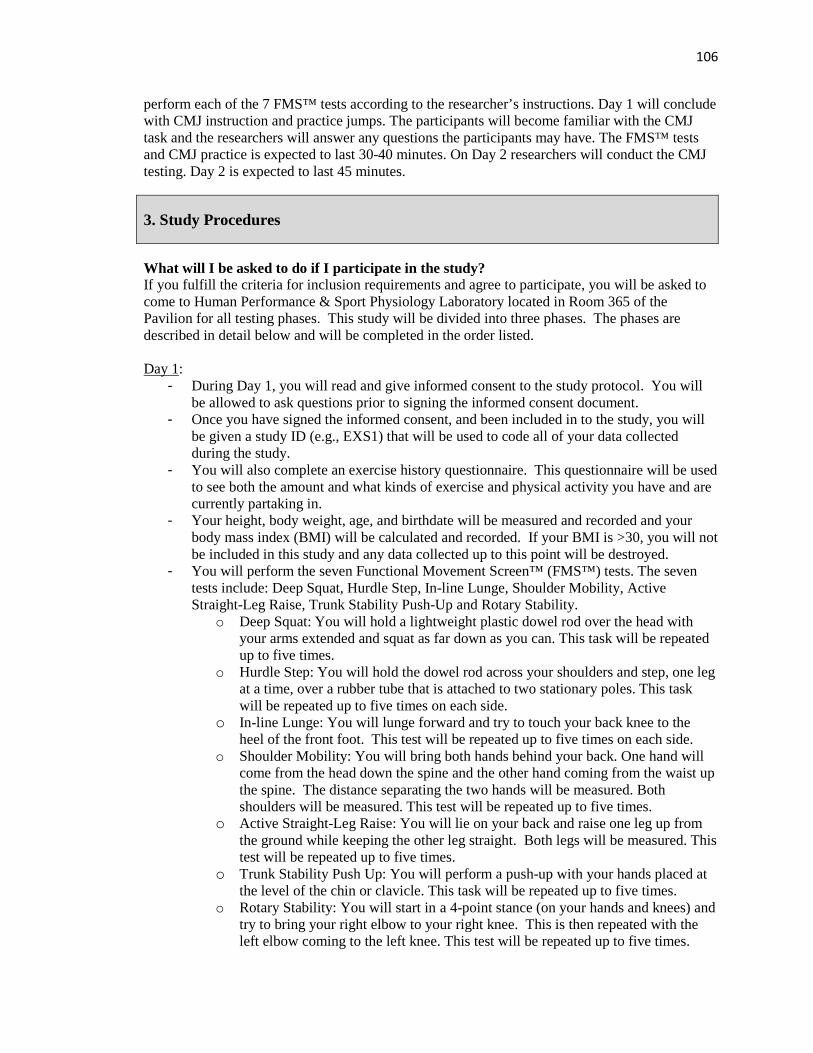
106
perform each of the 7 FMS™ tests according to the researcher’s instructions. Day 1 will conclude with CMJ instruction and practice jumps. The participants will become familiar with the CMJ task and the researchers will answer any questions the participants may have. The FMS™ tests and CMJ practice is expected to last 30-40 minutes. On Day 2 researchers will conduct the CMJ testing. Day 2 is expected to last 45 minutes.
3. Study Procedures
What will I be asked to do if I participate in the study? If you fulfill the criteria for inclusion requirements and agree to participate, you will be asked to come to Human Performance & Sport Physiology Laboratory located in Room 365 of the Pavilion for all testing phases. This study will be divided into three phases. The phases are described in detail below and will be completed in the order listed. Day 1:
- During Day 1, you will read and give informed consent to the study protocol. You will be allowed to ask questions prior to signing the informed consent document.
- Once you have signed the informed consent, and been included in to the study, you will be given a study ID (e.g., EXS1) that will be used to code all of your data collected during the study.
- You will also complete an exercise history questionnaire. This questionnaire will be used to see both the amount and what kinds of exercise and physical activity you have and are currently partaking in.
- Your height, body weight, age, and birthdate will be measured and recorded and your body mass index (BMI) will be calculated and recorded. If your BMI is >30, you will not be included in this study and any data collected up to this point will be destroyed.
- You will perform the seven Functional Movement Screen™ (FMS™) tests. The seven tests include: Deep Squat, Hurdle Step, In-line Lunge, Shoulder Mobility, Active Straight-Leg Raise, Trunk Stability Push-Up and Rotary Stability.
o Deep Squat: You will hold a lightweight plastic dowel rod over the head with your arms extended and squat as far down as you can. This task will be repeated up to five times.
o Hurdle Step: You will hold the dowel rod across your shoulders and step, one leg at a time, over a rubber tube that is attached to two stationary poles. This task will be repeated up to five times on each side.
o In-line Lunge: You will lunge forward and try to touch your back knee to the heel of the front foot. This test will be repeated up to five times on each side.
o Shoulder Mobility: You will bring both hands behind your back. One hand will come from the head down the spine and the other hand coming from the waist up the spine. The distance separating the two hands will be measured. Both shoulders will be measured. This test will be repeated up to five times.
o Active Straight-Leg Raise: You will lie on your back and raise one leg up from the ground while keeping the other leg straight. Both legs will be measured. This test will be repeated up to five times.
o Trunk Stability Push Up: You will perform a push-up with your hands placed at the level of the chin or clavicle. This task will be repeated up to five times.
o Rotary Stability: You will start in a 4-point stance (on your hands and knees) and try to bring your right elbow to your right knee. This is then repeated with the left elbow coming to the left knee. This test will be repeated up to five times.

107
- The researchers will then verbally explain the directions of the counter movement jump (CMJ) task that will be used during Day 2 of this study (see below). You will be given an opportunity to practice the CMJ five times while wearing the belt.
- For these practice trials, you will be fitted with the MyoTest SPORT unit and belt. The MyoTest SPORT unit is a small device that will measure the height, jump force, work output, and velocity of each of your CMJ trials. This device is attached to a belt that you will have around your waist.
- The researchers ask that you refrain from smoking (or any other tobacco product) and caffeine intake the four hours preceding Day 2, as well as any heavy resistance training the 48 hours preceding Day 2.
- The total time to complete the activities for Day 1 will be approximately 45 minutes. Day 2:
- During Day 2, you will first perform a brief, five minute warm-up on a stationary exercise bicycle with a light, self-selected, resistance level.
- You will put on the MyoTest belt and accelerometer and perform five practice jumps abiding by the CMJ instructions from Day 1.
o CMJ Instructions: � You will begin each jump (trial) with your arms resting at your sides.
Your feet will be shoulder width apart. � You will listen for the sound of the beep (stimulus) from the MyoTest
SPORT unit. � You will squat in a downward motion while swinging your arms
backward. Once at the bottom of your squat, you will then immediately jump up as fast as you can, swinging your arms upward.
� You are encouraged to land each jump trial with bent knees. - The MyoTest SPORT unit will be active during the practice trials to make sure that it is
recording properly. The researchers will also confirm that you are using correct form during the CMJ.
- You will then be given 1-3 minutes of rest before the data collection trials. - You will perform CMJ trials until three successful CMJ trials are recorded. The
researchers will record information from the MyoTest between each successful trial. A trial will be considered unsuccessful if: you start your movement before the MyoTest signals for you to start (false start), the MyoTest SPORT unit cannot properly measure the trial, or if the MyoTest SPORT unit is bumped or knocked off during the trial.
- After three successful trials are recorded, the MyoTest SPORT unit will be removed and your commitment to this study will be over.
- The total time to complete the activities for Day 1 will be approximately 45 minutes. Video Recording Your FMSTM testing will be video recorded on an iPad. The video files will be scored at a later point to create the 100-point score as well as to re-score the test on a 21-point scale. This will allow for comparisons between the two different scale types for the FMSTM. All video files will be removed from the iPad device and stored according to your initials on a protected laptop to prevent a linking of this identifiable information to all other data that will be stored according to your study ID code. The video files will be used by the researchers only to link score the FMS test.
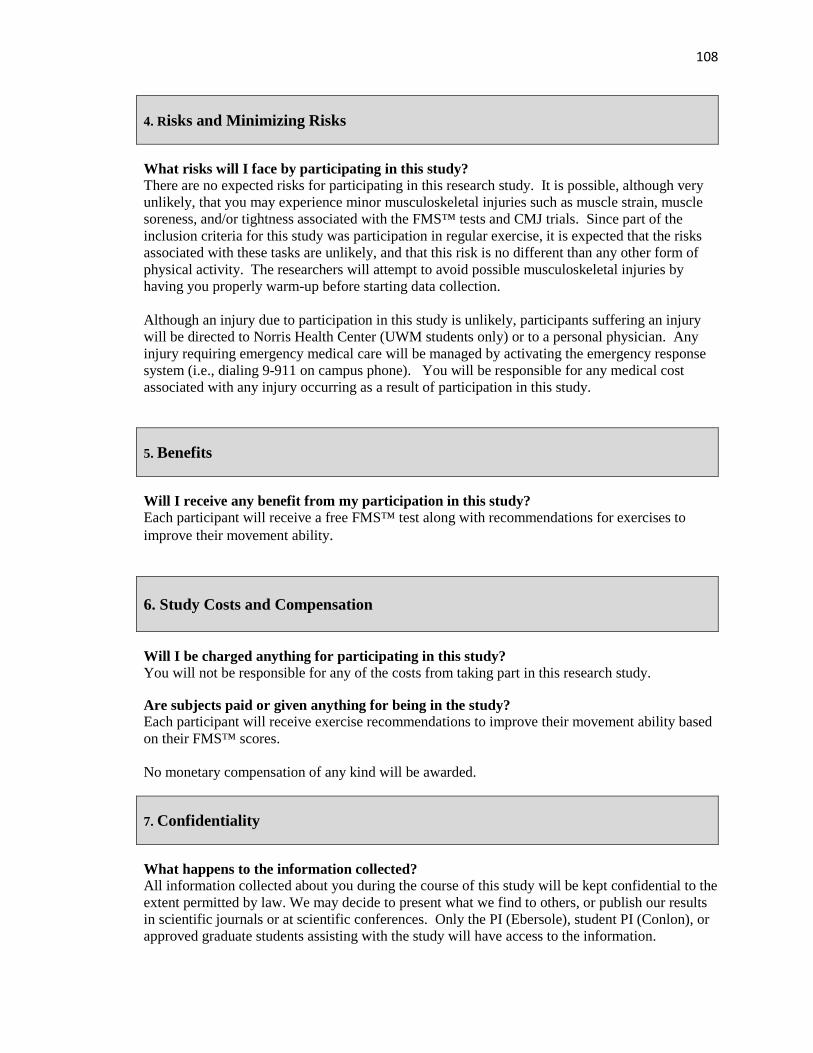
108
4. Risks and Minimizing Risks
What risks will I face by participating in this study? There are no expected risks for participating in this research study. It is possible, although very unlikely, that you may experience minor musculoskeletal injuries such as muscle strain, muscle soreness, and/or tightness associated with the FMS™ tests and CMJ trials. Since part of the inclusion criteria for this study was participation in regular exercise, it is expected that the risks associated with these tasks are unlikely, and that this risk is no different than any other form of physical activity. The researchers will attempt to avoid possible musculoskeletal injuries by having you properly warm-up before starting data collection. Although an injury due to participation in this study is unlikely, participants suffering an injury will be directed to Norris Health Center (UWM students only) or to a personal physician. Any injury requiring emergency medical care will be managed by activating the emergency response system (i.e., dialing 9-911 on campus phone). You will be responsible for any medical cost associated with any injury occurring as a result of participation in this study.
5. Benefits
Will I receive any benefit from my participation in this study? Each participant will receive a free FMS™ test along with recommendations for exercises to improve their movement ability.
6. Study Costs and Compensation
Will I be charged anything for participating in thi s study? You will not be responsible for any of the costs from taking part in this research study. Are subjects paid or given anything for being in the study? Each participant will receive exercise recommendations to improve their movement ability based on their FMS™ scores. No monetary compensation of any kind will be awarded.
7. Confidentiality
What happens to the information collected? All information collected about you during the course of this study will be kept confidential to the extent permitted by law. We may decide to present what we find to others, or publish our results in scientific journals or at scientific conferences. Only the PI (Ebersole), student PI (Conlon), or approved graduate students assisting with the study will have access to the information.

109
However, the Institutional Review Board at UW-Milwaukee or appropriate federal agencies like the Office for Human Research Protections may review this study’s records. Information used to personally identify you will be collected (name and contact info) for this project and will only be used to contact you during this study. This information will not be used in the data analysis, nor will it be released to others. Your identity will be kept confidential, except as might be required by law. You will be given a study ID code (i.e., EXS1) that will be used to code all of your data collected during the study. An identity key file containing your name, study ID code, and contact information will be stored (in a locked file in the Human Performance & Sport Physiology Laboratory in PAV 365) separate from all collected data for the purpose of contacting you during the study. All experimental data and associated questionnaires will be stored in a file based on your unique study ID code (i.e., EXS1) and separate from any personally identifying contact information. At no time will the coded data files include names or
contact information. The video files will only be stored on an encrypted laptop according to your initials as a way to prevent someone not associated with this study from linking this identifiable information to all other data that will be stored according to your study ID code. Upon conclusion of the study, the video files will be destroyed. It is possible that a portion of your FMS video will be retained by the researchers as an exemplar to demonstrate how movement was related to jumping performance. In this case, if your video is used as an exemplar, all identifying information (i.e., face) will be removed before it is shared.
Results obtained from this research study will be disseminated in journal articles and scientific meetings. The data will be stored in a locked file cabinet in PAV 365 for 10 years for future use.
8. Alternatives
Are there alternatives to participating in the study? There are no known alternatives available to you other than not taking part in this study
9. Voluntary Participation and Withdrawal
What happens if I decide not to be in this study? Your participation in this study is entirely voluntary. You may choose not to take part in this study. If you decide to take part, you can change your mind later and withdraw from the study. You are free to not answer any questions or withdraw at any time. Your decision will not change any present or future relationships with the University of Wisconsin Milwaukee. If you voluntarily withdraw or are withdrawn from the study prior to its completion, we will use the information collected to that point. Withdrawal from the study prior to your commitment

110
being completed will result in no extra credit awarded. Withdrawal from the study will in no way affect your class standing as a student at UW-Milwaukee.
10. Questions
Who do I contact for questions about this study? For more information about the study or the study procedures or treatments, or to withdraw from the study, contact:
Joshua K. Conlon Masters of Kinesiology Graduate Student College of Health Sciences Dept. of Kinesiology PAV – PT, Room 375 [email protected] or Kyle T. Ebersole, Ph.D. College of Health Sciences Dept. of Kinesiology PAV – PT, Room 356 (414) 229-6717 [email protected]
Who do I contact for questions about my rights or complaints towards my treatment as a research subject? The Institutional Review Board may ask your name, but all complaints are kept in confidence.
Institutional Review Board Human Research Protection Program Department of University Safety and Assurances University of Wisconsin – Milwaukee P.O. Box 413 Milwaukee, WI 53201 (414) 229-3173
11. Signatures
Research Subject’s Consent to Participate in Research: To voluntarily agree to take part in this study, you must sign on the line below. If you choose to take part in this study, you may withdraw at any time. You are not giving up any of your legal rights by signing this form. Your signature below indicates that you have read or had read to you this entire consent form, including the risks and benefits, and have had all of your questions answered, and that you are 18 years of age or older. ________________________________________________

111
Printed Name of Subject/ Legally Authorized Representative ________________________________________________ ______________________ Signature of Subject/Legally Authorized Representative Date Principal Investigator (or Designee) I have given this research subject information on the study that is accurate and sufficient for the subject to fully understand the nature, risks and benefits of the study. ________________________________________________ ______________________ Printed Name of Person Obtaining Consent Study Role ________________________________________________ ______________________ Signature of Person Obtaining Consent Date

112
APPENDIX E
Exercise History Questionnaire

113
Human Performance & Sport Physiology Laboratory University of Wisconsin-Milwaukee
Exercise History Questionnaire
Participant ID Code: __________ Date: __________ 1. In the last 6 months, how many days a week have you spent 30 minutes or more in moderate
to strenuous exercise?
0 1 2 3 4 5 6 7 2. If you have been exercising, what activity have you done most often?
Walk Swim Dance Bike Run Other 3. If you answered Other for question 2, what is the primary other activity that you have
done? 4. If you have been exercising, how long (minutes) has each exercise session been?
Less than 5 5-19 20-30 More than 30 5. If you have been exercising, would you say the intensity has been:
Easy Moderate Somewhat Hard Hard 6. If you have never exercised or are no longer exercising, what is your main reason? 7. Have you (or are you currently) trained/competed for a sport or other competitive physical activity (e.g., a marathon) in the last year? Yes No
8. Did you compete in an organized, competitive sport at one point of your life? Yes No
9. If yes for Question 8, what type of sport and what position (or event) did you play (if
applicable)?
114
Sport: _________________________________________________________________ Position: _______________________________________________________________
10. Do you frequently lift moderately heavy objects as part of your daily activities? Yes No
11. Do you frequently climb stairs as part of your daily activities?
Yes No
12. Do you regularly engage in informal physical activities?
Yes No
a. If you circled Yes for question 12, please specify:

115
APPENDIX F
Institutional Review Board Protocol Summary

116
IRBManager Protocol Form
Instructions: Each Section must be completed unless directed otherwise. Incomplete forms will delay the IRB review process and may be returned to you. Enter your information in the colored boxes or place an “X” in front of the appropriate response(s). If the question does not apply, write “N/A.”
SECTION A: Title
A1. Full Study Title:
SECTION B: Study Duration
B1. What is the expected start date? Data collection, screening, recruitment, enrollment, or consenting activities may not begin until IRB approval has been granted. Format: 07/05/2011
Upon IRB approval
B2. What is the expected end date? Expected end date should take into account data analysis, queries, and paper write-up. Format: 07/05/2014
8/20/2014
SECTION C: Summary
The Relationship between the Functional Movement ScreenTM and Countermovement jump height.

117
C1. Write a brief descriptive summary of this study in Layman Terms (non-technical language):
Pre-participation screening has become a staple in the evaluation of athletes and exercises. One reliable pre-participation screening tool (Minick et al., 2010; Onate et al., 2012; Teyhen et al., 2012) that has been used to identify injury risk on a number of athletic populations (Chorba et al, 2010; Goss et al, 2009; Kiesel et al, 2007; Kiesel et al, 2009; O’Connor et al, 2011; Peate et al, 2007) is the Functional Movement ScreenTM (FMS™). The FMS™ is a series of seven movement tests that are designed to measure the balance between mobility and stability by putting participants in positions representing fundamental movement patterns (Cook et al., 2006a; Cook et al., 2006b). The literature has shown a relationship between total FMS™ score and injury risk through an established “cut-off” score of ≤14 (Kiesel et al., 2007). The “cut-off” score has been used in pre-participation screening to clear an athlete for sport-participation.
In the performance literature, there are a variety of athletic tests that can indicate task-specific performance. Vertical jump performance tests are commonly used as athletic performance markers in athletic populations as a method of measuring power, strength, and speed (Aragon-Vargas, 2000; Luebbers et al., 2003). Specifically, one method of vertical jumping reflects sport-specific power, strength and speed is the countermovement jump (CMJ) (Cronin & Hansen, 2005; Hori et al., 2008; Vanezis & Lees, 2005). CMJ has been shown to relate to 1RM (repetition max) hang clean (Hori et al., 2008) indicating that CMJ performance may indicate performance in a sport that requires power and/ or strength. CMJ has also been shown to be an indicator of speed performance. In a study that compared a variety of power tasks, CMJ was shown to have the highest correlation to a 40-yard dash time (Cronin & Hansen, 2005).
The evaluation methods of interest in this study are the FMS™ and countermovement jump (CMJ) testing for injury risk assessment and athletic performance, respectively.
Previous literature has studied that relationship between the FMS™ and athletic performance without success (Okada et al., 2011; Parchmann & McBride, 2011). This literature has used the traditional 21-point FMS™ scoring method when studying the relationship between functional movement and jump height. In this proposed study, a 100-point scoring method (Butler et al., 2012) will be used to increase the specificity of the seven FMS™ tests.
C2. Describe the purpose/objective and the significance of the research:
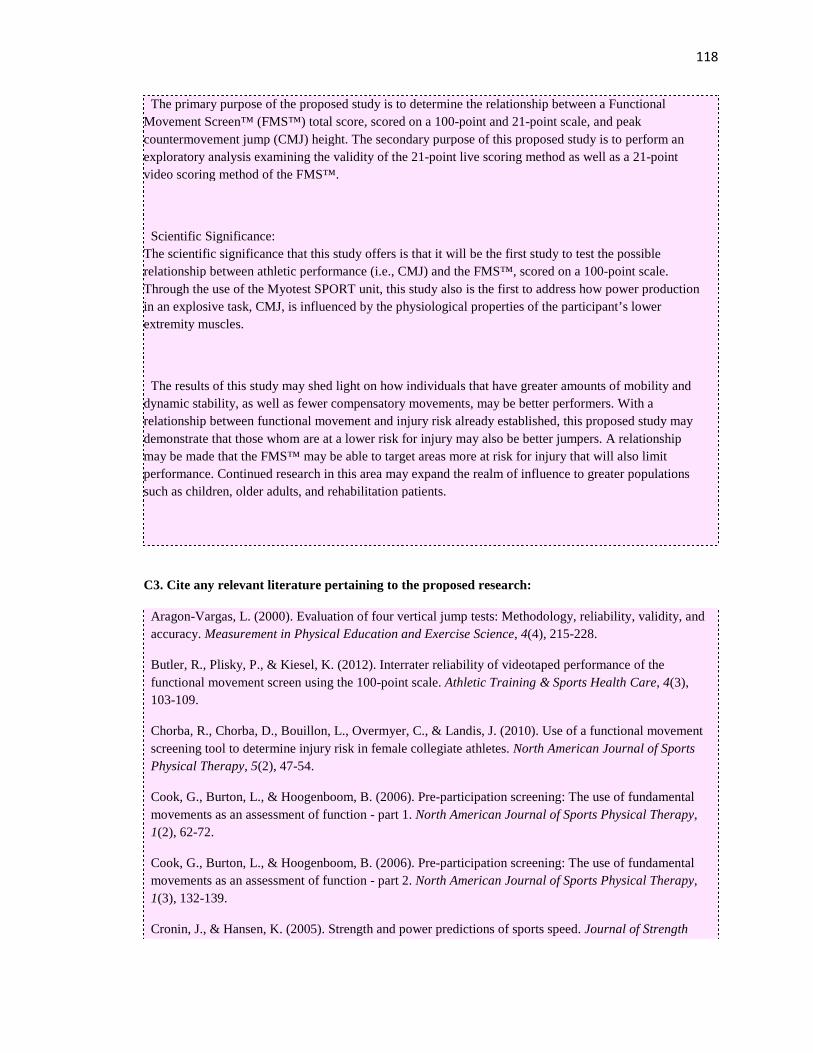
118
The primary purpose of the proposed study is to determine the relationship between a Functional Movement Screen™ (FMS™) total score, scored on a 100-point and 21-point scale, and peak countermovement jump (CMJ) height. The secondary purpose of this proposed study is to perform an exploratory analysis examining the validity of the 21-point live scoring method as well as a 21-point video scoring method of the FMS™.
Scientific Significance: The scientific significance that this study offers is that it will be the first study to test the possible relationship between athletic performance (i.e., CMJ) and the FMS™, scored on a 100-point scale. Through the use of the Myotest SPORT unit, this study also is the first to address how power production in an explosive task, CMJ, is influenced by the physiological properties of the participant’s lower extremity muscles.
The results of this study may shed light on how individuals that have greater amounts of mobility and dynamic stability, as well as fewer compensatory movements, may be better performers. With a relationship between functional movement and injury risk already established, this proposed study may demonstrate that those whom are at a lower risk for injury may also be better jumpers. A relationship may be made that the FMS™ may be able to target areas more at risk for injury that will also limit performance. Continued research in this area may expand the realm of influence to greater populations such as children, older adults, and rehabilitation patients.
C3. Cite any relevant literature pertaining to the proposed research:
Aragon-Vargas, L. (2000). Evaluation of four vertical jump tests: Methodology, reliability, validity, and accuracy. Measurement in Physical Education and Exercise Science, 4(4), 215-228.
Butler, R., Plisky, P., & Kiesel, K. (2012). Interrater reliability of videotaped performance of the functional movement screen using the 100-point scale. Athletic Training & Sports Health Care, 4(3), 103-109.
Chorba, R., Chorba, D., Bouillon, L., Overmyer, C., & Landis, J. (2010). Use of a functional movement screening tool to determine injury risk in female collegiate athletes. North American Journal of Sports Physical Therapy, 5(2), 47-54.
Cook, G., Burton, L., & Hoogenboom, B. (2006). Pre-participation screening: The use of fundamental movements as an assessment of function - part 1. North American Journal of Sports Physical Therapy, 1(2), 62-72.
Cook, G., Burton, L., & Hoogenboom, B. (2006). Pre-participation screening: The use of fundamental movements as an assessment of function - part 2. North American Journal of Sports Physical Therapy, 1(3), 132-139.
Cronin, J., & Hansen, K. (2005). Strength and power predictions of sports speed. Journal of Strength

119
and Conditioning Research, 19(2), 349-357.
Goss, D., Christopher, G., Faulk, R., & Moore, J. (2009). Functional training program bridges rehabilitation and return to duty. Journal of Special Operations Medicine, 9(2), 29-48.
Hori, N., Newton, R., Andrews, W., Kawamori, N., McGuigan, M., & Nosaka, K. (2008). Does performance of hang power clean differentiate performance of jumping, sprinting, and changing of direction?. Journal of Strength and Conditioning Research, 22(2), 412-418.
Kiesel, K., Plisky, P., & Voight, M. (2007). Can serious injuryin professional football be predicted by a preseason functional movement screen?. North American Journal of Sports Physical Therapy, 2(3), 147-158.
Kiesel, K., Plisky, P., & Butler, R. (2011). Functional movement test scores improve following a standarized off-season intervention program in professional football. Scandinavian Journal of Medicine & Science in Sports, 287-292.
Luebbers, P., Potteiger, J., Hulver, M., Thyfault, J., Carper, M., & Lockwood, R. (2003). Effects of plyometric training and recovery on vertical jump performance and anaerobic power. Journal of Strength and Conditioning Research, 17(4), 704-709.
Minick, K., Kiesel, K., Burton, L., Taylor , A., Plisky, P., & Butler, R. (2010). Interrater reliability of the functional movement screen. Journal of Strength and Conditioning Research, 24(2), 479-486.
O'Connor , F., Deuster, P., Davis, J., Pappas, C., & Knapik, J. (2011). Functional movement screening: Predicting injuries in officer candidates. Journal of the American College of Sports Medicine, 2224-2230.
Okada, T., Huxel , K., & Nesser, T. (2011). Relationship between core stability, functional movement, and performance. Journal of Strength and Conditioning Research, 25(1), 252-261.
Onate, J., Dewey, T., Kollock, R., Thomas, K., Van Lunen, B., DeMaio, M., & Ringleb, S. (2012). Real-time intersession and interrater reliability of the functional movement screen. Journal of Strength and Conditioning Research, 26(2), 408-413.
Parchmann, C., & McBride, J. (2011). Relationship between functional movement screen and athletic performance. Journal of Strength and Conditioning Research, 25(12), 3378-3384.
Peate, W., Bates, G., Lunda, K., Francis, S., & Bellamy, K. (2007). Core strength: A new model for injury prediction and preventino. Journal of Occupational Medicine and Toxicology, 2(3),
Teyhen, D., Shaffer, S., Lorenson, C., Halfpap, J., Donofry, D., Walker, M., Dugan, J., & Childs, J. (2012). The functional movement screen: A reliability study. Journal of Orthopedic & Sports Physical Therapy, 42(6), 530-538.
SECTION D: Subject Population
Section Notes…
• D1. If this study involves analysis of de-identified data only (i.e., no human subject interaction),

120
IRB submission/review may not be necessary. Visit the Pre-Submission section in the IRB website for more information.
D1. Identify any population(s) that you will be specifically targeting for the study. Check all that apply: (Place an “X” in the column next to the name of the special population.)
Not Applicable (e.g., de-identified datasets) Institutionalized/ Nursing home residents recruited in the nursing home
X UWM Students of PI or study staff Diagnosable Psychological Disorder/Psychiatrically impaired
XNon-UWM students to be recruited in their educational setting, i.e. in class or at school
Decisionally/Cognitively Impaired
UWM Staff or Faculty Economically/Educationally Disadvantaged
Pregnant Women/Neonates Prisoners
Minors under 18 and ARE NOT wards of the State Non-English Speaking
Minors under 18 and ARE wards of the State Terminally ill
X Other (Please identify): UWM students that are not students of the PI or study staff
D2. Describe the subject group and enter the total number to be enrolled for each group. For
example: teachers-50, students-200, parents-25, parent’s children-25, student control-30, student
experimental-30, medical charts-500, dataset of 1500, etc. Enter the total number of subjects below.
Describe subject group: Number:
Males between 18-30 yrs of age 60
TOTAL # OF SUBJECTS: 60
TOTAL # OF SUBJECTS (If UWM is a collaborating site):

121
D3. List any major inclusion and exclusion criteria (e.g., age, gender, health status/condition, ethnicity, location, English speaking, etc.) and state the justification for the inclusion and exclusion:
Participants must be males between the ages of 18-30. Participants will be included based on their self-reported responses to the Criteria for Inclusion Questionnaire. Recruitment will continue until 60 participants have been completed the study.
All participants will be screened with the Criteria for Inclusion Questionnaire which includes specific questions regarding lower extremity injuries and possible contraindications to physical activity. Participants will be excluded if they are taking prescribed medication for a symptomatic illness, had an injury, surgery, or bone abnormalities on their knees, hips, or ankles, have a heart condition or any chest pain, suffer from dizziness, have hearing impairments, are currently or have trained or competed in a competitive sport (e.g., Division I sports team) or physical activity (e.g., a marathon) in the last year, have previous experience with the FMS™, have a body mass index (BMI) greater than 30, or do not meet the minimum requirements of physical activity as described by the American College of Sports Medicine (ACSM). No special expertise is needed to screen the participants.
The criteria for inclusion allows for comparison between the novel study approach and the existing literature.
SECTION E: Informed Consent
Section Notes…
• E1. Make sure to attach any recruitment materials for IRB approval. • E3. The privacy of the participants must be maintained throughout the consent process.
E1. Describe how the subjects will be recruited. (E.g., through flyers, beginning announcement for X class, referrals, random telephone sampling, etc.). If this study involves secondary analysis of data/charts/specimens only, provide information on the source of the data, whether the data is publicly available and whether the data contains direct or indirect identifiers.
Participants will be recruited through flyers posted in approved places on the UWM campus and word of mouth across the UW-M campus as well as the Milwaukee community. Responses to solicitation will be voluntary.
E2. Describe the forms that will be used for each subject group (e.g., short version, combined parent/child consent form, child assent form, verbal script, information sheet): If data from failed eligibility screenings will be used as part of your “research data”, then these individuals are considered research subjects and consent will need to be obtained. Copies of all forms should be attached for approval.
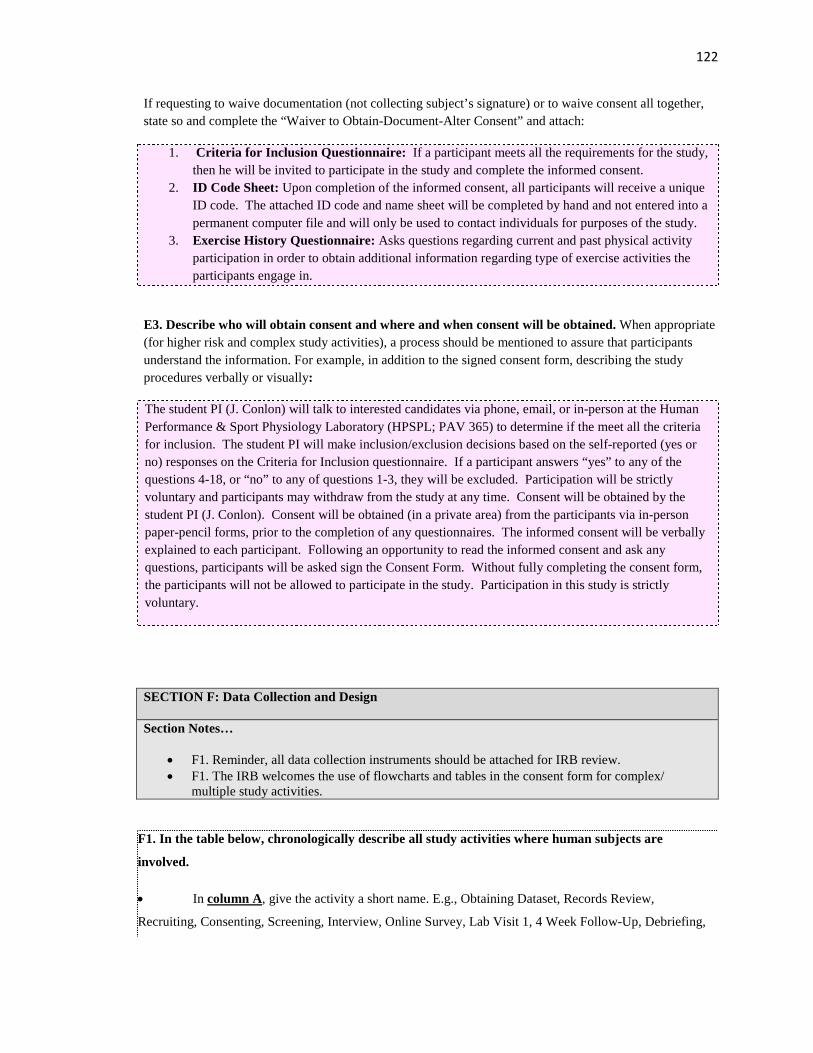
122
If requesting to waive documentation (not collecting subject’s signature) or to waive consent all together, state so and complete the “Waiver to Obtain-Document-Alter Consent” and attach:
1. Criteria for Inclusion Questionnaire: If a participant meets all the requirements for the study, then he will be invited to participate in the study and complete the informed consent.
2. ID Code Sheet: Upon completion of the informed consent, all participants will receive a unique ID code. The attached ID code and name sheet will be completed by hand and not entered into a permanent computer file and will only be used to contact individuals for purposes of the study.
3. Exercise History Questionnaire: Asks questions regarding current and past physical activity participation in order to obtain additional information regarding type of exercise activities the participants engage in.
E3. Describe who will obtain consent and where and when consent will be obtained. When appropriate (for higher risk and complex study activities), a process should be mentioned to assure that participants understand the information. For example, in addition to the signed consent form, describing the study procedures verbally or visually:
The student PI (J. Conlon) will talk to interested candidates via phone, email, or in-person at the Human Performance & Sport Physiology Laboratory (HPSPL; PAV 365) to determine if the meet all the criteria for inclusion. The student PI will make inclusion/exclusion decisions based on the self-reported (yes or no) responses on the Criteria for Inclusion questionnaire. If a participant answers “yes” to any of the questions 4-18, or “no” to any of questions 1-3, they will be excluded. Participation will be strictly voluntary and participants may withdraw from the study at any time. Consent will be obtained by the student PI (J. Conlon). Consent will be obtained (in a private area) from the participants via in-person paper-pencil forms, prior to the completion of any questionnaires. The informed consent will be verbally explained to each participant. Following an opportunity to read the informed consent and ask any questions, participants will be asked sign the Consent Form. Without fully completing the consent form, the participants will not be allowed to participate in the study. Participation in this study is strictly voluntary.
SECTION F: Data Collection and Design
Section Notes…
• F1. Reminder, all data collection instruments should be attached for IRB review. • F1. The IRB welcomes the use of flowcharts and tables in the consent form for complex/
multiple study activities.
F1. In the table below, chronologically describe all study activities where human subjects are
involved.
• In column A, give the activity a short name. E.g., Obtaining Dataset, Records Review,
Recruiting, Consenting, Screening, Interview, Online Survey, Lab Visit 1, 4 Week Follow-Up, Debriefing,
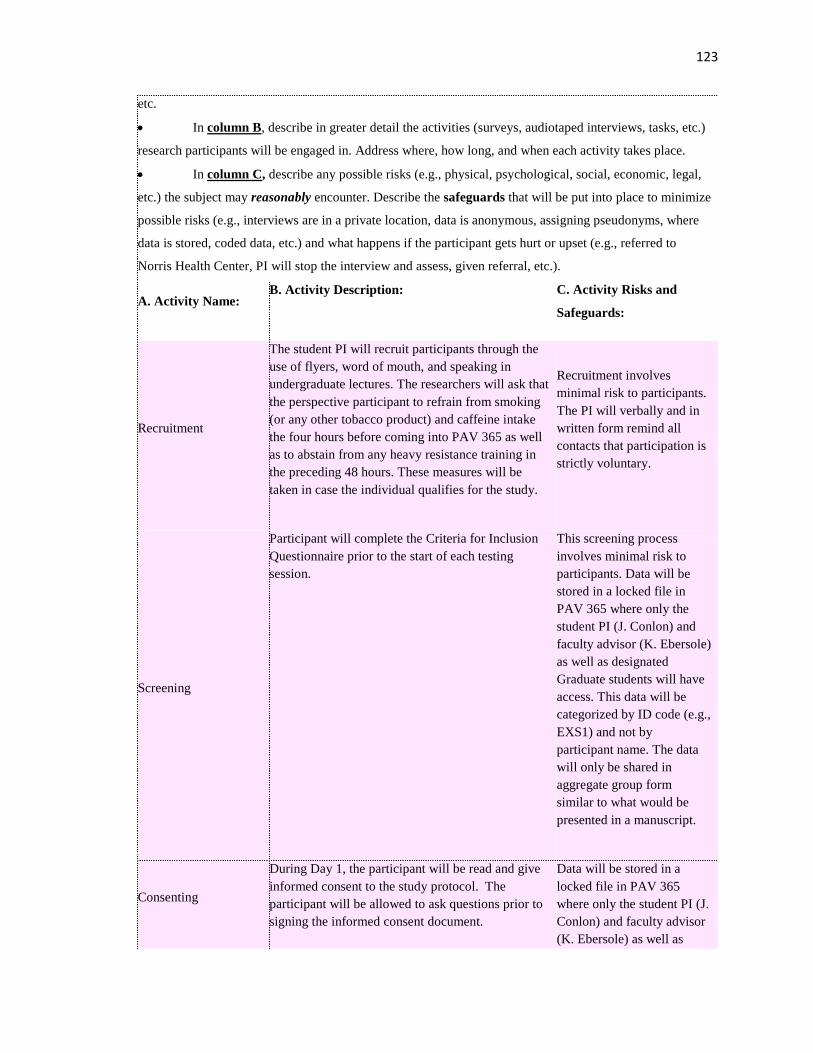
123
etc.
• In column B, describe in greater detail the activities (surveys, audiotaped interviews, tasks, etc.)
research participants will be engaged in. Address where, how long, and when each activity takes place.
• In column C, describe any possible risks (e.g., physical, psychological, social, economic, legal,
etc.) the subject may reasonably encounter. Describe the safeguards that will be put into place to minimize
possible risks (e.g., interviews are in a private location, data is anonymous, assigning pseudonyms, where
data is stored, coded data, etc.) and what happens if the participant gets hurt or upset (e.g., referred to
Norris Health Center, PI will stop the interview and assess, given referral, etc.).
A. Activity Name: B. Activity Description: C. Activity Risks and
Safeguards:
Recruitment
The student PI will recruit participants through the use of flyers, word of mouth, and speaking in undergraduate lectures. The researchers will ask that the perspective participant to refrain from smoking (or any other tobacco product) and caffeine intake the four hours before coming into PAV 365 as well as to abstain from any heavy resistance training in the preceding 48 hours. These measures will be taken in case the individual qualifies for the study.
Recruitment involves minimal risk to participants. The PI will verbally and in written form remind all contacts that participation is strictly voluntary.
Screening
Participant will complete the Criteria for Inclusion Questionnaire prior to the start of each testing session.
This screening process involves minimal risk to participants. Data will be stored in a locked file in PAV 365 where only the student PI (J. Conlon) and faculty advisor (K. Ebersole) as well as designated Graduate students will have access. This data will be categorized by ID code (e.g., EXS1) and not by participant name. The data will only be shared in aggregate group form similar to what would be presented in a manuscript.
Consenting
During Day 1, the participant will be read and give informed consent to the study protocol. The participant will be allowed to ask questions prior to signing the informed consent document.
Data will be stored in a locked file in PAV 365 where only the student PI (J. Conlon) and faculty advisor (K. Ebersole) as well as

124
Once the participant has signed the informed consent, and been included in to the study, they will be given a study ID (e.g., EXS1) that will be used to code all of their data collected during the study.
designated Graduate students will have access. This data will be categorized by ID code (e.g., EXS1) and not by participant name so that the data is unidentifiable. The only identifiable data will be the video recorded movement tests (see below). The data will only be shared in aggregate group form similar to what would be presented in a manuscript.
Exercise History Questionnaire
The participant will complete a paper-pencil exercise history questionnaire. This questionnaire assesses the frequency and type of physical activity they have and are currently partaking in.
Data will be stored in a locked file in PAV 365 where only the student PI (J. Conlon) and faculty advisor (K. Ebersole) as well as designated Graduate students will have access. This data will be categorized by ID code (e.g., EXS1) and not by participant name. The data will only be shared in aggregate group form similar to what would be presented in a manuscript.
Height and Weight
The participant’s height, body weight, age, and birthdate will be measured and recorded. Height and weight measurements will be taken using a weigh beam eye-level physician scale and mounted stadiometer (Detecto, Webb City, MO). The participant’s body mass index (BMI) will then be calculated and recorded from the height and weight measurements. These measurements will be used to describe the participants in aggregate form. In addition, actual height and body weight measures will confirm the self-reported height and weight used to estimate BMI as part of the Criteria for Inclusion Questionnaire. If a participant’s actual measured BMI is >30 upon these measurements, the participants involvement in the study will be terminated and the data collected will be destroyed.
The potential risks for injury due to performing any of the movement tasks in this study are minimal. Data will be stored in a locked file in PAV 365 where only the student PI (J. Conlon) and faculty advisor (K. Ebersole) as well as designated Graduate students will have access. This data will be categorized by ID code (e.g., EXS1) and not by participant name. The data will only be shared in aggregate group form similar to what would be

125
presented in a manuscript.
Functional Movement Screen Tests
The participant will perform a battery of seven movement tests as designed by the FMS™. All seven tasks of the FMS™ will be subjectively scored by the guidelines of the 100-point scale (Butler et al., 2012). No warm-up will be provided prior to the FMS™.
Each of the participant’s movement tests will be scored in person on Day 1 with a paper and pencil scoring method. In addition, each of the movement tests will be video recorded with an iPad camera. Each of the tests will be recorded from both the frontal and sagittal plane.
Video recording will be used to re-score the FMS™ tests from Day 1 to examine differences between 21-point live scored tests and the post hoc rescoring of the tests to a 100 point scale through the review of the video recording. In addition, the video files will be used to compare a 21 point-live to a 21-point scored FMS from a video.
The seven tasks include:
1. A deep squat, which involves holding a light weight plastic dowel rod over the head with arms extended and squatting as far down as the participant is able to go. This task will be repeated up to five times. (18-point maximum) 2. A hurdle step, which involves holding the aforementioned dowel rod across the shoulders while stepping, one leg at a time, over a rubber tube that is anchored to two stationary poles. The height of the rubber tube is level with the tibial tuberosity, just below the knee. This task will be repeated up to five times. Each side will be scored separately. (18-point maximum; 9 points maximum per side) 3. An in-line lunge, which involves the participant lunging forward and trying to touch the knee of the back leg to the heel of the front foot. This test will be repeated up to five times. Each side
The potential risks for injury due to performing any of the movement tasks in this study are minimal. It is unlikely, but possible that participants may experience muscle soreness or tightness following the testing. It is also possible, although unlikely, that a participant may experience minor musculoskeletal strains. All personnel involved in testing are trained in adult cardiopulmonary resuscitation (CPR) and first aid procedures. The session will be terminated in the event that the participant indicates any discomfort such as chest pain, leg pain or cramping or other sign and symptom that could be associated with a medical condition. The testing will also be terminated if requested by the participant. In the event that an exercise session is terminated for a possible medical reason, laboratory personnel will manage the situation per the standard first aid guidelines and procedures of the American Red Cross and refer to their personal physician or contact the Emergency Medical System in the case of an emergency.
126
will be scored separately. (20-point maximum; 10 points maximum per side). 4. A measure of shoulder mobility, which involves the participant reaching behind their back with one hand coming from the head down the spine and the other hand coming from the waist up the spine. The distance separating the two hands will be measured. Both shoulders will be assessed and each side will be scored separately. This test will be repeated up to five times. (8-point maximum; 4 points maximum per side). 5. A single, straight-leg raise, which involves the participant lying on his/her back and raising the leg up from the ground while keeping the knee straight. Both legs will be assessed and scored separately. This test will be repeated up to five times. (12-point maximum; 6 points maximum per side). 6. A push-up, which involves performing a push-up with the hands placed at the level of the chin or clavicle. This task will be repeated up to five times. (12-point maximum) 7. A measure of rotary stability, which involves the participant being positioned in a 4-point stance (arms and legs) and trying to bring the right elbow to right knee. This is then repeated with the left elbow coming to the left knee. Each side will be scored separately. This test will be repeated up to five times. (12-point maximum; 6 points maximum per side).
After the FMS™, the researchers will verbally explain the protocol of the counter movement jump (CMJ) that will be administered during Day 2 of this study to the participant.
The researchers will ask that the participant refrain from smoking (or any other tobacco product) and caffeine intake the four hours preceding the data collection on Day 2, as well as abstain from any heavy resistance training in the preceding 48 hours.
Video Recording
In order to accurately score the FMS™ tests on the 100-point scale, each of the movement tests must be video recorded. The video recording will also be used to examine possible differences between a 21-
Collection of the video recorded movement tests involves minimal risk to participants. The video

127
point live scoring recording of the movement tests will capture the full body, face included, throughout each of the movement test trials. In order to protect this identifiable information, all video files will be saved by participant initials based on printed name from the ID code sheet. This will provide a non-direct link between this identifiable data and the other study data that is stored by ID code. The only way to link the identifiable and de-identified data will be through the master ID code sheet described above and only retained by the student PI and faculty PI. Once the FMS is scored from the video files on the I-pad, all video files (saved with participant initials) will be stored on an encrypted laptop. Upon conclusion of the study, exemplar video files will be retained for the purpose of improving dissemination of data in conference presentation format. In this case, any video file presented in the dissemination efforts will be completely de-identified by blocking or hiding the face prior to dissemination. Only video files that can be completely de-identified will be used. All other video files will be destroyed upon conclusion of the study. Only the student PI (J. Conlon) and faculty advisor (K. Ebersole) as well as
128
designated Graduate students will have access to the video recorded movements.
Practice Jumps
After completing the FMS test, the participant will be fitted with the Myotest Sport unit and belt. The Myotest unit is a small accelerometer based device that will measure the peak height (cm) of each of the participant’s CMJ trials. This device is attached to a Velcro belt that the participant will have secured around their waist. These jumps will not be recorded. Their purpose is to familiarize that participant with the CMJ jump protocol and the MyoTest belt.
CMJ practice jump instructions:
1. The participant will begin each jump (trial) with their hands relaxed by their side and feet shoulder width apart. 2. The participant will listen for the sound of the beep (stimulus) from the MyoTest. 3. At the sound of the beep, the participant will lower himself into a deep squat swinging their arms back as they squat down while maintaining a straight back. 4. At the bottom of the jump, the participant will immediately jump upward, swinging their arms forward and upward with as they jump. 5. The participant will be encouraged to bend their legs upon landing from each jump trial.
It is possible that participants may experience minor musculoskeletal muscle strains, muscle soreness, and/or tightness as they might with any form of physical activity
The practice sessions will be terminated in the event that the subject indicates any discomfort such as leg pain or cramping or other sign and symptom that could be associated with a medical condition. The testing will also be terminated if requested by the participant. In the event that a testing session is terminated for a possible medical reason, laboratory personnel will manage the situation per the standard first aid guidelines and procedures of the American Red Cross and refer to Norris Health Center or contact the Emergency Medical System.
Warm-up (Day 2)
Upon arriving at the lab for the second day of testing, the participant will perform a brief, five minute warm-up on a bicycle ergometer with a light, self-selected, resistance level.
The warm-up is designed to be submaximal and at a pace and resistance self-selected by the participant. The risks associated with this warm-up are no greater than those of every day physical activity.
Practice Jumps The participant will then perform five CMJ trials to re-familiarize the participant with the jump protocol
It is possible that participants may experience
129
that was practiced on Day 1. The researchers will also watch that the participant is using correct form during the CMJ.
minor musculoskeletal muscle strains, muscle soreness, and/or tightness as they might with any form of physical activity.
The practice sessions will be terminated in the event that the subject indicates any discomfort such as leg pain or cramping or other sign and symptom that could be associated with a medical condition. The testing will also be terminated if requested by the participant. In the event that a testing session is terminated for a possible medical reason, laboratory personnel will manage the situation per the standard first aid guidelines and procedures of the American Red Cross and refer to Norris Health Center or contact the Emergency Medical System.
Jump Trials
The participant will perform three successful CMJ trials that will be recorded for data analysis. The researchers will hand record information from the Myotest between each successful trial onto a data sheet. A trial will be considered unsuccessful if: the participant starts their movement before the proper stimulus (false start), the Myotest is bumped or falls off during the arm swing, or the Myotest Sport unit cannot properly record the trial
After three successful trials are recorded, the Myotest Sport unit will be removed and the participant’s commitment to this study is over.
It is possible that participants may experience minor musculoskeletal muscle strains, muscle soreness, and/or tightness as they might with any form of physical activity.
The testing sessions will be terminated in the event that the subject indicates any discomfort such as leg pain or cramping or other sign and symptom that could be associated with a medical condition. The testing will also be terminated if requested by the participant.
130
In the event that a testing session is terminated for a possible medical reason, laboratory personnel will manage the situation per the standard first aid guidelines and procedures of the American Red Cross and refer to Norris Health Center or contact the Emergency Medical System.
Data Analysis
Data analysis will be conducted with Microsoft Excel and SPSS 21. Statistical measurement of interest for this study would be descriptive statistics and correlational analyses between the various measures.
Data analysis involves minimal risk. Safeguards include storing the data on an encrypted, password protected laptop as well as in a password protected online database through the secure password-protected folder on the UW-M network’s research drive.
F2. Explain how the privacy and confidentiality of the participants' data will be maintained after study closure:
The information gathered in this study will be used only for research and publication purposes. Aggregate data obtained from the participants will be used to assist in understanding the possible relationship between movement ability and athletic performance. Data, in aggregate form, may be presented at scientific meetings and in the scientific literature. In no case will individual participants be identified by name.
A master identity code sheet containing subject names, participant ID code, and contact information will be stored (in a locked file in the office of the faculty PI, PAV 364) separate from all collected data for the purpose of contacting subjects for follow-up testing. All experimental data and associated questionnaires will be stored in a file based on a participant ID code (e.g., EXS1) unique to each participant and separate from any contact information. At no time will the coded data files include names or contact information. If a participant withdraws from the study at any point, other than being terminated upon confirmation of BMI, all data collected up to the point of withdrawing will be kept, but will not be used in this study.
Video recorded movement tests will be stored on an iPad that will be locked in the office of the faculty advisor (K. Ebersole). It will be both removed from and returned to this cabinet by the student PI (J. Conlon) or the faculty advisor. All video files will be saved according to participant

131
initials to eliminate the direct link between identifiable video information to other data stored by a unique study ID code. In the case of the video files, all video files in possession by the student PI and faculty PI will be destroyed upon conclusion of the study. Only exemplar videos that can be completely de-identified will be kept for assistance in dissemination of data (see F1 above).
The information gathered in this study will be used only for research and publication purposes in the form of aggregate data only. In no case will individual participants be identified by name. Aggregate data obtained from the participants will be used to assist in understanding the possible relationship between movement ability and athletic performance. Data, in aggregate form, may be presented at scientific meetings and in the scientific literature.
F3. Explain how the data will be analyzed or studied (i.e. quantitatively or qualitatively) and how the data will be reported (i.e. aggregated, anonymously, pseudonyms for participants, etc.):
The information gathered in this study will be used only for research and publication purposes. Aggregate data obtained from the participants will be used to assist in understanding the possible relationship between movement ability and athletic performance. Data, in aggregate form, may be presented at scientific meetings and in the scientific literature. In no case will individual participants be identified by name.
SECTION G: Benefits and Risk/Benefit Analysis
Section Notes…
• Do not include Incentives/ Compensations in this section.
G1. Describe any benefits to the individual participants. If there are no anticipated benefits to the subject directly, state so. Describe potential benefits to society (i.e., further knowledge to the area of study) or a specific group of individuals (i.e., teachers, foster children). Describe the ratio of risks to benefits.
Participants will receive a free FMS™ test along with recommendations for exercises to improve their movement.
No monetary compensation will be given to participants.
G2. Risks to research participants should be justified by the anticipated benefits to the participants or society. Provide your assessment of how the anticipated risks to participants and steps taken to minimize these risks, balance against anticipated benefits to the individual or to society.

132
We believe that the risk-to-benefit ratio for this study is quite low. The risks involved in this study are very minimal in comparison to what the participants are exposed to in the daily routines of life and exercise, or completing any other survey or questionnaire. The benefits from this study will aid in the understanding the possible relationship between movement ability and athletic performance.
It is possible that participants may experience minor musculoskeletal muscle strains, muscle soreness, and/or tightness as they might with any form of physical activity.
The small potential for any risks will be reduced further by recruiting participants who are currently active and accustomed to physical activity. Further, all personnel involved in testing are trained in adult cardiopulmonary resuscitation (CPR) and first aid procedures.
The testing sessions will be terminated in the event that the subject indicates any discomfort such as leg pain or cramping or other sign and symptom that could be associated with a medical condition. The testing will also be terminated if requested by the participant. In the event that a testing session is terminated for a possible medical reason, laboratory personnel will manage the situation per the standard first aid guidelines and procedures of the American Red Cross and refer to Norris Health Center or contact the Emergency Medical System.
SECTION H: Subject Incentives/ Compensations
Section Notes…
• H2 & H3. The IRB recognizes the potential for undue influence and coercion when extra credit is offered. The UWM IRB, as also recommended by OHRP and APA Code of Ethics, agrees when extra credit is offered or required, prospective subjects should be given the choice of an equitable alternative. In instances where the researcher does not know whether extra credit will be accepted and its worth, such information should be conveyed to the subject in the recruitment materials and the consent form. For example, "The awarding of extra credit and its amount is dependent upon your instructor. Please contact your instructor before participating if you have any questions. If extra credit is awarded and you choose to not participate, the instructor will offer an equitable alternative."
• H4. If you intend to submit to the Travel Management Office for reimbursement purposes make sure you understand what each level of payment confidentiality means (click here for additional information ).
H1. Does this study involve incentives or compensation to the subjects? For example cash, class extra credit, gift cards, or items.
133
[_x_] Yes
[__] No [SKIP THIS SECTION]
H2. Explain what (a) the item is, (b) the amount or approximate value of the item, and (c) when it will be given. For extra credit, state the number of credit hours and/or points. (e.g., $5 after completing each survey, subject will receive [item] even if they do not complete the procedure, extra credit will be award at the end of the semester):
Extra credit may be provided by a student’s instructor. The amount of credit hours of extra credit points is subject to the instructor’s discretion.
H3. If extra credit is offered as compensation/incentive, an alternative activity (which can be another research study or class assignment) should be offered. The alternative activity (either class assignment or another research study) should be similar in the amount of time involved to complete and worth the same extra credit.
If a student may receive extra credit for participation in this proposed study, it is at the instructor’s discretion to provide an alternative activity for those that do not fit the inclusion criteria for this proposed study.
H4. If cash or gift cards, select the appropriate confidentiality level for payments (see section notes):
[__] Level 1 indicates that confidentiality of the subjects is not a serious issue, e.g., providing a social security number or other identifying information for payment would not pose a serious risk to subjects.
� Choosing a Level 1 requires the researcher to maintain a record of the following: The payee's name, address, and social security number and the amount paid.
� When Level 1 is selected, a formal notice is not issued by the IRB and the Travel Management Office assumes Level 1.
� Level 1 payment information will be retained in the extramural account folder at UWM/Research Services and attached to the voucher in Accounts Payable. These are public documents, potentially open to public review.
[__] Level 2 indicates that confidentiality is an issue, but is not paramount to the study, e.g., the participant will be involved in a study researching sensitive, yet not illegal issues.
� Choosing a Level 2 requires the researcher to maintain a record of the following: A list of names, social security numbers, home addresses and amounts paid.
� When Level 2 is selected, a formal notice will be issued by the IRB.
134
� Level 2 payment information, including the names, are attached to the PIR and become part of the voucher in Accounts Payable. The records retained by Accounts Payable are not considered public record.
[__] Level 3 indicates that confidentiality of the subjects must be guaranteed. In this category, identifying information such as a social security number would put a subject at increased risk.
� Choosing a Level 3 requires the researcher to maintain a record of the following: research subject's name and corresponding coded identification. This will be the only record of payee names, and it will stay in the control of the PI.
� Payments are made to the research subjects by either personal check or cash. � Gift cards are considered cash. � If a cash payment is made, the PI must obtain signed receipts.
SECTION I: Deception/ Incomplete Disclosure (INSERT “NA” IF NOT APPLICABLE)
Section Notes…
• If you cannot adequately state the true purpose of the study to the subject in the informed consent, deception/ incomplete disclosure is involved.
I1. Describe (a) what information will be withheld from the subject (b) why such deception/ incomplete disclosure is necessary, and (c) when the subjects will be debriefed about the deception/ incomplete disclosure.
IMPORTANT – Make sure all sections are complete and attach this document to your IRBManager web submission in the Attachment Page (Y1).
135
APPENDIX G
Example FMS™ 21-point Data Sheet

136
Test Raw Score Final Score Notes
1. Deep Squat • Torso // with tibia or toward vertical • Femur < HZ • Knees over feet • Dowel over feet
□ Feet Out □ Foot Flattens □ Knees In □ Knees Out □ FWD Lean □ LB Arch □ LB Rounds □ Arms FWD □ Heel Rises □ Wt shift to R □ Wt shift to L □ “Tail tuck” □ DF Issues □ Torso Rot
2. Hurdle Step • Hips, knees, ankles aligned in sagittal
plane • Min. movement of L-spine • Dowel and hurdle remain // • Loss of balance or contact w/hurdle = 1 Record Height of Band =
R (stepping)
□ Hip ER (knee out) □ Hip IR (knee in) □ Tibial ER (foot out) □ Tibial IR (foot in) □ FWD Lean □ Hip Hike □ Limited Ankle motion □ Trunk Rot R to L □ Trunk Rot L to R □ Hip ER (knee out) □ Hip IR (knee in) □ Tibial ER (foot out) □ Tibial IR (foot in) □ FWD Lean □ Hip Hike □ Limited Ankle motion □ Trunk Rot R to L □ Trunk Rot L to R
L
3. In-Line Lunge • Dowel remains in contact w/L-ext • No torso movement • Dowel & feet remain in sagittal plane • Knee touches board behind heel
R (front)
□ FWD Lean □ Loss of Balance □ Front Heel Rise □ Rear Heel Rot □ Lateral Flx □ Knee In □ Trunk Rot R to L □ Trunk Rot L to R □ FWD Lean □ Loss of Balance □ Front Heel Rise □ Rear Heel Rot □ Lateral Flx □ Knee In □ Trunk Rot R to L □ Trunk Rot L to R
L
4. Shoulder Mobility Impingement Clearing (NO = pain) Right YES NO Left YES NO • Fists w/in 1 hand length = 3 • Fists w/in 1.5 units = 2 • Fists > 1.5 units = 1
R (flexed)
Record Measured Hand Length =
L
5. Active SLR • Dowel at mid-thigh (bt patella & ASIS) • Dowel at superior patella • Dowel at inferior patella
R
□ Pelvis Rotates □ Down Leg rotates □ Down Leg Thigh Lifts □ Pelvis Rotates □ Down Leg rotates □ Down Leg Thigh Lifts L
6. Trunk Stability PU Spinal Ext Clearing (NO = pain) YES NO • Males: 1 rep w/thumbs at top of
forehead then chin • Females: 1 rep w/thumbs at chin then
clavicle
□ Trunk Rotates to R □ Trunk Rotates to L □ Trunk Rises Before Hips □ Hips Raise Before Trunk
7. Rotary Stability Spinal Flex Clearing (NO = pain) YES NO
• 1 correct unilateral rep w/spine // to
board • Knee & elbow touch • II = diagonal
R (upper moving)
□ Hip Flexion □ L Leg Can’t Extend □ R Shldr Drops □ R Shldr Flexes □ Hip Flexion □ R Leg Can’t Extend □ L Shldr Drops □ L Shldr Flexes
L
TOTAL SCORE = _____ / 21

137
APPENDIX H
Example FMS™ 100-point Data Sheet
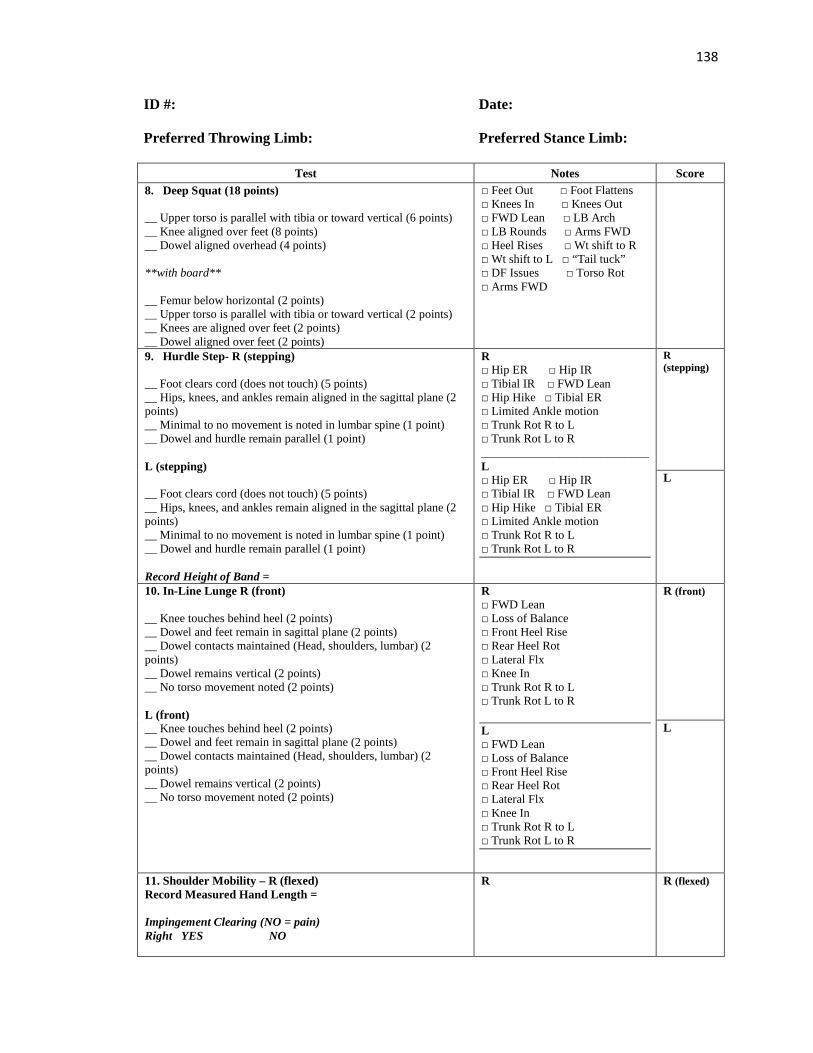
138
ID #: Date: Preferred Throwing Limb: Preferred Stance Limb:
Test Notes Score 8. Deep Squat (18 points)
__ Upper torso is parallel with tibia or toward vertical (6 points) __ Knee aligned over feet (8 points) __ Dowel aligned overhead (4 points) **with board** __ Femur below horizontal (2 points) __ Upper torso is parallel with tibia or toward vertical (2 points) __ Knees are aligned over feet (2 points) __ Dowel aligned over feet (2 points)
□ Feet Out □ Foot Flattens □ Knees In □ Knees Out □ FWD Lean □ LB Arch □ LB Rounds □ Arms FWD □ Heel Rises □ Wt shift to R □ Wt shift to L □ “Tail tuck” □ DF Issues □ Torso Rot □ Arms FWD
9. Hurdle Step- R (stepping)
__ Foot clears cord (does not touch) (5 points) __ Hips, knees, and ankles remain aligned in the sagittal plane (2 points) __ Minimal to no movement is noted in lumbar spine (1 point) __ Dowel and hurdle remain parallel (1 point) L (stepping) __ Foot clears cord (does not touch) (5 points) __ Hips, knees, and ankles remain aligned in the sagittal plane (2 points) __ Minimal to no movement is noted in lumbar spine (1 point) __ Dowel and hurdle remain parallel (1 point) Record Height of Band =
R □ Hip ER □ Hip IR □ Tibial IR □ FWD Lean □ Hip Hike □ Tibial ER □ Limited Ankle motion □ Trunk Rot R to L □ Trunk Rot L to R ____________________________ L □ Hip ER □ Hip IR □ Tibial IR □ FWD Lean □ Hip Hike □ Tibial ER □ Limited Ankle motion □ Trunk Rot R to L □ Trunk Rot L to R
R (stepping) L
10. In-Line Lunge R (front)
__ Knee touches behind heel (2 points) __ Dowel and feet remain in sagittal plane (2 points) __ Dowel contacts maintained (Head, shoulders, lumbar) (2 points) __ Dowel remains vertical (2 points) __ No torso movement noted (2 points) L (front) __ Knee touches behind heel (2 points) __ Dowel and feet remain in sagittal plane (2 points) __ Dowel contacts maintained (Head, shoulders, lumbar) (2 points) __ Dowel remains vertical (2 points) __ No torso movement noted (2 points)
R □ FWD Lean □ Loss of Balance □ Front Heel Rise □ Rear Heel Rot □ Lateral Flx □ Knee In □ Trunk Rot R to L □ Trunk Rot L to R L □ FWD Lean □ Loss of Balance □ Front Heel Rise □ Rear Heel Rot □ Lateral Flx □ Knee In □ Trunk Rot R to L □ Trunk Rot L to R
R (front) L
11. Shoulder Mobility – R (flexed) Record Measured Hand Length = Impingement Clearing (NO = pain) Right YES NO
R
R (flexed)

139
__ Fists are within one hand length (4 points) __ Fists are within one-and-a-half hand lengths (2 points) __ Fists are not within one-and-a-half hand lengths (0 points) L (flexed) Left YES NO __ Fists are within one hand length (4 points) __ Fists are within one-and-a-half hand lengths (2 points) __ Fists are not within one-and-a-half hand lengths (0 points)
L
L
12. Active SLR – R (moving) __ Malleolus resides between mid-thigh and ASIS (6 points) __ Malleolus resides between mid-thigh and joint line (2 points) __ Malleolus resides below the joint line (0 points) L (moving) __ Malleolus resides between mid-thigh and ASIS (6 points) __ Malleolus resides between mid-thigh and joint line (2 points) __ Malleolus resides below the joint line (0 points)
R □ Pelvis Rotates □ Down Leg rotates □ Down Leg Thigh Lifts ___________________________ L □ Pelvis Rotates □ Down Leg rotates □ Down Leg Thigh Lifts
R (moving) L
13. Trunk Stability PU Spinal Ext Clearing (NO = pain) YES NO __ 1 rep w/ thumbs at top of forehead level (12 points) __ 1 rep w/ thumbs at chin level (5 points) __ Failure at chin level (0 points)
□ Trunk Rotates to R □ Trunk Rotates to L □ Shoulders rise before back □ Back rises before shoulders
14. Rotary Stability Spinal Flex Clearing (NO = pain) YES NO R (upper moving) __ Unilateral repetition (6 points) __ Diagonal Repetition (2 points) __ Failure of diagonal repetition (0 points) L (upper moving) __ Unilateral repetition (6 points) __ Diagonal Repetition (2 points) __ Failure of diagonal repetition (0 points)
□ Hip Flexion □ L Leg Can’t Extend □ R Shldr Drops □ R Shldr Flexes □ Hip Flexion □ L Leg Can’t Extend □ R Shldr Drops □ R Shldr Flexes
R (upper moving) L
TOTAL SCORE = _____ / 100

140
APPENDIX I
Example CMJ Data Sheet

141
Human Performance & Sport Physiology Lab Department of Kinesiology University of Wisconsin – Milwaukee 3409 N. Downer Ave Pavilion – Physical Therapy, Room 365 Milwaukee, WI 53211 The Relationship between the Functional Movement ScreenTM and Countermovement jump height– Joshua K. Conlon Thesis
Date: ______________
Age: ______ Date of Birth: _____________
Height (cm): _______ Weight (kg): _______ BMI: _______
Counter Movement Jump Trials - Myotest
1 2 3 AVG
Height (cm)
ID #: ________________

142
APPENDIX J
Functional Pyramid

143
Adapted from Cook (2010)

144
APPENDIX K
Participant Descriptive Data

145
ID Wt (kg) Ht (cm) BMI Age JT1 73.1 177.8 23.1 24 JT3 77.2 177.8 24.4 18 JT5 82.2 181.6 25.4 21 JT6 82.2 177.2 26.2 23 JT7 58.1 163.8 21.7 21 JT8 82.6 179.7 25.6 22 JT9 74.9 175.3 24.4 22 JT11 84.4 184.2 24.9 20 JT12 64.5 173.9 21.6 19 JT13 78.5 163.2 29.5 24 JT14 61.9 168.3 21.9 22 JT15 80.1 175.3 26.2 22 JT16 98.1 186.7 28.2 22 JT17 77.2 180.3 23.8 21 JT18 73.8 169.5 25.7 21 JT19 86.5 186.7 24.8 19 JT20 76.3 183.5 22.7 23 JT21 78.9 173.9 26.1 24 JT22 66.5 171.5 22.6 20 JT23 72.6 181.6 22.0 23 JT24 96.7 190.5 26.6 21 JT26 91.2 181.6 27.7 21 JT27 99.4 195.6 25.9 22 JT29 75.7 180.3 23.3 21 JT30 88.9 180.3 27.4 25 JT31 69.5 180.3 21.4 24 JT33 84.9 170.2 29.3 22 JT34 68.6 177.8 21.7 21 JT35 64.9 179.1 20.2 21 JT37 70.4 175.3 22.9 23 JT38 84.5 180.3 26.0 21 JT39 92.9 180.3 28.6 24 JT40 52.2 165.1 19.2 22 JT41 97.6 182.9 29.2 21 JT43 68.4 180.3 21.0 23 JT44 75.1 172.7 25.2 21

146
APPENDIX L
Participant Performance Data

147
ID FMS 21-pt live FMS 21-pt video FMS 100-pt CMJ mean (cm) JT1 11 12 37 49.9 JT3 13 13 54 59.3 JT5 12 14 51 52.6 JT6 14 15 50 46.2 JT7 15 15 49 63.2 JT8 13 13 45 63.6 JT9 14 14 56 60.4 JT11 15 15 63 54.5 JT12 13 12 40 43.9 JT13 13 13 53 48.5 JT14 11 11 45 51.7 JT15 12 12 51 47.2 JT16 13 13 49 54.5 JT17 10 12 48 23.3 JT18 14 13 46 51.9 JT19 15 15 61 55.6 JT20 12 12 28 49.0 JT21 17 17 78 52.7 JT22 13 13 43 59.6 JT23 14 13 39 22.0 JT24 13 13 43 23.0 JT26 9 8 28 15.0 JT27 11 12 28 45.2 JT29 13 12 46 23.7 JT30 12 12 40 21.3 JT31 11 11 35 19.0 JT33 12 11 40 21.0 JT34 15 14 41 23.3 JT35 12 12 40 21.3 JT37 14 15 53 27.3 JT38 15 16 51 27.3 JT39 14 13 46 24.3 JT40 12 12 39 21.0 JT41 11 11 39 20.3 JT43 12 12 35 19.7 JT44 12 12 35 19.7


