
University of North Florida University of North Florida
UNF Digital Commons UNF Digital Commons
UNF Graduate Theses and Dissertations Student Scholarship
2015
The Reproductive Biology of the Finetooth Shark, Carcharhinus The Reproductive Biology of the Finetooth Shark, Carcharhinus
isodon, in the Northwest Atlantic Ocean isodon, in the Northwest Atlantic Ocean
Amanda Brown University of North Florida, [email protected]
Follow this and additional works at: https://digitalcommons.unf.edu/etd
Part of the Aquaculture and Fisheries Commons, Biology Commons, Endocrinology Commons, and
the Marine Biology Commons
Suggested Citation Suggested Citation Brown, Amanda, "The Reproductive Biology of the Finetooth Shark, Carcharhinus isodon, in the Northwest Atlantic Ocean" (2015). UNF Graduate Theses and Dissertations. 564. https://digitalcommons.unf.edu/etd/564
This Master's Thesis is brought to you for free and open access by the Student Scholarship at UNF Digital Commons. It has been accepted for inclusion in UNF Graduate Theses and Dissertations by an authorized administrator of UNF Digital Commons. For more information, please contact Digital Projects. © 2015 All Rights Reserved

The Reproductive Biology of the Finetooth Shark, Carcharhinus isodon, in the Northwest
Atlantic Ocean
by
Amanda Nevada Brown
A thesis submitted to the Department of Biology
in partial fulfillment of the requirements for the degree of
Master of Science, Biology
UNIVERSITY OF NORTH FLORIDA
COLLEGE OF ARTS AND SCIENCES
May, 2015
Unpublished work © Amanda Nevada Brown

This Thesis titled The Reproductive Biology of the Finetooth Shark, Carcharhinus isodon, in the
Northwest Atlantic Ocean is approved:
Jim Gelsleichter
Committee Chair
J. Marcus Drymon
Julie Avery
Accepted for the Department of Biology:
Dan Moon
Chair, Department of Biology
Accepted for the College of Arts and Sciences:
Barbara Hetrick
Dean, College of Arts and Sciences
Accepted for the University:
Dr. John Kantner
Dean of the Graduate School

iii
DEDICATION
This thesis is dedicated in loving memory to my mother, Lauren Nevada Brown, for her constant
love, support and encouragement. You are my best friend, now and always. And to my father,
Tom Brown for picking up where she left off.

iv
TABLE OF CONTENTS
Page
Dedication iii
List of Figures v
Abstract vii
Component I: The reproductive biology of the finetooth shark, 1
Carcharhinus isodon, in the Northwest Atlantic Ocean
Introduction 1
Methods 4
Results 7
Discussion 22
Component II: The reproductive endocrinology of the finetooth shark,
Carcharhinus isodon, in the Northwest Atlantic Ocean 26
Introduction 26
Methods 30
Results 35
Discussion 48
Work Cited 53
Vitae 60

v
LIST OF FIGURES and TABLES
Page
Figure 1.1 Mature male C. isodon testis width and head epididymis width by month 8
Figure 1.2 Reproductive tract of mature male C. isodon. 9
Figure 1.3 Maximum follicle diameter (mm) in non-gravid and gravid mature female 12
C. isodon by month.
Figure 1.4 Morphological measurements of oviducal gland width of non-gravid vs 13
gravid mature female C. isodon.
Figure 1.5 Embryo growth in C. isodon litters and number of pups per litter vs. female 14
fork length (FL)
Figure 1.6 Examples of early embryonic death (EED) found in gravid female C. isodon 15
uteri
Figure 1.7 Female C. isodon displaying annual reproductive periodicity. 16
Figure 1.8 Histological transverse sections of male C. isodon testes taken at 19
different stages of spermatogenesis.
Figure 1.9 Histological transverse sections of male C. isodon testes in different 20
stages of reproductive cycle
Figure 1.10 Histological transverse sections of ovaries taken from mature female 21
C. isodon in different stages of the reproductive cycle
Figure 2.1 E2 concentrations of gravid and non-gravid mature female C. isodon 36
in the northwest Atlantic Ocean.
Figure 2.2 Plasma E2 concentration and maximum follicle diameter in mature 37
female C. isodon from the northwest Atlantic Ocean.
Figure 2.3 Plasma P4 concentrations of gravid and non-gravid mature female 38
C. isodon from the northwest Atlantic Ocean.
Figure 2.4 Plasma T concentrations in mature male C. isodon in the northwest 40
Atlantic Ocean.
Figure 2.5 Plasma T concentrations in mature male C. isodon in the northwest 41
Atlantic Ocean.

vi
Figure 2.6 Immunocytochemical analysis of the presence of ERα in female 43
C. isodon ovaries through different stages of the ovarian cycle.
Figure 2.7 Immunocytochemical analysis of ERα and PR staining in oviducal 44
glands of female C. isodon throughout the reproductive cycle.
Figure 2.8 Immunocytochemical analysis of ERα and PR staining in uterus of 45
female C. isodon throughout the reproductive cycle.
Figure 2.9 Immunocytochemical analysis of AR staining in gonads of male 46
C. isodon
Table 2.1 Primary and secondary antibodies used in immunocytochemical analysis 34
of male and female C. isodon gonads

vii
ACKNOWLEDGEMENTS
I would like to first thank the NOAA Cooperative Research Program for providing the funding
for this research. A huge thank you to the University of North Florida Graduate program for
providing me with a graduate teaching assistantship for 5 semesters, thereby preventing my
starvation and homlessness. My greatest thanks to my major advisor and committee chair, Dr.
Jim Gelsleichter for being my mentor, for his patience and for sporadically serving as my
psychiatrist. You have been an amazing and outstanding advisor and friend. I would like to
thank my committee members, Dr. Julie Avery and Dr. Marcus Drymon for taking the time out
of their busy lives to assist me through this process and for helping to mold my project into what
it became. A deep appreciation goes to my co-author Bryan Frazer at SCDNR for assisting in
field sampling and for being an overall badass. I would like to acknowledge the commercial
fishermen who were key to my Florida sampling efforts, Jay and Sara Bauman, for being
incredible shark fishermen and the most entertaining collaborators I’ve worked with to date.
Waking up to go fishing at 4am with you was never a chore. Also thank you to my lab mates and
many volunteers who assisted in field work, especially the UNF TLO classes. And to my
wonderful and amazing friends and fellow grad students who have been integral to my sanity and
happiness, especially Dean Grubbs, my best friend, partner in crime and unofficial committee
member. And most of all to my family. To my brother, an incredible fisherman in his own right
(and much better than me), for growing up side by side me, making my childhood epic and
learning to love the ocean and fishing with me. To my father, you are one of the main reasons I
have accomplished this. Your unwavering and constant support have meant more to me than you
can know. I feign to think of my life without you these past 3 years. And most of all, to my
mother. This thesis is dedicated to your memory, there are not words to describe what you mean
to me. I appreciate everything you have taught me, all the encouragement you have given and
the sacrifices you have made. You are my best friend, inspiration and mentor. I hope this makes
you proud, as I am proud to be your daughter.

1
ABSTRACT
Shark fisheries are a multimillion dollar industry in the United States and have significant
contributions both recreationally and commercially. In order to maintain this industry, fisheries
must be properly managed. An understanding of life history and reproduction is crucial in order
to adequately manage shark fisheries. The finetooth shark, Carcharhinus isodon, is a member of
the small coastal shark (SCS) fishery complex. It is found in Atlantic waters from South
Carolina to Florida and throughout the Gulf of Mexico. This species has recently come under
increased fishing pressure and has previously been overfished. New data is needed in order to
properly assess the reproductive capacity of this species so that healthy populations can be
sustained. This study evaluated the overall reproductive cycle of northwest Atlantic populations
of C. isodon using composite variables of morphology, histology and endocrinology. Atlantic C.
isodon were found to display seasonal reproduction with biennial reproductive periodicity with a
12 month gestation period and litters of 2-6 pups. E2 and T displayed similar patterns and were
highest during gametogenesis. P4 did not show any discernible patterns. Estrogen receptors
were found in developing follicles of gravid and non-gravid females, in the oviducal glands of
non-gravid and early pregnant females and in the uterus of pre-ovulatory females. P4 was found
in the oviducal glands in all reproductive stages and in the uterus of pre-ovulatory females.
Androgen receptors were found in Sertoli cells and mature spermatozoa as well as epididymal
epithelial cells.

1
CHAPTER ONE:
THE REPRODUCTIVE BIOLOGY OF THE FINETOOTH SHARK, CARCHARHINUS
ISODON, IN THE NORTHWEST ATLANTIC OCEAN
INTRODUCTION
The finetooth shark, Carcharhinus isodon, is a small coastal shark that inhabits waters of the
northwest Atlantic Ocean and the Gulf of Mexico (Castro, 1993; Drymon et al, 2006). Atlantic
ocean populations of finetooth sharks embark on seasonal migrations, moving south beginning
in early fall to spend colder winter months in coastal northeast and central Florida waters once
temperatures drop below 20 ̊C. In late spring/early summer, they begin to return north towards
the cooler waters of Georgia and South Carolina (Castro, 1993). Based on qualitative data, their
diet consists almost exclusively of small teleost fish, such as Brevoortia tyrannus and Leiostomus
xanthurus although they do occasionally consume crustaceans such as Callinectes sapidus
(Castro, 1993). A more recent study by Bethea et al (2004) has provided quantitative data on
diet which agrees with this assessment but also shows consumption of other pelagic and
epibenthic teleosts from families Carangidae, Sparidae, and Syngnathidae, among others.
C. isodon is a member of the small coastal shark (SCS) fishery management complex, which is
largely composed of fast growing, small bodied, short lived sharks. Other members of this group
include the bonnethead (Sphyrna tiburo), the Atlantic sharpnose (Rhizoprionodon terraenovae),

2
and the blacknose shark (Carcharhinus acronotus). Although species of the large coastal shark
(LCS) fishery complex are more coveted by commercial fisherman, management initiatives
enacted in the late 1990s restricted commercial catches of this group (NMFS, 1999), shifting
some fishing pressure to small coastal sharks. Recreational fishing and commercial by-catch in
gillnet fisheries also account for mortality of C. isodon (Trent et al, 1997; de Silva et al, 2001).
In just 5 years, commercial landings of small coastal sharks increased from 7 metric tons to 35
metric tons and have continued to rise (Carlson et al, 2003). As a result, certain representatives
of the SCS complex including C. isodon and C. acronotus have been determined to be overfished
in recent fishery assessments (Cortes, 2002; NMFS, 2007), prompting the need for greater
management of these species based on accurate life history and reproductive biological data.
A review of the available life history data provides some insight as to why C. isodon is more
susceptible to overexploitation than other members of the SCS complex. For example, C. isodon
is relatively large at sexual maturity, which has been reported to range between 102-127 cm fork
length (FL) for females and 102-117 cm FL for males (Carlson et al, 2003, Drymon et al, 2006;
Castro, 1993), sizes comparable to those reported for certain members of the LCS complex such
as the blacktip shark, Carcharhinus limbatus, which has a size at maturity between 117-126 cm
FL for females and ~117 cm FL for males in the Atlantic (Carlson et al, 2006). They have also
been reported to exhibit a biennial reproductive strategy and small litter size (2-6 pups), traits
shared by large coastal sharks such as the recently overfished dusky shark (C. obscurus). These
similarities could indicate that C. isodon requires management initiatives more comparable with
those governing the large coastal shark fishery complex.

3
Notwithstanding, there remains a need for greater information regarding the reproductive biology
of C. isodon, a point emphasized by fishery managers in recent stock assessments of the SCS
complex (NMFS, 2007). For example, discrepancies in the size at maturity between Atlantic
Ocean and Gulf of Mexico populations have been reported in literature (Castro, 1993; Carlson et
al, 2003; Drymon et al, 2006). In addition, although previous studies have reported that C.
isodon typically reproduces biennially, individuals exhibiting signs of annual reproduction have
recently been observed in Gulf of Mexico populations (Driggers and Hoffmayer, 2009). Such
observations justify re-evaluation of the reproductive biology of this species, especially
considering that the only published study on the reproductive biology of Atlantic C. isodon
populations is over two decades old. Therefore, the goal of this study was to re-examine
reproduction in Atlantic Ocean populations of C. isodon by analyzing the gross morphology and
histological structure of various reproductive organs throughout the reproductive cycle.

4
MATERIALS AND METHODS
Sampling Methods- Sharks were collected using bottom longlines and gillnets in fishery
dependent and independent sampling surveys in the Atlantic waters of Florida, Georgia and
South Carolina from 2012-2014. Sampling occurred monthly in estuaries, nearshore coastal
waters and offshore coastal locations. Following capture, precaudal length (PCL; tip of rostrum
to precaudal pit), fork length (FL; tip of the rostrum to fork in caudal fin) and stretched total
length (STL; tip of the rostrum to the posterior end of the extended caudal fin) were measured in
cm. Weight was measured in kilograms. Blood was collected via caudal venipuncture for
companion studies on reproductive endocrinology. The reproductive organs were removed via
dissection and used for morphological and histological assessments of reproductive stage.
Morphological assessments- Morphological measurements of reproductive organs were collected
from males and females to assess reproductive maturity and stage. Maturity in males was
determined by the presence of calcified claspers that rotated 180° with a freely opening
rhipidion. Females were deemed mature based on development of the reproductive tracts as
described in Manire et al. (1995). For males, clasper length, testis length, width, and weight (in
grams), and head epididymis width was measured in mm using dial calipers. The presence of
semen in the seminal vesicle was recorded. For females, uterine width, maximum follicle
diameter and oviducal gland width were measured with digital calipers. The ovary was
examined by determining the presence and number of vitellogenic and atretic ova. If the female

5
was gravid, ova or embryos from each uteri were enumerated, measured and sexed. Subsamples
of each reproductive organ were collected for histological analysis.
Histology- Subsamples of testis, head epididymis, ovarian follicles, uteri and oviducal glands
were taken from mature animals via dissection and stored in 10% buffered saline formalin for 48
h. Samples were trimmed and rinsed in tap water for 24 h, then stored in 70% reagent alcohol.
After, trimmed samples were dehydrated in an ascending graded series of reagent alcohol (80-
100%), cleared in a limonene-based solvent (CitriSolv, Fisher Scientific, Fair Lawn, NJ) and
processed using routine paraffin histology. Samples were cut into 5-µm transverse sections
using a rotary microtome and adhered to slides coated with 0.01% poly-L-lysine. Slides were
then stained with Harris Hemotoxylin and Eosin and analyzed using a compound microscope to
observe general patterns of and seasonal changes in cellular architecture.
Statistical analysis- Quantitative measurements of reproductive structures were grouped by
month of collection and, for females, pregnancy status. Width of the testis and head epididymis
in males were analyzed using one-way ANOVA followed by a Tukey’s post hoc test to
determine if significant differences occurred by month. Female maximum follicle diameter and
oviducal gland width were initially analyzed via two-way ANOVA to determine if significant
differences occurred by month of collection and pregnancy status. Afterwards, monthly
differences in maximum follicle diameter and oviducal gland width were analyzed for gravid and
non-gravid females separately using one-way ANOVA and post-hoc tests. Differences between
mean embryo size by month were examined using one-way ANOVA and post-hoc tests.

6
Correlation between gravid female size in FL and litter size was examined using Pearson’s
product-moment correlation coefficient. Histology of the reproductive structures was analyzed
qualitatively.

7
RESULTS
Morphology- A total of 63 male C. isodon were examined in this study. Mature males ranged
from 128 cm – 146 cm STL. Testis width (TW) followed a seasonal pattern in which it
increased beginning in September, and continued to increase until it peaked in late April-early
May at approximately 39 mm (Figure 1.1a). Testis then quickly declined in size around mid- to
late May and were found to be fully regressed (4-7 mm width) in all males from June to August.
Significant temporal differences were found in TW based on month (one-way ANOVA,
p<0.001). Head epididymis width (HEW) followed a similar pattern of steady increase in size
beginning in September with a peak in April-May at 27.5 mm, followed by a marked decline in
late May-early June following copulation (Figure 1.1b). There were also significant differences
based on month in HEW (one-way ANOVA, p<0.001) Semen was found in the seminal vesicle
beginning in early April and remained present until July (Figure 1.2).

8
[CELLRANGE] [CELLRANGE] [CELLRANGE] [CELLRANGE] [CELLRANGE] [CELLRANGE] [CELLRANGE] [CELLRANGE] [CELLRANGE] [CELLRANGE] 0
5
10
15
20
25
30
35
40
45
J F M A M J J A S O N D
TE
ST
IS W
IDT
H (
mm
)
MONTH
n=64
p<0.001 a
a
a
b
b b b
b b b
[CELLRANGE] [CELLRANGE] [CELLRANGE] [CELLRANGE] [CELLRANGE] [CELLRANGE] [CELLRANGE] [CELLRANGE] [CELLRANGE] [CELLRANGE] 0
5
10
15
20
25
30
35
J F M A M J J A S O N D
HE
AD
EP
IDID
YM
IS W
IDT
H (
mm
)
MONTH
n=64
p<0.001
abc
a
ab
abc
cde de de
e
cde
bcd
Figure 1.1 Mature male C.isodon (a) testis width and (b) head epididymis width by month.
Values represent means ±SEM. Monthly sample size is indicated inside bars. Significance
was determined using one-way ANOVA. Letters above bars represent homogenous subsets
at P<0.05.
a
b

9
a
b
EP DD SV
SV
Figure 1.2. a) Reproductive tract of mature male C. isodon. At the anterior portion
of the tract is the epididymis (EP) leading into the ductus deferens (DD) and
terminating in the seminal vesicle (SV). b) SV filled with semen in a mature male
caught one month prior to the mating season.

10
A total of 81 mature female C. isodon were examined in this study. Mature female C. isodon
ranged in size from 132 cm - 162 cm STL. Female morphological data displayed the same
temporal patterns in follicle growth as that observed for male testes. Follicle diameter began to
increase in non-gravid females in September and peaked in late winter-early spring, but did not
vary in gravid females during the same period (Figure 1.3). Significant differences in follicle
diameter based on month were found in only non-gravid females (one-way ANOVA, p=0.032).
Follicular diameter was markedly lower in both gravid and non-gravid females after May,
suggesting that ovulation had recently occurred. With the exception of one female, vitellogenic
follicles were present in only non-gravid females whereas embryos were present in only non-
vitellogenic females, suggesting a biennial reproductive cycle with non-concurrent periods of
follicular growth and gestation. Only one of the 81 females examined displayed annual
reproductive periodicity (Figure 1.7). This female had large, vitellogenic ova (32 mm) and
embryos in both uteri, although the embryos in one uterus were discolored and smaller in size
than other embryos caught in the same month. The other uterus contained a pup that had
undergone EED.
Oviducal gland width increased in non-gravid females in concert with follicle growth, peaking
significantly in spring (Figure 1.5) (one-way ANOVA, p=0.005). Oviducal gland width did not
vary in pregnant females by month (one-way ANOVA, p=0.154) during the same period, but
was slightly greater in newly pregnant females collected during May, perhaps reflecting
increases that occurred prior to ovulation (Figure 1.4). Fresh mating wounds were present on
females in May. 58.0% of females examined (49 out of 83) were pregnant, providing additional
support for a biennial reproductive periodicity. The earliest and latest stages of pregnancy were

11
found in May, suggesting a 12-month gestation period. Litter size ranged from 2-6 pups with a
median of 4 pups/litter (Figure 1.5a). Embryos ranged in size from 65-530 mm STL. Embryo
growth was greatest during the first 3 months of gestation starting in July at an average STL
±SEM of 94.45mm ± 4.5 and ending in September with an average of 260.2 mm ±16.2.
Embryos continued to grow rapidly until December when an attenuated period of growth began,
during which embryos grew only an average of 81.4 mm ± 30.4 from December to May (Figure
1.5). Significant differences were found in embryo size based on month (one way ANOVA;
p<0.001). A logarithmic growth function best modeled embryonic growth (R²=0.902).
Maximum observed pup STL was 530 mm with an average maximum size of 499.4 mm ±7.7.
Early embryonic death (EED), where one or more embryos were partially or fully degraded in
utero, was found in 14.9% of C. isodon litters (Figure 1.6) and occurred in early, mid and late
stages of pregnancy.

12
[CELLRANGE] [CELLRANGE] [CELLRANGE] [CELLRANGE] [CELLRANGE] [CELLRANGE] [CELLRANGE] [CELLRANGE] [CELLRANGE] 0
5
10
15
20
25
J F M A M J J A S O N D
MA
XIM
UM
FO
LL
ICL
E D
IAM
ET
ER
(m
m)
MONTH
a a
a
a
a
a
a a
a
n=42
p=0.516
[CELLRANGE] [CELLRANGE] [CELLRANGE] 2 [CELLRANGE] [CELLRANGE] [CELLRANGE] [CELLRANGE] [CELLRANGE] 0
5
10
15
20
25
J F M A M J J A S O N D
MA
XIM
UM
FO
LL
ICL
E D
IAM
ET
ER
(m
m)
MONTH
n=33
p = 0.032
a
a a
c
bc
bc
bc bc bc
a
b
Figure 1.3. Maximum follicle diameter (mm) in a) non-gravid and b) gravid mature
female C. isodon by month. Values represent means ±SEM. Sample size is indicated
inside bars. Significance was determined using a one- way ANOVA. Letters above bars
represent homogenous subsets at P<0.05.

13
[CELLRANGE] 1 [CELLRANGE] [CELLRANGE] [CELLRANGE] [CELLRANGE] [CELLRANGE] [CELLRANGE] [CELLRANGE] 0
5
10
15
20
25
30
35
40
J F M A M J J A S O N D
OV
IDU
CA
L G
LA
ND
WID
TH
(m
m)
MONTH
n=32
p=0.005 ac
b
ac
ac
ac
c c c c
[CELLRANGE] [CELLRANGE] [CELLRANGE] [CELLRANGE] [CELLRANGE] [CELLRANGE] [CELLRANGE] [CELLRANGE] [CELLRANGE] 0
5
10
15
20
25
30
35
40
45
J F M A M J J A S O N D
OV
IDU
CA
L G
LA
ND
WID
TH
(m
m)
MONTH
n=43
p=0.154
ab ab ab
ab
b b ab
b
a
Figure 1.4. Seasonal changes in oviducal gland width of a) non-gravid vs b)
gravid mature female C. isodon. Values represent means (±SEM). Sample size is
indicated inside bars. Significance was determined using a one way ANOVA.
Letters above bars represent homogenous subsets based on month at P<0.05.
a
b

14
R² = 0.9024
0
100
200
300
400
500
600
700
0 2 4 6 8 10 12 14
EM
BR
YO
ST
L (
mm
)
GESTATION TIME (months)
n=185
p=0.000
a
b
c c
e
ef
f
f f
0
1
2
3
4
5
6
7
100 105 110 115 120 125 130 135
# E
MB
RY
OS
PE
R L
ITT
ER
FEMALE FL (cm)
n=51
a
b
Figure 1.5. a) Stretched total length of C. isodon embryos from time of implantation until birth. A
logarithmic growth curve was fit to the data (R²=0.9024). b) Number of embryos per litter and fork
length (FL) of gravid females. Females with litters that included EED pups are shown in red. Litter size
and female size were not significantly correlated (Pearson r, P = 0.1705)

15
b
c d
a
RU
LU OG
OD
UT
E
E1
E2
E L1 L
2
Figure 1.6. Examples of early embryonic death (EED) found in gravid female C. isodon uteri: a)
Right and left uteri from a pregnant female; the right uterus (RU) contained normally developing
embryos whereas the left uterus (LU) contained embryos that had undergone EED. b) Reproductive
tract of a gravid female. Oviducal gland (OG) and oviduct (OD) leading to uterus (UT) that contained
an embryo (E) undergoing EED. c) The remains of two embryos (E1 and E2) that underwent EED. D)
Embryo (E) that underwent EED. The two large lobes of the embryonic liver (L1 and L2) are visible.

16
a
b
c
VO
UT
P1
P2
P3
Figure 1.7 Female C. isodon displaying annual reproductive periodicity. a) Arrow is pointing at
large, vitellogenic ova (VO) and uteri (UT) containing 2 embryos in the left uterus and 1
embryo undergoing EED in the right uterus (b). c) Viable embryos from the right uterus of
annual female (P1, P2) compared to normal embryo from a different female caught during the
same month (P3). Embryos 1 & 2 appear smaller in size and slightly discolored compared to
the normal healthy embryo.

17
Histology- The germinal zone and spermatocysts containing primary spermatogonia (Figure
1.8a), secondary spermatogonia (Figure 1.8b), and primary spermatocytes (Figure 1.8c), the
latter of which mark the end of mitotic division and the transition into meiosis I, were the only
stages of spermatogenesis found in animals collected from July through September (Figure 1.9a),
suggesting limited sperm production during this period. Spermatocysts containing germ cells
undergoing Meiosis II (Figure 1.8c), spermatids (Figure 1.8d), and mature spermatozoa (Figure
1.8e), were more prevalent in animals collected from December through May, suggesting active
spermatogenesis. The delineation between resting and active spermatogenesis is illustrated
prevalence of meiotic stages in the cross section (Figure 1.9b). Males that had completed
spermatogenesis showed predominantly late stage (Stage V-VI) spermatocysts throughout the
entirety of the cross section (Figure 1.9c). Evacuated spermatocysts (Figure 1.8f) were first
observed in males collected in March and most prominent in males collected in June and July
(Figure 1.9d), reflecting spermiation. All stages of spermatogenesis were observed in testis of
samples collected between June to October (Figure 1.9e), after which signs of testicular re-
modelling are more prevalent.
Stages of ovarian development observed in females are shown in Fig 1.10. Primordial,
developing and primary follicles were found in both gravid and non-gravid females (Figures
1.10a, b, and c, respectively). They were most prevalent in gravid females throughout the
duration of pregnancy. The most advanced stage of follicle development found in gravid
females were pre-vitellogenic follicles (Figure 1.10d, e) found towards the end of gestation,
indicating possible preparation for oogenesis following parturition. Non-gravid females had an
abundance of primordial and primary follicles from July-September after which secondary and

18
pre-vitellogenic follicles were predominant until December suggesting this is the period leading
up to vitellogenesis. From December-March, vitellogenic follicles (Figure 1.10f) were the most
prevalent with earlier stages present in less abundance. Atretic follicles were found in both
gravid and non-gravid females throughout the entirety of the reproductive cycle. The largest
atretic follicles were found in late May suggesting ovulation had taken place, follicular
development had ceased and degeneration of non-ovulated vitellogenic or post-ovulated follicles
had begun.

19
a b
c d
e f
PZ
SG1 SG2
SM1 SM2 ST
SZ
ES
Figure 1.8. Histological transverse sections of male C. isodon testes taken at different stages
of spermatogenesis. All images are taken at 40x magnification and include: a) Stage I
containing the proliferative zone (PZ) and primary spermatogonia (SG1). b) Stage II showing
early stage spermatocysts with secondary spermatogonia (SG2) and associated Sertoli cells
enclosed in a basement membrane. c) Stage III and IV; Stage III spermatocysts contain
primary spermatocytes undergoing Meiosis I (SM1), Stage IV contain secondary
spermatocytes undergoing Meiosis II (SM2) d) Stage V includes spermatids (ST) undergoing
spermiogenesis. e) Stage VI are fully mature spermatozoa (SZ) forming clusters associated
with one Sertoli cell/cluster. f) Stage VII shows evacuated spermatocysts (ES).

20
a b
c d
SG1
SG2
SM1
SM2
SZ
ES
SG1
SG
2
SGM
1
SGM
2
SZ
E
S
e
Figure 1.9 Transverse sections of male C. isodon testes in different stages of reproductive cycle.
Images include: a) 10x section from a male caught in October; section was composed almost entirely of
primary and secondary spermatogonia (SG1 and SG2, respectively) indicating it is in an inactive stage
prior to spermatogenesis; b) 10x section of a male caught in December containing large amounts of
spermatocysts undergoing meiosis I (SM1) and meiosis II (SM2) indicating the beginning of
spermatogenesis; c) 10x section of male caught in April showing mature spermatozoa (SZ); d) 10x
section from male caught in August after the mating season was concluded showing large amounts of
evacuated spermatocysts (ES); e) 4x entire cross section of testis from animal caught in December
showing all stages of spermatogenesis.

21
a b
c d
e f
Pr
FW GE
DF
SSE
PF ZP
GC
PV
ZP
GC
YC
ZP
GC
TI TE
GC YC
TI
TE
VF
PV
Figure 1.10 Transverse sections of ovaries taken from mature female C. isodon in different stages of the
reproductive cycle. Images include a) 40x magnification of section taken from a newly gravid female in May;
section shows primordial follicle (Pr) surrounded by simple squamous epithelium surrounded by the follicular wall
(FW) attached to the germinal epithelium (GE); b) 40x magnification of a developing follicle (DF) taken from a
gravid female in July. The epithelial layer has become stratified squamous epithelium (SSE); c) 40x magnification
of a primary follicle (PF) taken from a non-gravid female caught in September. The SSE has now become the
granulosa cell layer (GC) and surrounds a thick zona pellucida (ZP); d) 10x magnification of a pre-vitellogenic
follicle (PV) taken from a non-gravid female caught in October. The GC has continued to thicken and surrounds
the zona pellucida (ZP). The theca cell layer (TL) is now visible; e) 40x magnification of a pre-vitellogenic
follicle (PV) showing the theca interna (TI) and theca externa (TE) layers. The granulosa cell layer (GC) is now
pseudostratified columnar surrounding the ZP. Yolk crystals (YC) have begun to form in the ooplasm indicating
this is the stage right before vitellogenesis begins; f) 40x magnification of a vitellogenic follicle (VF) taken from a
female caught in February. The GC is now simple columnar surrounded by TI and TE layers. YC are now block
like and the ZP is no longer visible.

22
DISCUSSION
The results of this study confirm that Atlantic populations of C. isodon use a seasonal, biennial
reproductive strategy. Morphological and histological analysis of the reproductive structures
demonstrated temporal changes in reproduction in which gametogenesis occurs in both mature
males and females during the months of December through April/early May. All gravid females
caught showed an absence of vitellogenic ova. Conversely, all non-gravid mature females had
vitellogenic ova present in their ovary, indicating they dedicate an entire year exclusively to
gestation and the entire following year exclusively to follicular development. Ovulation most
likely took place in late April-early May followed by copulation in late May-June. Gestation
lasted for approximately 12 months with pupping taking place in May-June the following year.
Litter sizes ranged from 2-6 pups/litter with a median litter size of 4. Embryos were 460-530
mm STL at the end of gestation.
Results from this study are consistent with earlier reports on Atlantic populations of finetooth
sharks. Castro (1993) also found evidence for a biennial reproductive strategy with concurrent
periods of gestation and folliculogenesis in gravid and non-gravid females, respectively, and a 12
month gestation period. Size at birth was similar to that suggested by Carlson et al (2003) based
on back-calculated size-at-birth estimates from finetooth sharks from the Gulf of Mexico.

23
Notwithstanding similarities between this study and earlier reports, there have been reported
differences in other life history parameters between Gulf of Mexico and northwest Atlantic
finetooth shark populations. For example, Atlantic populations were found to have larger size-
at-age individuals and slower growth coefficients than their Gulf of Mexico counterparts
(Carlson et al, 2003; Drymon et al, 2006). To date, there is only one published account of
finetooth reproductive biology in the Gulf of Mexico. This study indicated that Gulf of Mexico
finetooth sharks displayed both annual and biennial reproductive cycles, a pattern not typically
seen in Atlantic specimens (Driggers and Hoffmayer, 2009). A change in reproductive strategies
could be energetically based where the sharks are allocating their reserves more towards
reproduction than somatic growth allowing for mating and parturition to occur in a one year
period of time. This hypothesis would be consistent with the smaller sizes and early sizes at
maturity reported for Gulf of Mexico populations (Drymon et al, 2006). Therefore, Gulf of
Mexico populations may have a higher density of prey availability and more energy may be
available for reproductive efforts. In contrast, with the exception of one individual, all
specimens collected in the current study displayed a biennial reproductive strategy (n=81). The
variability displayed could indicate reproductive plasticity in response to environmental stimuli
such as prey abundance, temperature or fishing pressures. Variability in intraspecific
reproductive strategies have been reported in other elasmobranchs such as the blacknose shark,
C. acronotus, which has been reported as both annual and biennial in the Atlantic (Ford et al.,
unpublished). It has also been reported in some species of viviparous snakes such as the adder
Vipera berus, which typically exhibits biennial or triennial periodicity but was found to
reproduce annually during a year that had unusually warmer temperatures, allowing for more
time to forage for prey (Strugariu et al, 2014). It has also been suggested that migratory patterns

24
could impose an energy deficit on animals that undergo large seasonal migrations, reducing the
amount of energy available for reproductive efforts (Sulikowksi et al, 2007). Although there is
limited data on migratory patterns of C. isodon in the Gulf of Mexico, the distribution in that
ocean basin lies along the same latitude, suggesting migration would not be necessary since it is
driven primarily by temperature (Castro, 1993). Atlantic populations have a distinct migratory
pattern that spans the coasts of three states (Castro, 1993) and may explain in part the
requirement for biennial vs annual reproduction in the Atlantic.
The differences that occur in reproduction between Gulf of Mexico and Atlantic populations can
have consequences for population growth and management. Using theoretical longevity
estimates from Gulf of Mexico and Atlantic finetooth shark females from Carlson et al (2003)
and Drymon et al (2006) of 14.4 and 18.2 years, respectively, and an estimated age at maturity of
4.3 and 6.3, respectively, annual Gulf of Mexico finetooth sharks would have approximately 10.1
reproductive events/lifetime and a lifetime fecundity between 20.1-60.1 pups whereas a biennial
Atlantic finetooth shark would have approximately 5.95 reproductive events/lifetime and a
lifetime fecundity of 11.9-35.7 pups, almost half that of their Gulf counterparts. This would
suggest that Atlantic finetooth sharks may be more susceptible to overfishing and may need to be
managed as a separate distinct population.
Potentially adding to susceptibility of the Atlantic Ocean finetooth populations is the non-trivial
rate of EED (nearly 15%) observed in the current study. While there is little previously
published material on EED in elasmobranch fishes, high rates of infertility can clearly have

25
negative effects on population growth. Cortes and Parsons (1996) conducted a demographic
study that demonstrated that unsuccessful fertilization and EED in the bonnethead shark,
Sphyrna tiburo, could reduce population growth rate by as much as 22%. More data on this
phenomenon is necessary to determine whether the rate of EED displayed by C. isodon is an
anomaly or is prevalent throughout the elasmobranchs.
Results from this study conclude the use of a biennial reproductive strategy with concurrent
cycles of folliculogenesis and gestation and a median litter size of 4 pups/litter, all reproductive
characteristics that are intermediate to those in the small coastal shark (SCS) and large coastal
shark (LCS) complexes. Their biennial reproductive strategy distinguishes them from all other
SCS species and is a quality more characteristic of LCS species. Since species-specific life
history information on C. isodon has been limited, it was placed in the small coastal shark
complex. Information from this study indicates that placement of this species in the SCS
complex may not be accurate since many of its reproductive and life history characteristics more
closely resemble those species belonging to the LCS complex, a notion shared by Carlson et al
(2003) and Drymon et al (2006). Placement in the SCS complex may prove detrimental to future
stock structures and overall abundance since the SCS complex is not as tightly regulated as the
LCS complex. In recent assessments of elasmobranch fisheries, species and region specific
management practices been implemented and are more in line with emerging ecosystem based
fisheries management, which consider the functional role of a species in a holistic context.
Future considerations on managing this stock in this manner may need to be taken in order to
properly sustain Atlantic Ocean populations of C. isodon.

26
COMPONENT 2: THE REPRODUCTIVE ENDOCRINOLOGY OF
FINETOOTH SHARK, CARCHARHINUS ISODON, IN THE NORTHWEST
ATLANTIC OCEAN
INTRODUCTION
The elasmobranch fishes are one of the most basal of all living vertebrate groups (Hamlett, 2005;
Carrier et al, 2012), having been present throughout evolutionary history for over 400 million
years. Although the living members of this group number much less than other living vertebrate
groups, they have still managed to evolve a broad number of reproductive strategies that have
presumably contributed to their success and survival. These reproductive strategies range from
egg-laying or oviparity to live-bearing or viviparity, the latter of which includes aplacental forms
of viviparity, in which embryos are nourished by yolk from unfertilized eggs and placental
viviparity, in which embryos are nourished directly by umbilical connections to the female
(Wourms, 1977). Regardless of the mode of embryonic nourishment, elasmobranch
reproduction generally requires a dynamic and complex hormonal system to regulate these
reproductive modes. An understanding of these strategies can give insight into the evolution of
reproduction in other vertebrate taxa. For example, the hypothalamus-pituitary-gonadal (HPG)
axis that controls release of reproductive hormones such as estrogen and testosterone in the
elasmobranchs (Awruch, 2012) has been found in the most basal vertebrates, the hagfish and
lampreys and has been highly conserved throughout vertebrate evolutionary history (Uchida et
al, 2010; Callard et al, 1989b; Kah et al, 2007).

27
There is also a worldwide fishery for elasmobranchs and they have become increasingly popular
fishery targets since the advent of the shark fin trade. As a result, population declines have been
observed in many chondrichthyan families (NMFS, 1993; Dulvy et al, 2000; Cortes et al, 2006).
Management initiatives have been implemented for sharks and rays beginning in 1993 (NMFS,
1993; NMFS, 1999). A working knowledge of life history characteristics such as age and size at
maturity, life span, gestation length and reproductive periodicity are essential components of an
effective management plan (Walker, 2005). However, the traditional methods of obtaining these
data generally require lethal sampling and subsequent analysis of morphological changes to the
gonads throughout the reproductive cycle. Recently, due to ethical concerns and declining
populations of sharks, lethal sampling methods have come into question and more interest is
being taken into developing and using non-lethal sampling techniques.
Non-lethal methods include the analysis of circulating sex hormones found in blood plasma. A
number of steroid hormones, specifically 17-β estradiol (E2), progesterone (P4), and testosterone
(T), are correlated with reproductive events in sharks and their relatives. Increases in circulating
E2 concentrations have been linked with ovarian follicular development in both oviparous and
viviparous species of elasmobranchs (Manire et al, 1993; Tsang and Callard, 1987; Hoffmayer et
al, 2010; Sulikowski et al, 2004) via stimulation of the hepatic production of the protein
vitellogenin, which accumulates in developing follicles as yolk proteins (Dodd and Sumpter,
1984). E2 is also believed to play a role in regulating various aspects of reproductive tract
function development (Callard et al, 2005; Gelsleichter and Evans, 2012), in some cases by
influencing the expression or actions of other hormones such as relaxin (Koob and Callard,
1991). P4 has also been linked with a number of reproductive processes such as ovulation, the

28
cessation of vitellogenesis (Tricas et al, 2000; Prisco et al 2008), embryonic diapause (Waltrick,
2012), and early stages of pregnancy (Sobrera and Callard, 1995). Last, testosterone has been
suggested to be the dominant androgen hormone regulating male reproductive events such as
spermatogenesis (Gelsleichter and Evans, 2012; Manire and Rasmussen, 1997). It has also been
linked to sexual maturation in males and elongation of claspers (Sulikowski et al, 2005). In
female vertebrates, testosterone has also been proposed to play various roles in regulating
reproduction like sperm storage (Roy and Krishna, 2010) along with its primary role in serving
as the precursor for estradiol production via conversion by the enzyme p450 aromatase
(Greenspan, 1997).
Although research into hormone cycles has increased, little published work has focused on
regulatory mechanisms for these hormones. Identifying sites of the various hormone receptors
could offer insight into how steroid hormones operate within the body. Since the cartilaginous
fishes are the first taxa to possess these receptors, (Ogino et al, 2009), they could serve as a
model organism for understanding the ancient roles of these hormones in other vertebrate taxa.
The steroid hormone receptors are members of the nuclear receptor (NR) superfamily, which
also include the glucocorticoid and mineralocorticoid receptors, among others. NRs exert their
biological effects by binding to specific intranuclear sequences, acting as transcription factors
that regulate gene expression (Molina, 2006). Androgen receptor (AR) and progesterone
receptor B (PRB) under basal conditions exist in the cytoplasm whereas estrogen receptor-α
(ERα) is generally found in the nucleus.

29
The goal of the present study was to investigate the reproductive endocrinology of the finetooth
shark, Carcharhinus isodon. To achieve this, concentrations of circulating steroid hormones and
locations of hormone receptors during different stages of the reproductive cycle were
determined. This species has come under increasing fishing pressure in the last 20 years and was
previously found to be overfished in past stock assessments (NMFS, 2002; NMFS, 2007). In
order to properly manage a stock, information on life history and reproductive biology is
essential. However, the last published study of this species in the Atlantic was conducted over
20 years ago and was limited to only gross morphology. As a result, updated information on the
life history and reproductive biology of this species is urgently needed for improved
management (NMFS, 2007). In this study, plasma concentrations of E2, P4 and T in mature
male and female C. isodon were measured to characterize the reproductive endocrinology of this
species. These methods were validated by comparison to changes in the morphology and
histology of reproductive organs. Immunocytochemistry was conducted to identify target organs
for the function of gonadal steroid hormones.

30
MATERIALS AND METHODS
Sampling methods- Mature male and female C. isodon were collected from July 2012-October
2014 using gillnet and bottom longline fishing in coastal waters of the Atlantic Ocean from
South Carolina to central Florida. Sample collection methods are described in detail in Chapter
1. Sampling was conducted on a monthly basis to obtain samples from all reproductive stages.
Males were deemed mature when they possessed calcified claspers that rotated 180° with a freely
opening rhipidion. Female maturity was determined by examination of the reproductive tract
following criteria described in Manire et al. (1995). Blood was obtained from live animals via
caudal venipuncture with a sterile syringe with an 18-gauge needle and transferred into a vacuum
tube containing acid-citrate dextrose (ACD) anticoagulant modified for elasmobranchs. Plasma
was clarified via centrifugation at 1300g for 5 minutes and frozen at -20°C until used for
hormone analysis. Samples of mature male and female reproductive structures were removed
following blood sampling and stored in 10% saline buffered formalin. For males, sections of the
testis and head epididymis were taken. For females, sections of ovarian follicles, uterus and
oviducal glands were taken. Upon removal, samples were fixed in 10% buffered formalin in
elasmobranch-modified phosphate buffered saline for a minimum of 48 h. They were then
trimmed and rinsed in tap water for 24 hrs and stored long-term in 70% EtOH until used for
examining hormone receptor distribution using histology and immunocytochemistry.
31
Hormone concentrations- Circulating concentrations of the sex steroid hormones 17-β estradiol
(E2), progesterone (P4) and testosterone (T) were measured using the commercially available
AccuLite chemiluminescent immunoassay (Monobind, Lake Forest, CA) following the
manufacturer’s instructions. Chemiluminescence was measured using the Synergy HT Multi-
Mode Microplate Reader (BioTek Instruments, Winooski, VT) in luminescence mode.
Validation of each kit for use with C. isodon was determined using parallelism to determine
whether serial dilutions of samples (1/1 to 1/50) behaved according to a standard curve generated
using known amounts of hormone standards as provided in each kit. A ‘cold spike’ was also
used to determine percent recovery by adding a known amount of hormone standard to each
sample and calculating the recovery. Recovery results were used to determine the ideal dilution
of plasma to avoid matrix effects. Hormone concentrations for each sample were calculated by
multiplying by the dilution factor used.
Immunocytochemistry- Sub-samples of organ samples were dehydrated in a graded series of
EtOH (80-100%), cleared in CitriSolv (Fisher Scientific, Fair Lawn, NJ) and processed for
routine paraffin histology. Transverse 5-µm sections were prepared using a rotary microtome
and adhered to microscope slides pre-treated with 0.01% poly-L-lysine. Immunocytochemistry
was performed to identify the presence of androgen and progesterone receptors (AR and PR,
respectively) in males, and estrogen receptor-α (ER) and PR in females. Sections were
deparaffinized in CitriSolv followed by rehydration in a descending graded series of histological
grade EtOH (100-95%) and rinsed in tap water. Antigen retrieval was performed by incubating
sections in sodium citrate (10mM, pH 6) at 95°C for 20 min to expose antibody binding sites.
Slides were then cooled to room temperature, rinsed in phosphate buffered saline (PBS) and

32
blocked for non-specific antibody binding with 2% goat serum overnight at 4°C. Slides were
rinsed twice with PBS the following day followed by incubation in the appropriate primary
antibody for 24 h at 4°C (Table 1.1). Endogenous enzyme activity was quenched by incubating
sections in a 1:1 mixture of 3% hydrogen peroxide and 100% methanol prior to addition of
primary antibody. Control sections were incubated with diluent in place of primary antibody. On
the final day of the protocol, slides were rinsed once in PBS containing 0.05% Tween-20 (PBS-
T) and then twice with PBS. Sections were then incubated in secondary antibody (anti-rabbit Ig
for AR and ER-α or anti-mouse Ig for PR, ImmPRESS Polymer Detection Kits, Vector) for 30 m
at room temperature, after which they were rinsed three times in PBS for 5 min each. Antibody
binding sites were then revealed by addition of the peroxidase substrate 3’3-diaminobenzidine
(ImmPACT DAB, Vector). Once substrate-enzyme binding induced a noticeable color change
(~ 5 min), slides were transferred to a running tap water bath for 10 minutes. They were then
counterstained with 2% methyl green (Vector) for 30-45min at 37°C and rinsed in tap water for 2
min followed by dehydration in an ascending, graded series of alcohols (95-100%) and clearing
with CitriSolv. Slides were coverslipped and mounted using Cytoseal-60 (Richard-Allan
Scientific, Kalamazoo, MI) and allowed to dry.
Data Analysis- Hormone concentrations in males were grouped by month and analyzed using
one-way ANOVA followed by a Tukey’s post hoc test to determine if significant differences
were present. For females, hormone concentrations were analyzed via two-way ANOVA
followed by multiple comparison tests to determine if significant differences occurred by month
and/or reproductive stage. Non-parametric alternatives were used when data sets did not meet
the assumptions of parametric tests. Spearman’s ρ was used to determine whether gonads were

33
significantly correlated to hormone concentrations. Hormone receptor localization was analyzed
qualitatively via light microscopy to determine temporal and/or stage related changes.

34
Table 2.1 Primary antibodies and their corresponding secondary antibodies used to isolate
hormone receptors in the reproductive tract of mature male and female C. isodon.
Receptor Receptor Type Manufacturer
Androgen receptor AR-21 Millipore,
Temecula, CA
Estrogen receptor ERα C1355 Millipore,
Temecula, CA
Progesterone receptor PR-22 ThermoScientific, Rockford,
IL

35
RESULTS
Hormone concentrations
Females- A total of 41 and 67 females were analyzed for E2 and P4, respectively. Plasma E2
concentrations varied significantly based on pregnancy status, with non-gravid females having
significantly higher concentrations than gravid individuals (two-way ANOVA, p<0.001).
Temporal variations in plasma E2 were also observed in non-gravid females in relation to
reproductive stage. Plasma E2 concentrations were very low in recently pupped females
following parturition then increased in females collected in winter and spring (Jan-March), the
period of maximum follicular growth (Figure 2.1). E2 levels then declined markedly in post-
ovulatory and newly gravid females collected in May, females that would have been categorized
as non-gravid prior to this stage. E2 was significantly correlated with follicle diameter (Figure
2.2; Spearman’s ρ, P <0.001). In contrast, there were no clear patterns in plasma P4
concentrations throughout the reproductive cycle (Figure 2.3). Concentrations were relatively
low in both gravid and non-gravid females in all months measured, with spikes occurring in only
a few non-gravid individuals collected during spring and fall.

36
[CELLRANGE] [CELLRANGE] [CELLRANGE] [CELLRANGE] [CELLRANGE] [CELLRANGE] [CELLRANGE] [CELLRANGE] [CELLRANGE] [CELLRANGE] [CELLRANGE] [CELLRANGE] [CELLRANGE] [CELLRANGE] 0
50
100
150
200
250
300
350
J F M A M J J A S O N D
AV
ER
AG
E [
E2]
(pg/m
L)
MONTH
GRAVID NON GRAVID
p=0.000
n=43
Figure 2.1. E2 concentrations of gravid and non-gravid mature female C. isodon in the
northwest Atlantic Ocean. Bars represent means ±SEM. Sample size is represented
inside bars. Significance was determined using a two-way ANOVA (p=0.276 for
month; p<0.001 for reproductive condition).

37
R² = 0.5237
0
50
100
150
200
250
300
350
400
450
0 5 10 15 20 25
E2 C
ON
CE
NT
RA
TIO
N (
pg/m
L)
MAXIMUM FOLLICLE DIAMTER (mm)
n=40
Figure 2.2. Plasma E2 concentration and maximum follicle diameter in mature female C.
isodon from the northwest Atlantic Ocean. E2 concentrations were significantly correlated with
follicle diameter (Spearmans ρ, P<0.001).

38
[CELLRANGE]
[CELLRANGE] [CELLRANGE] [CELLRANGE] [CELLRANGE] [CELLRANGE] [CELLRANGE] [CELLRANGE]
[CELLRANGE] [CELLRANGE] [CELLRANGE] [CELLRANGE]
[CELLRANGE]
[CELLRANGE] [CELLRANGE] [CELLRANGE]
[CELLRANGE]
[CELLRANGE]
[CELLRANGE]
0
10
20
30
40
50
60
70
J F M A M J J A S O N D
AV
ER
AG
E [
P4
] (n
g/m
L)
MONTH
GRAVID NON GRAVID
p=0.646
n=61
Figure 2.3. Plasma P4 concentrations of gravid and non-gravid mature female C. isodon from
the northwest Atlantic Ocean. Bars represent means ±SEM. Sample sizes are shown inside
or above bars. Significance was determined via a one way ANOVA (p=0.646).
39
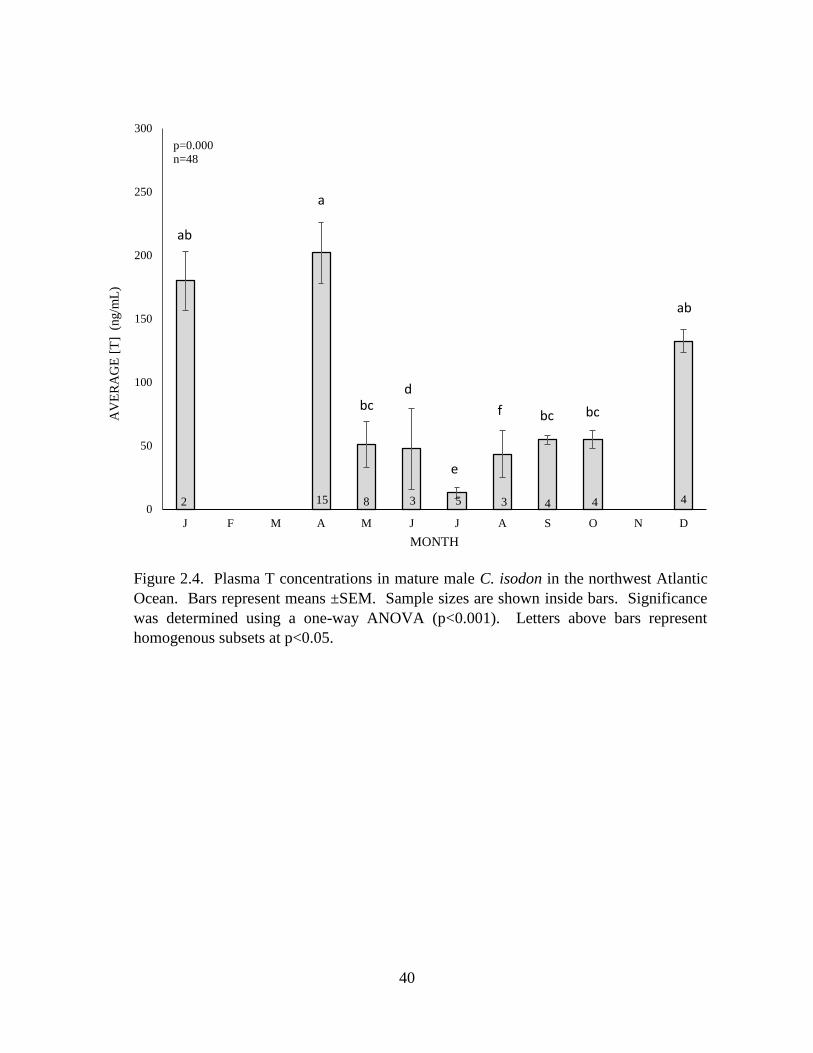
Males- Plasma T concentrations were measured in a total of 48 mature male C. isodon and
displayed significant temporal fluctuations (one-way ANOVA, p<0.001). T levels were elevated
winter through spring, reaching their maximum concentrations in April (Figure 2.4). This peak
coincided with the period of greatest testicular growth and a predominance of late stage mature
spermatocysts, indicating this is the period of spermatogenesis. Plasma T concentrations were
drastically lower in May, coinciding with the beginning of the mating season. Low T levels were
observed from May to October corresponding to a period of minimum testicular growth and high
quantities of early stage spermatocysts indicating little sperm production occurred during this
time period. T concentrations were significantly correlated with testis width (Figure 2.5,
Spearman ρ, P<0.001).
40
2 15 8 3 5 3 4 4 4 0
50
100
150
200
250
300
J F M A M J J A S O N D
AV
ER
AG
E [
T]
(ng/m
L)
MONTH
p=0.000
n=48
ab
a
bc d
e
f bc bc
ab
Figure 2.4. Plasma T concentrations in mature male C. isodon in the northwest Atlantic
Ocean. Bars represent means ±SEM. Sample sizes are shown inside bars. Significance
was determined using a one-way ANOVA (p<0.001). Letters above bars represent
homogenous subsets at p<0.05.

41
R² = 0.5815
0
50
100
150
200
250
300
350
400
0 5 10 15 20 25 30 35 40 45
T C
ON
CE
NT
RA
TIO
N (
ng/m
L)
TESTIS WIDTH (mm)
n=53
Figure 2.5. Plasma T concentration and testis width in male C. isodon from the northwest
Atlantic Ocean. Plasma T concentrations were significantly correlated with testis width
(Spearman ρ, P<0.001).

42
Immunocytochemistry- Immunocytochemistry was performed on a total of 38 female and 39
male C. isodon during different stages of the reproductive cycle. In the ovaries, ERα was absent
in primordial and primary follicles (Figure 2.6a). Pre-vitellogenic follicles displayed scattered
positive ERα staining in the granulosa and theca cell layers (Figure 2.6b). ERα staining was
most prominent in vitellogenic follicles where deep staining occurred in the granulosa cell layer
and scattered staining was found in the theca cell layers (Figure 2.6c). Positive ERα staining was
also observed in yolk crystals of pre-vitellogenic and vitellogenic follicles (Figures 2.6b, 2.6c).
Atretic follicles displayed positive staining in nuclear regions of the infolding granulosa cells
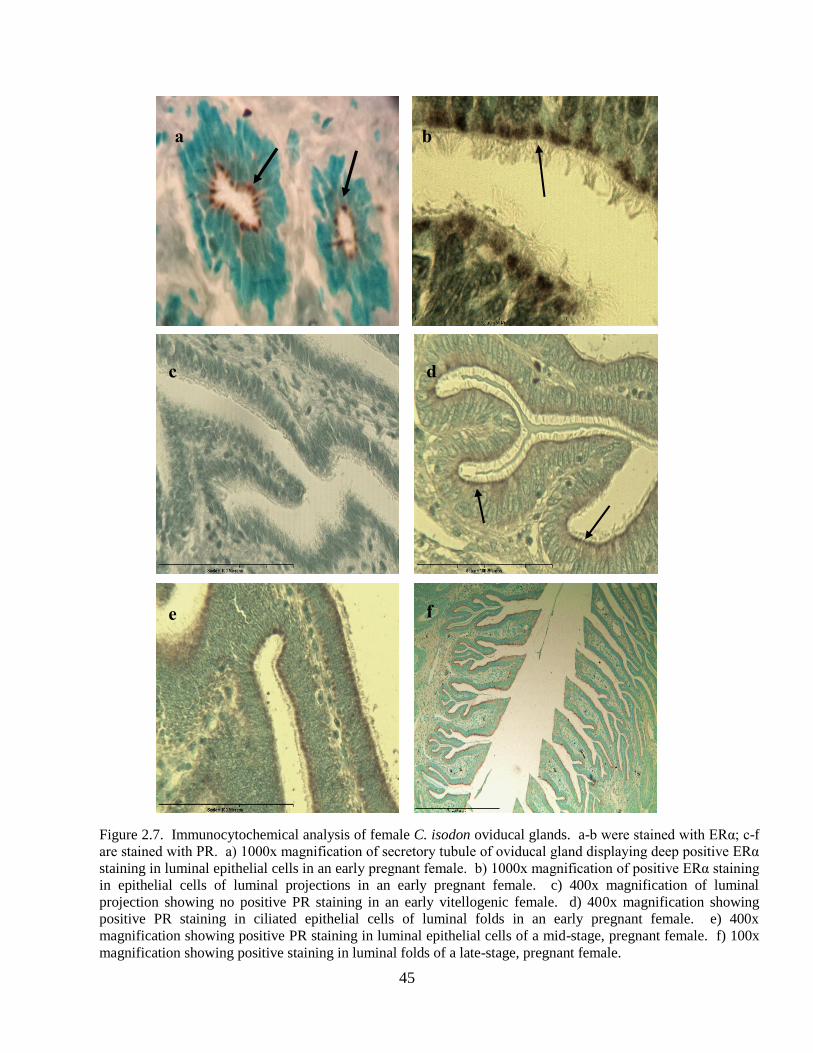
(Figure 2.6d). In the oviducal gland, ERα staining was found in pre-ovulatory non-gravid and
early pregnant females in epithelial cells lining secretory tubules that are associated with egg
encapsulation (Figure 2.7a, 2.7b). In the uterus, ERα staining was found in luminal epithelial
cells and stromal cells of non-pregnant females (Figures 2.8a, 2.8b).
There was strong PR immunoreactivity in the oviducal gland of early, mid- and late-stage
pregnant females, specifically in the ciliated epithelial cells lining luminal projections (Figure
2.8c, 2.8d, 2.8e). This staining was absent in oviducal glands of pre-ovulatory vitellogenic
females. Stromal, luminal epithelial and myometrial muscle cell PR staining was also observed
in the uterine folds of non-gravid, pre-ovulatory females (Figure 2.9c, 2.9d).
In males, AR immunoreactivity was present in late stage spermatocysts (Stage V-Stage VI) that
were actively undergoing spermatogenesis (Figure 2.10a). Immunoreactivity occurred in Sertoli
and ductal cells (Figures 2.10b, 2.10c, respectively) as well as on individual spermatozoa,

43
specifically in the head and mid-piece regions (Figure 2.10d). ARs were absent in early stage
spermatocysts (Stage I-Stage IV). In the epididymis, ARs were found in basolateral epithelial
cells (Figure 2.10e).

44
Pr
e
YC
GC
TL f
GC
TL c
AF
d h
a
b
g
Figure 2.6. Immunocytochemical analysis of the presence of ERα in female C. isodon ovaries
through different stages of the ovarian cycle. a-d represent samples that were stained for ERα;
e-h are negative controls. a) 400x magnification of a primordial follicle (Pr) with no positive
staining. b) 400x magnification of a pre-vitellogenic follicle with scattered positive ERα staining in
the granulosa (GC) and theca cell (TL) layers. c) 400x magnification of a vitellogenic follicle
displaying deep positive ER staining in the GC layer and scattered positive staining in the TL. d)
10x magnification of an atretic follicle with deep nuclear staining of infolding GC layer.
45
a b
c d
e f
Figure 2.7. Immunocytochemical analysis of female C. isodon oviducal glands. a-b were stained with ERα; c-f
are stained with PR. a) 1000x magnification of secretory tubule of oviducal gland displaying deep positive ERα
staining in luminal epithelial cells in an early pregnant female. b) 1000x magnification of positive ERα staining
in epithelial cells of luminal projections in an early pregnant female. c) 400x magnification of luminal
projection showing no positive PR staining in an early vitellogenic female. d) 400x magnification showing
positive PR staining in ciliated epithelial cells of luminal folds in an early pregnant female. e) 400x
magnification showing positive PR staining in luminal epithelial cells of a mid-stage, pregnant female. f) 100x
magnification showing positive staining in luminal folds of a late-stage, pregnant female.

46
a b
c d
Figure 2.8. Immunocytochemisty analysis of female C. isodon uterus. a-b were stained with ERα; c-d
were stained with PR. a) 400x magnification showing positive ER staining in the epithelial and
stromal cells of a pre-ovulatory uterus. b) 400x magnification showing positive staining of stromal
and epithelial cells in uterine folds of a pre-ovulatory female. c) 400x magnification of positive PR
staining in myometrial muscle cells of pre-ovulatory uterus. d) 100x magnification showing positive
PR staining in uterine folds of pre-ovulatory uterus.

47
a b
SC
c DC d
SZ
H
MP
EC e
Figure 2.9. Immunocytochemical analysis of male C. isodon gonads. (a-d) represent AR staining in
the testis, (e) shows AR staining in the epididymis. a) 400x magnification showing positive AR
staining in Stage VI spermatocyst. Arrows indicate positive staining on mid-piece region of
spermatozoa. b) 1000x magnification of a) showing positive AR staining surrounding Sertoli cells
(SC). c) 1000x magnification showing positive AR staining in ductal cell (DC) on the outside of a
spermatocyst. d) 1000x magnification showing arrows pointing to positive AR staining on head-
piece (H) and mid-piece (MP) regions of spermatozoa in the testis. e) 400x magnification with
arrows pointing to positive staining in basolateral epithelial cells (EC) of epididymis.

48
DISCUSSION
The results of this study show an association between reproductive events and plasma hormone
profiles in both male and female C. isodon in the northwest Atlantic Ocean. In females, plasma
E2 concentrations displayed a temporal trend with peaks occurring during follicular development,
suggesting a role in vitellogenesis. This was supported by evidence for the presence of ERα in
granulosa and theca cells of vitellogenic follicles. In contrast, plasma P4 concentrations did not
display a clear temporal trend in female C. isodon, remaining relatively constant in both gravid
and non-gravid females throughout the duration of the reproductive cycle. However, positive
detection of PR suggested possible roles for this hormone in regulating various aspects of
reproductive tract function including roles in the oviducal gland and uterus. Male C. isodon also
displayed plasma T concentrations indicative of a seasonally reproducing shark, increasing
specifically during the period of spermatogenesis. ARs were prominently detected in both
supporting cells (i.e., Sertoli cells) and germ cells in the male testis as well as the epithelial cells
of the epididymis, suggesting both direct and indirect effects on male gamete function.
The patterns observed in E2 concentrations in female C. isodon were comparable with those
observed in other seasonally reproducing sharks such as Sphyrna tiburo, Rhizopriondon
terraenovae and Hemiscyllium ocellatum (Manire et al, 1995; Hoffmayer et al, 2010; Heupel et
al, 1999). Elevated E2 concentrations have been previously correlated with vitellogenesis in
female elasmobranchs, in which this hormone is believed to stimulate hepatic production of the
protein vitellogenin as well as its accumulation in growing follicles (Dodd and Sumpter, 1984).

49
This trend has been observed in both placental viviparous sharks (Manire et al, 1995) as well as
oviparous sharks and rays (Tricas et al, 2000; Heupel et al, 1999; Koob et al 1986). This study
also showed that these changes reflect specific roles for these hormones in the reproductive tracts
of females. With the increase in E2 during vitellogenesis, the presence of ERα was also detected
in the follicles, specifically in the granulosa cell layer. The granulosa cell layer is a well-
established target of this hormone where aromatization of androgens diffused from the theca
cells into estrogens occurs (Molina, 2006). Immunoreactivity of ERα increased as the follicles
matured and accumulated yolk and was absent in primordial and primary follicles of non-
vitellogenic females. These findings are similar to previous studies that also found positive
staining in the granulosa cell layer (Wang et al 2000) and an increase in ERα mRNA in the ovary
towards the end of the ovarian cycle (Nagler et al, 2012). The increase in the presence of ERα
was also consistent with elevated levels of plasma E2. ERα were also detected in the oviducal
gland of pre-ovulatory and early pregnant females, specifically in the secretory tubules. Since
these tubules are responsible for egg encapsulation (Hamlett, 2005), E2 may be present in
anticipation of ovulated follicles in pre-ovulatory females. Similar staining patterns have also
been found in multiple vertebrate species throughout the reproductive cycle (di Cosmo et al,
2002; Wang et al, 2000; Socorro et al, 2000).
Variations in plasma P4 concentrations in mature female C. isodon were not consistent with
those observed in other elasmobranchs for which this hormone has been examined, most of
which exhibit increased levels of P4 during ovulation (Manire et al., 1995). However, the role
that P4 plays in reproduction has not been consistently connected with any reproductive event in
female elasmobranchs to date. P4 has mainly been connected with ovulation and the suppression

50
of vitellogenesis in elasmobranchs (Perez and Callard, 1992), but these stages were missing in
this study. Nonetheless, PR were detected in the oviducal gland throughout the entirety of
pregnancy in gravid females, suggesting possible roles in ovulation and/or egg encapsulation. In
the uterus, P4 was found in luminal epithelial, stromal and myometrial muscle cells. These areas
have shown positive PR staining in multiple taxa and have been suggested to play roles in the
preparation of the uterus for pregnancy and intrauterine muscle contractions (Vermiersch et al,
2000; Snijers et al, 1992).
Temporal patterns in plasma T concentrations in male C. isodon were consistent with those
observed in males from other seasonally reproducing elasmobranchs and corroborates a well-
established role this hormone has been suggested to play in spermatogenesis (Manire et al, 1995;
Gelsleichter and Evans, 2012; Hoffmayer et al, 2010). Immunolocalization of AR during
different stages of the reproductive cycle also supported these roles. AR immunoreactivity was
found in the Sertoli and germ cells of late stage spermatocysts in the testes of males undergoing
spermatogenesis, corresponding with high levels of plasma T and an increase in testicular
growth. ARs were mostly absent in early-stage spermatocysts throughout the entirety of the
reproductive cycle and from specimens with low T levels and minimal testicular growth. The
presence of AR during spermatogenesis is consistent with the well-established role that T has in
that process (Walters et al, 2010; Manire et al, 1995; Gelsleichter and Evans, 2012; Hamlet
2006). ARs have been previously reported to be found in Sertoli and Leydig cells of animals
actively undergoing spermatogenesis, but absent or weakly expressed in aspermatogenic animals
(Okuyama et al, 2014; Pearl et al, 2011). Sertoli cells are thought to have critical central roles in
spermatogenesis such that interruption of that process would occur if either are missing or

51
nonfunctional. For example, recent studies have demonstrated that deletion of the AR gene in
mice Sertoli cells can result in complete arrest of spermatogenesis at the spermatid stage (Wang
et al, 2009). Other studies have also correlated elevated T concentrations with an increase in AR
expression in Sertoli cells (Verhoeven and Cailleau, 1988). Interestingly, immunoreactive AR
was also found in the head and mid-piece regions of individual spermatozoa, which has
previously been reported in human sperm (Solakidi et al, 2005, Aquila et al, 2007) although the
role of androgens in maturing sperm is still unknown and the presence of AR on individual
spermatozoa is controversial. In the epididymis ARs were found in basolateral epithelial cells
lining the epididymis. AR receptors have also been shown in the epididymis and efferent ducts in
mature rats (Zaya et al, 2013) deer (Kaziol and Kaziorowski, 2013) and humans (Ungefroren et
al, 1997). ARs in the epididymis bind androgens that further aid the maturation of sperm once it
leaves the testes (Ungefroeren et al, 1997) and is also required for normal post-natal epididymal
development (You, 1998).
In conclusion, seasonal changes were observed in plasma concentrations of T and E2 in male and
female C. isodon in the northwest Atlantic. Although P4 displayed relatively low, constant
concentrations, spikes were observed in individuals suggesting this hormone may have a
secondary role in maintaining various reproductive processes, although additional samples are
needed to further investigate this notion. Strong evidence suggests that T contributes to the
regulation of spermatogenesis and its effects are mediated by ARs in the testis and epididymis.
E2 regulates vitellogenesis in non-gravid females and has its effects through ERα in the ovaries,
oviducal gland and uterus. PRs were found in the cytosol of developing spermatocysts and may
contribute to sperm maturation and spermeiogenesis. This study sheds additional light on the role

52
the steroid hormones play in the reproductive cycle of a relatively understudied species of
commercially viable shark. It is also one of the few studies to qualitatively investigate the
location of hormone receptors in an elasmobranch in an effort to understand their cellular
functions. Future directions should focus on quantitatively measuring cellular receptors in
relation to different periods of the reproductive cycle in an effort to shed further light on the
functions of the steroid hormones in reproduction.

53
LITERATURE CITED
Aquila, S, Middea, E, Catalano, S, Marsico, S, Lanzino, M, Casaburi, I, Barone, I, Bruno,
R, Zupo, S and Ando, S. 2007. Human sperm express a functional androgen receptor:
effects on PI3K/AKT pathway. Human Reproduction, 22(10):2594-2605.
Awruch, CA. 2013. Reproductive endocrinology in chondrichthyans: the present and the future.
General and Comparative Endocrinology. 192:60-70.
Bethea, DM, Buckel, JA and Carlson, JK. 2004. Foraging ecology of the early life stages of
four sympatric shark species. Marine Ecology Progress Series. 268: 245-264.
Branstetter, S. Age and Growth Estimates for Blacktip, Carcharhinus limbatus, and Spinner, C.
brevipinna, Sharks from the Northwestern Gulf of Mexico. 1987. Copeia. 1987(4):964-
974.
Callard, IP, George, JS and Koob, TJ. 2005. Endocrine control of the female reproductive tract.
W. Hamlett (Ed.), Reproductive Biology and Phylogeny of Chondrichthyes: Sharks,
Batoids and Chimaeras, Science Publisher Inc., Einfeld, NH, pp. 283–300.
Callard, I.P., Klosterman, LL, Sorbera, LA, Fileti, LA and Reese, JC. 1989b.
Endocrine regulation of reproduction in elasmobranchs: Archetype for terrestrial
vertebrates. Journal of Experimental Biology. 252:12-22.
Carrier, J.C., Musick, J.A. and Heithaus, M.R. 2012. Biology of Sharks and Their Relatives,
Second Edition. Taylor and Francis Group, Boca Raton, FL.
Carlson, JK, Sulikowski, JR and Baremore, IE. 2006. Do differences in life history exist for
blacktip sharks, Carcharhinus limbatus, from the United States South Atlantic Bight and
Eastern Gulf of Mexico? Age and Growth of Chondrichthyan sharks: New Methods,
Techniques and Analysis. 279-292.
Carlson, J.K., Cores, E., and Bethea, D.M. 2003. Life history and population dynamics of the
finetooth shark (Carcharhinus isodon) in the northeastern Gulf of Mexico. Fisheries
Bulletin 101: 281-292.
Castro, J.I. 1993. The biology of the finetooth shark, Carcharhinus isodon. Environmental
Biology of Fishes 36:219-232.
Compagno, L.J.V. 1984. Sharks of the world. An annotated and illustrated catalogue of shark
species known to date. Part 2: Carcharhiniformes. FAO Fisheries Synopsis. 125:251-655.
Cortes, E, Brooks, E, Apostolaki, P and Brown, CA. 2006. Stock assessment of the dusky
shark in US Atlantic and Gulf of Mexico.

54
Cortes, E. 2002. Stock assessment of small coastal sharks in the US Atlantic and Gulf of
Mexico. Sustainable Fisheries Division Contribution SFD-01/02-152. NMFS, NOAA,
Silver Spring, MD.
Cortes, E and Parsons, GR. 2011. Comparative demography of two populations of the
bonnethead shark (Sphyrna tiburo). Canadian Journal of Fisheries and Aquatic Sciences.
53(4): 709-718.
Di Cosmo, A, Di Cristo, C and Paolucci. 2002. A estradiol-17β receptor in the reproductive
system of the female of Octopus vulgaris: Characterization and immunolocalization.
Molecular Reproduction and Development, 61(3):367-375.
de Silva, J.A., Condrey, R.E., and Thompson, B.A. 2001. Profile of shark bycatch in the US
Gulf of Mexico menhaden fishery. North American Journal of Fisheries
Management. 24: 111-124.
Dodd, JM and Sumpter, JP. G.E. Lamming (Ed.), Marshalls Physiology of Reproduction,
Churchill Livingstone, New York (1984), pp. 2–126.
Driggers, W.B., Hoffmayer, E.R. 2009. Variability in the Reproductive Cycle of the finetooth
shark, Carcharhinus isodon, in the northern Gulf of Mexico. Copeia 2:390-393.
Drymon, J.M., Driggers, W.B., Oakley, D. and Ulrich, G.F. 2006. Investigating life history
differences between finetooth sharks, Carcharhinus isodon, in the Northern Gulf of
Mexico and the Western North Atlantic Ocean. Gulf of Mexico Science 24: 2-10.
Fitz ES, Daiber FC. 1963. An introduction to the biology of Raja eglanteria (Bosc 1802) and
Raja erinacea (Mitchell 1825) as they occur in Delaware Bay. Bull Bingham Oceanogr
CoIl 18:69-96.
Gelsleichter, J and Evans, AN. Hormonal regulation of elasmobranch physiology. J.C. Carrier,
J.A. Musick, M.R. Heithaus (Eds.), Biology of Sharks and Their Relatives, CRC Press,
Boca Raton, FL (2012), pp. 313–348.
Greenspan FS, Strewler GJ. Basic and Clinical Endocrinology. Stamford, CT:Appleton &
Lange, 1997.
Hamlett, W.C. 2005. Reproductive biology and phylogeny of Chondrichthyes: sharks, batoids
and chimaeras. Science Publishers, Enfield, New Hampshire.
Heupel, MR, Whittier, JM and Bennett, MB. 1999. Plasma Steroid Hormone Profiles and
Reproductive Biology of the Epaulette Shark, Hemiscyllium ocellatum. Journal of
Experimental Zoology 284:586-594.

55
Hoffmayer, ER, Sulikowski, JA, Hendon, JM and Parsons, GR. 2010. Plasma steroid
concentrations of adult male Atlantic sharpnose sharks, Rhizoprionodon terraenovae, in
the northern Gulf of Mexico, with notes on potential long term shifts in reproductive
timing. Environmental Biology of Fishes. 88(1):1-7.
Kah, O, Lethimonier, C, Somoza, G, Guilgur, LG, Vaillant, C and Lareyre, JJ. 2007. GnRH and
GnRH receptors in metazoa: A historical, comparative, and evolutive perspective.
General and Comparative Endocrinology. 153:346-364.
Koob, TJ and Callard, IP. Reproduction in female elasmobranchs. R.K.H. Kinne (Ed.),
Oogenesis, Spermatogenesis and Reproduction Basel, Karger, Switzerland (1991), pp.
155–209.
Koob, TJ, Tsang, PCW and Callard, IP. 1986. Plasma estradiol, testosterone, and progesterone
levels during the ovulatory cycle of the skate (Raja erinacea). Biology of Reproduction
35(2):267-275.
Koziol, K and Koziorowski, M. 2013. Steroid hormones in peripheral blood plasma and
androgen receptors in testis and epididymis of roe deer male (Capreolus capreolus)
during the reproduction season. Small Ruminant Research, 115(1-3):86-93.
Laforgia, V, Limatola, E and Andreuccetti, P. 2008. Effect of 17b-estradiol and progesterone
on vitellogenesis in the spotted ray Torpedo marmorata : Studies on females and on
estrogen-treated males. General and Comparative Endocrinology 157(2):125-132.
Manire, CA, Rasmussen, LEL, Hess, DL, and Heuter, RE. 1995. Serum Steroid Hormones and
the Reproductive Cycle of the Female Bonnethead Shark, Sphyrna tiburo. General and
Comparative Endocrinology. 97(3): 366-376.
Manire, CA and Rasmussen, LEL. 1997. Serum concentrations of steroid hormones in the
mature male bonnethead shark, Sphyrna tiburo. General and Comparative Endocrinology
107(3):414-420.
Maruska, K.P., Cowie, E.G., and Tricas, T.C. 1996. Periodic Gonadal Activity and Protracted
Mating in Elasmobranch Fishes. The Journal of Experimental Zoology 276: 219-232.
Molina, P.E. 2006. Endocrine Physiology, Second Edition. The McGraw Hill Companies, New
York.
Nagler, JJ, Cavileer, TD, Verducci, JS, Schultz, IR, Hook, SE and Hayton, WL. 2012.
Estrogen receptor mRNA expression patterns in the liver and ovary of female rainbow
trout over a complete reproductive cycle. General and Comparative Endocrinology,
178(3):556-561.

56
National Marine Fisheries Service (NMFS). 1993. Fishery management plan for sharks of the
Atlantic Ocean, 167 p. U.S. Dep. Commer., Washington, D.C. National Oceanic and
Atmospheric Administration, Silver Spring, MD.
National Marine Fisheries Service (NMFS). 1999. Fishery management plan for sharks of the
Atlantic Ocean. US Department of Commerce, Washington DC, and National Oceanic
and Atmospheric Administration, Silver Spring, MD.
National Marine Fisheries Service (NMFS). 2007. Stock assessment report, small coastal
shark complex, Atlantic Sharpnose, Blacknose, Bonnethead and Finetooth Shark.
Section II: Data Workshop Report. SEDAR 13.
Ogino, Y, Katoh, H, Kuraku, S and Yamada, G. 2009. Evolutionary history and functional
characterization of androgen receptor genes in jawed vertebrates Endocrinology,
150(12):5415–5427.
Okuyama, MW, Shimozuru, M, Yanagawa, Y and Tsubota, T. 2014. Changes in the
Immunolocalization of Steroidogenic Enzymes and the Androgen Receptor in Raccoon
(Procyon lotor) Testes in Association with the Seasons and Spermatogenesis. Journal of
Reproduction and Development, 60(2):155-161.
Parsons, G.R. and Grier, H.J. 1992. Seasonal Changes in Shark Testicular Structure and
Spermatogenesis. The Journal of Experimental Zoology 261:173-184.
Pearl, CA, Mason, H and Roser, JF. 2011. Immunolocalization of estrogen receptor alpha,
estrogen receptor beta and androgen receptor in the pre-, peri- and post-pubertal stallion
testis. Animal Reproduction Science, 125(1-4):103-111.
Perez, L and Callard, IP. 1992. Identification of vitellogenin in the little skate (Raja erinacea).
Comparative Biochemistry and Physiology, 103:699-705.
Pratt, H.L. 1993. The storage of spermatozoa in the oviducal glands of western North Atlantic
sharks. Environmental Biology of Fishes. 38(1-3):139-149.
Prisco, M, Valiante, S, Maddalena di Fiore, M, Raucci, F, Del Giudice G, Romano, M, Laforgia,
V, Limatola, E, and Piero, A. 2008. Effect of 17β-estradiol and progesterone on
vitellogenesis in the spotted ray Torpedo marmorata Risso 1810 (Elasmobranchii:
Torpediniformes): Studies on females and on estrogen-treated males. General and
Comparative Endocrinology. 157(2):125-132.
Roy, V.K., and Krishna, A. 2010. Evidence of androgen-dependent sperm storage in female
reproductive tract of Scotophilus heathi. General and Comparative
Endocrinology.165:120-126.

57
Shah, C, Modi, D, Sachdeva, G, Gadkar, S and Puri, C. 2005. Coexistence of Intracellular
and Membrane-Bound Progesterone Receptors in Human Testis. The Journal of Clinical
Endocrinology and Metabolism, 90(1):474-483.
Snijders, MPML, de Goeji, AFPM, Debets-Te Baerts, MJC, Rousch, MJM, Koudstaal, J and
Bosman, FT. 1992. Immunocytochemical analysis of oestrogen receptors and
progesterone receptors in the human uterus throughout the menstrual cycle and after the
menopause. The journal of the Society for Reproduction and Fertility, 94:363-371.
Socorro, S, Power, DM, Olsson, PE and Canario, AV. 2000. Two estrogen receptors
expressed in the teleost fish, Sparus aurata: cDNA cloning, characterization and tissue
distribution. Journal of Endocrinology, 166:293-306.
Solakidi, S, Psarra, AMG, Nikolaropoulos and Sekeris, CE. 2005. Estrogen receptors α and β
(ERα and ERβ) and androgen receptor (AR) in human sperm: localization of ERβ and
AR in mitochondria of the midpiece. Human Reproduction. 20(12):3481-3487.
Sorbera, LA and Callard, IP. 1995. Myometrium of the spiny dogfish Squalus acanthias:
peptide and steroid regulation. American Journal of Physiology 269(2):R389-R397.
Sower, SA, Freamat, M and Kavanaugh, SI. 2009. The origins of the vertebrate hypothalamic–
pituitary–gonadal (HPG) and hypothalamic–pituitary–thyroid (HPT) endocrine
systems: New insights from lampreys. General and Comparative Endocrinology.
161(1):20-29.
Steven, JD, Bonfil, R, Dulvy, NK and Walker, PA. 2000. ICES Journal of Marine Science.
The effects of fishing on sharks, rays, and chimaeras (chondrichthyans), and the
implications for marine ecosystems. 57 (3):476-494.
Strugariu, A, Gherghel, I, and Zamfirescu, SR. 2014. Annual reproduction in female adders
(Vipera berus) from a montane environment. Journal of Herpetology. 48(4): 552-555.
Sulikowski, JA, Tsang, PCW and Howell, WH. 2004. An annual cycle of steroid hormone
concentrations and gonad development in the winter skate, Leucoraja ocellata, from the
western Gulf of Maine. Marine Biology. 144(5):845-853.
Sulikowski, JA, Tsang, PCW and Howell, WH. 2005. Age and size at sexual maturity for the
winter skate, Leucoraja ocellata, in the western Gulf of Maine based on morphological,
histological and steroid hormone analyses. Environmental Biology of Fishes 72(4):429-
441.
Sulikowski, J.A., Driggers, W.B., Ford, T.S., Boonstra, R.K., and Carlson, J.K. 2007.
Reproductive biology of the blacknose shark, Carcharhinus acronotus in the Gulf of
Mexico. Journal of Fish Biology. 70: 428-440.

58
Trent, L., Parsheley, D.E. and Carlson, J.K. 1997. Catch and bycatch in the shark drift gillnet
fishery off Georgia and Florida. Marine Fisheries Review. 59(1): 19-28.
Tricas, TC, Maruska, KP and Rasmussen, LEL. 2000. Annual cycles of steroid hormone
production, gonad development, and reproductive behavior in the Atlantic stingray.
General and Comparative Endocrinology, 188(2):209-225.
Tsang, PCW and Callard, IP. 1987. Morphological and endocrine correlates of the
reproductive cycle of the aplacental viviparous dogfish, Squalus acanthias. General and
Comparitive Endocrinology. 66(2):182-189.
Uchida, K, Moriyama, S, Chiba, H, Shimontani, T, Honda, K, Miki, Makota,
Takahashi, A, Sower, SA, and Nozaki, M. 2010. Evolutionary origin of a
functional gonadotropin in the pituitary of the most primitive vertebrate,
hagfish. Proceedings of the National Academy of Sciences. 107(36):15833-15837.
Ungefroren, H, Iyell, R and Ergiin, S. 1997. Region-specific expression of the androgen
receptor in the human epididymis. Molecular Human Reproduction, 3(11):933-940.
Uribe, MCA, Guillette, LJ. 2000. Oogenesis and Ovarian Histology of the American Alligator,
Alligator mississippiensis. Journal of Morphology. 245:225-240.
Verhoeven, G and Cailleau, J. 1988. Follicle-stimulating hormone and androgens increase the
concentration of the androgen receptor in sertoli cells. Endocrinology, 122:1541-1550.
Vermeirsch, H, Simoens, P, Hellemans, A, Coryn, M and Lauwers, H. 2000.
Immunohistochemical detection of progesterone receptors in the canine uterus and their
relation to sex steroid hormone levels. Theriogenology, 53(3):773-788.
Walker, T. I. 2005. Chapter 13. Management measures. In Management Techniques for
Elasmobranch Fisheries, pp. 216 – 242. Ed. by J. A. Musick, and R. Bonfil. FAO
Fisheries Technical Paper, 474. 251 pp
Walters, K.A., Simanainen, U., Handelsman, D.J., 2010. Molecular insights into
androgen actions in male and female reproductive function from androgen receptor
knockout models. Hum. Reprod. Update 16, 543-558.
Waltrick, D, Awruch, C and Simpfendorfer, C. 2012. Embryonic diapause in the
elasmobranchs. Reviews in Fish Biology and Fisheries. 22(4):849-859.
Wang R.-S., Yeh, S., Tzeng, C.-R., Chang, C, 2009. Androgen receptor roles in
spermatogenesis and fertility: lessons from testicular cell-specific androgen receptor
knockout mice. Endocr. Rev. 30, 119-132.

59
Wang, H, Eriksson, H and Sahlin, L. 2000. Estrogen Receptors α and β in the Female
Reproductive Tract of the Rat During the Estrous Cycle. Biology of Reproduction.
63(5):1331-1340.
Wourms, J.P. 1977. Reproduction and development in condrichthyan fishes. American
Zoology. 17 (2): 379-410.
You L, Sar M. Androgen receptor expression in the testes and epididymides of prenatal and
postnatal Sprague-Dawley rats. Endocrine. 1998;9(3):253-61.
Zaya, R, Hennick, C and Pearl, CA. 2012. In vitro expression of androgen and estrogen
receptors in prepubertal and adult rat epididymis. General and Comparative
Endocrinology, 178(3):573-586.

60
VITAE
NAME OF AUTHOR: Amanda Nevada Brown
DEGREE AWARDED:
May 2009: B.S. Biology, Florida Atlantic University, Boca Raton, FL
PROFESSIONAL EXPERIENCE:
2013-2014: Graduate Teaching Assistant, University of North Florida
Anatomy and Physiology I, Anatomy and Physiology II Laboratory
2012-2013: Graduate Teaching Assistant, University of North Florida
General Biology I, General Biology III Laboratory
2012-2013: Graduate Research Assistant, UNF Shark Biology Research Program
Investigating reproduction in C. isodon
2010: Fisheries Ecology Intern, Dauphin Island Sea Lab
Investigating effects of Deepwater Horizon oil spill on fish populations
2010: Research Assistant, Bimini Biological Field Station
Investigating effects of habitat loss on lemon shark nursery
2009: Research Assistant, Virginia Institute of Marine Science
Assisting in shark longline survey
AWARDS:
2006: Dean’s list, Santa Fe Community College
2008: Dean’s list, Florida Atlantic University


