
The Role of Dynamic Pricing in Fostering the Efficient Use of Electric Sector Resources
Presented to
Kansas Corporate Commission Workshop on Energy Efficiency
March 25, 2008Presented by:
Bernie Neenan
2© 2008 Electric Power Research Institute, Inc. All rights reserved.
Topical Outline
• Trends in residential electricity usage
• The impacts of dynamic pricing
• Feedback as a incentive to conserve
• Accessing price response

3© 2008 Electric Power Research Institute, Inc. All rights reserved.
Trends in Household Electricity Consumption
The relative energy
intensity of many
household devices is
going down
Expected Change in Intensity of Household Electricty End-Uses
-34%-25%-17%-13%
-4%
-40%
-35%
-30%
-25%
-20%
-15%
-10%
-5%
0%
Space Heat
Space Cool
Water H
eat
Refriger
ation
Lighting
But, we may be swimming against the
proliferation of devices with high
energy and power usage
Expected Change in Intensity of Household Electricty End-Uses
17%
27%
0%5%
10%15%20%25%30%
Other Uses TV/PC

4© 2008 Electric Power Research Institute, Inc. All rights reserved.
Impact of Disruptive Technologies
• Increased market penetration of large-screen TV
One Digital Photo Frame/ Household Will Require Five 250 MW New Generation Plant
• Digital Photo Frames
A Video Game @ 360W is like another plasma TV in the house
• Higher saturation of video games that have exceptionally high power requirements
Plasma uses 2-½ the energy of CRT and 23% more energy than LCD
• Plug-In Hybrid Electric VehiclesA PHEV will need 2,500-3,000 kWh/yr. – the timing of charging will determine the system impacts

5© 2008 Electric Power Research Institute, Inc. All rights reserved.
Roles for Pricing and Demand Response
• Efficiency. Setting price = marginal supply costs achieves the optimum allocation of societal resources
– Time-of-use – Real-time pricing– Market-participation pricing (ISO/RTO, direct or indirect)
• Rationing. Allocate available capacity resources efficiency– RTP– Critical peak pricing (CPP), Peak-time rebate (RTR)– ISO/RTO emergency programs
• Avoidance – load as a resources to reduce the overall system infrastructure needed to serve consumers’ needs
– Demand call options– Critical peak pricing (CPP), Peak-time rebate (RTR)– ISO/RTO installed capacity programs
• But, do prices convey the full cost to society of supplying electricity?

6© 2008 Electric Power Research Institute, Inc. All rights reserved.
But, will Consumers be Responsive to Dynamic Pricing?
No• Electricity is too insignificant a
cost to be bothered with
• Electricity is too essential, and there are no substitutes
• Electricity is not consumed directly (indirect demand)
• Conservation trumps price response in terms of benefits
• Insufficient inducement/incentive to respond
• It’s too hard to respond
• Paying consumers to curtail is more effective
Yes• Electricity expenditures are equal
to those of telephone service, more than cable and internet
• Indirect demand is true of communication services
• Price repose may result in a different level of service
• Reflects utiltiy and regulatory preferences, not necessarily those of customers
• Pilots in CA, IL, Canada and IOS/RTO program report response with no enabling technology
• Prices do a better job of rationing
7© 2008 Electric Power Research Institute, Inc. All rights reserved.
Defining Price Elasticity
=dQ
QR
Behavioral Response
×
Customer’s Ability to change
Price Elasticity dP
PR
Incentive to Change
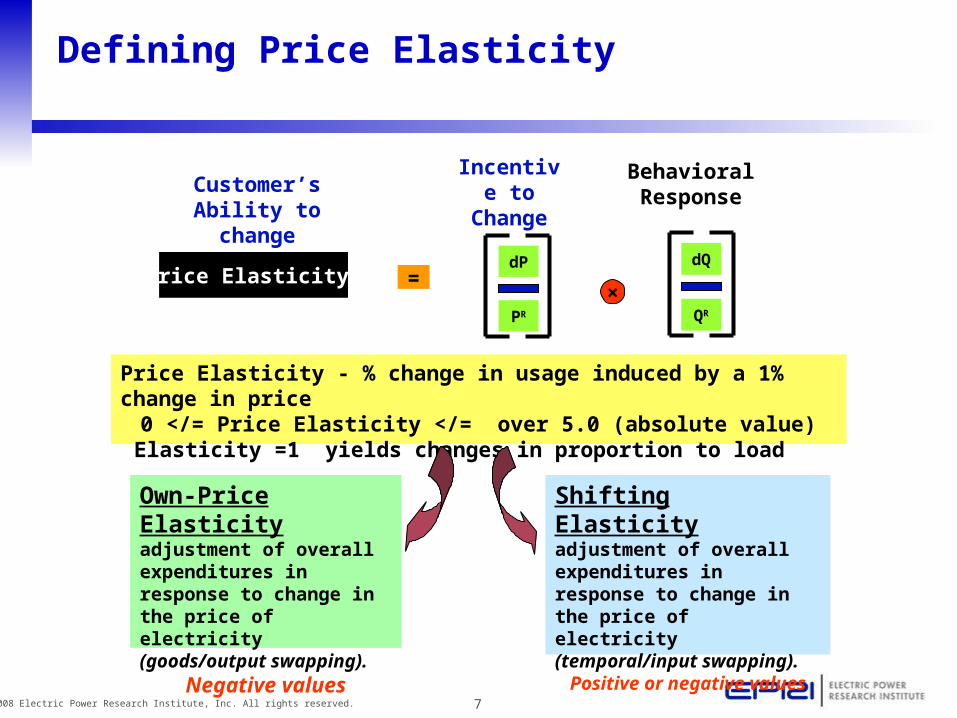
Price Elasticity - % change in usage induced by a 1% change in price0 </= Price Elasticity </= over 5.0 (absolute value)
Elasticity =1 yields changes in proportion to load
Own-Price Elasticity adjustment of overall expenditures in response to change in the price of electricity (goods/output swapping).
Negative values
Shifting Elasticity adjustment of overall expenditures in response to change in the price of electricity (temporal/input swapping).
Positive or negative values
8© 2008 Electric Power Research Institute, Inc. All rights reserved.
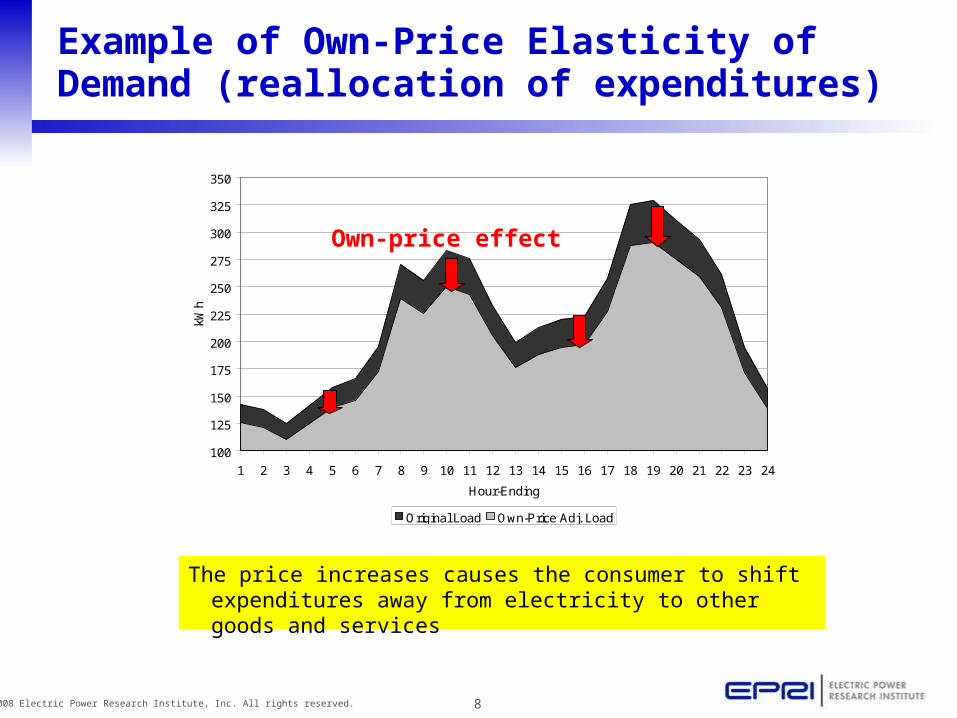
Example of Own-Price Elasticity of Demand (reallocation of expenditures)
100
125
150
175
200
225
250
275
300
325
350
1 2 3 4 5 6 7 8 9 10 11 12 13 14 15 16 17 18 19 20 21 22 23 24
Hour-Ending
kWh
Original Load Own-Price Adj. Load
Own-price effect
The price increases causes the consumer to shift expenditures away from electricity to other goods and services

9© 2008 Electric Power Research Institute, Inc. All rights reserved.
Example of Substitution Elasticity (temporal rearrangement of energy consumption)
100
125
150
175
200
225
250
275
300
325
1 2 3 4 5 6 7 8 9 10 11 12 13 14 15 16 17 18 19 20 21 22 23 24
Hour-Ending
kWh
Own-Price Adj. Load Substitution Adj. Load
Peak Perio
d
Shifting
The price spread causes the consumer to shift electricity usage from the peak to the off-peak periods of the day, with virtually no change in total energy consumption (but peak demand is decreased)

10© 2008 Electric Power Research Institute, Inc. All rights reserved.
What is the Conservation Effect of Dynamic Pricing?
• Some TOU and RTP analyses from 1990’s found that total energy consumption went up for some consumers
– Cheaper off-peak prices induced increased consumption– If the demand charge (for C&I) was effectively eliminated,
the load increase effect was even greater in some customers
• Recent TOU, CPP, a PPB pilots found that dynamic pricing induced a “conservation effect”
– Shifting observed on extreme price days (CPP, PTR– Overall monthly energy use went down, despite no real
change in electricity price outside the high-priced days– Some associate this with an own-price elasticity effect
• TOU- time-0f-use
• RRTP = real-time pricing
• CCP= critical peak pricing
• PTR- peak time rebate

11© 2008 Electric Power Research Institute, Inc. All rights reserved.
Report Highlights – Own Price Elasticity (OPE)
Own-Price Elasticty Estimates - Mostly pre-1990 Studies (absolute values)
0
0.2
0.4
0.6
0.8
1
1.2
1.4
Res Com Ind
SR Mean
LR Mean
• Very high price elasticities were found -.05 - -.120
• Most estimates of OPE are from pre-1990 studies
• Very little price variation results in a high level of specification error
Impact of a reoccuring 2.5 % price increase in electricty demand in SR and LR
0
1000
2000
3000
4000
5000
6000
7000
8000
1 2 3 4 5 6
SR Elast = .2
LR Elast - .9
• Impact of a 2.5% re-occurring price increase on res. usage
• Are these results credible?
• CA dynamic pricing study using values of .02 - .04 (absolute values)

12© 2008 Electric Power Research Institute, Inc. All rights reserved.
Report Highlights – Shifting Price Elasticity
Distribution of Estimates of the Elasticity of Electricity Demand under Time-Varying Pricing - 18 Studies
0
2
4
6
8
10
12
14
0 to .0
5
.06 to .1
0
.11 to .1
5
.16 to .2
0
.21 to .2
5
.26 to .3
0
.31 to .3
5
.36 to .4
0
Elasticty Range (absolute value)
Fre
qu
ency
• 72% of reported values for shifting elasticity are .15 or below
• Many studies report 20-25 % of participants contribute 75% or more of the measured response
13© 2008 Electric Power Research Institute, Inc. All rights reserved.
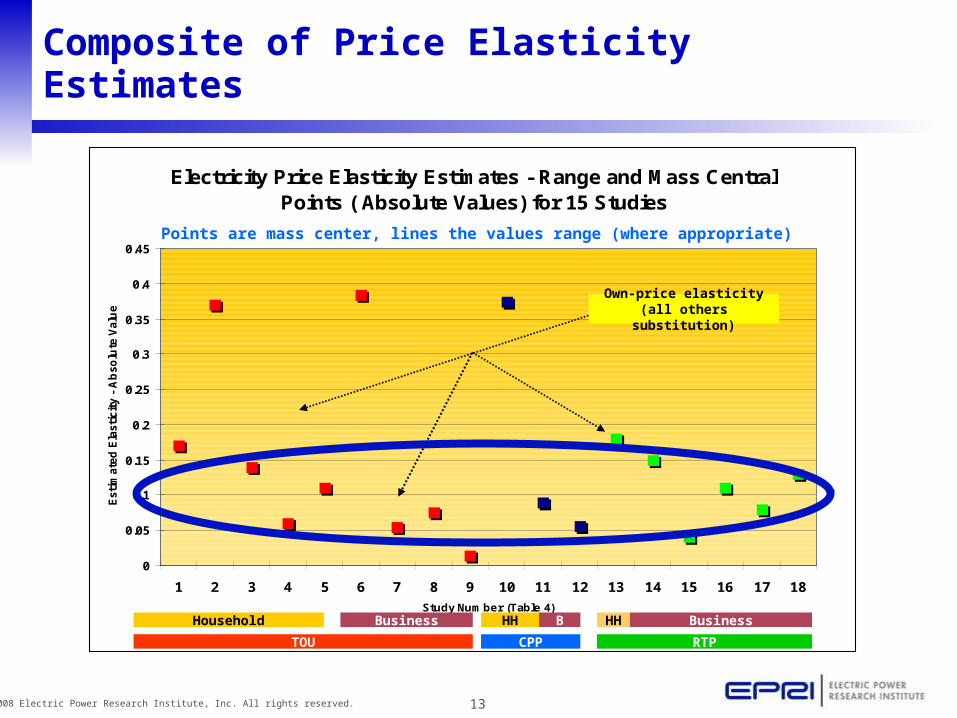
Composite of Price Elasticity Estimates
Electricity Price Elasticity Estimates - Range and Mass Central Points ( Absolute Values) for 15 Studies
0
0.05
0.1
0.15
0.2
0.25
0.3
0.35
0.4
0.45
1 2 3 4 5 6 7 8 9 10 11 12 13 14 15 16 17 18
Study Number (Table 4)
Esti
mate
d E
lasti
cit
y -
Ab
so
lute
Valu
e
Points are mass center, lines the values range (where appropriate)
TOU RTPCPP
Household HH HHBusiness BusinessB
Own-price elasticity(all others substitution)

14© 2008 Electric Power Research Institute, Inc. All rights reserved.
Evidence that Feedback Influences Energy Use
Feedback Studies - % Elnergy Savings
0
5
10
15
20
25
30
1 2 3 4 5 6 7 8 9 10 11 12 13 14 15 16 17 18 19 20 21 22 23 24 25 26 27 28 29 30 31 32 33 34 35
Study #
% S
avin
gs
....
Average All
11.60
70’s 80’s 90’s 2000+

15© 2008 Electric Power Research Institute, Inc. All rights reserved.
Participation in Feedback Pilots
Feedback Studies - # Participants
0
500
1000
1500
2000
2500
3000
3500
4000
Study #
Stu
dy
Pa
rtic
ipa
nts
....
50,000

16© 2008 Electric Power Research Institute, Inc. All rights reserved.
Feedback Savings: Direct and Indirect
Feedback Studies - % Electricity Savings; Direct and Indirect Feedback
0
5
10
15
20
25
30
1 2 3 4 5 6 7 8 9 10 11 12 13 14 15 16 17 18 19 20 21 22 23 24 25 26 27 28 29 30 31 32 33 34 35
Study #
% S
avin
gs
....
Average All
11.60
Direct 11.48Indirect 8.40

17© 2008 Electric Power Research Institute, Inc. All rights reserved.
Reported Direct Feedback Savings – Electronic Display
Feedback Studies - % Electricity Savings - Electronic Display
0
2
4
6
8
10
12
14
16
18
20
2 6 9 10 17 18 19 20 21 23 24 25
Study #
% S
avin
gs
....
Pay-as-you-go Meters
Eliminated – bill stuffers, videos, self-read diaries, flashing lights, community cooperation, expert counseling; also gas or combined gas and electric

18© 2008 Electric Power Research Institute, Inc. All rights reserved.
Feedback Participation – Electronic Display
Feedback Studies - # Participants - Electronic Display
0
500
1000
1500
2000
2500
3000
3500
4000
2 6 9 10 17 18 19 20 21 23 24 25
Study #
Stu
dy
Par
tici
pan
ts
....
50,000

19© 2008 Electric Power Research Institute, Inc. All rights reserved.
Net Present Value of Feedback Investment
Capital cost = $200. OC - $24/yr
Capital cost = $100. OC
– paid by consumer
Present Value of Savings from Investment in Feedback for all Residential Customers
($600)
($400)
($200)
$0
$200
$400
$600
$800
$1,000
$1,200
$1,400
00.025
0.05 0.1 0.15 0.2 0.25 0.3
% Savings
Lif
eti
me
AC
fro
m F
ee
db
ac
k (
$ m
illi
on
)
CC$200/OC$20
CC$100/OC $20
A
D
BC

20© 2008 Electric Power Research Institute, Inc. All rights reserved.
Summary and Outlook
• Price response intensity is relative low and unevenly distributed among households
• This is to be expected: the industry has strived for over 75 years to abate price volatility and mask the time-differentiated cost of supply
• It will take time (and patience) to elevate electricity expenditures to a more prominent place in household decision making
• This is not justification to abandon adopting efficient pricing
• Nor is it a rationalization to impose dynamic pricing universally or punitively
• It is a call to action for the entire industry

21© 2008 Electric Power Research Institute, Inc. All rights reserved.
A Corrective Prescription - Market Transformation
Create opportunities to introduce time-varying pricing and
feedback in a variety of situations
Centralize the design and evaluation of these offerings to
extract the information and learnings
Share the experiences widely and purposefully
Engage in the development of enabling technologies
Auto DR for commercial facilities
Household Hand- Frees device controls
Smart and efficient devices
Integrate price and demand response into RTO/ISO operations
Merge energy efficiency and demand and price response
initiatives into cohesive portfolio of


