18
The Role of Empirical Rheology in Flour Quality Control
Tamara Dapčević Hadnađev, Milica Pojić, Miroslav Hadnađev and Aleksandra Torbica Institute for Food Technology, University of Novi Sad
Serbia
1. Introduction
Rheology, as a branch of physics, studies the deformation and flow of matter in response to an applied stress or strain. According to the materials’ behaviour, they can be classified as Newtonian or non-Newtonian (Steffe, 1996; Schramm, 2004). The most of the foodstuffs exhibit properties of non-Newtonian viscoelastic systems (Abang Zaidel et al., 2010). Among them, the dough can be considered as the most unique system from the point of material science. It is viscoelastic system which exhibits shear-thinning and thixotropic behaviour (Weipert, 1990). This behaviour is the consequence of dough complex structure in which starch granules (75-80%) are surrounded by three-dimensional protein (20-25%) network (Bloksma, 1990, as cited in Weipert, 2006). Wheat proteins are consisted of gluten proteins (80-85% of total wheat protein) which comprise of prolamins (in wheat - gliadins) and glutelins (in wheat - glutenins) and non gluten proteins (15-20% of the total wheat proteins) such as albumins and globulins (Veraverbeke & Delcour, 2002). Gluten complex is a viscoelastic protein responsible for dough structure formation. Among the cereal technologists, rheology is widely recognized as a valuable tool in quality assessment of flour. Hence, in the cereal scientific community, rheological measurements are generally employed throughout the whole processing chain in order to monitor the mechanical properties, molecular structure and composition of the material, to imitate materials’ behaviour during processing and to anticipate the quality of the final product (Dobraszczyk & Morgenstern, 2003). Rheology is particularly important technique in revealing the influence of flour constituents and additives on dough behaviour during breadmaking. There are many test methods available to measure rheological properties, which are commonly divided into empirical (descriptive, imitative) and fundamental (basic) (Scott Blair, 1958 as cited in Weipert, 1990). Although being criticized due to their shortcomings concerning inflexibility in defining the level of deforming force, usage of strong deformation forces, interpretation of results in relative non-SI units, large sample requirements and its impossibility to define rheological parameters such as stress, strain, modulus or viscosity (Weipert, 1990; Dobraszczyk & Morgenstern, 2003), empirical rheological measurements are still indispensable in the cereal quality laboratories. According to the empirical rheological parameters it is possible to determine the optimal flour quality for a particular purpose. The empirical techniques used for dough quality
www.intechopen.com
Wide Spectra of Quality Control
336
control are generally recognized as standard methods by ICC, AACC, ISO and different national standards. In comparison to rheological methods generally applicable in food quality control, dough rheological tests are probably the most diverse. The devices suitable to monitor the dough behaviour during different processing operations such as mixing, kneading, moulding, fermentation and baking have been developed. For example, Farinograph and Mixograph provide information about mixing properties of flour, whilst the rheological properties of the dough during moulding are assessed using Extensograph, Alveograph and recently introduced Kieffer dough and gluten extensibility rig, which measure rheological properties of dough in extension (e.g. dough strength and resistance to extension). Proving properties of dough (gas production and retention) can be monitor by Rheofermentometer and Maturograph. For monitoring of starch gelatinization properties and/or indirect determination of α-amylase activity, Amylograph and Falling Number techniques are employed. The most of the instruments listed above, developed in the early days of dough rheology, have remained their original principle (Weipert, 2006) and thus their shortcomings. One of the newest rheological devices, called Mixolab, has overcome some of the problems encountered with other empirical rheological instruments. The Mixolab System measures dough behaviour during mixing and heating, which enables determination of both protein and starch contribution to dough rheological properties in a single test. Therefore, it is able to perform continuous measurement throughout a simulated baking process, which means that one can use the same instrument for several applications. The aim of this study is to give a review on the empirical rheological instruments, their principles and techniques and interpretation of results by comparing various international and national standards. Moreover, the demands to change the parameters interpretation along the changes in wheat cultivars over time and varieties in different regions will be discussed. The special emphases will be given on the influence of climatic changes on the rheological quality parameters of Serbian wheat flour. The past and current studies employing empirical rheological tests, the correlation between different empirical rheological parameters, as well as their correlation to sensory attributes will be also presented.
2. Mixing and kneading devices
Mixing is very important operation in wheat flour processing. During this phase, hydratation of flour particles and formation of three-dimensional viscoelastic gluten network from glutenin and gliadin components occur. The rheological changes, which occur in gluten structure during mixing, greatly determine the final product quality (Dobraszczyk & Morgenstern, 2003). The most important empirical rheological devices used to monitor the behaviour of dough during mixing and kneading are Farinograph and Mixograph.
2.1 Farinograph The most popular and accepted device for measuring dough physical properties is Brabender Farinograph. It measures and records the mechanical resistance of the dough during mixing and kneading. Physical properties of dough are measured by placing a defined mass of flour in a tempered (30°C) mixing bowl equipped with two Z type kneaders. Depending on the available quantity of flour, tests can be performed in 300g, 50g
www.intechopen.com
The Role of Empirical Rheology in Flour Quality Control
337
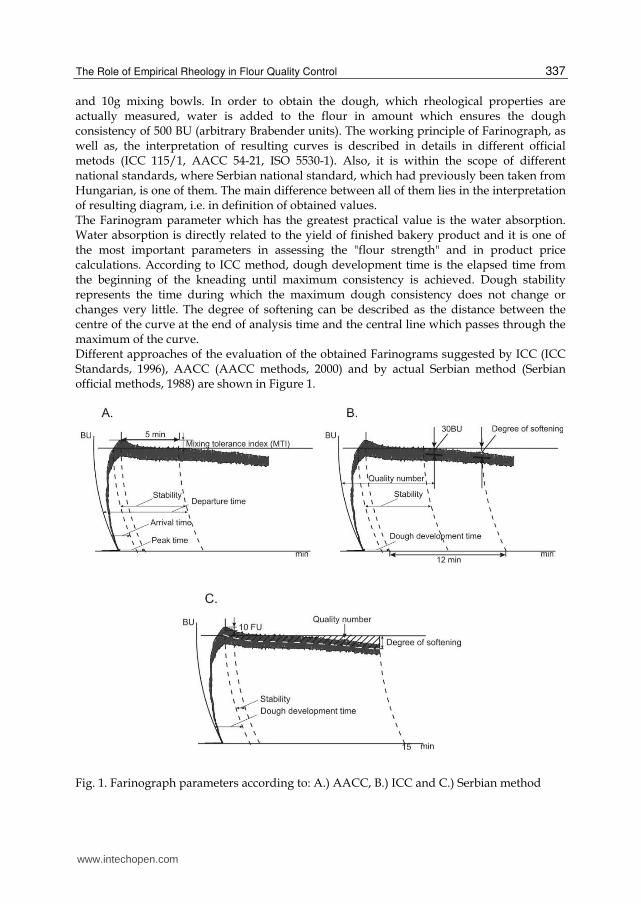
and 10g mixing bowls. In order to obtain the dough, which rheological properties are actually measured, water is added to the flour in amount which ensures the dough consistency of 500 BU (arbitrary Brabender units). The working principle of Farinograph, as well as, the interpretation of resulting curves is described in details in different official metods (ICC 115/1, AACC 54-21, ISO 5530-1). Also, it is within the scope of different national standards, where Serbian national standard, which had previously been taken from Hungarian, is one of them. The main difference between all of them lies in the interpretation of resulting diagram, i.e. in definition of obtained values. The Farinogram parameter which has the greatest practical value is the water absorption. Water absorption is directly related to the yield of finished bakery product and it is one of the most important parameters in assessing the "flour strength" and in product price calculations. According to ICC method, dough development time is the elapsed time from the beginning of the kneading until maximum consistency is achieved. Dough stability represents the time during which the maximum dough consistency does not change or changes very little. The degree of softening can be described as the distance between the centre of the curve at the end of analysis time and the central line which passes through the maximum of the curve. Different approaches of the evaluation of the obtained Farinograms suggested by ICC (ICC Standards, 1996), AACC (AACC methods, 2000) and by actual Serbian method (Serbian official methods, 1988) are shown in Figure 1.
Fig. 1. Farinograph parameters according to: A.) AACC, B.) ICC and C.) Serbian method
www.intechopen.com
Wide Spectra of Quality Control
338
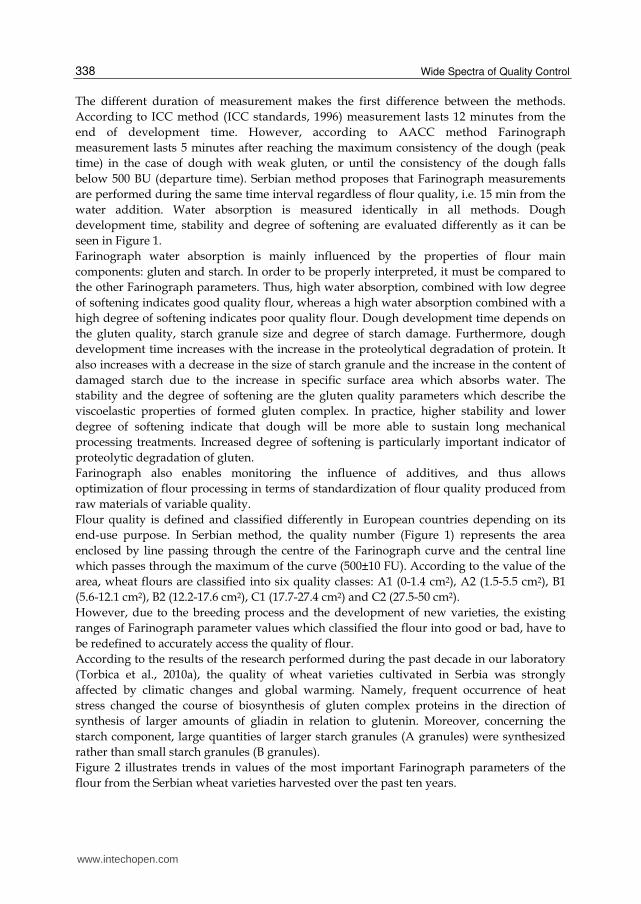
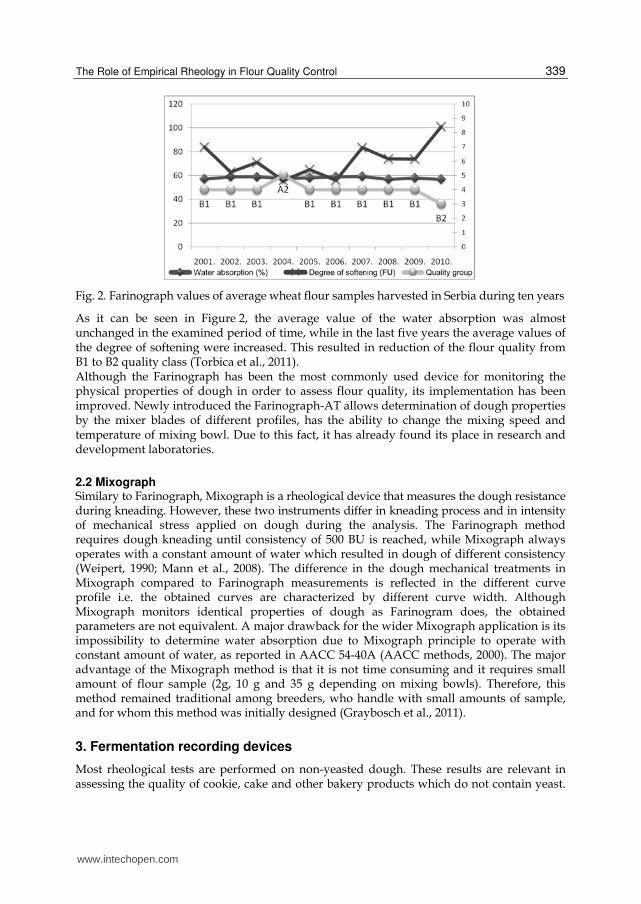
The different duration of measurement makes the first difference between the methods. According to ICC method (ICC standards, 1996) measurement lasts 12 minutes from the end of development time. However, according to AACC method Farinograph measurement lasts 5 minutes after reaching the maximum consistency of the dough (peak time) in the case of dough with weak gluten, or until the consistency of the dough falls below 500 BU (departure time). Serbian method proposes that Farinograph measurements are performed during the same time interval regardless of flour quality, i.e. 15 min from the water addition. Water absorption is measured identically in all methods. Dough development time, stability and degree of softening are evaluated differently as it can be seen in Figure 1. Farinograph water absorption is mainly influenced by the properties of flour main components: gluten and starch. In order to be properly interpreted, it must be compared to the other Farinograph parameters. Thus, high water absorption, combined with low degree of softening indicates good quality flour, whereas a high water absorption combined with a high degree of softening indicates poor quality flour. Dough development time depends on the gluten quality, starch granule size and degree of starch damage. Furthermore, dough development time increases with the increase in the proteolytical degradation of protein. It also increases with a decrease in the size of starch granule and the increase in the content of damaged starch due to the increase in specific surface area which absorbs water. The stability and the degree of softening are the gluten quality parameters which describe the viscoelastic properties of formed gluten complex. In practice, higher stability and lower degree of softening indicate that dough will be more able to sustain long mechanical processing treatments. Increased degree of softening is particularly important indicator of proteolytic degradation of gluten. Farinograph also enables monitoring the influence of additives, and thus allows optimization of flour processing in terms of standardization of flour quality produced from raw materials of variable quality. Flour quality is defined and classified differently in European countries depending on its end-use purpose. In Serbian method, the quality number (Figure 1) represents the area enclosed by line passing through the centre of the Farinograph curve and the central line which passes through the maximum of the curve (500±10 FU). According to the value of the area, wheat flours are classified into six quality classes: A1 (0-1.4 cm2), A2 (1.5-5.5 cm2), B1 (5.6-12.1 cm2), B2 (12.2-17.6 cm2), C1 (17.7-27.4 cm2) and C2 (27.5-50 cm2). However, due to the breeding process and the development of new varieties, the existing ranges of Farinograph parameter values which classified the flour into good or bad, have to be redefined to accurately access the quality of flour. According to the results of the research performed during the past decade in our laboratory (Torbica et al., 2010a), the quality of wheat varieties cultivated in Serbia was strongly affected by climatic changes and global warming. Namely, frequent occurrence of heat stress changed the course of biosynthesis of gluten complex proteins in the direction of synthesis of larger amounts of gliadin in relation to glutenin. Moreover, concerning the starch component, large quantities of larger starch granules (A granules) were synthesized rather than small starch granules (B granules). Figure 2 illustrates trends in values of the most important Farinograph parameters of the flour from the Serbian wheat varieties harvested over the past ten years.
www.intechopen.com
The Role of Empirical Rheology in Flour Quality Control
339
Fig. 2. Farinograph values of average wheat flour samples harvested in Serbia during ten years
As it can be seen in Figure 2, the average value of the water absorption was almost unchanged in the examined period of time, while in the last five years the average values of the degree of softening were increased. This resulted in reduction of the flour quality from B1 to B2 quality class (Torbica et al., 2011). Although the Farinograph has been the most commonly used device for monitoring the physical properties of dough in order to assess flour quality, its implementation has been improved. Newly introduced the Farinograph-AT allows determination of dough properties by the mixer blades of different profiles, has the ability to change the mixing speed and temperature of mixing bowl. Due to this fact, it has already found its place in research and development laboratories.
2.2 Mixograph Similary to Farinograph, Mixograph is a rheological device that measures the dough resistance during kneading. However, these two instruments differ in kneading process and in intensity of mechanical stress applied on dough during the analysis. The Farinograph method requires dough kneading until consistency of 500 BU is reached, while Mixograph always operates with a constant amount of water which resulted in dough of different consistency (Weipert, 1990; Mann et al., 2008). The difference in the dough mechanical treatments in Mixograph compared to Farinograph measurements is reflected in the different curve profile i.e. the obtained curves are characterized by different curve width. Although Mixograph monitors identical properties of dough as Farinogram does, the obtained parameters are not equivalent. A major drawback for the wider Mixograph application is its impossibility to determine water absorption due to Mixograph principle to operate with constant amount of water, as reported in AACC 54-40A (AACC methods, 2000). The major advantage of the Mixograph method is that it is not time consuming and it requires small amount of flour sample (2g, 10 g and 35 g depending on mixing bowls). Therefore, this method remained traditional among breeders, who handle with small amounts of sample, and for whom this method was initially designed (Graybosch et al., 2011).
3. Fermentation recording devices
Most rheological tests are performed on non-yeasted dough. These results are relevant in assessing the quality of cookie, cake and other bakery products which do not contain yeast.
www.intechopen.com
Wide Spectra of Quality Control
340
However, for a bread dough, fermentation is an important step in processing chain where the expansion of air bubbles incorporated during mixing led to formation of aerated crumb structure which appearance greatly contribute to sensory assessment and consumers acceptability of bread (Dobraszczyk et al., 2000). There are different types of devices which measure dough fermentation parameters. The changes in the dough volume are monitored by Brabender Maturograph and Oven Rise Recorder, while the formation of CO2 in dough is recorded using Brabender Fermentograph. Unlike the listed equipment, Chopin Rheofermentometer allows simultaneous measurement of dough height during fermentation and interaction of CO2 development and retention.
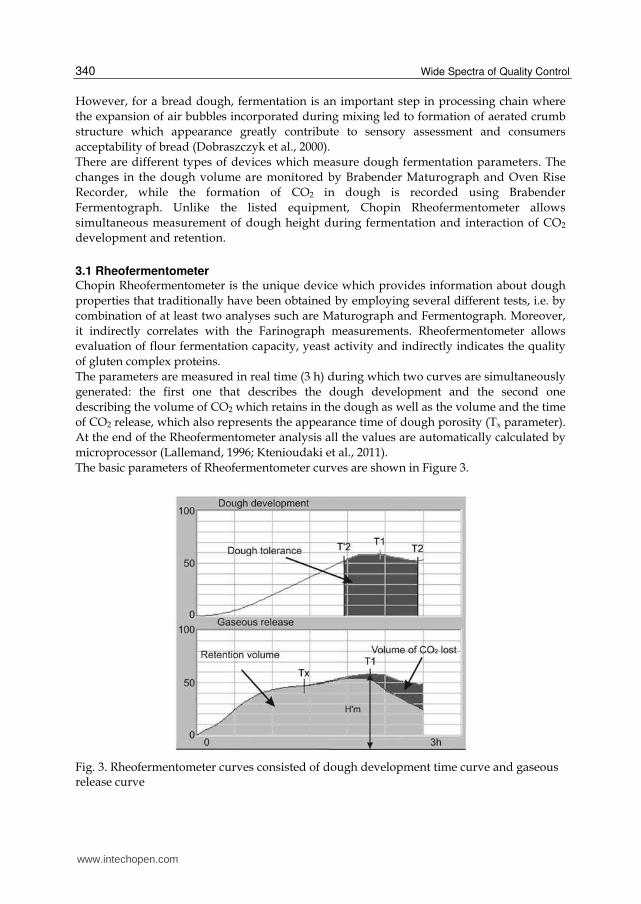
3.1 Rheofermentometer Chopin Rheofermentometer is the unique device which provides information about dough properties that traditionally have been obtained by employing several different tests, i.e. by combination of at least two analyses such are Maturograph and Fermentograph. Moreover, it indirectly correlates with the Farinograph measurements. Rheofermentometer allows evaluation of flour fermentation capacity, yeast activity and indirectly indicates the quality of gluten complex proteins. The parameters are measured in real time (3 h) during which two curves are simultaneously generated: the first one that describes the dough development and the second one describing the volume of CO2 which retains in the dough as well as the volume and the time of CO2 release, which also represents the appearance time of dough porosity (Tx parameter). At the end of the Rheofermentometer analysis all the values are automatically calculated by microprocessor (Lallemand, 1996; Ktenioudaki et al., 2011). The basic parameters of Rheofermentometer curves are shown in Figure 3.
Fig. 3. Rheofermentometer curves consisted of dough development time curve and gaseous release curve
www.intechopen.com
The Role of Empirical Rheology in Flour Quality Control
341
Rheofermetometer analysis of flour and dough enables accurate simulation of processing conditions during production of baked goods containing yeast. Moreover, it is possible to precisely calculate the amount of necessary additives (oxidizing and reducing agents, emulsifiers, enzymes) in order to optimize production processes. During the past decade, our researches indicated that prediction of the quality of the final product, based only on Extensograph and Alveograph measurements was pretty uncertain. The harvest of wheat crop in 2008 in Serbia showed that the energy values estimated by Extensograph were very heterogeneous. Therefore, for the research purposes two flour mixtures were formed. The first flour mixture had the Extensograph energy value of 58 cm2 and Alveograph deformation energy W=159 x 10-4 J. Amylograph peak viscosity was 285 BU; flour mixture 1 was estimated as A2 Farinograph quality group, with a favourable ratio of dough development and stability value and the degree of softening of 55 BU. Rheofermentometer curve showed that the dough after the fermentation completely retained 87% of the total CO2 produced. The maximum dough volume of 1186 ml was reached after 58.9 min, dough tolerance during fermentation was 58 min and 30 s, and porosity was estimated after 1 hour, 25 minutes and 30 seconds. Another flour mixture had the Extensograph energy value of 26 cm2 and Alveograph deformation energy W=115x10-4 J. Amylograph peak viscosity was 315 BU and a flour mixture was estimated as B1 Farinograph quality group with a favourable dough development and stability value and the degree of softening of 60 BU. Rheofermentometer curve indicated that the dough after the fermentation completely retained 88% of the total CO2 produced. The maximum volume of 1112 ml was reached after 54.9 min, dough tolerance during fermentation was 34 min and 30 s, and porosity was estimated after 1 hour 52 minutes and 30 seconds. Performed experiments have shown the importance of flour or dough characterization by Rheofermentometer. Namely, it is evident that the two examined flour mixtures tested by Rheofermentometer showed similar properties although they possessed different parameters obtained by Extensograph and Alveograph. However, the sensory analyses of baked products confirmed the results obtained by Rheofermentometer. Bread made of flour mixture 1 had a specific volume of 4.63 ml/g, good elasticity, somewhat rough pores and light dark, shiny crust. The addition of improvers in the flour mixture resulted in a product having slightly higher specific volume while the other quality parameters were rated with the highest score (5). Bread made of flour mixture 2 had a specific volume of 4.22 ml/g, poor elasticity, rough pores and light dark, shiny crust. The addition of improvers in the flour mixture resulted in a bread having much higher specific volume while the other parameters of sensory evaluation were scored with 4.3 points. Similar sensory quality of bread samples produced from flour mixtures 1 and 2 confirmed that the assessment of flour quality using Rheofermentometer was reliable and necessary to precisely evaluate the flour quality.
4. Extensional techniques
Extensibility represents the most unique property of wheat dough, which enables getting characteristic structure and volume of the baked products. This property is enabled by the presence of gluten complex proteins (Kieffer, 2006). Extensibility tests are typically conducted on wheat dough to evaluate its tensile strength and extensibility characteristics which are heavily dependent on the protein quality
www.intechopen.com
Wide Spectra of Quality Control
342
(Dobraszczyk & Morgenstern, 2003). Also, a great concern for the extensibility of wheat dough has been influenced by the relevance of the extensibility to baking performance and the final product quality (Cauvain & Young, 1998; Grausgruber et al., 2002; Sahin & Sumnu, 2006). In this regard, the baking performance is influenced by the interrelation between the maximum resistance and extensibility, since it is indirectly responsible for the extent of the expansion during the fermentation process (Anderssen et al., 2004). In extensibility tests, a shaped dough piece is submitted to large deformations until rupture occurs. Simultaneously, the resistance that occurs in a dough during stretching is recorded, providing the data relevant to the assessment of dough handling behavior and baking performance (e.g. resistance to large deformations and stretching suitability) (Grausgruber et al., 2002; Vergnes et al., 2003; Nash et al., 2006). To measure the extensional properties of dough, two types of extensional test are generally applied: • The measurement of uniaxial extension, where dough is stretched in one direction, and • The measurement of biaxial extension, where the dough is stretched in two opposing
directions, which can be achieved either by compression between lubricated surfaces or by bubble inflation (Dobraszczyk & Morgenstern, 2003; Abang Zaidel et al., 2010)
which both measure power input during dough development caused by extensional deformation (Sahin & Sumnu, 2006). The measurement of uniaxial extension is one of the most widely used test principle to measure materials properties. The methods are performed by clamping a strip of material at both ends, its stretching at a fixed rate in a suitable testing device, and by recording the force-extension curve. The most commmon methods used for measurement of the uniaxial extensional properties of doughs are Brabender Extensograph and Stable Micro Systems Kieffer dough and gluten extensibility rig (Dobraszczyk, 2004). The measurement of biaxial extension implies stretching a dough piece at equal rates in two perpendicular directions in one plane. The most widely used principle in the measurement of biaxial extension properties of dough is based on inflation technique (e.g. bubble expanding) as in Alveograph method (Dobraszczyk, 2004; Sahin & Sumnu, 2006). The Alveograph method measures the resistance to biaxial extension of a thin sheet of dough prepared from flour, water and salt, generally at a constant hydration level, although the measurements could be performed at adapted hydration as it is the case with the Alveoconsistograph method. From the above mentioned it follows that the extensibility tests that are in common use are carried out by the fundamentally different measuring equipment, although the resulting curves equally describe the extensional work, resistance to extension and extensibility of the tested dough (Weipert, 2006).
4.1 Extensograph The Brabender Extensograph is an internationally accepted standard method that is in compliance with ISO 5530-2, ICC 114/1, AACC 54-10. It is applicable for measurement of physical properties of dough subjected to mechanical handling and resting. Precisely, an Extensograph provides information about dough resistance to stretching and extensibility by measuring the force to pull a hook through a cylindrically shaped piece of dough. During the measurement the resistance of dough to stretching and the distance the dough stretches before breaking is recorded in the form of diagram extensogram. Measurement procedure comprises of several steps:
www.intechopen.com
The Role of Empirical Rheology in Flour Quality Control
343
• Preparation of dough (with 2% salt based on flour weight) in the Brabender Farinograph mixer, usually at 2% less than its optimum absorption to compensate the salt addition.
• Moulding of dough pieces on the Extensograph into a cylindrically shaped dough pieces
• Resting of the dough pieces for a fixed period of time (45, 90, 135 min) • Stretching the dough pieces until they rupture and recording the extensibility of the
dough and its resistance to stretching (Kent & Evers, 1994; Rasper & Walker, 2000; Sahin & Sumnu, 2006).
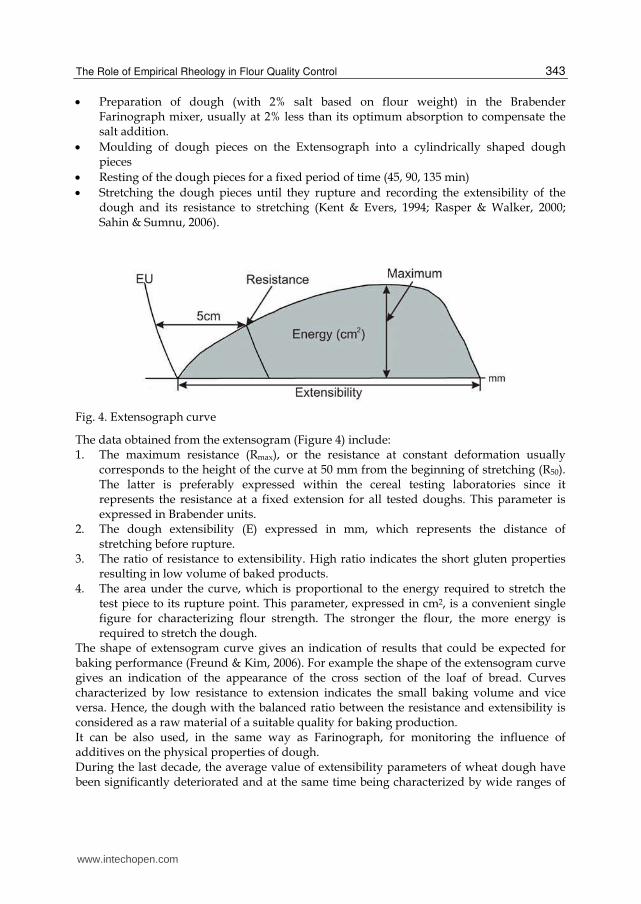
Fig. 4. Extensograph curve
The data obtained from the extensogram (Figure 4) include: 1. The maximum resistance (Rmax), or the resistance at constant deformation usually
corresponds to the height of the curve at 50 mm from the beginning of stretching (R50). The latter is preferably expressed within the cereal testing laboratories since it represents the resistance at a fixed extension for all tested doughs. This parameter is expressed in Brabender units.
2. The dough extensibility (E) expressed in mm, which represents the distance of stretching before rupture.
3. The ratio of resistance to extensibility. High ratio indicates the short gluten properties resulting in low volume of baked products.
4. The area under the curve, which is proportional to the energy required to stretch the test piece to its rupture point. This parameter, expressed in cm2, is a convenient single figure for characterizing flour strength. The stronger the flour, the more energy is required to stretch the dough.
The shape of extensogram curve gives an indication of results that could be expected for baking performance (Freund & Kim, 2006). For example the shape of the extensogram curve gives an indication of the appearance of the cross section of the loaf of bread. Curves characterized by low resistance to extension indicates the small baking volume and vice versa. Hence, the dough with the balanced ratio between the resistance and extensibility is considered as a raw material of a suitable quality for baking production. It can be also used, in the same way as Farinograph, for monitoring the influence of additives on the physical properties of dough. During the last decade, the average value of extensibility parameters of wheat dough have been significantly deteriorated and at the same time being characterized by wide ranges of
www.intechopen.com
Wide Spectra of Quality Control
344
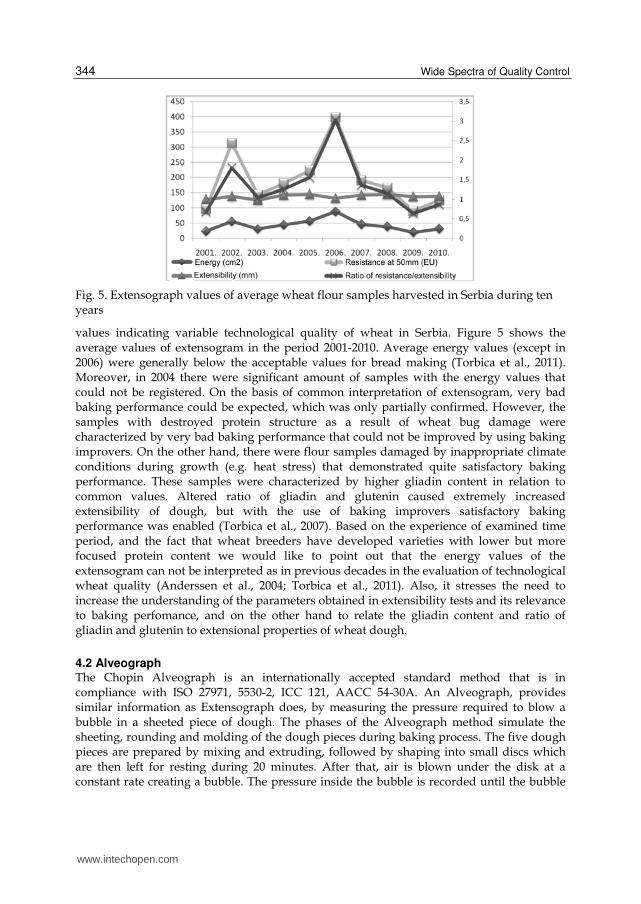
Fig. 5. Extensograph values of average wheat flour samples harvested in Serbia during ten years
values indicating variable technological quality of wheat in Serbia. Figure 5 shows the average values of extensogram in the period 2001-2010. Average energy values (except in 2006) were generally below the acceptable values for bread making (Torbica et al., 2011). Moreover, in 2004 there were significant amount of samples with the energy values that could not be registered. On the basis of common interpretation of extensogram, very bad baking performance could be expected, which was only partially confirmed. However, the samples with destroyed protein structure as a result of wheat bug damage were characterized by very bad baking performance that could not be improved by using baking improvers. On the other hand, there were flour samples damaged by inappropriate climate conditions during growth (e.g. heat stress) that demonstrated quite satisfactory baking performance. These samples were characterized by higher gliadin content in relation to common values. Altered ratio of gliadin and glutenin caused extremely increased extensibility of dough, but with the use of baking improvers satisfactory baking performance was enabled (Torbica et al., 2007). Based on the experience of examined time period, and the fact that wheat breeders have developed varieties with lower but more focused protein content we would like to point out that the energy values of the extensogram can not be interpreted as in previous decades in the evaluation of technological wheat quality (Anderssen et al., 2004; Torbica et al., 2011). Also, it stresses the need to increase the understanding of the parameters obtained in extensibility tests and its relevance to baking perfomance, and on the other hand to relate the gliadin content and ratio of gliadin and glutenin to extensional properties of wheat dough.
4.2 Alveograph The Chopin Alveograph is an internationally accepted standard method that is in compliance with ISO 27971, 5530-2, ICC 121, AACC 54-30A. An Alveograph, provides similar information as Extensograph does, by measuring the pressure required to blow a bubble in a sheeted piece of dough. The phases of the Alveograph method simulate the sheeting, rounding and molding of the dough pieces during baking process. The five dough pieces are prepared by mixing and extruding, followed by shaping into small discs which are then left for resting during 20 minutes. After that, air is blown under the disk at a constant rate creating a bubble. The pressure inside the bubble is recorded until the bubble
www.intechopen.com
The Role of Empirical Rheology in Flour Quality Control
345
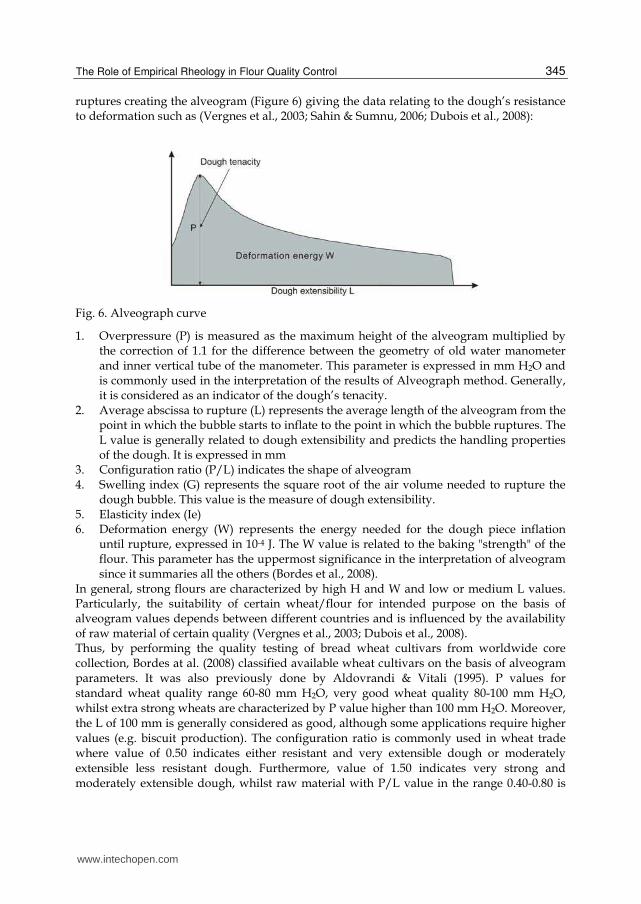
ruptures creating the alveogram (Figure 6) giving the data relating to the dough’s resistance to deformation such as (Vergnes et al., 2003; Sahin & Sumnu, 2006; Dubois et al., 2008):
Fig. 6. Alveograph curve
1. Overpressure (P) is measured as the maximum height of the alveogram multiplied by the correction of 1.1 for the difference between the geometry of old water manometer and inner vertical tube of the manometer. This parameter is expressed in mm H2O and is commonly used in the interpretation of the results of Alveograph method. Generally, it is considered as an indicator of the dough’s tenacity.
2. Average abscissa to rupture (L) represents the average length of the alveogram from the point in which the bubble starts to inflate to the point in which the bubble ruptures. The L value is generally related to dough extensibility and predicts the handling properties of the dough. It is expressed in mm
3. Configuration ratio (P/L) indicates the shape of alveogram 4. Swelling index (G) represents the square root of the air volume needed to rupture the
dough bubble. This value is the measure of dough extensibility. 5. Elasticity index (Ie) 6. Deformation energy (W) represents the energy needed for the dough piece inflation
until rupture, expressed in 10-4 J. The W value is related to the baking "strength" of the flour. This parameter has the uppermost significance in the interpretation of alveogram since it summaries all the others (Bordes et al., 2008).
In general, strong flours are characterized by high H and W and low or medium L values. Particularly, the suitability of certain wheat/flour for intended purpose on the basis of alveogram values depends between different countries and is influenced by the availability of raw material of certain quality (Vergnes et al., 2003; Dubois et al., 2008). Thus, by performing the quality testing of bread wheat cultivars from worldwide core collection, Bordes at al. (2008) classified available wheat cultivars on the basis of alveogram parameters. It was also previously done by Aldovrandi & Vitali (1995). P values for standard wheat quality range 60-80 mm H2O, very good wheat quality 80-100 mm H2O, whilst extra strong wheats are characterized by P value higher than 100 mm H2O. Moreover, the L of 100 mm is generally considered as good, although some applications require higher values (e.g. biscuit production). The configuration ratio is commonly used in wheat trade where value of 0.50 indicates either resistant and very extensible dough or moderately extensible less resistant dough. Furthermore, value of 1.50 indicates very strong and moderately extensible dough, whilst raw material with P/L value in the range 0.40-0.80 is
www.intechopen.com
Wide Spectra of Quality Control
346
suitable for bakery production. Wheat suitable for confectionary products should exhibit P/L value lower than 0.50. Concerning the interpretation of W value for confectionary wheat is characterized by W value lower than 115 (* 10-4 J), standard quality wheat is characterized by W value in range 160-200, whilst good quality wheat and improving wheat are characterized by W value in the range 220-300 and higher than 300, respectively (Bordes et al., 2008). Traditional measurements of the properties of durum dough for pasta production include the application of the Alveograph method. Indicators of suitable durum wheat quality for pasta production determined by Alveograph include P/L values in the range 1.5-2.5 and W values in the range 200-250, or even higher than 300 for superior pasta quality (Marchylo & Dexter, 2001). It is common that parameters derived from the Alveogram are used for selection purposes and wheat grading throughout the wheat storage and milling sectors and bakery companies worldwide. Physical dough tests such as Extensograph and Alveograph are used in various parts of the world to give an indication of dough mixing characteristics. Although the application of Extensograph and Alveograph in flour quality control is more culture related, the data they produce can equally be used to help the baker better utilize the tested flour. They are primarily used in Germany, France, and the British Isles, and their respective former colonies (De Bry, 2006; Khan & Nygard, 2006). The Alveograph is mainly used in the Mediterranean countries, certain parts of South America and former French colonies in Africa. The main difference in the Extensograph and Alveograph method is that the Alveograph assumes the constant hydratation resulting in dough of different consistency. Unlike the Alveograph, the Extensograph method assumes the adjusted hydratation resulting in dough of equal consistency. The main limitation on the use of Extensograph and Alveograph method is the large amount of sample that is required which is limiting factor in application of these methods in breeding programs. This situation has initiated the attempts to develop the micro-extensograph methods that proved to be significantly correlated with standard Extensograph method despite the differences in the mass and shape of dough pieces and hooked speed used for stretching (Grausgruber et al., 2002; Anderssen et al., 2004; Uthayakumaran et al., 2004) Also, none of these give rheological data in fundamental units of stress and strain, because the sample geometry is not defined, dimensions change extensively and nonuniformly during testing, which makes impossible to define any rheological parameters such as stress, strain, strain rate, modulus, or viscosity (Dobraszczyk, 2004).
4.3 Kieffer dough and gluten extensibility rig Another piece of equipment developed for the measurement of uniaxal extension of dough is Kieffer extensibility rig for the TA.TX2i texture analyzer. It uses the same principle as Extensograph, except that the sample is stretched upwards. It enables extensibility measurement of both dough and gluten which represents its additional advantage. Apart from that, it require small quantities of sample (cca 0.8 g), the force is expressed in Newton and the speed of the hook is adjustable (Nash et al., 2006; Abang Zaidel et al., 2008; Abang Zaidel et al., 2010). However, in comparison to the Extensograph, the Kieffer rig is characterized by worse reproducibility (coefficient of variation extensibility in the range of 2-12% compared to coefficient of variation 2-7% obtained by Extensograph (Ktenioudaki et al., 2011).
www.intechopen.com
The Role of Empirical Rheology in Flour Quality Control
347
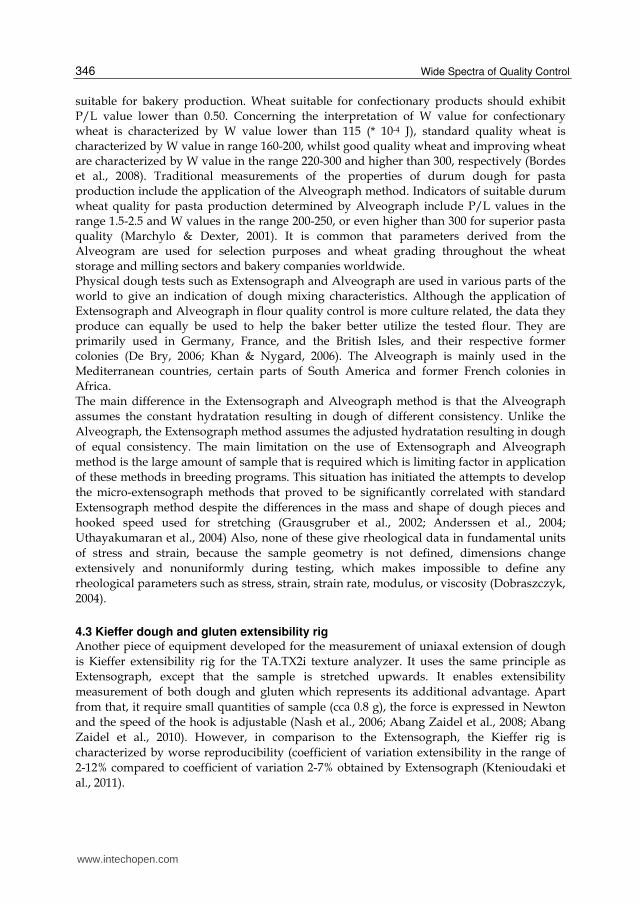
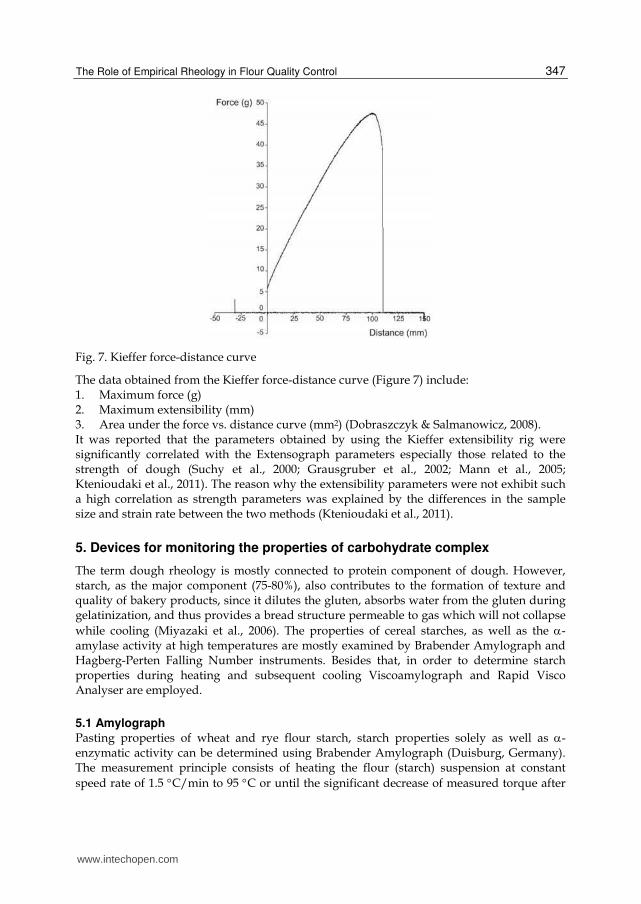
Fig. 7. Kieffer force-distance curve
The data obtained from the Kieffer force-distance curve (Figure 7) include: 1. Maximum force (g) 2. Maximum extensibility (mm) 3. Area under the force vs. distance curve (mm2) (Dobraszczyk & Salmanowicz, 2008). It was reported that the parameters obtained by using the Kieffer extensibility rig were significantly correlated with the Extensograph parameters especially those related to the strength of dough (Suchy et al., 2000; Grausgruber et al., 2002; Mann et al., 2005; Ktenioudaki et al., 2011). The reason why the extensibility parameters were not exhibit such a high correlation as strength parameters was explained by the differences in the sample size and strain rate between the two methods (Ktenioudaki et al., 2011).
5. Devices for monitoring the properties of carbohydrate complex
The term dough rheology is mostly connected to protein component of dough. However, starch, as the major component (75-80%), also contributes to the formation of texture and quality of bakery products, since it dilutes the gluten, absorbs water from the gluten during gelatinization, and thus provides a bread structure permeable to gas which will not collapse while cooling (Miyazaki et al., 2006). The properties of cereal starches, as well as the α-amylase activity at high temperatures are mostly examined by Brabender Amylograph and Hagberg-Perten Falling Number instruments. Besides that, in order to determine starch properties during heating and subsequent cooling Viscoamylograph and Rapid Visco Analyser are employed.
5.1 Amylograph
Pasting properties of wheat and rye flour starch, starch properties solely as well as α-enzymatic activity can be determined using Brabender Amylograph (Duisburg, Germany). The measurement principle consists of heating the flour (starch) suspension at constant speed rate of 1.5 °C/min to 95 °C or until the significant decrease of measured torque after
www.intechopen.com
Wide Spectra of Quality Control
348
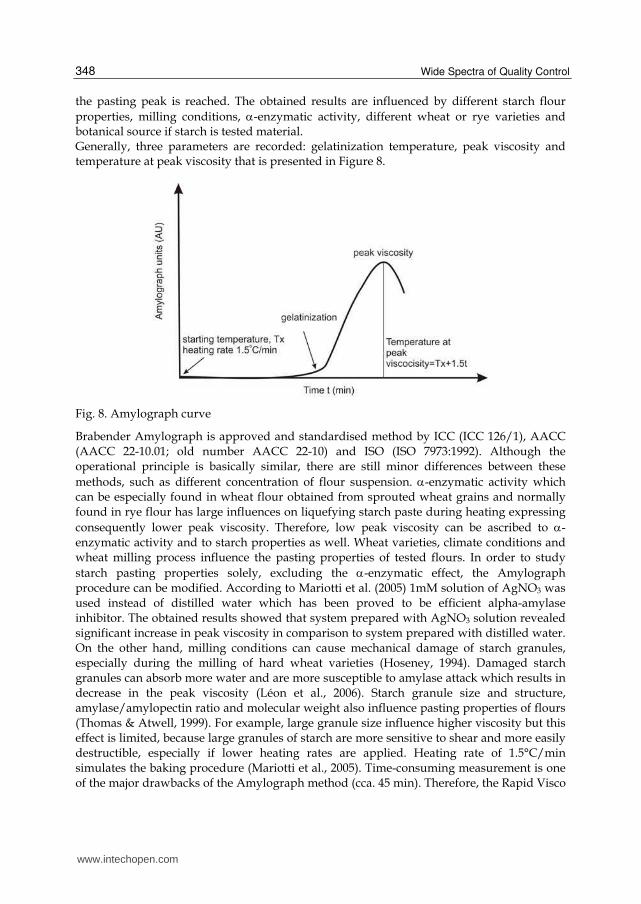
the pasting peak is reached. The obtained results are influenced by different starch flour properties, milling conditions, α-enzymatic activity, different wheat or rye varieties and botanical source if starch is tested material. Generally, three parameters are recorded: gelatinization temperature, peak viscosity and temperature at peak viscosity that is presented in Figure 8.
Fig. 8. Amylograph curve
Brabender Amylograph is approved and standardised method by ICC (ICC 126/1), AACC (AACC 22-10.01; old number AACC 22-10) and ISO (ISO 7973:1992). Although the operational principle is basically similar, there are still minor differences between these methods, such as different concentration of flour suspension. α-enzymatic activity which can be especially found in wheat flour obtained from sprouted wheat grains and normally found in rye flour has large influences on liquefying starch paste during heating expressing consequently lower peak viscosity. Therefore, low peak viscosity can be ascribed to α-enzymatic activity and to starch properties as well. Wheat varieties, climate conditions and wheat milling process influence the pasting properties of tested flours. In order to study starch pasting properties solely, excluding the α-enzymatic effect, the Amylograph procedure can be modified. According to Mariotti et al. (2005) 1mM solution of AgNO3 was used instead of distilled water which has been proved to be efficient alpha-amylase inhibitor. The obtained results showed that system prepared with AgNO3 solution revealed significant increase in peak viscosity in comparison to system prepared with distilled water. On the other hand, milling conditions can cause mechanical damage of starch granules, especially during the milling of hard wheat varieties (Hoseney, 1994). Damaged starch granules can absorb more water and are more susceptible to amylase attack which results in decrease in the peak viscosity (Léon et al., 2006). Starch granule size and structure, amylase/amylopectin ratio and molecular weight also influence pasting properties of flours (Thomas & Atwell, 1999). For example, large granule size influence higher viscosity but this effect is limited, because large granules of starch are more sensitive to shear and more easily destructible, especially if lower heating rates are applied. Heating rate of 1.5°C/min simulates the baking procedure (Mariotti et al., 2005). Time-consuming measurement is one of the major drawbacks of the Amylograph method (cca. 45 min). Therefore, the Rapid Visco
www.intechopen.com
The Role of Empirical Rheology in Flour Quality Control
349
Analyser (RVA) as a rapid method for measuring degree of sprout damage in wheat was introduced (Ross et al., 1987). However, the effect of α-amylase decreases as heating rate increase due to the shorter time available for enzyme that can act on starch granules which resulted in higher peak viscosities (Collado & Corke, 1999). Also, if the applied shear rate is increased, starch granules are more easily destructible and final peak viscosities are lowered (Suh & Jane, 2003). The results obtained by Amylograph are in arbitrary i.e. Brabender Units (BU) because precise measurements could not be achieved due to complex system geometry that makes the determination of flow field inside the cup very difficult. Also, shear rate is not uniform within the sample. Therefore, viscosity cannot be calculated from torque measurements (Lagarrigue & Alvarez, 2001). Consequently, in order to keep conditions of shear rate and temperature conditions well defined and in order to obtain results expressed in viscosity units, rotational rheometers equipped with different measuring geometries were introduced. According to measurement performed in our laboratory significant correlation of peak viscosities was obtained by Brabender Amilograph and Haake Mars rheometer (Thermo Scientific, Germany). The Haake Mars measuring geometry consisted of Z40 measuring cup (43.4 mm diameter, 8 mm gap) and FL2B propeller shaped rotor with 2 blades. The concentration of flour-water suspension and heating rate was the same as it was in Amylograph measurements. However, significantly lower amount of wheat flour (cca 12.4g) was needed in comparison to ICC 126/1 Amylograph measurements (cca. 80g) (ICC Standards, 1996). Twenty flour samples having different pasting properties were examined by Brabender Amylograph and Haake Mars rheometers and the correlation of 0.99 was obtained.
5.2 Falling number
The Falling number (FN) is a method used to determine α-amylase activity in meal, wholemeal and flour of wheat, rye, barley, as well as other cereals, starch containing and malted products. It measures time (expressed in seconds) required to stir and allow stirrer to fall through a hot aqueous flour or meal gel or starch gel undergoing liquefaction influenced by α-amylase activity. Pre-harvest sprouting represents one of the major reasons for high α-amylase activity. Therefore, lower falling number values – shorter time needed for stirrer to fall distance through a liquefied paste indicates higher α-amylase activity and vice versa. Falling number is a method which indicates the effect of a present α-amylase rather than the actual enzyme amount, i.e. any other parameter which could impact the viscosity can affect the falling number, too. Falling number test is also affected by endosperm quality; susceptibility of starch to α-amylase i.e. the ease of starch gelatinization and accessibility to enzyme activity (Best & Muller, 1990). Increased α-amylase activity could cause problems in breadmaking which can be manifested in sticky dough, lower water absorption, crumb discolouration, mechanical handling breakdowns (Dimmock & Gooding, 2002, as cited in Chamberlain et al., 1982; Gooding & Davies, 1997; Sorenson, 2006). Also, pasta and noodle products are highly affected by α-amylase activity. Pasta/noodle produced from raw material of low FN is soft and mushy, cooking loss is increased and there are production problems regarding uneven extrusion, strand stretching and irregularities in drying (Kweon, 2010). Falling number method is recognized by ICC (ICC 107/1), AACC (AACC 56-81.03) and ISO (ISO 3093). There are different factors affecting the falling number value: altitude, climate conditions, late maturity alpha amylase, fungicidal treatment, waxy wheat, fusarium infection, nitrogen
www.intechopen.com
Wide Spectra of Quality Control
350
fertilization rate. Therefore, altitude correction was incorporated in revised AACC method in 1982 (Lorenz & Wolt, 1981). It was estimated that an average relative humidity of over 80% and a maximum daily temperature of below 13°C during grain filling affected decrease in the falling number to below 120 s (commercially acceptable starch quality). Also, average relative humidity fell below 70% and average maximum temperature above 16°C during grain filling affected increase in falling number over 230 s (bread wheat quality) (Karvonen et al., 1991). Kettlewell (1999) proved that application of nitrogen fertilization affected the increase of Falling number in the absence of sprouting. In addition, it was estimated that the use of fungicides may reduce falling number (Ruske et al., 2004), but this effect is cultivar dependent (Wang et al., 2004). Falling number test can be also influenced by genotype variation. One of the extreme examples of genotype variation is implementation of waxy wheats that are characterized by lower amylose content (Graybosch et al., 2000). Beside the pre-harvest sprouting which is known to affect low falling number, there are also a number of additional causes of low falling number such as late maturity α-amylase (Mares & Mrva, 2008) or prematurity α-amylase and retained pericarp α-amylase (Lunn et al., 2001).
6. Determination of mixing and heating properties of dough in one test - Mixolab
Although it is a relatively new device, introduced in 2004 by Chopin Technologies (Villeneuve la Garenne, France), it has already been within the scope of many scientific papers dealing with the assessment of dough rheological behaviour (Rosell et al., 2007; Collar et al., 2007; Kahraman et al., 2008). Mixolab working principle comprises the combination of Farinograph and Amylograph methods (described earlier in the text). Moreover, Mixolab system offers additional application called Mixolab Simulator whose results correspond to values and units obtained by Farinograph. However, in contrast to Farinograph which works with the constant flour mass (50 or 300 g), Mixolab flour mass depends on a flour water absorption, where the parameter which is fixed is the dough mass (75 g). The difference between Amylograph measurements, which are performed using flour-water suspension, is that Mixolab monitors starch gelationization in water-limited dough system resembling the real baking conditions. The development of a Mixolab also represents a step toward expression of the consistency (measured as a torque) in a real SI unit (Nm), unlike arbitrary Brebender units. Namely, usage of arbitrary units is one of the major drawbacks of empirical rheological methods over the fundamental ones (Weipert, 1990; Dobraszczyk & Morgenstern, 2003). Regardless the existing differences between the Mixolab and Farinograph, significant correlation was found between the obtained parameters (Dapčević et al., 2009), e.g. r = 0.98 for water absorption, r = 0.97 for dough development time. A significant correlation coefficient (r = 0.88) was determined between Amylograph peak viscosity and Mixolab C3 torque. Significant correlations were also found with parameters derived from Alveoconsistograph, Zeleny sedimentation and baking test (Kahraman et al., 2008). Ţăin et al. (2008) determined that the bread's volume was significantly negatively correlated with C2 value (r = -0.76) and with C5-C4 value (r = -0.73). According to Kahraman et al. (2008) most of the Mixolab parameters (C2, C3, C4 and C5) were significantly correlated with cake volume index. In order to simulate the phases of the breadmaking process and thus to investigate the thermo-mechanical behaviour of the dough, Chopin+ protocol is generally employed. This
www.intechopen.com
The Role of Empirical Rheology in Flour Quality Control
351
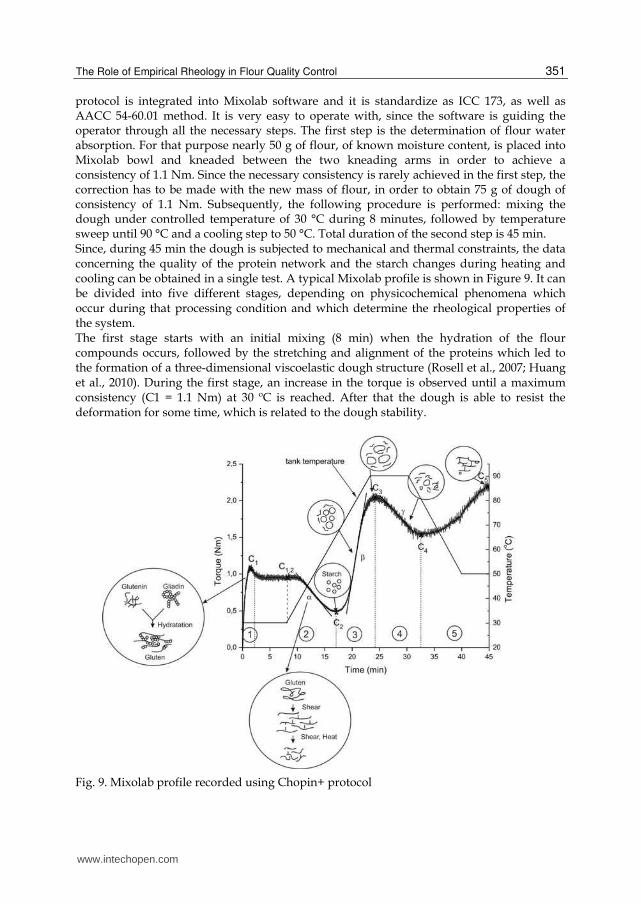
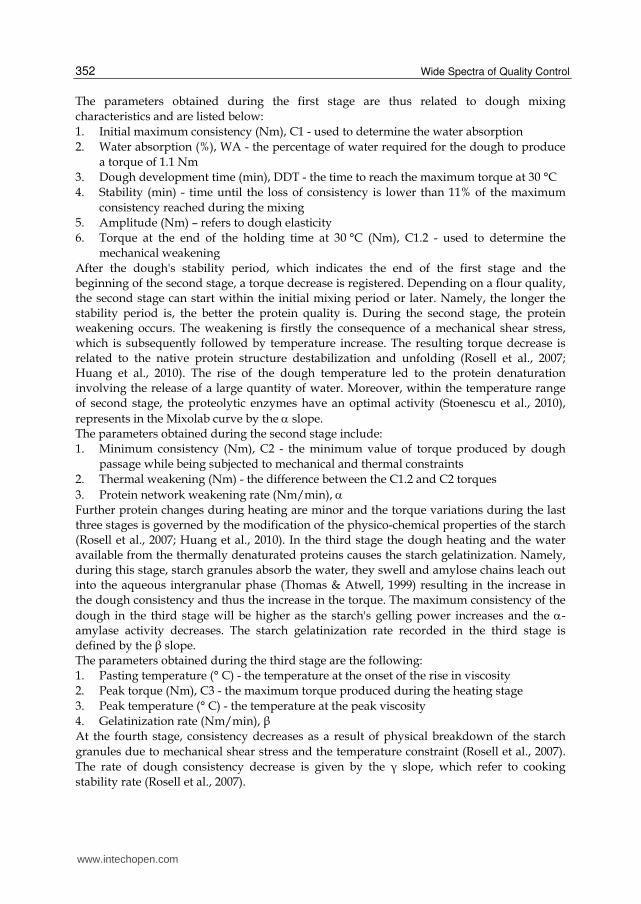
protocol is integrated into Mixolab software and it is standardize as ICC 173, as well as AACC 54-60.01 method. It is very easy to operate with, since the software is guiding the operator through all the necessary steps. The first step is the determination of flour water absorption. For that purpose nearly 50 g of flour, of known moisture content, is placed into Mixolab bowl and kneaded between the two kneading arms in order to achieve a consistency of 1.1 Nm. Since the necessary consistency is rarely achieved in the first step, the correction has to be made with the new mass of flour, in order to obtain 75 g of dough of consistency of 1.1 Nm. Subsequently, the following procedure is performed: mixing the dough under controlled temperature of 30 °C during 8 minutes, followed by temperature sweep until 90 °C and a cooling step to 50 °C. Total duration of the second step is 45 min. Since, during 45 min the dough is subjected to mechanical and thermal constraints, the data concerning the quality of the protein network and the starch changes during heating and cooling can be obtained in a single test. A typical Mixolab profile is shown in Figure 9. It can be divided into five different stages, depending on physicochemical phenomena which occur during that processing condition and which determine the rheological properties of the system. The first stage starts with an initial mixing (8 min) when the hydration of the flour compounds occurs, followed by the stretching and alignment of the proteins which led to the formation of a three-dimensional viscoelastic dough structure (Rosell et al., 2007; Huang et al., 2010). During the first stage, an increase in the torque is observed until a maximum consistency (C1 = 1.1 Nm) at 30 ºC is reached. After that the dough is able to resist the deformation for some time, which is related to the dough stability.
Fig. 9. Mixolab profile recorded using Chopin+ protocol
www.intechopen.com
Wide Spectra of Quality Control
352
The parameters obtained during the first stage are thus related to dough mixing characteristics and are listed below: 1. Initial maximum consistency (Nm), C1 - used to determine the water absorption 2. Water absorption (%), WA - the percentage of water required for the dough to produce
a torque of 1.1 Nm 3. Dough development time (min), DDT - the time to reach the maximum torque at 30 °C 4. Stability (min) - time until the loss of consistency is lower than 11% of the maximum
consistency reached during the mixing 5. Amplitude (Nm) – refers to dough elasticity 6. Torque at the end of the holding time at 30 °C (Nm), C1.2 - used to determine the
mechanical weakening After the dough's stability period, which indicates the end of the first stage and the beginning of the second stage, a torque decrease is registered. Depending on a flour quality, the second stage can start within the initial mixing period or later. Namely, the longer the stability period is, the better the protein quality is. During the second stage, the protein weakening occurs. The weakening is firstly the consequence of a mechanical shear stress, which is subsequently followed by temperature increase. The resulting torque decrease is related to the native protein structure destabilization and unfolding (Rosell et al., 2007; Huang et al., 2010). The rise of the dough temperature led to the protein denaturation involving the release of a large quantity of water. Moreover, within the temperature range of second stage, the proteolytic enzymes have an optimal activity (Stoenescu et al., 2010), represents in the Mixolab curve by the α slope. The parameters obtained during the second stage include: 1. Minimum consistency (Nm), C2 - the minimum value of torque produced by dough
passage while being subjected to mechanical and thermal constraints 2. Thermal weakening (Nm) - the difference between the C1.2 and C2 torques 3. Protein network weakening rate (Nm/min), α Further protein changes during heating are minor and the torque variations during the last three stages is governed by the modification of the physico-chemical properties of the starch (Rosell et al., 2007; Huang et al., 2010). In the third stage the dough heating and the water available from the thermally denaturated proteins causes the starch gelatinization. Namely, during this stage, starch granules absorb the water, they swell and amylose chains leach out into the aqueous intergranular phase (Thomas & Atwell, 1999) resulting in the increase in the dough consistency and thus the increase in the torque. The maximum consistency of the dough in the third stage will be higher as the starch's gelling power increases and the α-amylase activity decreases. The starch gelatinization rate recorded in the third stage is defined by the ┚ slope. The parameters obtained during the third stage are the following: 1. Pasting temperature (° C) - the temperature at the onset of the rise in viscosity 2. Peak torque (Nm), C3 - the maximum torque produced during the heating stage 3. Peak temperature (° C) - the temperature at the peak viscosity 4. Gelatinization rate (Nm/min), ┚ At the fourth stage, consistency decreases as a result of physical breakdown of the starch granules due to mechanical shear stress and the temperature constraint (Rosell et al., 2007). The rate of dough consistency decrease is given by the ┛ slope, which refer to cooking stability rate (Rosell et al., 2007).
www.intechopen.com
The Role of Empirical Rheology in Flour Quality Control
353
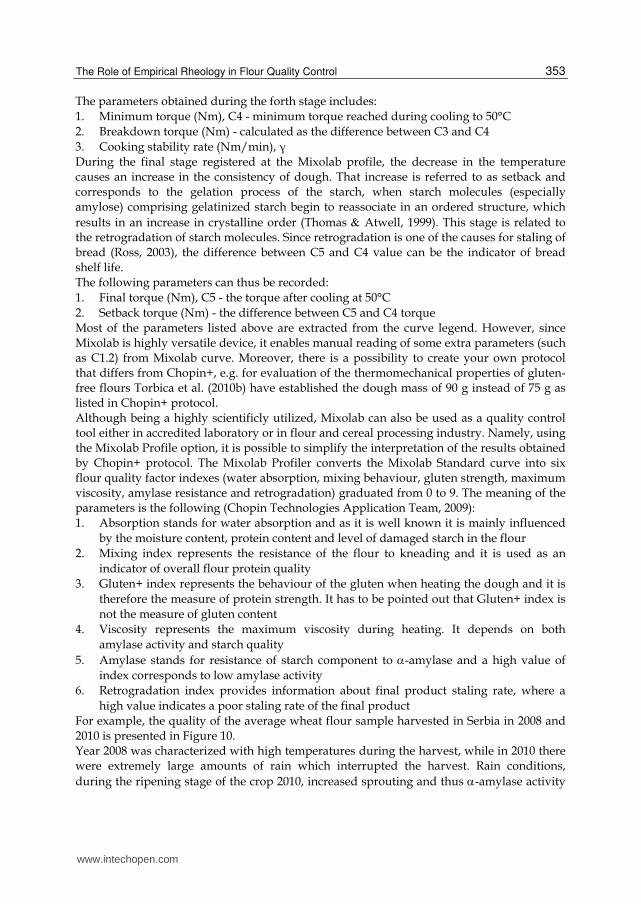
The parameters obtained during the forth stage includes: 1. Minimum torque (Nm), C4 - minimum torque reached during cooling to 50°C 2. Breakdown torque (Nm) - calculated as the difference between C3 and C4 3. Cooking stability rate (Nm/min), ┛ During the final stage registered at the Mixolab profile, the decrease in the temperature causes an increase in the consistency of dough. That increase is referred to as setback and corresponds to the gelation process of the starch, when starch molecules (especially amylose) comprising gelatinized starch begin to reassociate in an ordered structure, which results in an increase in crystalline order (Thomas & Atwell, 1999). This stage is related to the retrogradation of starch molecules. Since retrogradation is one of the causes for staling of bread (Ross, 2003), the difference between C5 and C4 value can be the indicator of bread shelf life. The following parameters can thus be recorded: 1. Final torque (Nm), C5 - the torque after cooling at 50°C 2. Setback torque (Nm) - the difference between C5 and C4 torque Most of the parameters listed above are extracted from the curve legend. However, since Mixolab is highly versatile device, it enables manual reading of some extra parameters (such as C1.2) from Mixolab curve. Moreover, there is a possibility to create your own protocol that differs from Chopin+, e.g. for evaluation of the thermomechanical properties of gluten-free flours Torbica et al. (2010b) have established the dough mass of 90 g instead of 75 g as listed in Chopin+ protocol. Although being a highly scientificly utilized, Mixolab can also be used as a quality control tool either in accredited laboratory or in flour and cereal processing industry. Namely, using the Mixolab Profile option, it is possible to simplify the interpretation of the results obtained by Chopin+ protocol. The Mixolab Profiler converts the Mixolab Standard curve into six flour quality factor indexes (water absorption, mixing behaviour, gluten strength, maximum viscosity, amylase resistance and retrogradation) graduated from 0 to 9. The meaning of the parameters is the following (Chopin Technologies Application Team, 2009): 1. Absorption stands for water absorption and as it is well known it is mainly influenced
by the moisture content, protein content and level of damaged starch in the flour 2. Mixing index represents the resistance of the flour to kneading and it is used as an
indicator of overall flour protein quality 3. Gluten+ index represents the behaviour of the gluten when heating the dough and it is
therefore the measure of protein strength. It has to be pointed out that Gluten+ index is not the measure of gluten content
4. Viscosity represents the maximum viscosity during heating. It depends on both amylase activity and starch quality
5. Amylase stands for resistance of starch component to α-amylase and a high value of index corresponds to low amylase activity
6. Retrogradation index provides information about final product staling rate, where a high value indicates a poor staling rate of the final product
For example, the quality of the average wheat flour sample harvested in Serbia in 2008 and 2010 is presented in Figure 10. Year 2008 was characterized with high temperatures during the harvest, while in 2010 there were extremely large amounts of rain which interrupted the harvest. Rain conditions, during the ripening stage of the crop 2010, increased sprouting and thus α-amylase activity
www.intechopen.com
Wide Spectra of Quality Control
354
(Morris & Paulsen, 1985) which resulted in low Amylase index. This also affected the low Viscosity index. On contrary, low Viscosity index of sample 2008 was not the consequence of increased amylase activity, as it can be seen from high Amylase index value, but it was caused by a heat stress. Concerning the protein quality, both samples have shown low gluten strength as expressed in low values of Gluten+ index. Sample 2010 even exhibited very low Mixing index due to destroyed proteins structure as a result of the attacks of wheat bugs. Namely, sample 2010 contained 2% bug-damaged kernels where bug’s proteolytic enzymes caused the breakdown of the gluten proteins during the breadmaking process (Olanca & Sivri, 2004).
Fig. 10. Mixolab Profiler values of average wheat flour sample harvested in Serbia in 2008 and 2010
7. Conclusion
In order to get more comprehensive insight into the structural changes during the dough processing, fundamental rheology has the greater advantages over the empirical rheology. Therefore, the basic rheometry is an important tool among cereal scientists. On contrary, ease in the interpretation and application of the result obtained by empirical rheology methods, as well as their high correlation with dough processing behaviour and end product quality, has made the descriptive rheological devices indispensable in cereal quality control laboratories and among cereal technologists. However, in order to get complete picture of dough behaviour during all breadmaking stages, one have to employ a wide range of different empirical rheological devices, which is very time consuming and requires large amount of sample. Therefore, the future trends in development of new dough empirical rheological instruments or attachments to existing devices would be the combination of different devices and principles in one instrument and reduction of the sample amount to a quantity which will still be able to imitate real processing and baking conditions.
8. Acknowledgment
The financial support of Brabender® GmbH & Co. KG (Duisburg, Germany) and Chopin Technologies (Villeneuve-la-Garenne Cedex, France) towards this study is hereby gratefully acknowledged.
www.intechopen.com
The Role of Empirical Rheology in Flour Quality Control
355
The results expressed and conclusions arrived at are the part of the project (project number TR-31007) funded by Ministry of Science and Technological Development, Republic of Serbia.
9. References
AACC methods. (2000). Approved methods of the American Association of Cereal Chemists, 10th edition, American Association of Cereal Chemists, St. Paul, MN, USA
Abang Zaidel, D. N., Chin, N. L., Abdul Rahman, R. & Karim R. (2008). Rheological Characterisation of Gluten from Extensibility Measurement. Journal of Food Engineering, Vol. 86, No. 4, (June 2008), pp. 549-556, ISSN 0260-8774
Abang Zaidel, D. N., Chin, N. L. & Yusof, Y. A. (2010). A Review on Rheological Properties and Measurements of Dough and Gluten. Journal of Applied Sciences, Vol. 10, No. 20, pp. (2478-2490), ISSN 18125654
Aldovrandi L. & Vitali F. (1995). Criteri di valutazione del frumento tenero da parte dell’industria molitoria. Molini d’Italia, Vol. 46, No. 3, pp. 16-19
Anderssen, R. S., Bekes, F., Gras, P.W., Nikolov, A. & Wood, J. T. (2004). Wheat-Flour Dough Extensibility As a Discriminator for Wheat Varieties. Journal of Cereal Science, Vol. 39, No. 2, (March 2004), pp. 195–203, ISSN 0733-5210
Best, S., Muller, R. (1990). Use of the Hagberg Falling Number Apparatus to Determine Malt and Barley Quality. Journal of the Institute of Brewing, Vol. 97, No 4, (July-August 1991), pp. 273-278, ISSN 0046-9750
Bordes, J. Branlard, G., Oury, F. X., Charmet, G. & Balfourier, F. (2008). Agronomic Characteristics, Grain Quality and Flour Rheology of 372 Bread Wheats in a Worldwide Core Collection. Journal of Cereal Science, Vol. 48, No. 3, (November 2008), pp. (569-579), ISSN 0733-5210
Cauvain, S. P. (1998). Breadmaking Process, In: Technology of Breadmaking, S. P. Cauvain & L. S. Young, (Eds.), 18-44, Blackie Academic and Professional, ISBN 9780834216853, London, UK
Chopin Technologies Application Team. (2009). Mixolab applications handbook, Rheological and Enzymatic Analysis (No. 28), Chopin Applications Laboratory, Villeneuve la Garenne, France
Collado, L. S., Corke, H. (1999). Accurate Estimation of Sweetpotato Amylase Activity by Flour Viscosity Analysis. Journal of Agricultural and Food Chemistry, Vol. 47, No. 3, (February 1999), pp. 832–835, ISSN 1520-5118
Collar, C., Bollain, C. & Rosell, C. M. (2007). Rheological Behaviour of Formulated Bread Doughs During Mixing and Heating. Food Science and Technology International, Vol. 13, No. 2, (April 2007), pp. 99–107, ISSN 1082-0132
Dapčević, T. Hadnađev, M. & Pojić, M. (2009). Evaluation of the Possibility to Replace Conventional Rheological Wheat Flour Quality Control Instruments with the New Measurement Tool – Mixolab. Agriculturae Conspectus Scientificus, Vol. 74, No. 3, (September 2009), pp. 169-174, ISSN 1331-7776
De Bry, L. (2006). Wheat Flour of the Third Millennium, In: Bakery Products: Science and Technology, Y.H. Hui, (Ed.), 87-96, Blackwell Publishing, ISBN-13 978-0-8138-0187-2, Oxford, UK
Dimmock, J. P. R. E. & Gooding M. J. (2002). The Effects of Fungicides on Hagberg Falling Number and Blackpoint in Winter Wheat. Crop Protection, Vol. 21, No. 6, (July 2002), pp. 475-487, ISSN 0261-2194
www.intechopen.com
Wide Spectra of Quality Control
356
Dobraszczyk, B.J., Campbell, G.M. & Gan, Z. (2000). Bread—a unique food, In: Cereals and Cereal Products: Technology and Chemistry, B.J. Dobraszczyk, D.A.V. Dendy, (Ed.), pp. 182-232, Aspen Publishers, ISBN 0-8342-1767-8, Gaithersburg, Maryland, USA
Dobraszczyk, B. J. & Morgenstern, M. P. (2003). Rheology and the Breadmaking Process. Journal of Cereal Science, Vol. 38, No. 3, (November 2003), pp. 229-245, ISSN 0733-5210
Dobraszczyk, B. J. (2004). Dough Rheology. In: Encyclopedia of Grain Science, C. Wrigley, H. Corke & C. E. Walker, (Eds.), 400-416, Elsevier Ltd, ISBN 978-0-12-765490-4, Oxford, UK
Dobraszczyk, B. J. & Salmanowicz, B. P (2008). Comparison of Prediction of Baking Volume Using Large Deformation Rheological Properties. Journal of Cereal Science, Vol. 47, No. 2, (March 2008), pp. 292-301, ISSN 0733-5210
Dubois, M. Dubat, A. & Launay, B. (2008). The AlveoConsistograph Handbook (2nd edition), AACC International, ISBN 978-1-891127-56-4, St. Paul, Minnesota, USA
Freund, W. & Kim, M.-Y. (2006). Determining the Baking Quality of Wheat and Rye Flour. In: Future of Flour – A Compendium of Flour Improvement, L. Popper, W. Schäfer & W. Freund, (Eds.), 101-116, Verlag Agrimedia, ISBN 978-3-86037-309-5, Clenze, Germany
Gooding, M. J. & Davies, W. P. (1997). Wheat Production and Utilization: Systems, Quality and the Environment, CAB International, ISBN 0851991556, Wallingford, UK
Grausgruber, H, Schöggl, G. & Ruckenbauer, P. (2002). Investigations on the Validity of the Micro-Extensigraph Method to Measure Rheological Properties of Wheat Doughs. European Food Research and Technology, Vol. 214, No. 1, (January 2002), pp. 79-82, ISSN 1438-2385
Graybosch, R. A., Guo, G. & Shelton, D. R. (2000). Aberrant Falling Numbers of Waxy Wheats Independent of α-amylase activity. Cereal Chemistry, Vol. 77, No. 1, (January/February 2000), pp. 1-3, ISSN 0009-0352
Graybosch, A. R., Seabourn, B., Chen, R. Y. & Blechl, E. A. (2011). Quality and Agronomic Effects of Three High-Molecular-Weight Glutenin Subunit Transgenic Events in Winter Wheat. Cereal Chemistry, Vol. 88, No.1, (January-Ferbruary 2011), pp. 95–102, ISSN 0009-0352
Hoseney, R. C. (1994). Principles of cereal science and technology (2nd edition), American Association of Cereal Chemists, ISBN 0913250791, St. Paul, MN, USA
Huang, W., Li, L., Wang F., Wan J., Tilley, M., Ren C & Wu, S. (2010). Effects of Transglutaminase on the Rheological and Mixolab Thermomechanical Characteristics of Oat Dough. Food Chemistry, Vol. 121, No. 4, (August 2010), pp. 934-939, ISSN 0308-8146
ICC Standards. (1996). Standard Methods of the International Association for Cereal Science and Technology, International Association for Cereal Science and Technology, Vienna, Austria
Kahraman, K., Sakıyan, O., Ozturk, S., Koksel, H., Sumnu, G. & Dubat, A. (2008). Utilization of Mixolab® to Predict the Suitability of Flours in Terms of Cake Quality. European Food Research and Technology, Vol. 227, No. 2, (October 2008), pp. 565-570, ISSN 1438-2385
www.intechopen.com
The Role of Empirical Rheology in Flour Quality Control
357
Karvonen, T. Peltonen, J. Kivi, E. (1991). The Effect of Northern Climatic Conditions on Sprouting Damage of Wheat Grains. Acta Agriculturae Scandinavica, Vol. 41, No. 1, pp. 55-64, ISSN 0001-5121
Kent, N. L. & Evers, A. D. (1994). Technology of Cereals (4th edition), Elsevier Science Ltd., ISBN 0 08 040833 8, Oxford, UK
Kettlewell, P. S. (1999). The Response of Alpha-Amylase Activity During Wheat Grain Development to Nitrogen Fertiliser. Annals of Applied Biology, Vol. 134, No. 2, (Jun 1999), pp. 241-249, ISSN 1744-7348
Khan, K. & Nygard, G. (2006). Gluten, In: Bakery Products: Science and Technology, Y.H. Hui, (Ed.), 97-107, Blackwell Publishing, ISBN-13 978-0-8138-0187-2, Oxford, UK
Kieffer, R. (2006). The Role of Gluten Elasticity in the Baking Quality of Wheat, In: Future of Flour – A Compendium of Flour Improvement, L. Popper, W. Schäfer & W. Freund, (Eds.), 169-178, Verlag Agrimedia, ISBN 978-3-86037-309-5, Clenze, Germany
Ktenioudaki, A., Butler, F. & Gallagher, E. (2011). Dough Characteristics of Irish Wheat Varieties I. Rheological Properties and Prediction of Baking Volume. LWT - Food Science and Technology, Vol. 44, No. 3, (April 2011), pp. 594-601, ISSN 0023-6438
Kweon, M. (2010). Falling Number in Wheat - How is it Calculated and What Does it Mean to Producers?, In: 2010 Research Review USDA-ARS Soft Wheat Quality Laboratory, 2010, Available from:
http://www.ars.usda.gov/SP2UserFiles/Place/36070500/InfoDianehasuploaded/2010ResearchReviewAnnualReport/MKweon-FN-012810.pdf
Lagarrigue, S. Alvarez, G. (2001). The Rheology of Starch Dispersions at High Temperatures and High Shear Rates: A Review. Journal of Food Engineering, Vol. 50, No. 4, (December 2001), pp. 189-202, ISSN 0260-8774
Lallemand. (1996). Using the Right Amount of Yeast, In: Lallemand Baking Update, Vol. 1, No. 4, 30.03.2011., Available from
http://www.lallemand.com/BakerYeastNA/eng/PDFs/LBU%20PDF%20FILES/1_4DOSE.PDF
Léon, A. E, Barrera, G. N., Pérez, G. T., Ribotta P. D. & Rosell, C. M. (2006). Effect of Damaged Starch Levels on Flour-Thermal Behaviour and Bread Staling. European Food Research and Techology, Vol. 224, No. 2, (March 2006), pp. 187–192, ISSN 1438-2385
Lorenz, K. & Wolt, M. (1981). Effect of Altitude on Falling Number Values of Flours. Cereal Chemistry, Vol. 58, No. 2, (March-April 1981), pp. 80-82, ISSN 0009-0352
Lunn, G. D., Kettlewell, P. S., Major B. J. & Scott R. K. (2001). Effects of Pericarp Alpha Amylase Activity on Wheat (Triticum Aestivum) Hagberg Falling Number, Annals of Applied Biology, Vol. 138, No. 2, pp. 207-214, ISSN 1744-7348
Mann, G., Allen, H., Morell, M. K., Nath, Z., Martin, P., Oliver, J., Cullis, B. & Smith, A. (2005). Comparison of Small-Scale and Large-Scale Extensibility of Dough Produced from Wheat Flour. Australian Journal of Agricultural Research, Vol. 56, No. 12, (December 2005), pp. 1387–1394, ISSN 0004-9409
Mann, G., Diffey, S., Allen, H., Pumpa J., Nath, Z., Morell, M. K., Cullis, B. & Smith, A. (2008). Comparison of Small-Scale and Large-Scale Mixing Characteristics: Correlations Between Small-Scale and Large-Scale Mixing and Extensional Characteristics of Wheat Flour Dough. Journal of Cereal Science, Vol. 47, No. 1, (January 2008), pp. 90-100, ISSN 0733-5210
www.intechopen.com
Wide Spectra of Quality Control
358
Marchylo, B. A. & Dexter, J. E. (2001). Pasta Production, In: Cereals Processing Technology, G. Owens, (Ed.), 109-130, Woodhead Publishing Limited, ISBN 0-8493-1219-1, Cambridge, UK
Mares, D. & Mrva, K. (2008). Late-Maturity α-Amylase: Low Falling Number in Wheat in the Absence of Preharvest Sprouting. Journal of Cereal Science, Vol. 47, No. 1, (January 2008) pp. 6–17, ISSN 0733-5210
Mariotti, M., Zardi, M., Lucisano, M. & Pagani, M. A. (2005). Influence of the Heating Rate on the Pasting Properties of Various Flours. Starch – Stärke, Vol. 57, No. 11, (November 2005), pp. 564–572, ISSN 1521-379X
Miyazaki, M., Hung, P. V., Maeda, T. & Morita, N. (2006). Recent Advances in Application of Modified Starches for Breadmaking. Trends in Food Science & Technology, Vol. 17, No. 11, (November 2006), pp. 591-599, ISSN 0924-2244
Morris, C. F. & Paulsen, G. M. (1985). Preharvest Sprouting of Hard Winter Wheat as Affected by Nitrogen Nutrition. Crop Science, Vol. 25, No. 6, pp. 1028-1031, ISSN 0011-183X
Nash, D., Lanning, S. P., Fox, P., Martin, J. M., Blake, N. K., Souza, E., Graybosch, R. A., Giroux, M. J. & Talbert, L. E. (2006). Relationship of Dough Extensibility to Dough Strength in a Spring Wheat Cross. Cereal Chemistry, Vol. 83, No. 3, (May/June 2006), pp. 255-258, ISSN 0009-0352
Olanca, B. & Sivri, D. (2004). Inhibition Effects of Plant Extracts on the Protease Activity in Bug (Eurygaster spp.) Damaged Wheats. Proceedings of 8th Gluten Workshop, pp. 417-420, ISBN 0-85404-633-X , Viterbo, Italy, September 8-10, 2003
Rasper, V. F. & Walker C. E. (2000). Quality Evaluation of Cereals and Cereal Products, In: Handbook of Cereal Science and Technology, K. Kulp & J.G. Ponte Jr., (Eds.), 505-538, Marcel Dekker, Inc., ISBN 0-8247-8294-1, New York, USA
Rosell, C. M., Collar, C. & Haros, M. (2007). Assessment of Hydrocolloid Effects on the Thermo-Mechanical Properties of Wheat Using the Mixolab. Food Hydrocolloids, Vol. 21, No. 3, (May 2007), pp. 452–462, ISSN 0268-005X
Ross, A. S., Walker, C. E., Booth, R. I., Orth, R. A. & Wrigley, C. W. (1987). The Rapid ViscoAnalyser: A New Technique for the Evaluation of Sprout Damage. Cereal Foods World, Vol. 32, No. 11, (November-December 1987), pp. 827–829, ISSN 0146-6283
Ross, Y. H. (2003). Molecular Mobility in Dough and Bread Quality, In: Bread making: improving quality, S. P. Cauvain, (Ed.), pp. 288-305, Woodhead Publishing Limited, ISBN 1 85573 553 9, Cambridge, England, UK
Ruske, R. E., Gooding, M. J. & Dobraszczyk, B. J. (2004). Effects of Triazole and Strobilurin Fungicide Programmes, With and Without Late-Season Nitrogen Fertiliser, on the Baking
Quality of Malacca Winter Wheat. Journal of Cereal Science, Vol. 40, No. 1, (July 2004), pp. 1-8, ISSN 0733-5210
Sahin, S. & Sumnu, S. G. (2006). Physical Properties of Foods, Springer Science+Business Media, LLC, ISBN 978-0387-30780-0, New York, USA.
Schramm, G. (2004). A Practical Approach to Rheology and Rheometry (2nd edition), Thermo Electron (Karlsruhe) GmbH, Karlsruhe, Germany
Serbian official methods. (1988). Određivanje fizičkih osobina pšeničnog brašna Brabenderovim farinografom, In: Pravilnik o metodama fizičkih i hemijskih analiza za kontrolu kvaliteta žita, mlinskih i pekarskih proizvoda, testenina i brzo
www.intechopen.com

The Role of Empirical Rheology in Flour Quality Control
359
smrznutih testa (Regulation of methods of physical and chemical analysis for quality control of grain, milling and bakery products, pasta and quick frozen dough), Službeni list SFRJ 74/88, Serbia
Sorenson, B., (2006). Falling Numbers 101: Determining Sprout Damage in Grain, In: Praire grains, 2006, Available from:
http://www.smallgrains.org/springwh/Mar06/falling/falling.html Steffe, J. F. (1996). Rheological Methods in Food Process Engineering (2nd edition), Freeman Press,
ISBN 0-9632036-1-4, East Lansing, MI, USA Stoenescu, G., Ionescu, V., Vasilean, I., Aprodu, I. & Banu, I. (2010). Prediction the Quality of
Industrial Flour Using the Mixolab Device, BulletinoUniversity Agricultural Sciences and Veterinary Medicine Cluj-Napoca. Agriculture, Vol. 67, No. 2, pp. 429- 434, ISSN 1843-5386
Suchy, J., Lukow, O. M. & Ingelin, M. E. (2000). Dough Microextensibility Method Using a 2-g Mixograph and a Texture Analyzer. Cereal Chemistry, Vol. 77, No. 1, (January/February 2000), pp. 39–43, ISSN 0009-0352
Suh, D. S. & Jane, J. J. (2003). Comparison of Starch Pasting Properties at Various Cooking Conditions Using the Micro Visco-Amylo-Graph and the Rapid Visco Analyse. Cereal Chemistry, Vol. 80, No. 6, (November/December 2003), pp. 745-749, ISSN 0009-0352
Ţăin, A.E., Zincă, G. & Banu, I. (2008). Studies about Obtaining Safe and Healthy Bakery Products Using the Beneficial Properties of Enzymes. Chemical Bulletin of „POLITEHNICA” University of Timisoara, Vol. 53(67), No. 1-2, pp. 110-114, ISSN 2069-6310
Thomas, D. J. & Atwell, W. A. (1999). Starches, Eagan Press Handbook series, ISBN 1891127012, St. Paul, MN, USA
Torbica, A., Antov, M., Mastilović, J., Knežević, D. (2007). The Influence of Changes in Gluten Complex Structure on Technological Quality of Wheat (Triticum aestivum L.). Food Research International, Vol. 40, No. 8, (October 2007), pp. 1038-1045, ISSN 0963-9969
Torbica, A., Živančev, D., Hadnađev, M. & Mastilović, J. (2010a). Influence of Heat Stress on Wheat Grain Quality, Proceedings of 45th Croatian & 5th International Symposium on Agriculture, pp. 940-944, ISBN 978-953-6331-79-6, Opatija, Hrvatska, February 15-19, 2010
Torbica, A., Hadnađev, M. & Dapčević, T. (2010). Rheological, Textural and Sensory Properties of Gluten-Free Bread Formulations Based on Rice and Buckwheat Flour, Food Hydrocolloids, Vol. 24, No. 6-7, (August-October 2010), pp. 626–632, ISSN 0268-005X
Torbica, A., Živančev, D., Mastilović, J., Knežević, D. & Bodroža-Solarov, M. (2011). Impact of Changes in Climate Conditions on the Technological Quality of Wheat, Proceedings of 46th Croatian & 6th International Symposium on Agriculture, pp. 617-621, ISBN 978-953-6135-71-4, Opatija, Hrvatska, February 14-18, 2011
Uthayakumaran, S., Lafiandra, D. & Gianibelli, M. C. (2004). Evaluation of Durum Wheat Quality Using Micro-Scale and Basic Rheological Tests, In: The Gluten Proteins, D. Lafiandra, S. Masci & R. D’Ovidio, (Eds.), 275-278, The Royal Society of Chemistry, ISBN 0-85404-633-X, Cambridge, UK
www.intechopen.com
Wide Spectra of Quality Control
360
Veraverbeke, W. S. & Delcour, J. A. (2002). Wheat Protein Composition and Properties of Wheat Glutenin in Relation to Breadmaking Functionality. Critical Reviews in Food Science and Nutrition, Vol. 42, No. 3, (May 2002), pp. 179-208, ISSN 1549-7852
Vergnes, B., Della Valle, G. & Colonna P. (2003). Rheological Properties of Biopolymers and Applications to Cereal Processing, In: Characterization of Cereals and Flours, G. Kaletunç & K. J. Breslauer, (Eds.), 209-265, Marcel Dekker, Inc., ISBN 0-8247-0734-6, New York, USA
Wang, J., Pawelzik, E., Weinert, J., Zhao, Q. & Wolf, G. A. (2004). Effect of Fungicide Treatment on the Quality of Wheat Flour and Breadmaking. Journal of Agricultural and Food Chemistry, Vol. 52, No 25, (December 2004), pp. 7593-7600, ISSN 1520-5118
Weipert, D. (1990). The Benefits of Basic Rheometry in Studying Dough Rheology. Cereal Chemistry, Vol. 67, No. 4, (July-August 1990), pp. (311-317), ISSN 0009-0352
Weipert, D. (2006). Fundamentals of Rheology and Spectrometry. In: Future of Flour – A Compendium of Flour Improvement, L. Popper, W. Schäfer & W. Freund, (Eds.), 117-146, Verlag Agrimedia, ISBN 978-3-86037-309-5, Clenze, Germany
www.intechopen.com
Wide Spectra of Quality ControlEdited by Dr. Isin Akyar
ISBN 978-953-307-683-6Hard cover, 532 pagesPublisher InTechPublished online 07, July, 2011Published in print edition July, 2011
InTech EuropeUniversity Campus STeP Ri Slavka Krautzeka 83/A 51000 Rijeka, Croatia Phone: +385 (51) 770 447 Fax: +385 (51) 686 166www.intechopen.com
InTech ChinaUnit 405, Office Block, Hotel Equatorial Shanghai No.65, Yan An Road (West), Shanghai, 200040, China
Phone: +86-21-62489820 Fax: +86-21-62489821
Quality control is a standard which certainly has become a style of living. With the improvement of technologyevery day, we meet new and complicated devices and methods in different fields. Quality control explains thedirected use of testing to measure the achievement of a specific standard. It is the process, procedures andauthority used to accept or reject all components, drug product containers, closures, in-process materials,packaging material, labeling and drug products, and the authority to review production records to assure thatno errors have occurred.The quality which is supposed to be achieved is not a concept which can becontrolled by easy, numerical or other means, but it is the control over the intrinsic quality of a test facility andits studies. The aim of this book is to share useful and practical knowledge about quality control in severalfields with the people who want to improve their knowledge.
How to referenceIn order to correctly reference this scholarly work, feel free to copy and paste the following:
Tamara Dapc ̌evic ́ Hadnađev, Milica Pojic ́, Miroslav Hadnađev and Aleksandra Torbica (2011). The Role ofEmpirical Rheology in Flour Quality Control, Wide Spectra of Quality Control, Dr. Isin Akyar (Ed.), ISBN: 978-953-307-683-6, InTech, Available from: http://www.intechopen.com/books/wide-spectra-of-quality-control/the-role-of-empirical-rheology-in-flour-quality-control


