Download - The Soft Grid 2013 Opening Presentation


Thank You!

Cumulatively, 57 million smart meters will have been deployed in the United States in the next two years
US AMI Penetration 2015

Substation Automation System
AMI
Workforce Management
RTU Upgrades
GIS Integration
OMS Upgrade
Distribution Automation
Smart Homes
PMUs
TimeSource: EPRI, GTM Research
You Are Here
A
nnua
l Rat
e of
Dat
a In
take
(TB) “Due to economies of
scale, the faster and cheaper the devices become, the faster and cheaper data creation itself becomes. This creates something of a positive feedback loop which is hurtling us quickly toward the ‘internet of things’”
GTM Analyst Note
Utility Data Generation Curve

“GTM Research forecasts cumulative global spending on smart-grid-related analytics to top $20 billion between the years 2013-2020, with an annual spend of $3.98 billion globally in the year 2020. We estimate, the achieved return on this investment will exceed $120 billion globally over the same period”
2013 2014 2015 2016 2017 2018 2019 2020$0
$5,000,000,000
$10,000,000,000
$15,000,000,000
$20,000,000,000
$25,000,000,000
$0
$500,000,000
$1,000,000,000
$1,500,000,000
$2,000,000,000
$2,500,000,000
$3,000,000,000
$3,500,000,000
$4,000,000,000
$4,500,000,000
$1,108,704,545.45
$1,569,293,372.09
$1,950,212,607.14
$2,278,542,073.12
$2,601,249,874.00
$2,975,573,672.15
$3,598,897,587.34
$3,984,046,391.35
China Europe North America Asia-Pacific
Cum
ulat
ive
Spen
ding
(B
illio
ns)
Ann
ual S
pend
ing
(Bill
ions
)
CAGR 17 %
Soft Grid Regional Forecast 2013 - 2020
GTM Analyst Note
Global Utility Analytics Spending 2013 - 2020
Compound Annual Growth Rate (CAGR)
Shar
e of
Ove
rall
Smar
t Gri
d M
arke
t
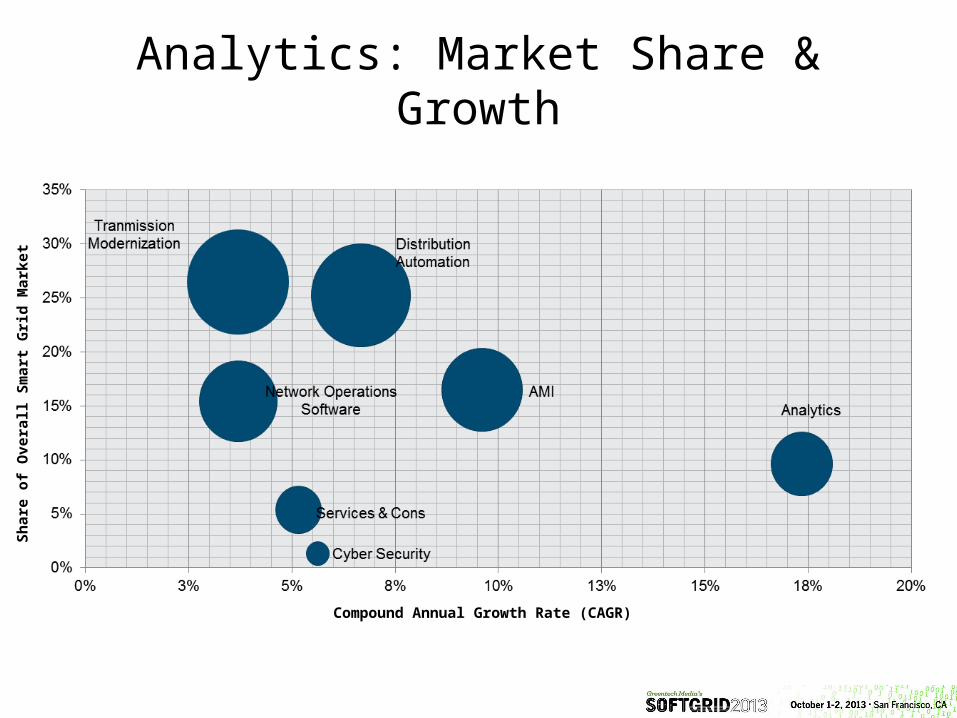
Analytics: Market Share & Growth

• Grid Optimization and Operational Intelligence
• Asset Management Analytics• Crisis Management Analytics• DMS Analytics• Outage Management Analytics/Fault• Detection and Correction• Weather/Location data• Mobile Workforce Management• Energy Theft
Soft Grid investment momentum globally is beginning to focus on some key markets. Some segments of the analytics market will grow quicker than others due to their immediate application.
Enterprise Analytics
Grid Analytics
Consumer Analytics
• Behavioral Analytics• Tiered Pricing - Trading,
Selling Megawatts (DR)• Building Energy
Management• Power Analytics (Load Flow)• Social Media Data
Integration• DG/EV/Microgrid Analytics
21
3
• Moving from Traditional, Historical Analytics to Real-Time Predictive Analytics
• Complete Situational Awareness• Business Intelligence• Trading with “live look” at the Grid• Simulation/Visualization
$8.7b
$4.2b
$7.1b
Soft Grid Investment
Portfolio
$20b Cumulative Market by 2020
“Many of these analytics and/or capabilities will rely on the same data, such that sound enterprise IT architecture design will play a vital role in their success”
GTM Analyst Note
All $ amounts represent cumulative market value by 2020
Investing in Soft Grid: Applications

GRID ANALYTICS
Rank Application Key FeaturesImplementationComplexity
MaturityPrimary Value Stream
Key Markets
1Outage Management
More efficient detection and restoration of service outages
Low HighAvoided Operational Costs
North America
2Voltage Optimization
Dynamically adjusting voltages via closed-loop feedback
Medium MediumRecovered Costs
Universal
3Asset Management
Aggregation of metering endpoints to a common asset (e.g., secondary transformers)
Medium to high depending on data utilization
MediumAvoided Capital Costs
Universal
High-Value Applications: Grid Analytics

CONSUMER ANALYTICS
Rank Application Key FeaturesImplementation Complexity
MaturityPrimary Value Stream
Key Markets
1Revenue Protection
Ability to compare and correlate usage patterns with other similar customer profiles to detect unbilled consumption
Variable, depending on level of theft sophistication
MediumCost Recovery
Canada, Latin America, India
2Load Forecasting
Creating individual consumption profiles for each consumer
Medium MediumAvoided Costs
Germany, Australia, Japan, United States
3Customer Segmentation
Fusion of customer consumption data with secondary data sources such as housing data, demographic data, and lifestyle information
Medium MediumAvoided Costs
Markets with retail access (e.g.. most of Europe, Texas)
High-Value Applications: Consumer Analytics

Source: GTM, SAS High-Performance Analytics for the Smart Grid
Reliability is the Leading Driver

Global Market Notes & Updates

An Undeniable Inflection Point• 2/3rds of total US distributed PV deployed in the last 2.5 years
alone• By 2016 there will be a new PV installation nearly every minute
“If FERC does not ensure the grid is ready to integrate the growing marketplace demand for distributed solar and other distributed resources, we are going to have problems with grid reliability and overall grid costs.” – Jon Wellinghoff, August 2013

A Next-Generation Energy System
“Grid Edge comprises the technologies, solutions and business models advancing the transition towards a
decentralized, distributed and transactive electric grid.” –GTM Research

Grid Edge: A Complex, Exciting Road Ahead

The Grid Edge Executive Council