The Sourcing Issues From Around the
Globe Panel
November 2010
“RMG is labor intensive industry”China
The main driver for this industry.
Surpassed Japan as the world’s second-largest economy last quarter.
Nominal gross domestic product for the second quarter totaled $1.337 trillion.
Economy grew steadily in recent years to reach 8.7% in 2009 and 10.3% in Q2 2010.
Exports dropped by 20% in year 2009.
Local Investments & Private consumption are the main two drivers of the GDP that
were mainly affected by the recession in 2009.
•
•
•
•
•
•
•
•
•
•
•
Apparel consumption decreased since Jan 08 and started rebounding in Jan 10 in terms of
Quantity & Quality.
The biggest importer for men’s woven shirt in 09 counting for 633 million USD.
The labor cost tripled in the last 10 years.
Acceleration in urbanization and income distribution reform would shift earnings from
corporate to employees leading to further labor cost growth and stronger domestic
consumption.
Active working population (15-54) which grew by 7 million per year in the past decade
would decline by 1 million a year.
The drop in China exports is bound
to be shifted to areas
in the same region.
(ex: India, Bangladesh, Indonesia, Pakistan, Vietnam, Cambodia)
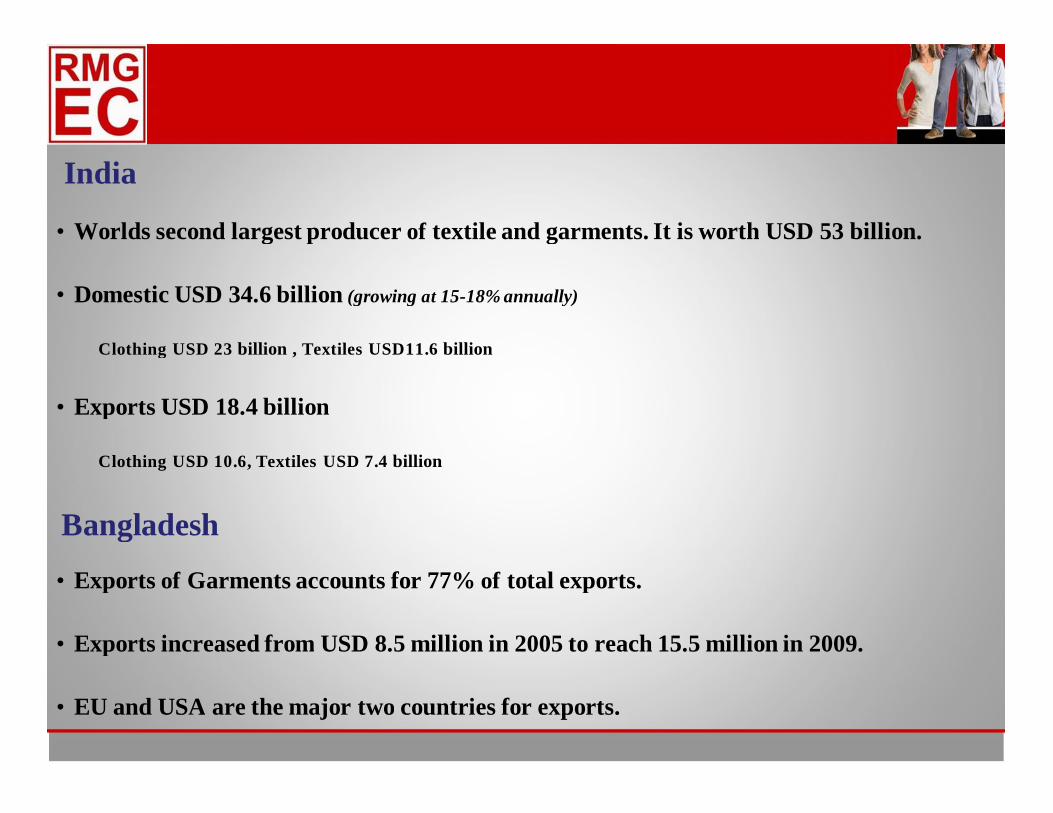
India
Worlds second largest producer of textile and garments. It is worth USD 53 billion.
Domestic USD 34.6 billion
Clothing USD 23 billion , Textiles USD11.6 billion
Exports USD 18.4 billion
Clothing USD 10.6, Textiles USD 7.4 billion
Bangladesh
Exports of Garments accounts for 77% of total exports.
Exports increased from USD 8.5 million in 2005 to reach 15.5 million in 2009.
EU and USA are the major two countries for exports.
•
•
•
•
•
•
(growing at 15-18% annually)
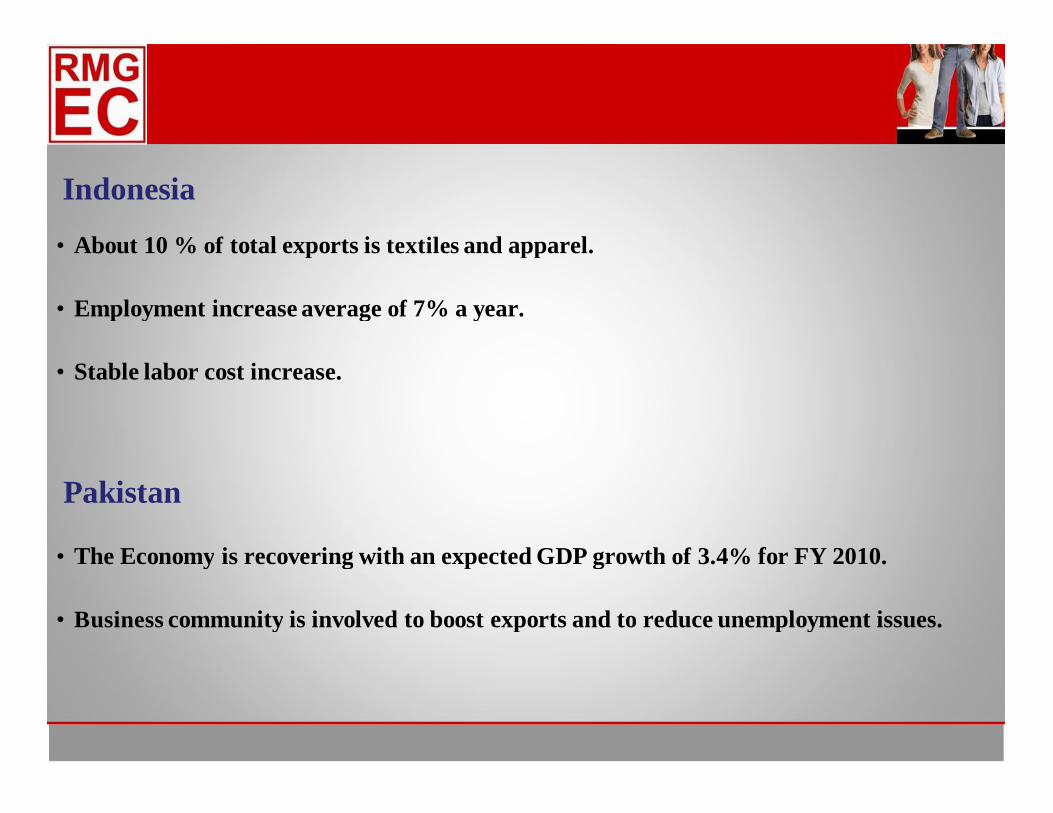
Indonesia
About 10 % of total exports is textiles and apparel.
Employment increase average of 7% a year.
Stable labor cost increase.
The Economy is recovering with an expected GDP growth of 3.4% for FY 2010.
Business community is involved to boost exports and to reduce unemployment issues.
Pakistan
•
•
•
•
•
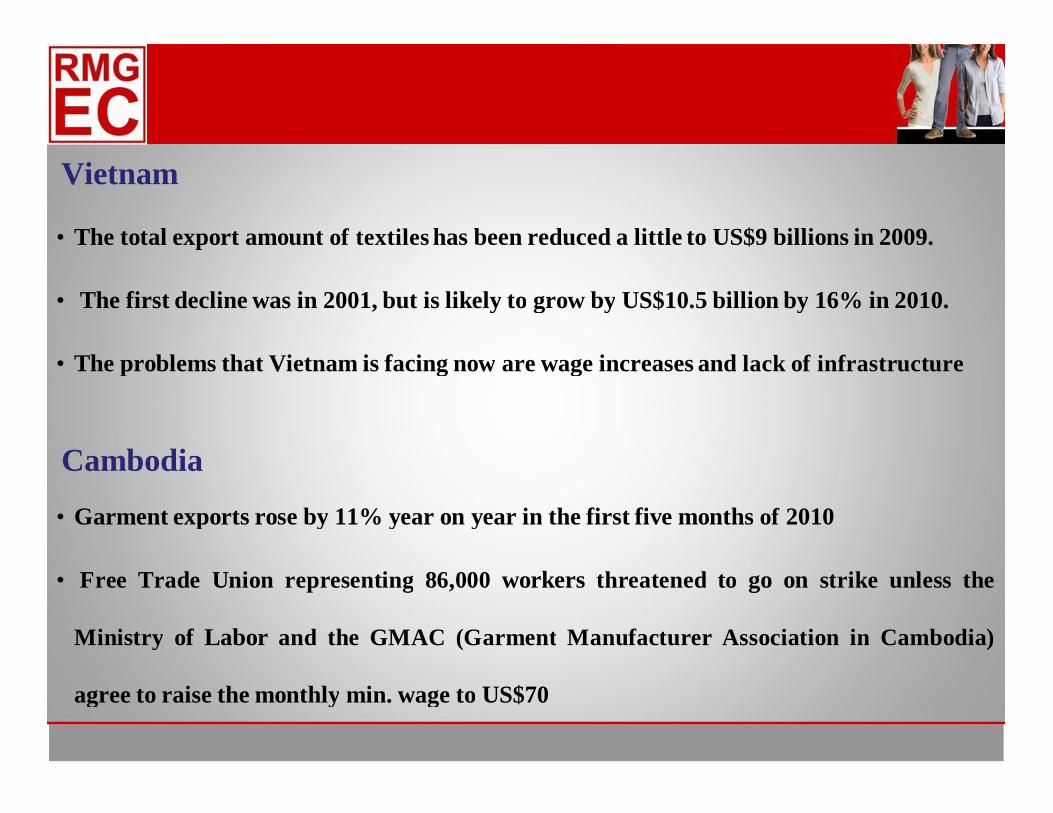
Vietnam
The total export amount of textiles has been reduced a little to US$9 billions in 2009.
The first decline was in 2001, but is likely to grow by US$10.5 billion by 16% in 2010.
The problems that Vietnam is facing now are wage increases and lack of infrastructure
Cambodia
Garment exports rose by 11% year on year in the first five months of 2010
Free Trade Union representing 86,000 workers threatened to go on strike unless the
Ministry of Labor and the GMAC (Garment Manufacturer Association in Cambodia)
agree to raise the monthly min. wage to US$70
•
•
•
•
•
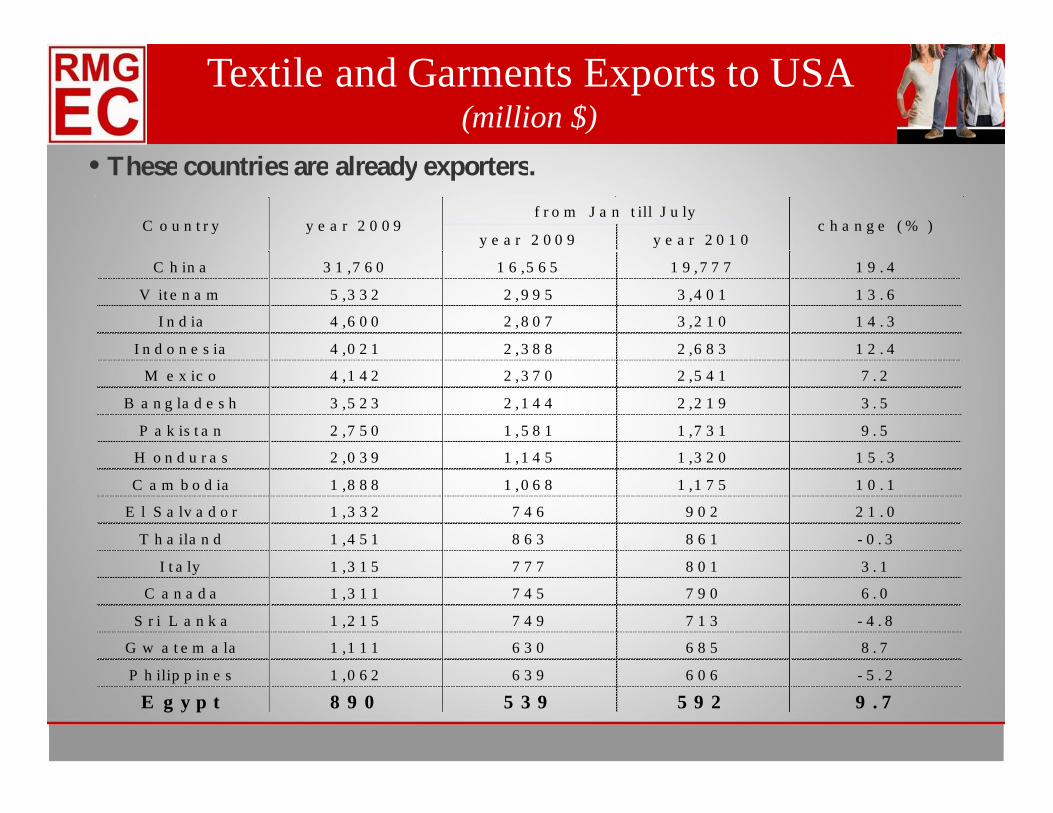
• These countries are already exporters.
y e a r 2 0 0 9 y e a r 2 0 1 0
C h in a 3 1 ,7 6 0 1 6 ,5 6 5 1 9 ,7 7 7 1 9 . 4
V it e n a m 5 ,3 3 2 2 ,9 9 5 3 ,4 0 1 1 3 . 6
I n d ia 4 ,6 0 0 2 ,8 0 7 3 ,2 1 0 1 4 . 3
I n d o n e s ia 4 ,0 2 1 2 ,3 8 8 2 ,6 8 3 1 2 . 4
M e x ic o 4 ,1 4 2 2 ,3 7 0 2 ,5 4 1 7 . 2
B a n g la d e s h 3 ,5 2 3 2 ,1 4 4 2 ,2 1 9 3 . 5
P a k is t a n 2 ,7 5 0 1 ,5 8 1 1 ,7 3 1 9 . 5
H o n d u r a s 2 ,0 3 9 1 ,1 4 5 1 ,3 2 0 1 5 . 3
C a m b o d ia 1 ,8 8 8 1 ,0 6 8 1 ,1 7 5 1 0 . 1
E l S a lv a d o r 1 ,3 3 2 7 4 6 9 0 2 2 1 . 0
T h a ila n d 1 ,4 5 1 8 6 3 8 6 1 - 0 . 3
I t a ly 1 ,3 1 5 7 7 7 8 0 1 3 . 1
C a n a d a 1 ,3 1 1 7 4 5 7 9 0 6 . 0
S r i L a n k a 1 ,2 1 5 7 4 9 7 1 3 - 4 . 8
G w a t e m a la 1 ,1 1 1 6 3 0 6 8 5 8 . 7
P h ilip p in e s 1 ,0 6 2 6 3 9 6 0 6 - 5 . 2
y e a r 2 0 0 9f r o m J a n t ill J u ly
c h a n g e ( % )C o u n t r y
Textile and Garments Exports to USA
E g y p t 8 9 0 5 3 9 5 9 2 9 . 7
(million $)
The potential growth will have to be in a place
where labor force is available
AFRICA …. WHERE?
Egypt
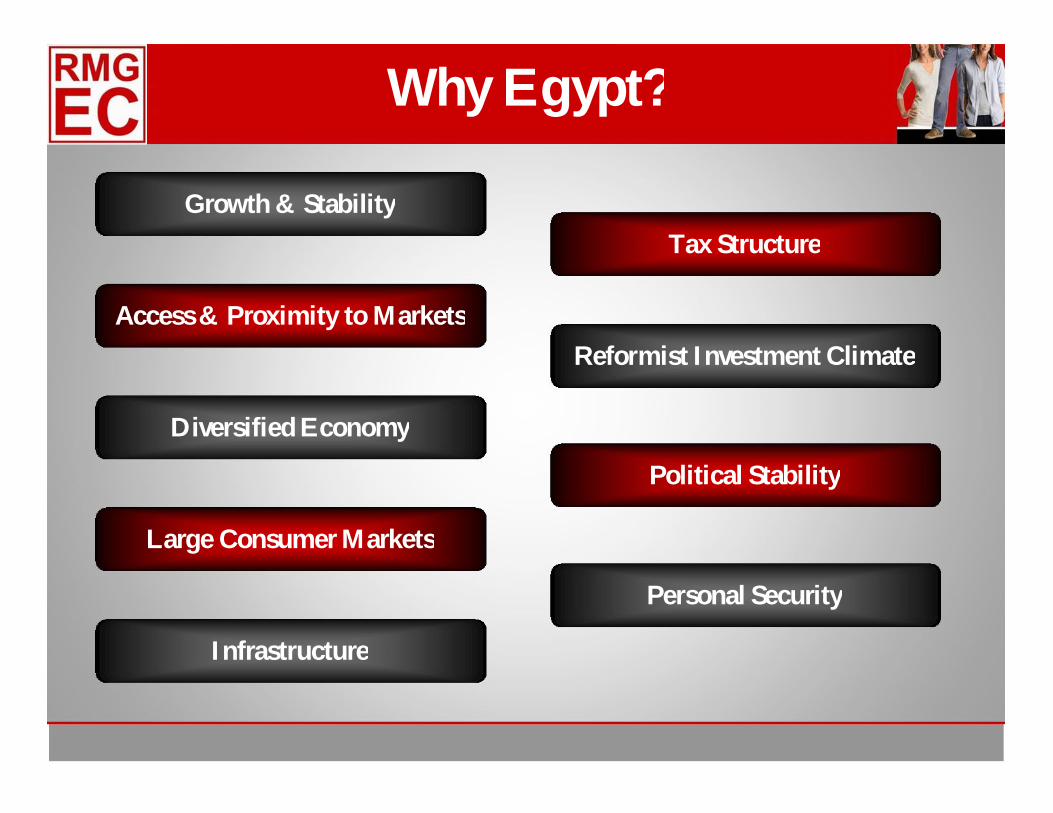
Why Egypt?
Growth & Stability
Access & Proximity to Markets
Diversified Economy
Large Consumer Markets
Infrastructure
Tax Structure
Reformist Investment Climate
Political Stability
Personal Security
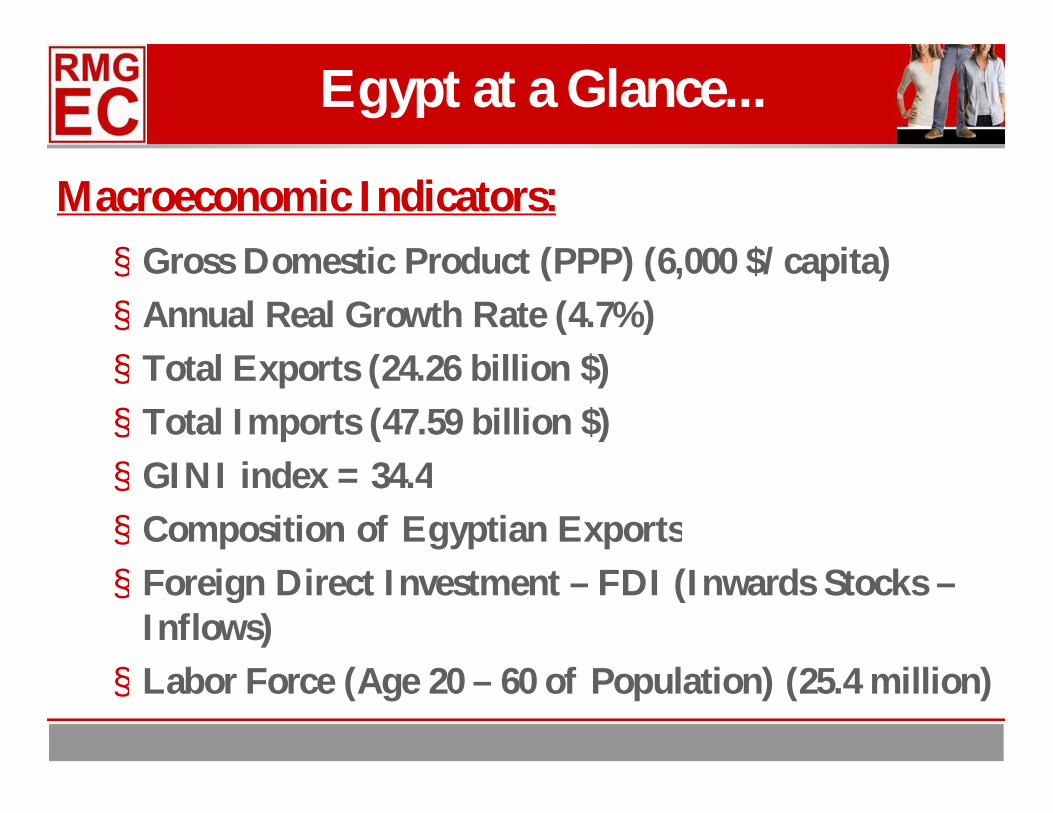
Macroeconomic Indicators:Gross Domestic Product (PPP) (6,000 $/capita)Annual Real Growth Rate (4.7%)Total Exports (24.26 billion $)Total Imports (47.59 billion $)GINI index = 34.4Composition of Egyptian ExportsForeign Direct Investment – FDI (Inwards Stocks –Inflows)Labor Force (Age 20 – 60 of Population) (25.4 million)
Egypt at a Glance...
§
§
§
§
§
§
§
§
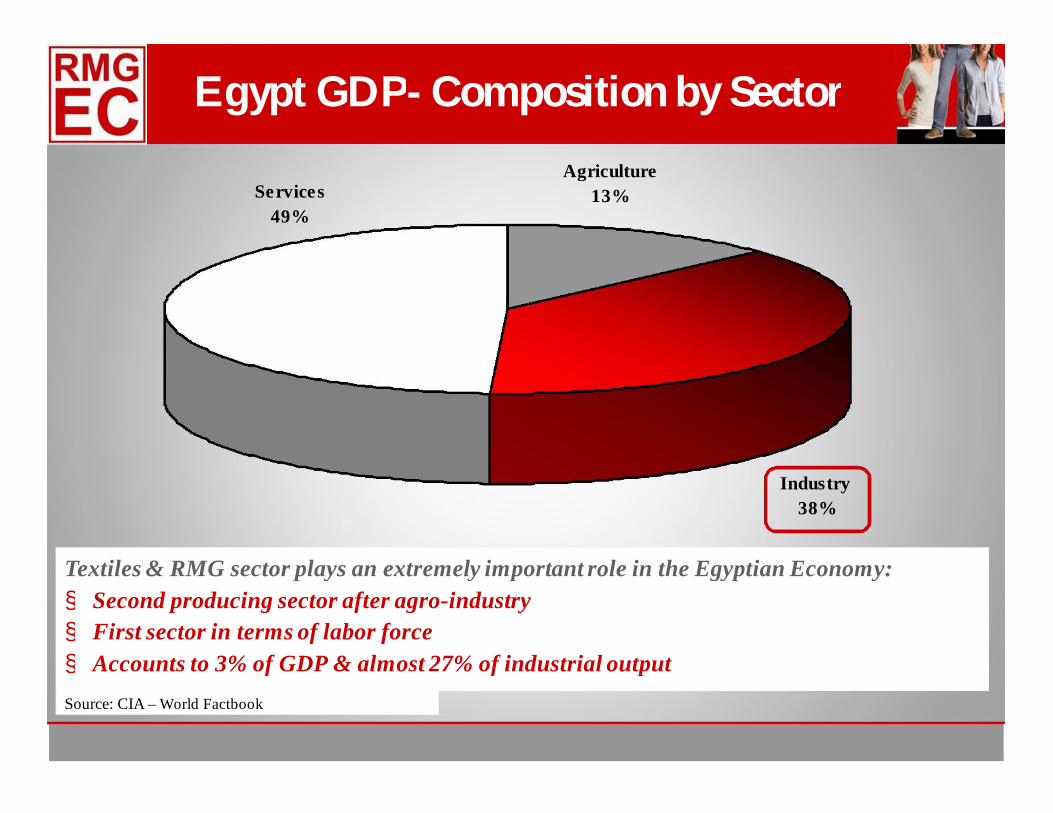
Egypt GDP- Composition by Sector
Source: CIA – World Factbook
Services49%
Industry 38%
Agriculture13%
Textiles & RMG sector plays an extremely important role in the Egyptian Economy: Second producing sector after agro-industryFirst sector in terms of labor forceAccounts to 3% of GDP & almost 27% of industrial output
§§§
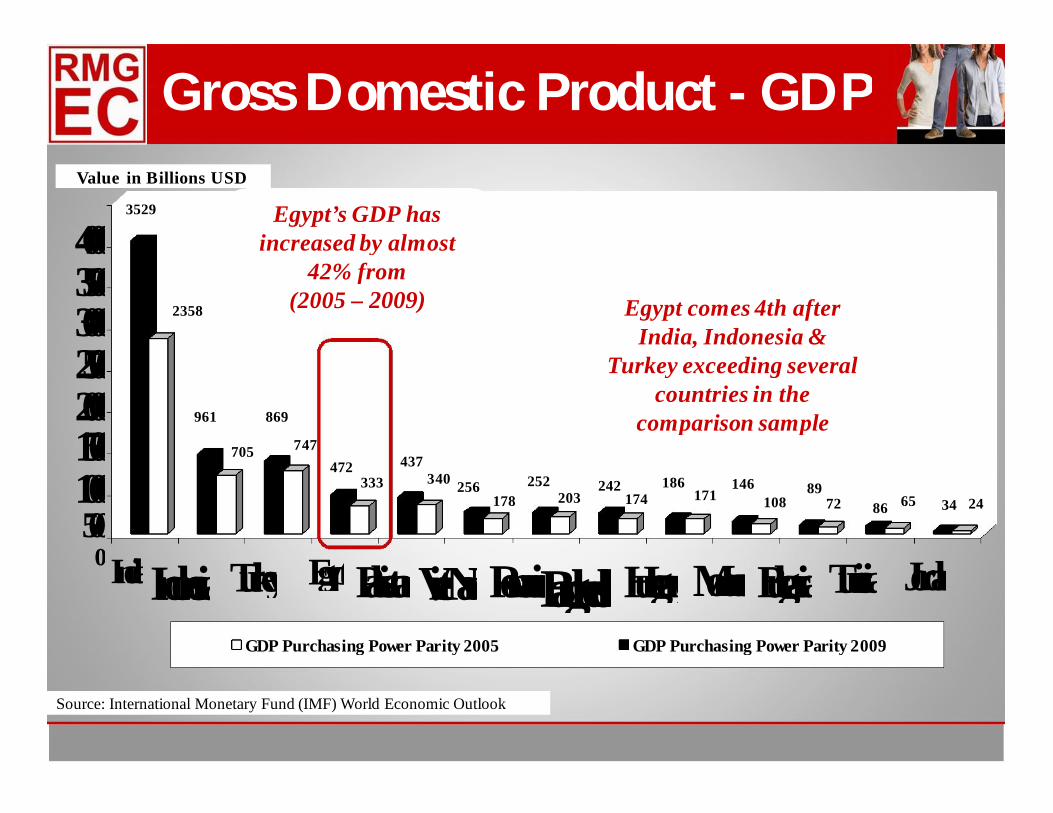
Gross Domestic Product - GDP
2358
3529
705
961
747
869
333472
340437
178256
203252
174242 171
186108
14672
896586 2434
05001000150020002500300035004000
IndiaIndonesiaTurkey EgyptPakistanViet NamRomaniaBangladeshHungaryMoroccoBulgariaTunisia JordanGDP Purchasing Power Parity 2005 GDP Purchasing Power Parity 2009
Value in Billions USD
Source: International Monetary Fund (IMF) World Economic Outlook
Egypt’s GDP has increased by almost
42% from (2005 – 2009) Egypt comes 4th after
India, Indonesia & Turkey exceeding several
countries in the comparison sample
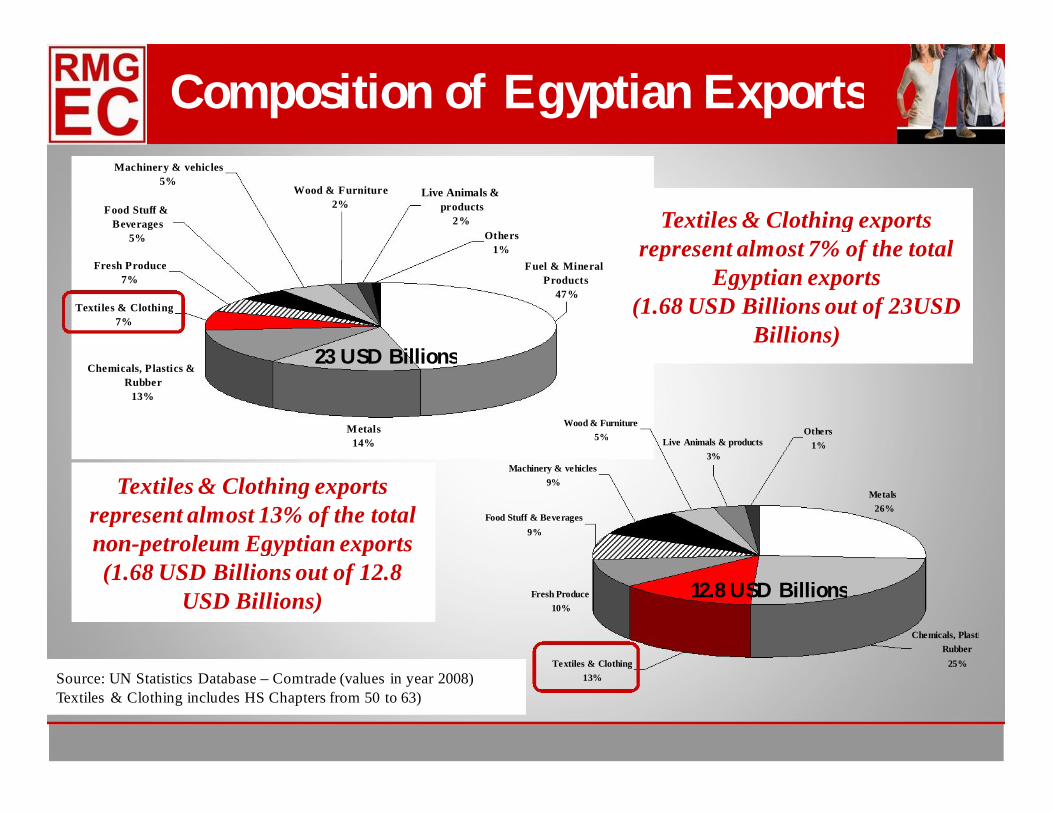
Chemicals, Plastics & Rubber
13%
Metals14%
Textiles & Clothing7%
Fresh Produce7%
Fuel & Mineral Products
47%
Others1%
Live Animals & products
2%
Wood & Furniture2%Food Stuff &
Beverages5%
Machinery & vehicles5%
Wood & Furniture5%
Machinery & vehicles9%
Live Animals & products3%
Others1%
Metals 26%
Food Stuff & Beverages9%
Fresh Produce10%
Chemicals, Plastics & Rubber
25%Textiles & Clothing13%
Textiles & Clothing exports represent almost 7% of the total
Egyptian exports (1.68 USD Billions out of 23USD
Billions)
Textiles & Clothing exports represent almost 13% of the total non-petroleum Egyptian exports (1.68 USD Billions out of 12.8
USD Billions)
23 USD Billions
12.8 USD Billions
Composition of Egyptian Exports
Source: UN Statistics Database – Comtrade (values in year 2008)Textiles & Clothing includes HS Chapters from 50 to 63)
467
113
73
56
48
26
24
11
9
4
4
3
2
0 50 100 150 200 250 300 350 400 450 500
India
Indonesia
Bangladesh
Pakistan
Viet Nam
Egypt
Turkey
M orocco
Romania
Hungary
Tunisia
Bulgaria
Jordan
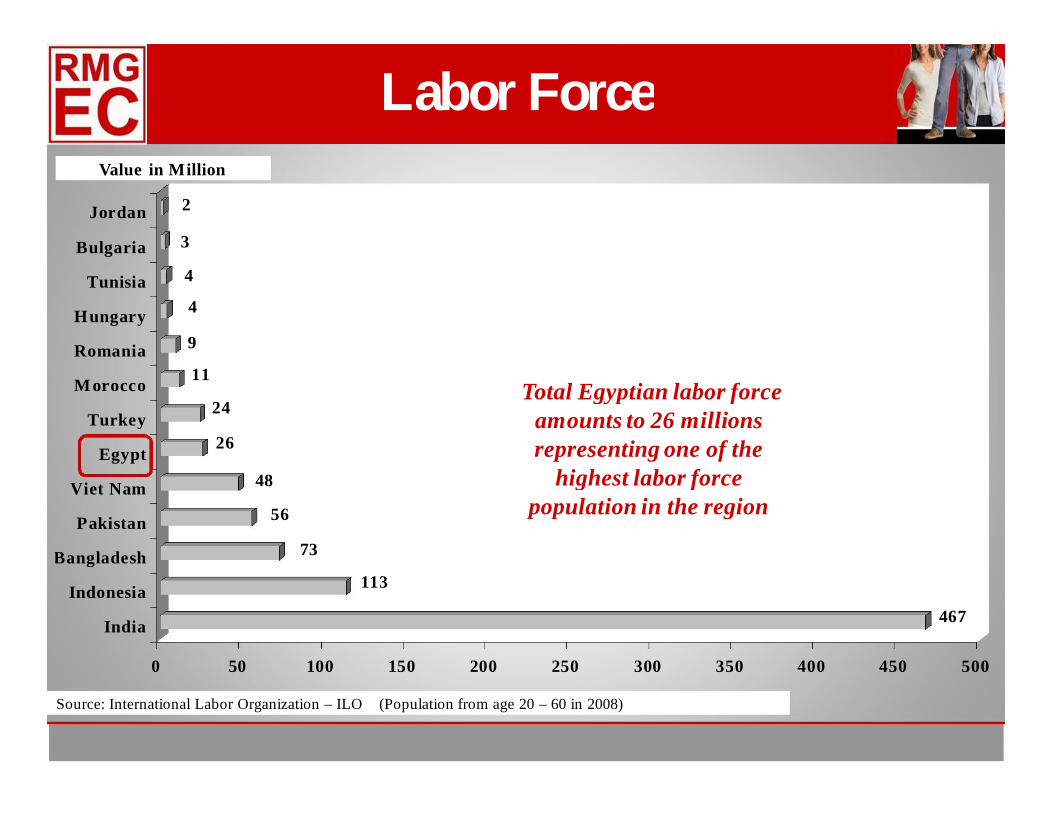
Value in Million
Labor Force
Source: International Labor Organization – ILO (Population from age 20 – 60 in 2008)
Total Egyptian labor force amounts to 26 millions representing one of the
highest labor force population in the region
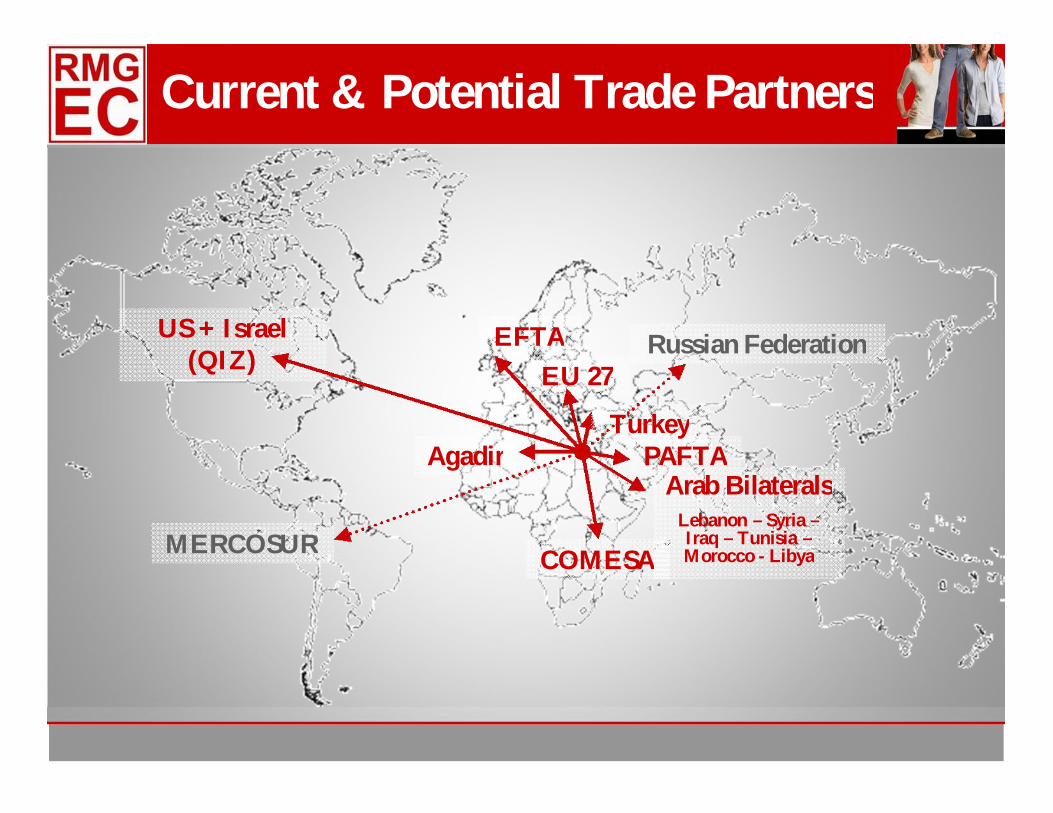
Current & Potential Trade Partners
US + Israel (QIZ) EU 27
EFTA
COMESA
PAFTATurkey
Arab BilateralsLebanon – Syria –Iraq – Tunisia –Morocco - Libya
Agadir
MERCOSUR
Russian Federation
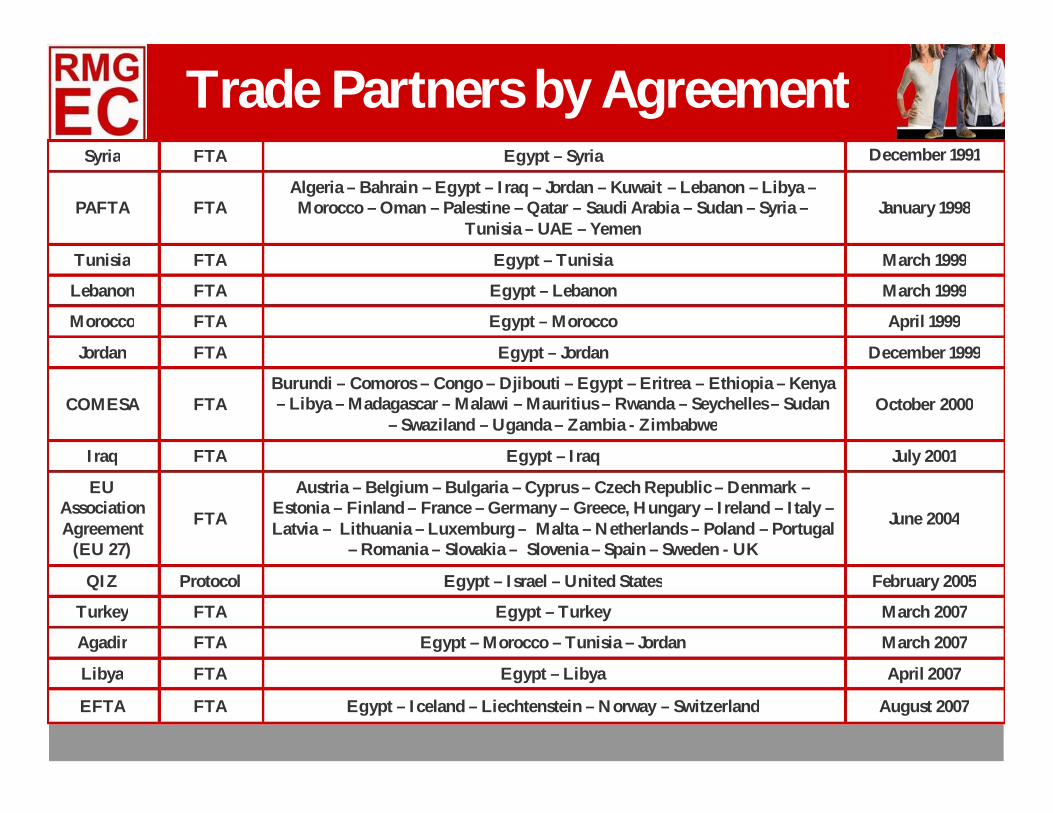
Syria FTA Egypt – Syria December 1991
PAFTA FTAAlgeria – Bahrain – Egypt – Iraq – Jordan – Kuwait – Lebanon – Libya –Morocco – Oman – Palestine – Qatar – Saudi Arabia – Sudan – Syria –
Tunisia – UAE – Yemen January 1998
Tunisia FTA Egypt – Tunisia March 1999
Lebanon FTA Egypt – Lebanon March 1999
Morocco FTA Egypt – Morocco April 1999
Jordan FTA Egypt – Jordan December 1999
COMESA FTABurundi – Comoros – Congo – Djibouti – Egypt – Eritrea – Ethiopia – Kenya – Libya – Madagascar – Malawi – Mauritius – Rwanda – Seychelles – Sudan
– Swaziland – Uganda – Zambia - ZimbabweOctober 2000
Iraq FTA Egypt – Iraq July 2001
EU Association Agreement
(EU 27)
FTA
Austria – Belgium – Bulgaria – Cyprus – Czech Republic – Denmark –Estonia – Finland – France – Germany – Greece, Hungary – Ireland – Italy –Latvia – Lithuania – Luxemburg – Malta – Netherlands – Poland – Portugal
– Romania – Slovakia – Slovenia – Spain – Sweden - UK
June 2004
QIZ Protocol Egypt – Israel – United States February 2005
Turkey FTA Egypt – Turkey March 2007
Agadir FTA Egypt – Morocco – Tunisia – Jordan March 2007
Libya FTA Egypt – Libya April 2007
EFTA FTA Egypt – Iceland – Liechtenstein – Norway – Switzerland August 2007
Trade Partners by Agreement
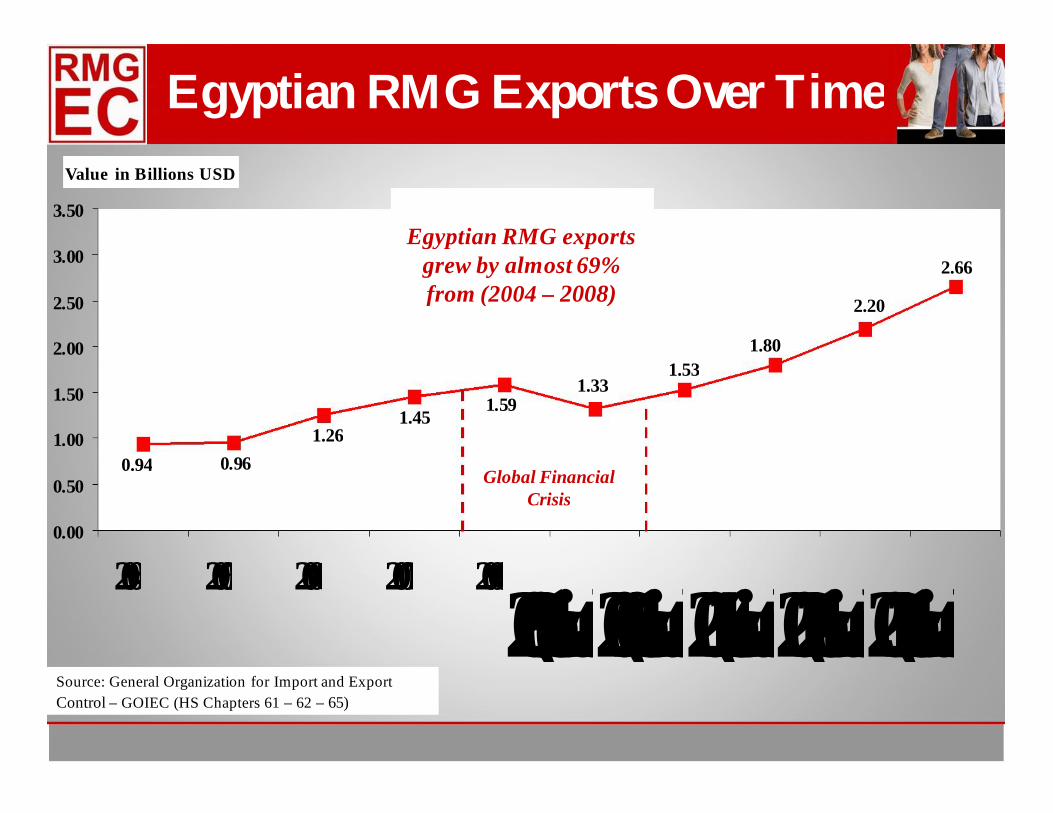
Egyptian RMG Exports Over Time
0.94 0.961.26
1.451.59
1.331.53
1.80
2.20
2.66
0.00
0.50
1.00
1.50
2.00
2.50
3.00
3.50
2004 2005 2006 2007 20082009 (estimated)2010 (estimated)2011 (estimated)2012 (estimated)2013 (estimated)
Value in Billions USD
Source: General Organization for Import and Export Control – GOIEC (HS Chapters 61 – 62 – 65)
Global Financial Crisis
Egyptian RMG exports grew by almost 69% from (2004 – 2008)
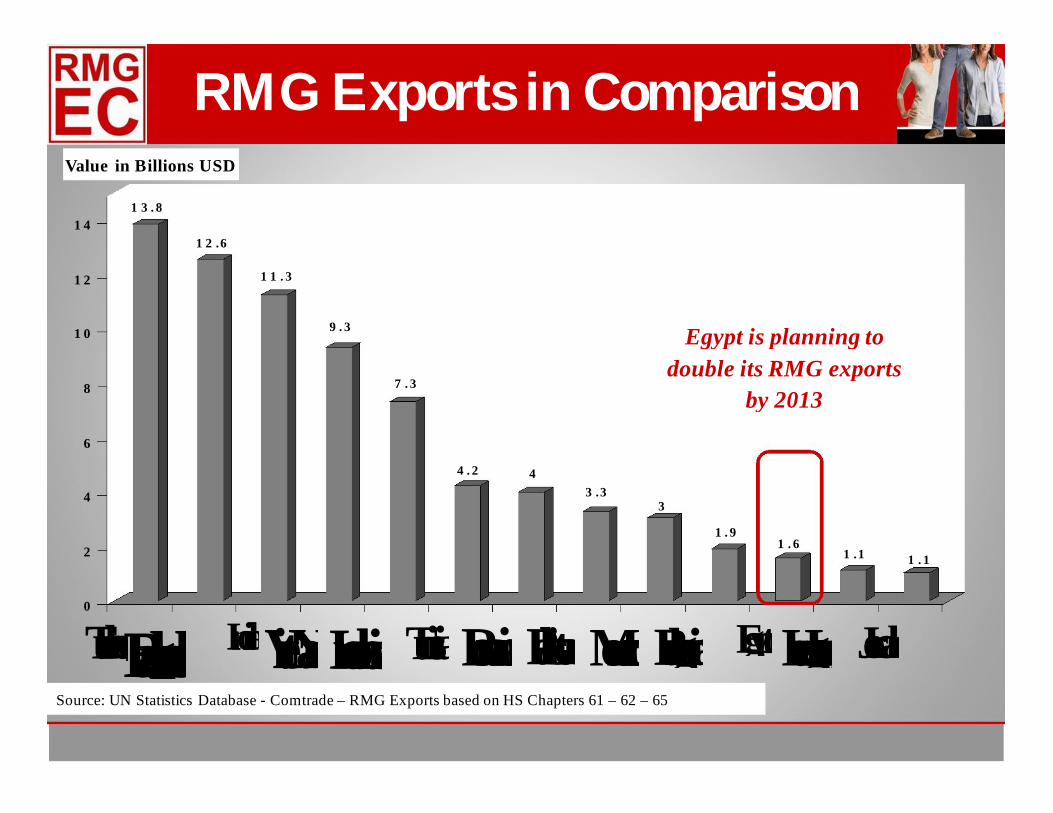
RMG Exports in ComparisonValue in Billions USD
1 3 . 8
1 2 .6
1 1 . 3
9 . 3
7 . 3
4 . 2 43 .3
3
1 . 91 . 6
1 .1 1 . 1
0
2
4
6
8
1 0
1 2
1 4
TurkeyBangladesh IndiaViet NamIndonesiaTunisiaRomaniaPakistanMoroccoBulgaria EgyptHungary JordanSource: UN Statistics Database - Comtrade – RMG Exports based on HS Chapters 61 – 62 – 65
Egypt is planning to double its RMG exports
by 2013
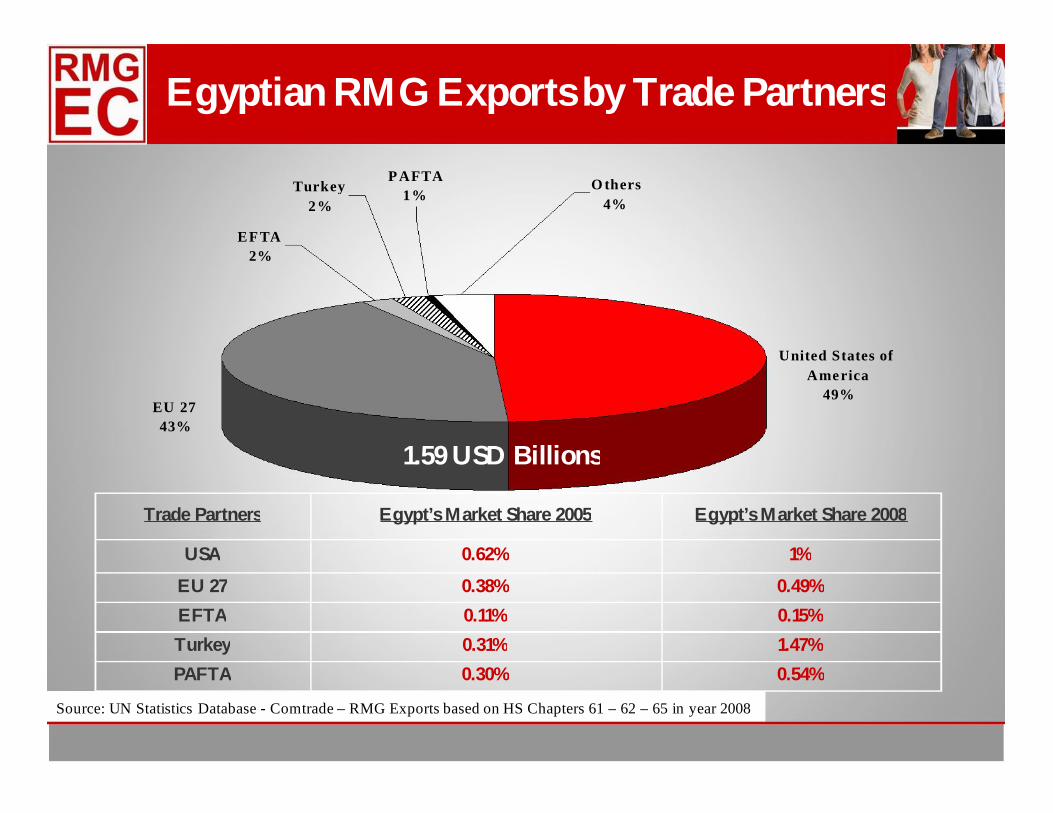
Egyptian RMG Exports by Trade Partners
1.59 USD Billions
Trade Partners Egypt’s Market Share 2005 Egypt’s Market Share 2008
USA 0.62% 1%
EU 27 0.38% 0.49%
EFTA 0.11% 0.15%
Turkey 0.31% 1.47%
PAFTA 0.30% 0.54%
Source: UN Statistics Database - Comtrade – RMG Exports based on HS Chapters 61 – 62 – 65 in year 2008
United States of America
49%
P AFTA1%
O thers4%
Turkey 2%
EF TA 2%
EU 27 43%
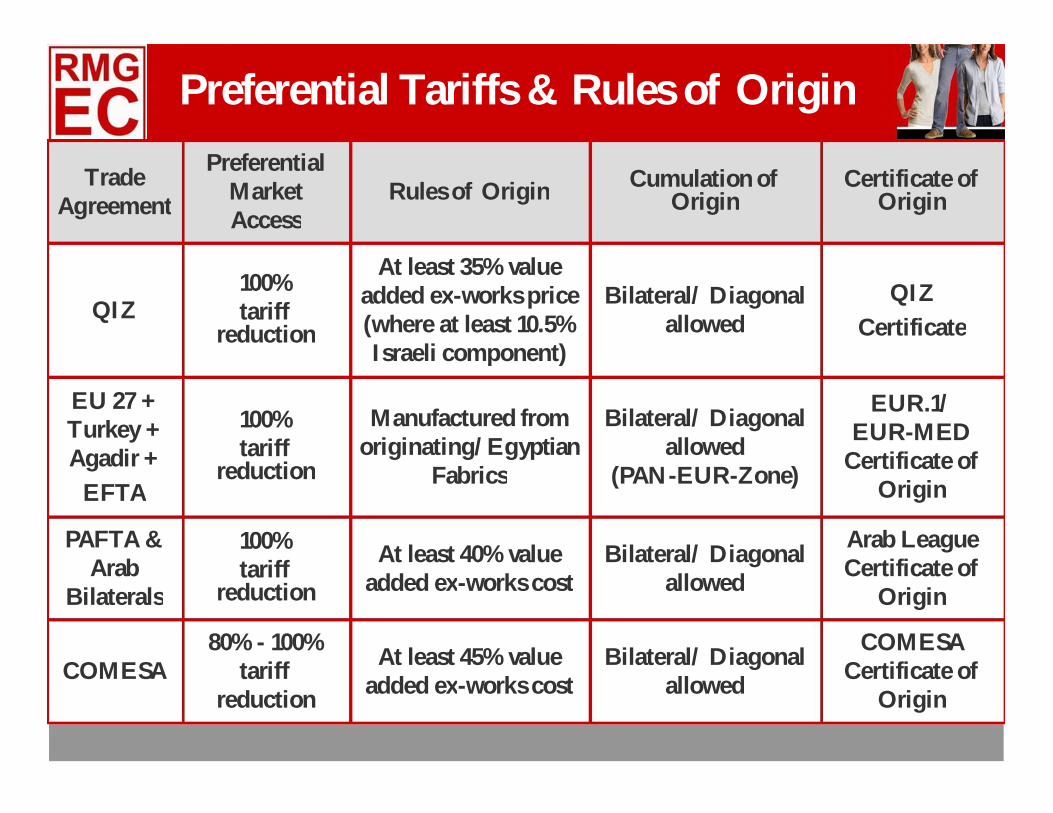
Trade Agreement
Preferential Market Access
Rules of Origin Cumulation of Origin
Certificate of Origin
QIZ100% tariff
reduction
At least 35% value added ex-works price (where at least 10.5% Israeli component)
Bilateral/ Diagonal allowed
QIZ Certificate
EU 27 + Turkey + Agadir +
EFTA
100% tariff
reduction
Manufactured from originating/Egyptian
Fabrics
Bilateral/ Diagonal allowed
(PAN-EUR-Zone)
EUR.1/ EUR-MED
Certificate of Origin
PAFTA & Arab
Bilaterals
100% tariff
reduction
At least 40% value added ex-works cost
Bilateral/ Diagonal allowed
Arab League Certificate of
Origin
COMESA 80% - 100%
tariff reduction
At least 45% value added ex-works cost
Bilateral/ Diagonal allowed
COMESA Certificate of
Origin
Preferential Tariffs & Rules of Origin
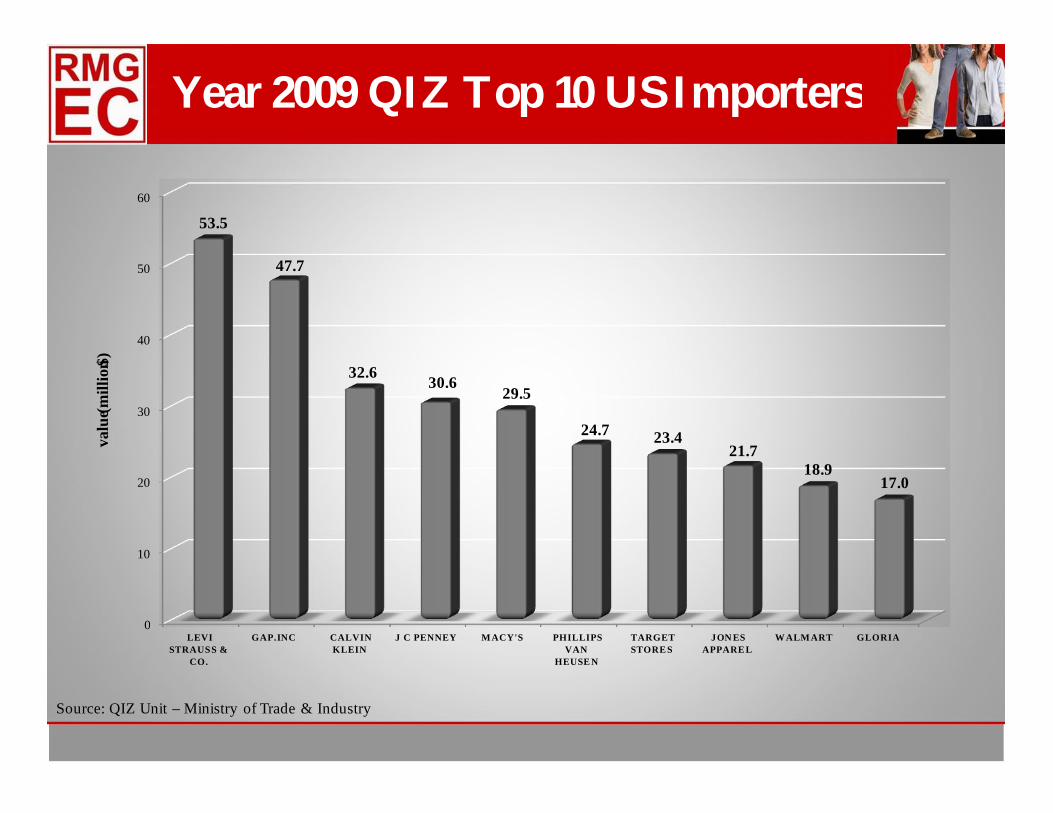
Year 2009 QIZ Top 10 US Importers
Source: QIZ Unit – Ministry of Trade & Industry
0
10
20
30
40
50
60
LEVISTRAUSS &
CO.
GAP.INC CALVINKLEIN
J C PENNEY MACY'S PHILLIPSVAN
HEUSE N
TARGETSTORE S
JON ESAPPARE L
W ALMART GLORIA
53.5
47.7
32.6 30.629.5
24.7 23.421.7
18.917.0
valu
e (mill
ion $
)
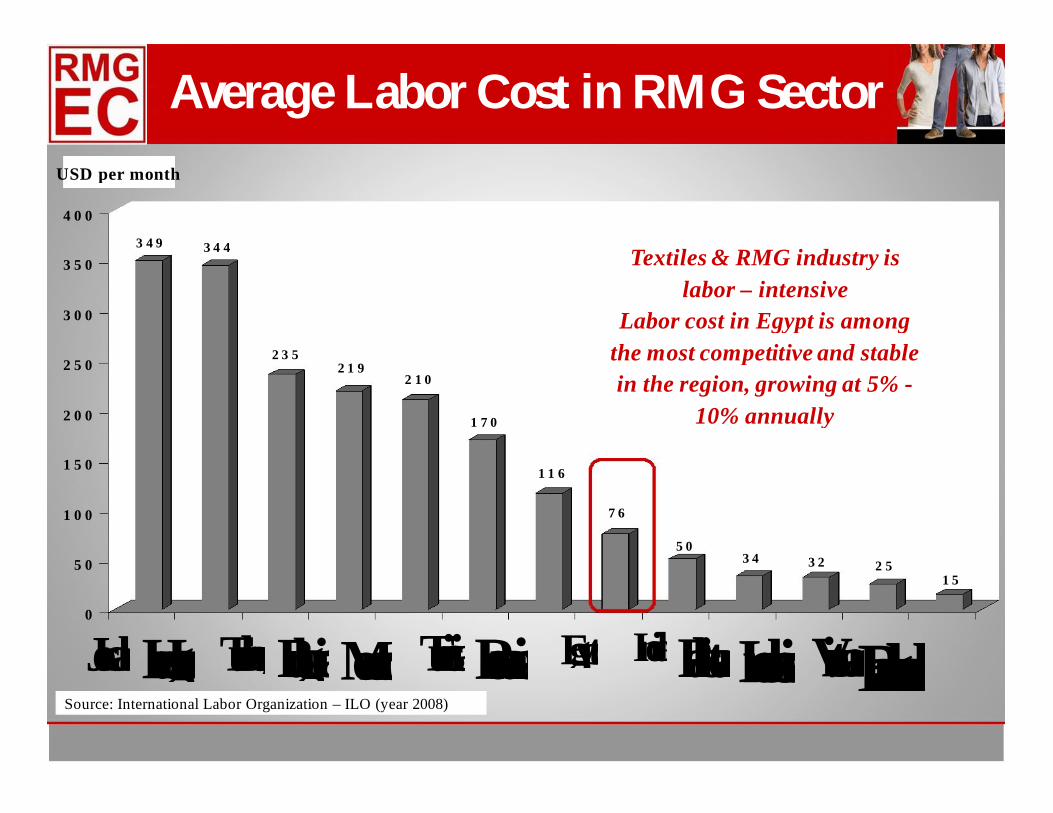
Average Labor Cost in RMG Sector USD per month
3 4 9 3 4 4
2 3 52 1 9
2 1 0
1 7 0
1 1 6
7 6
5 03 4 3 2 2 5
1 5
0
5 0
1 0 0
1 5 0
2 0 0
2 5 0
3 0 0
3 5 0
4 0 0
JordanHungary TurkeyBulgariaMorocco TunisiaRomania Egypt IndiaPakistanIndonesiaVietnamBangladeshSource: International Labor Organization – ILO (year 2008)
Textiles & RMG industry is labor – intensive
Labor cost in Egypt is among the most competitive and stable in the region, growing at 5% -
10% annually
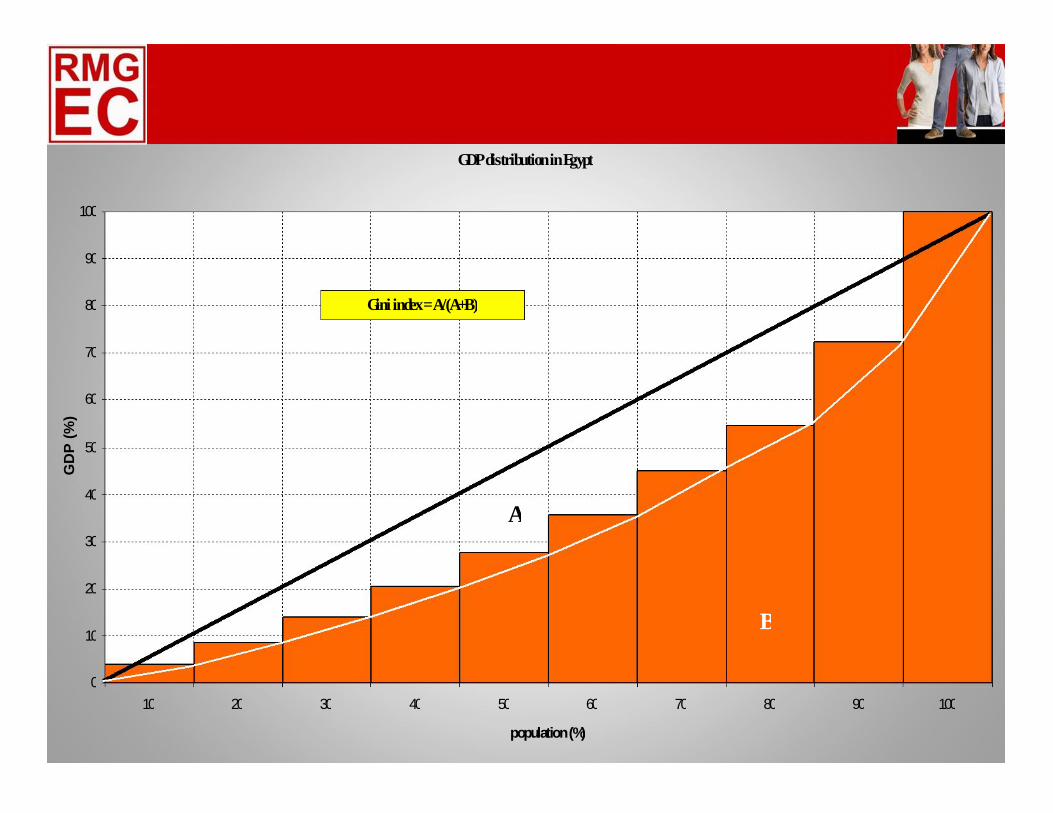
GDP distribution in Egypt
A
B
Gini index = A/(A+B)
0
10
20
30
40
50
60
70
80
90
100
10 20 30 40 50 60 70 80 90 100
population (%)
GD
P (%
)
From the previous graph and in absolute value :
The GDP per capita of the poorest 10% Egyptian
persons is = 2,085 $
The GDP per capita of the richest 10% Egyptian
person is = 14,754 $
(using purchasing power parity)
•
•
§
§
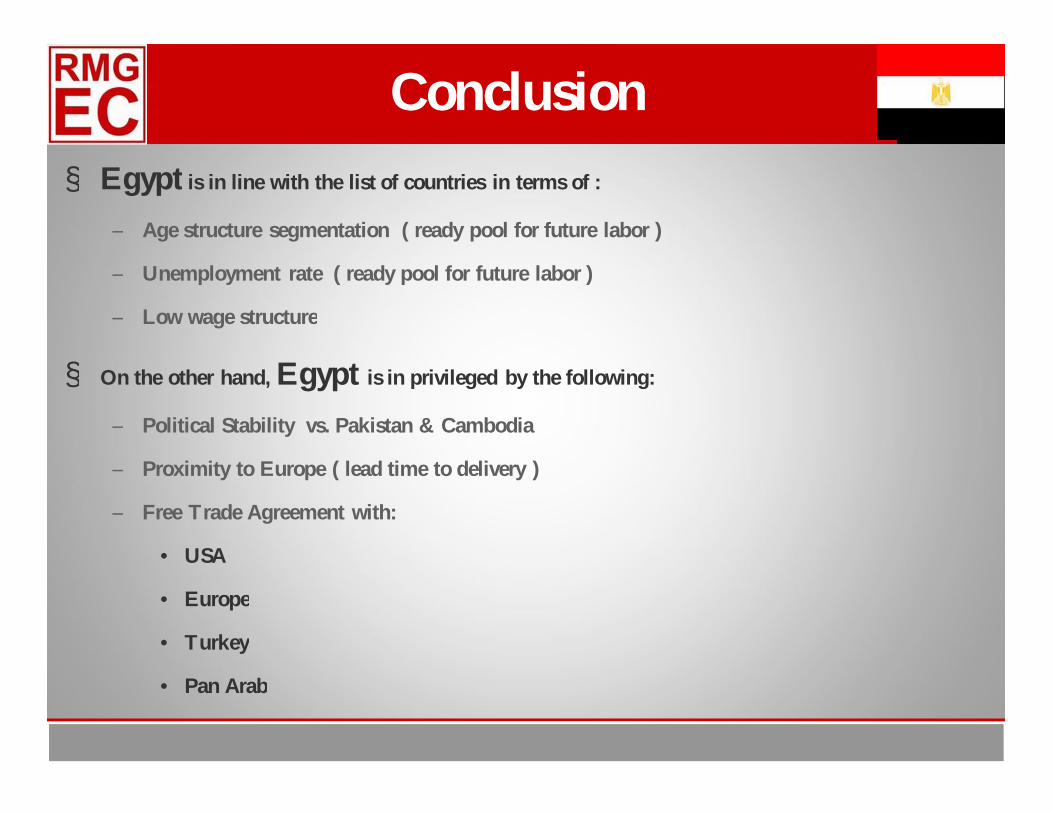
Egypt is in line with the list of countries in terms of :
Age structure segmentation ( ready pool for future labor )
Unemployment rate ( ready pool for future labor )
Low wage structure
On the other hand, Egypt is in privileged by the following:
Political Stability vs. Pakistan & Cambodia
Proximity to Europe ( lead time to delivery )
Free Trade Agreement with:
USA
Europe
Turkey
Pan Arab
Conclusion
–
–
–
–
–
–
•
•
•
•
–
–
–
–
–
Supplier Council Presentations
http://web.worldbank.org/WBSITE/EXTERNAL/COUNTRIES/MENAEXT/EGYPTEXTN
/0,,menuPK:287166~pagePK:141132~piPK:141107~theSitePK:256307,00.html
http://www.businessweek.com/news/2010-08-16/china-gdp-surpasses-japan-capping-three-
decade-rise.html
https://www.cia.gov/library/publications/the-world-factbook/
https://www.cia.gov/
Sources
Thank you


