THE STORY OF TWO COMPANIES’ INTEGRATION
Telia Lietuva Group results for the year 2016
(approved by AGM)

Teo acquired a 100%
stake in Omnitel and
started integration of
two companies
2016
JANUARY
4
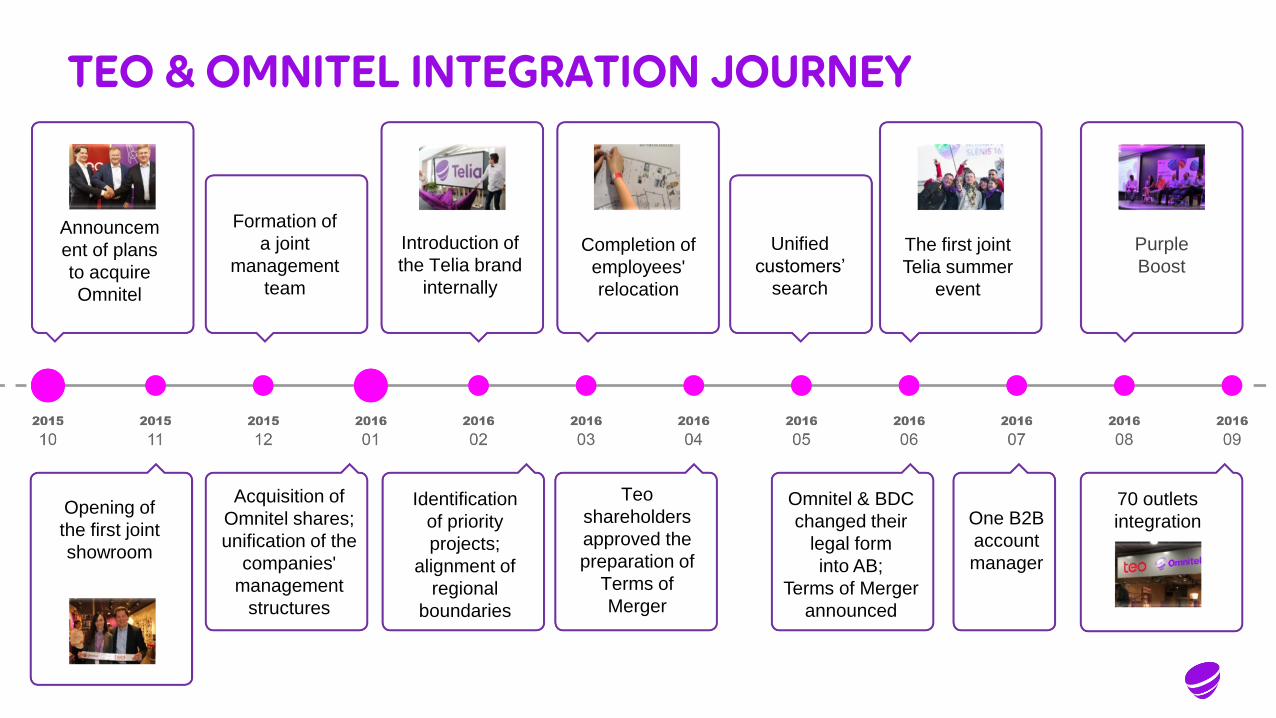
TEO & OMNITEL INTEGRATION JOURNEY
Announcem
ent of plans
to acquire
Omnitel
Formation of
a joint
management
team
70 outlets
integration
Completion of
employees'
relocation
Identification
of priority
projects;
alignment of
regional
boundaries
Opening of
the first joint
showroom
Acquisition of
Omnitel shares;
unification of the
companies'
management
structures
Introduction of
the Telia brand
internally
One B2B
account
manager
Teo
shareholders
approved the
preparation of
Terms of
Merger
Omnitel & BDC
changed their
legal form
into AB;
Terms of Merger
announced
Unified
customers’
search
The first joint
Telia summer
event
Purple
Boost
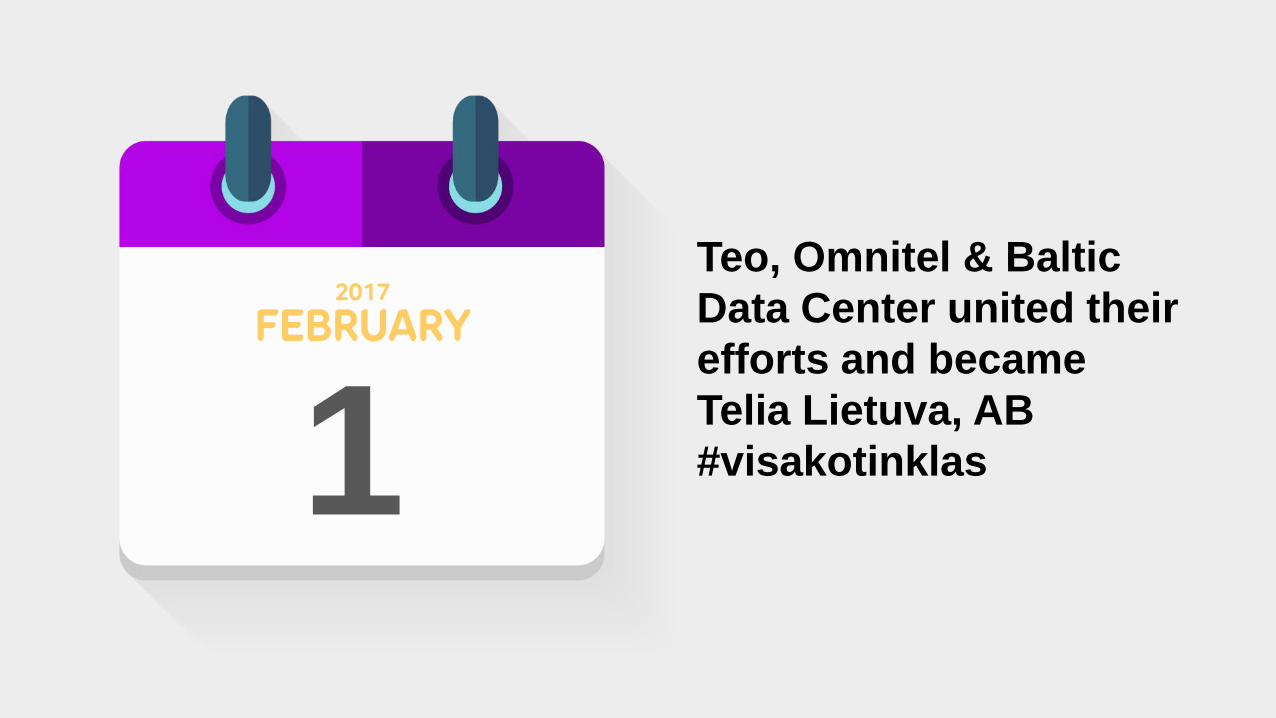
Teo, Omnitel & Baltic
Data Center united their
efforts and became
Telia Lietuva, AB
#visakotinklas
2017
FEBRUARY
1
TELIA LIETUVA PROVIDES TELECOMMUNICATION, IT & TV SERVICES IN LITHUANIA FROM A SINGLE POINT
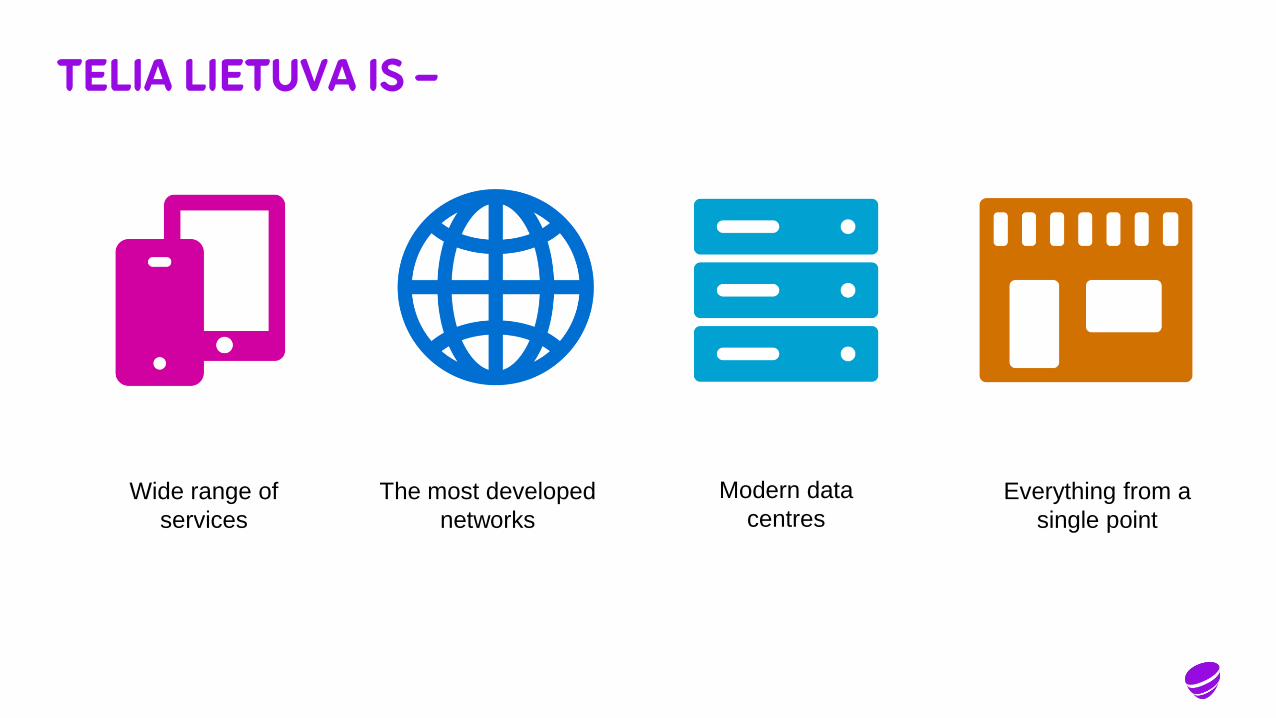
TELIA LIETUVA IS –
Wide range of
services
The most developed
networks
Modern data
centresEverything from a
single point
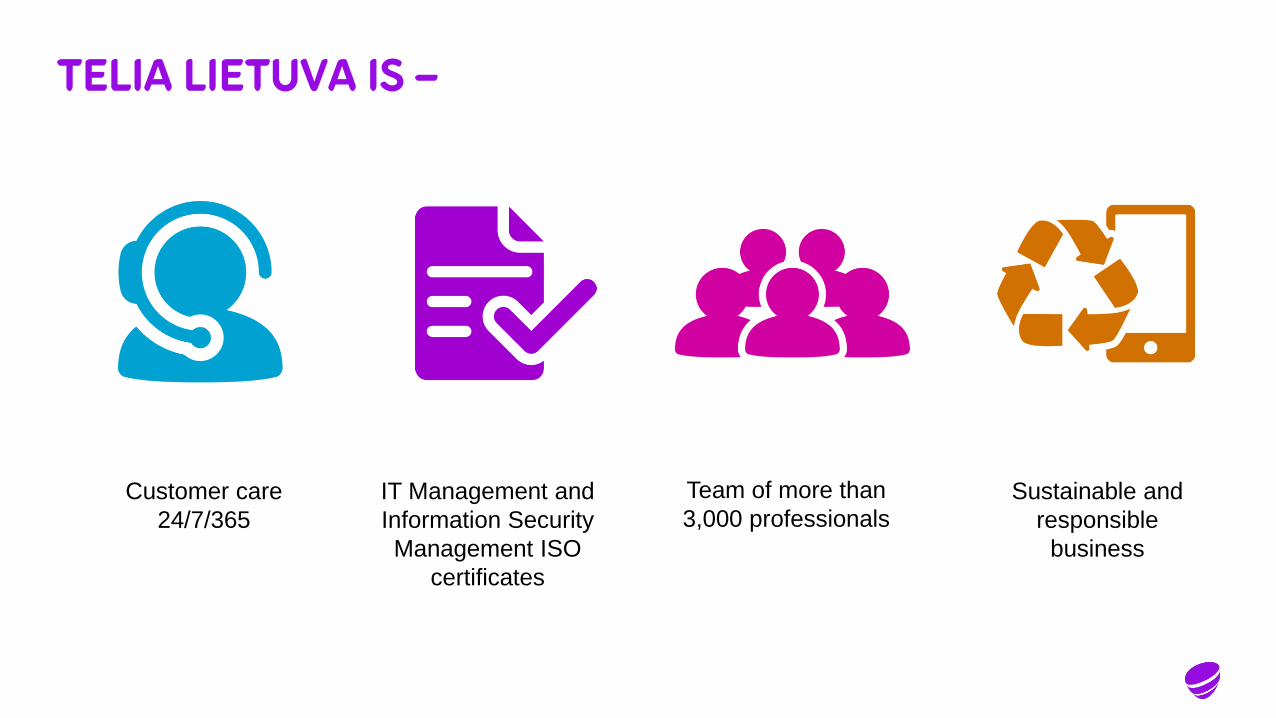
TELIA LIETUVA IS –
Customer care
24/7/365
IT Management and
Information Security
Management ISO
certificates
Team of more than
3,000 professionalsSustainable and
responsible
business
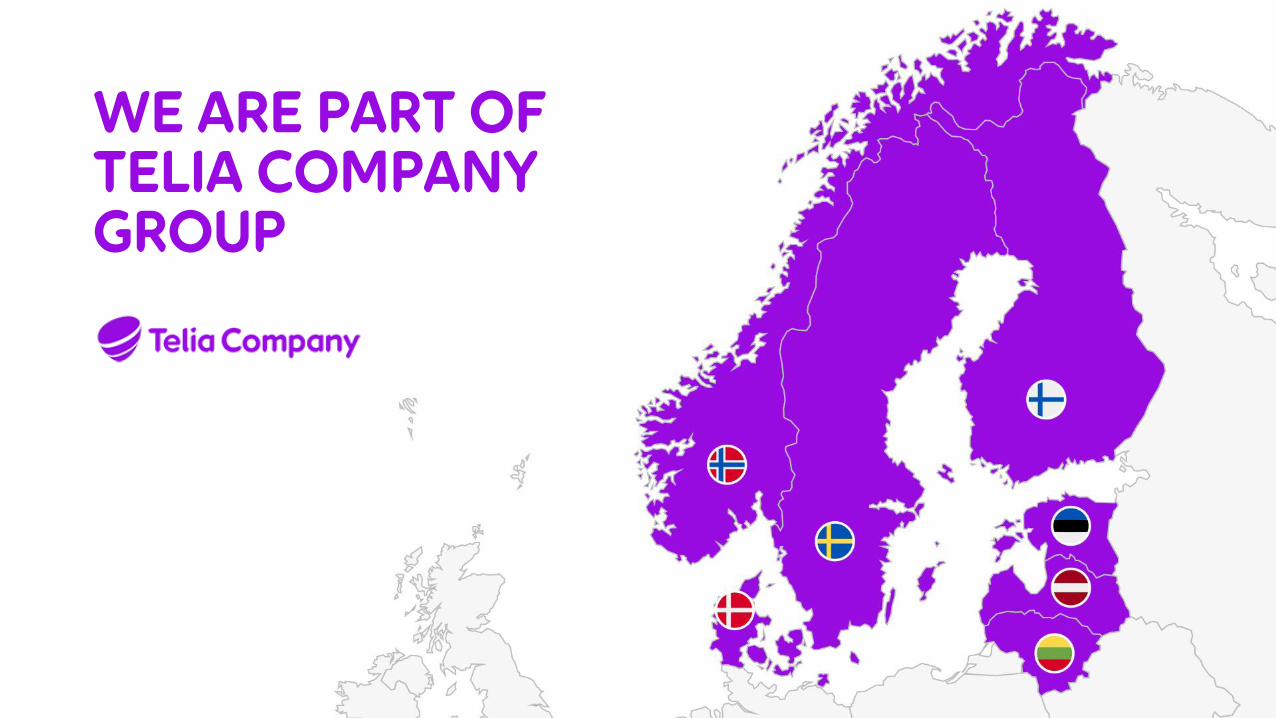
WE ARE PART OF TELIA COMPANYGROUP

OUR PURPOSE: BRINGING THE WORLD CLOSER –ON THE CUSTOMER’S TERMS
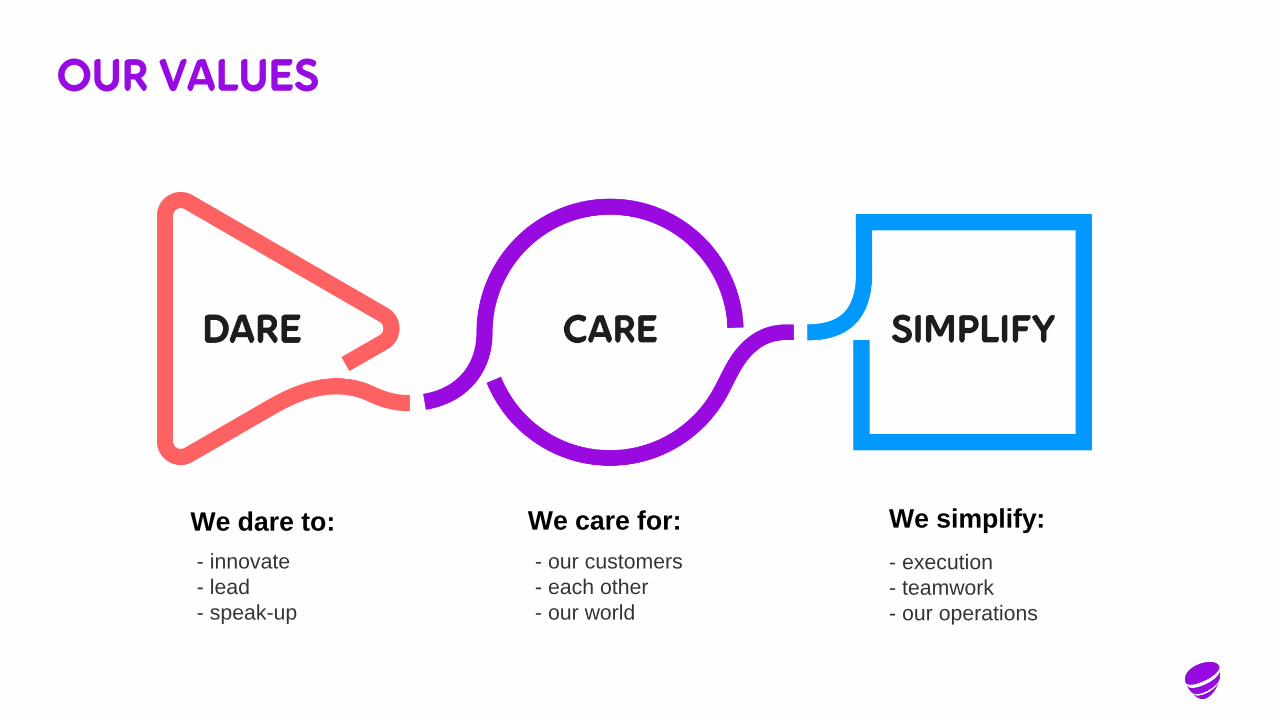
OUR VALUES
We dare to: We care for: We simplify:
- innovate
- lead
- speak-up
- our customers
- each other
- our world
- execution
- teamwork
- our operations
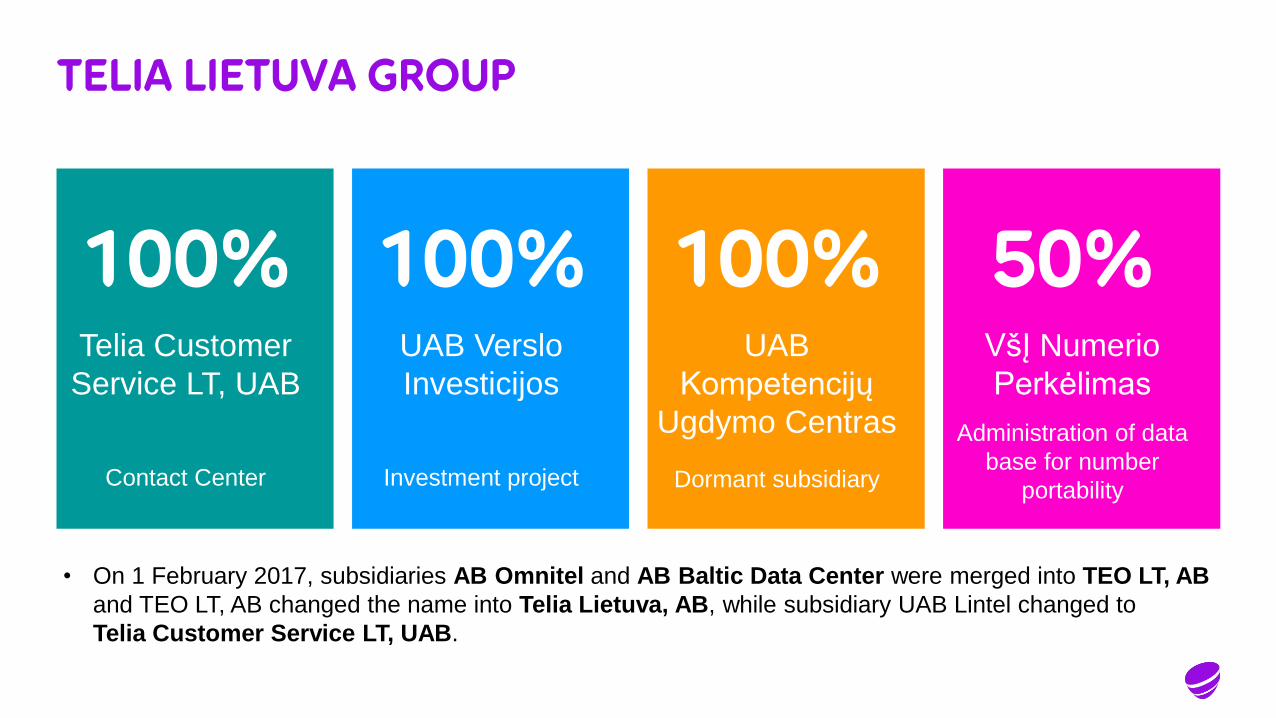
TELIA LIETUVA GROUP
100%Telia Customer
Service LT, UAB
Contact Center
100%UAB Verslo
Investicijos
Investment project
100%UAB
Kompetencijų
Ugdymo Centras
Dormant subsidiary
50%VšĮ Numerio
Perkėlimas
Administration of data
base for number
portability
• On 1 February 2017, subsidiaries AB Omnitel and AB Baltic Data Center were merged into TEO LT, AB
and TEO LT, AB changed the name into Telia Lietuva, AB, while subsidiary UAB Lintel changed to
Telia Customer Service LT, UAB.
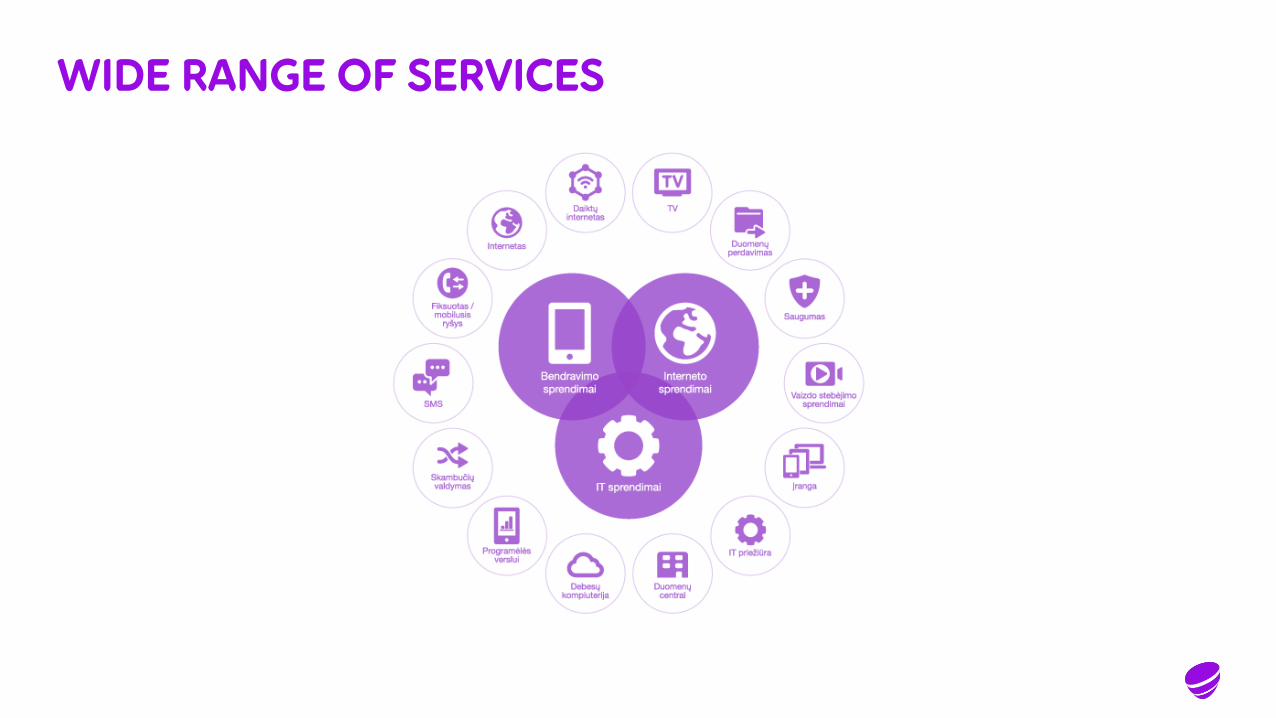
WIDE RANGE OF SERVICES
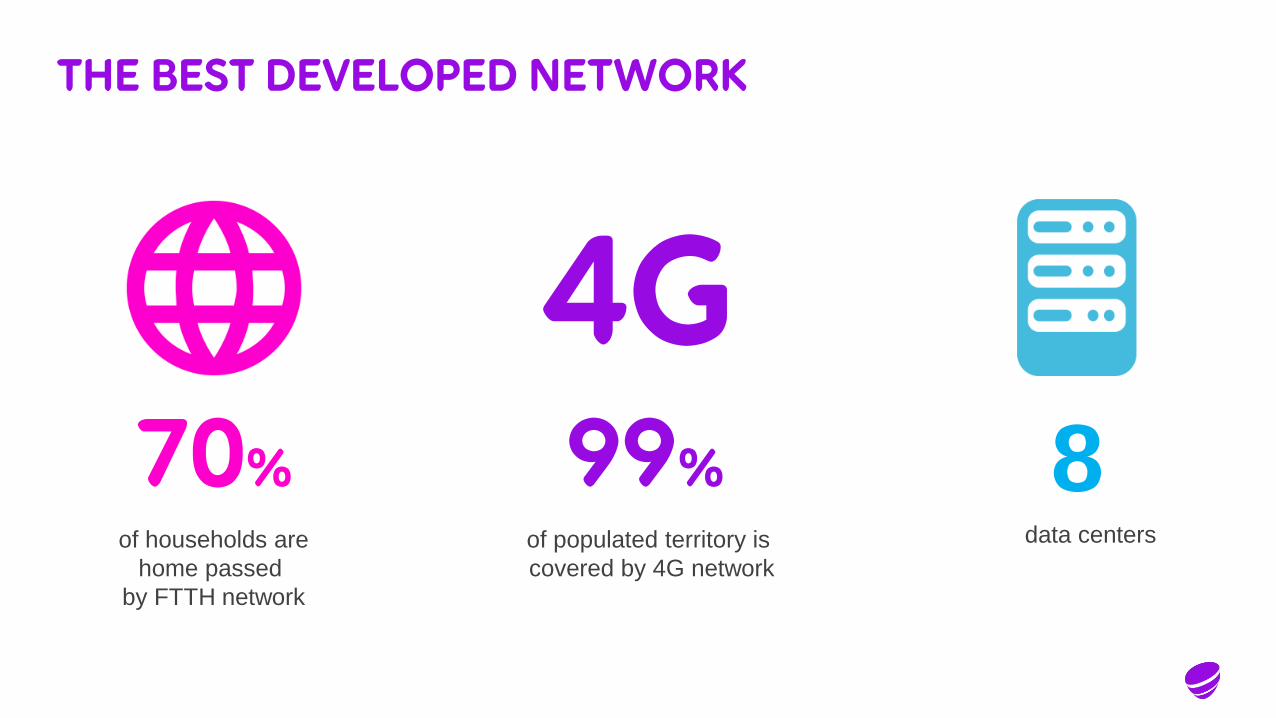
THE BEST DEVELOPED NETWORK
70%of households are
home passed
by FTTH network
8data centers
99%of populated territory is
covered by 4G network
4G
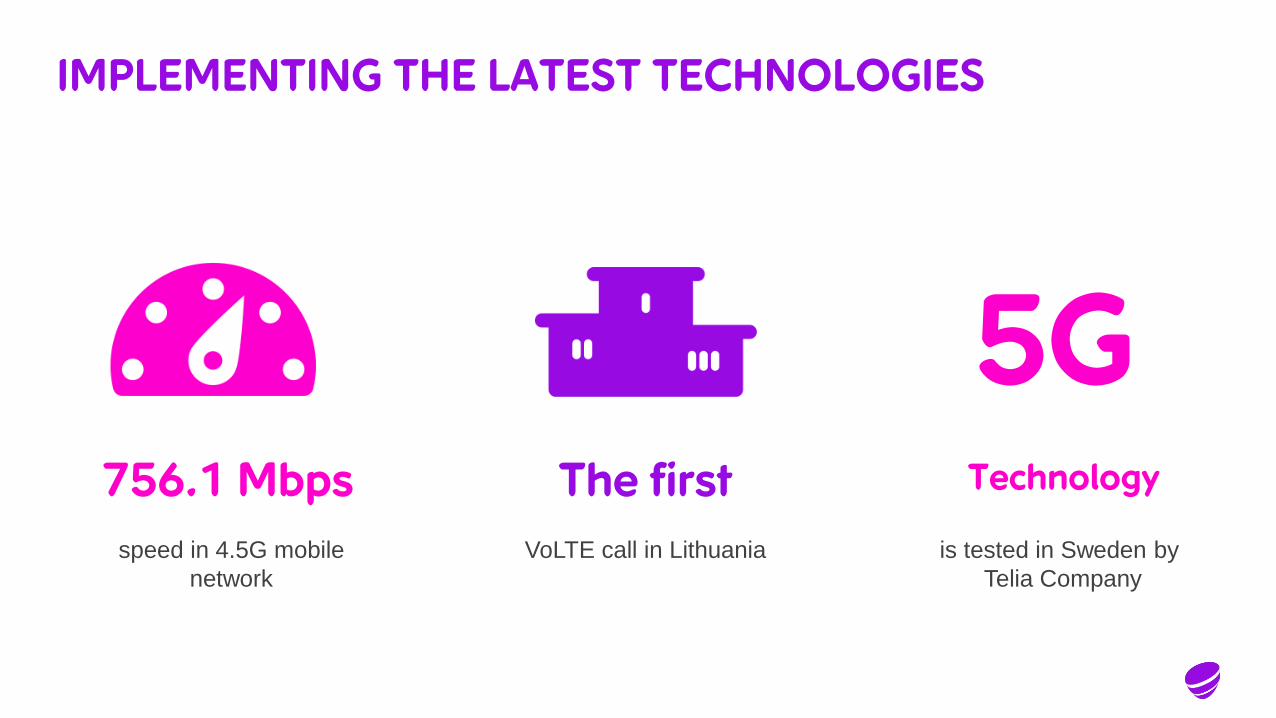
IMPLEMENTING THE LATEST TECHNOLOGIES
756.1 Mbps
speed in 4.5G mobile
network
The first
VoLTE call in Lithuania
Technology
is tested in Sweden by
Telia Company
5G
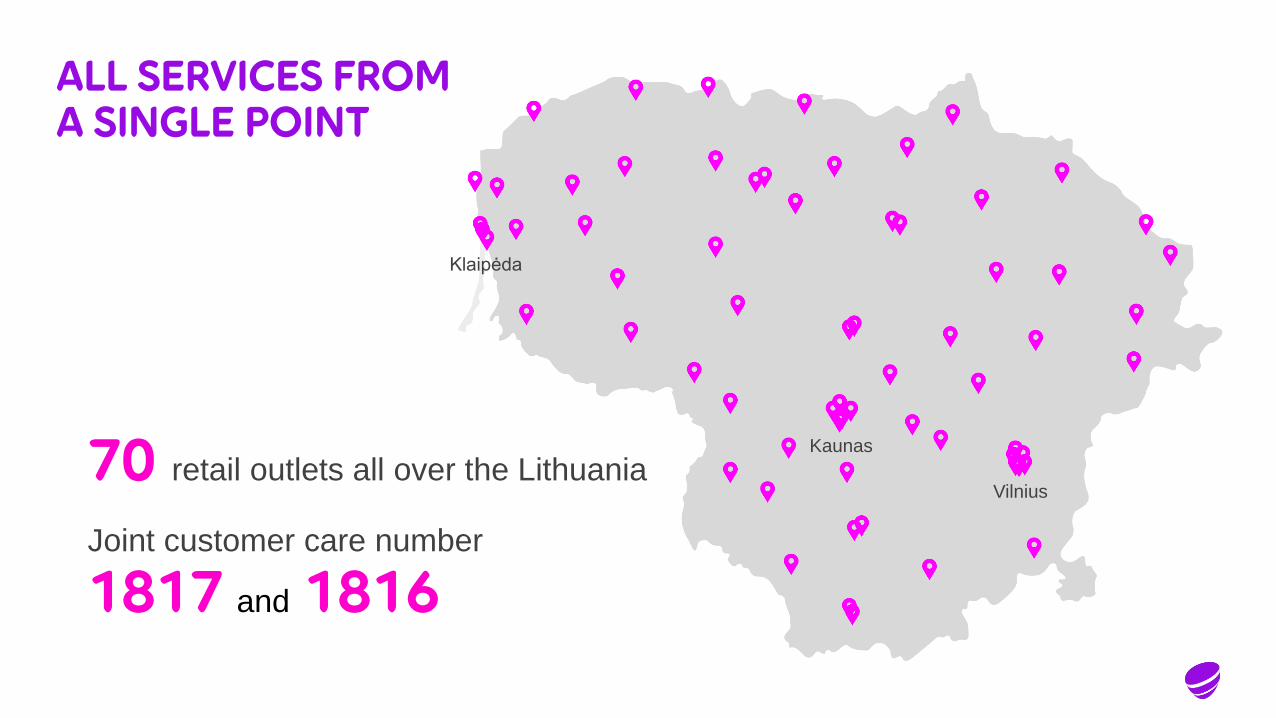
ALL SERVICES FROM A SINGLE POINT
70 retail outlets all over the Lithuania
Joint customer care number
1817 and 1816
Vilnius
Kaunas
Klaipėda
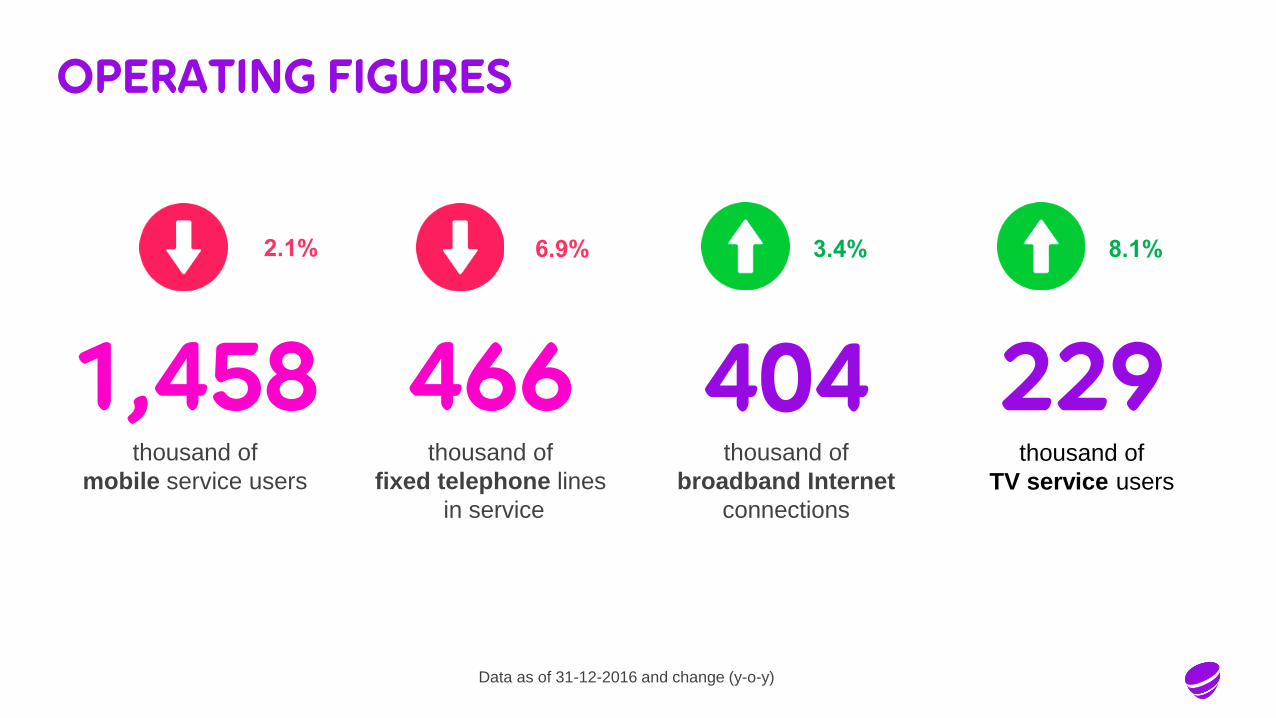
OPERATING FIGURES
Data as of 31-12-2016 and change (y-o-y)
1,458thousand of
mobile service users
2.1%
466thousand of
fixed telephone lines
in service
6.9%
404thousand of
broadband Internet
connections
3.4%
229thousand of
TV service users
8.1%
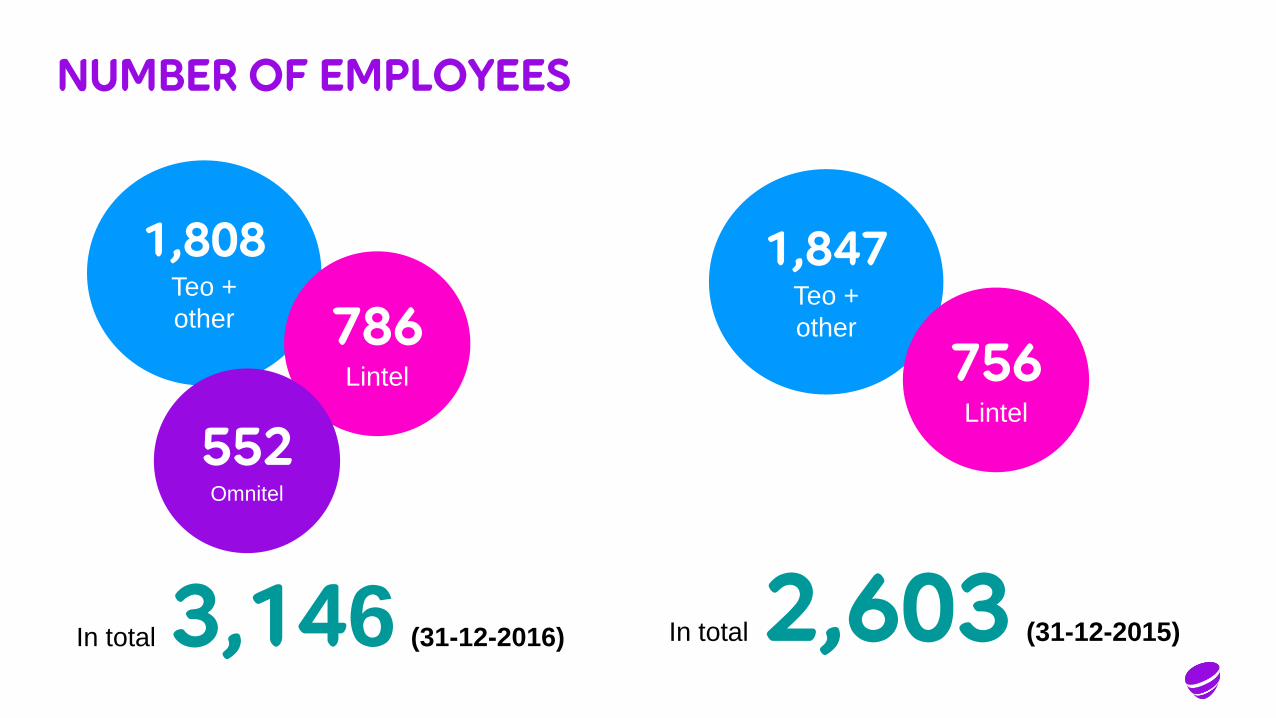
NUMBER OF EMPLOYEES
In total 3,146 (31-12-2016) In total 2,603 (31-12-2015)
1,808Teo +
other
1,847Teo +
other786Lintel 756
Lintel
552Omnitel
ELECTRONIC COMMUNICATIONS MARKET OF LITHUANIA
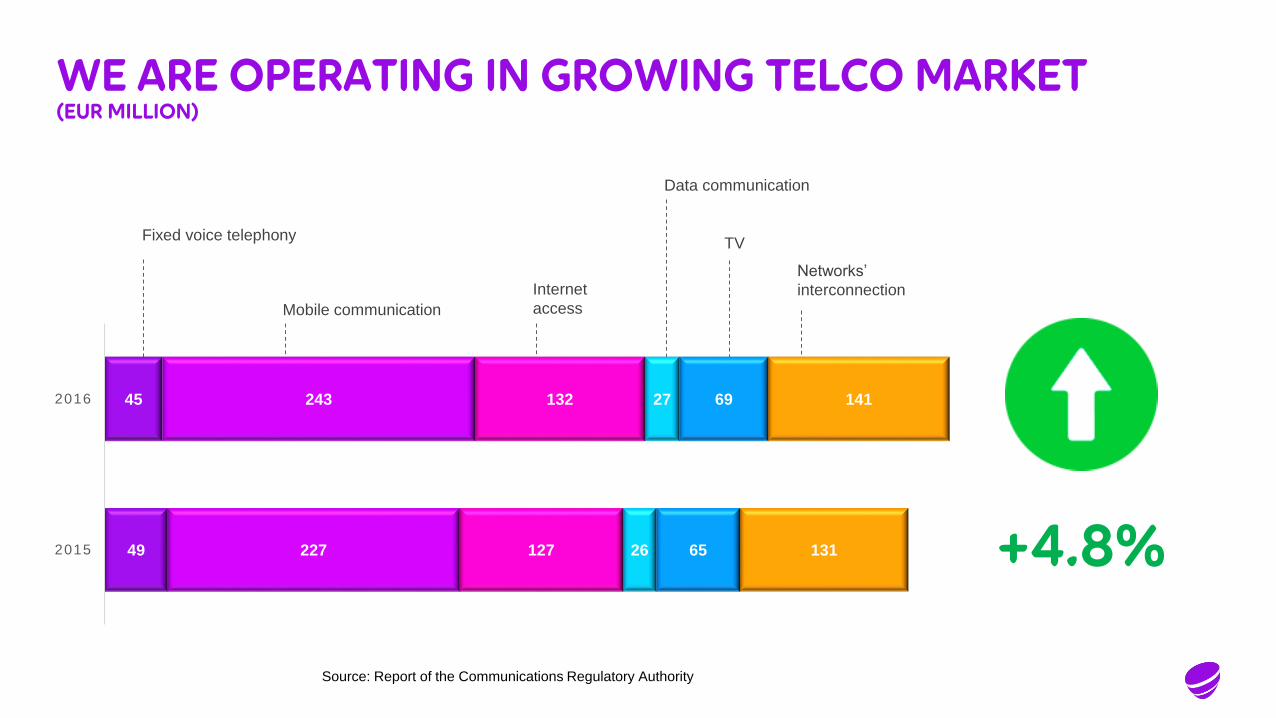
WE ARE OPERATING IN GROWING TELCO MARKET(EUR MILLION)
Networks’
interconnection
Mobile communication
Data communication
Internet
access
TVFixed voice telephony
+4.8%
Source: Report of the Communications Regulatory Authority
49
45
227
243
127
132
26
27
65
69
131
141
2015
2016
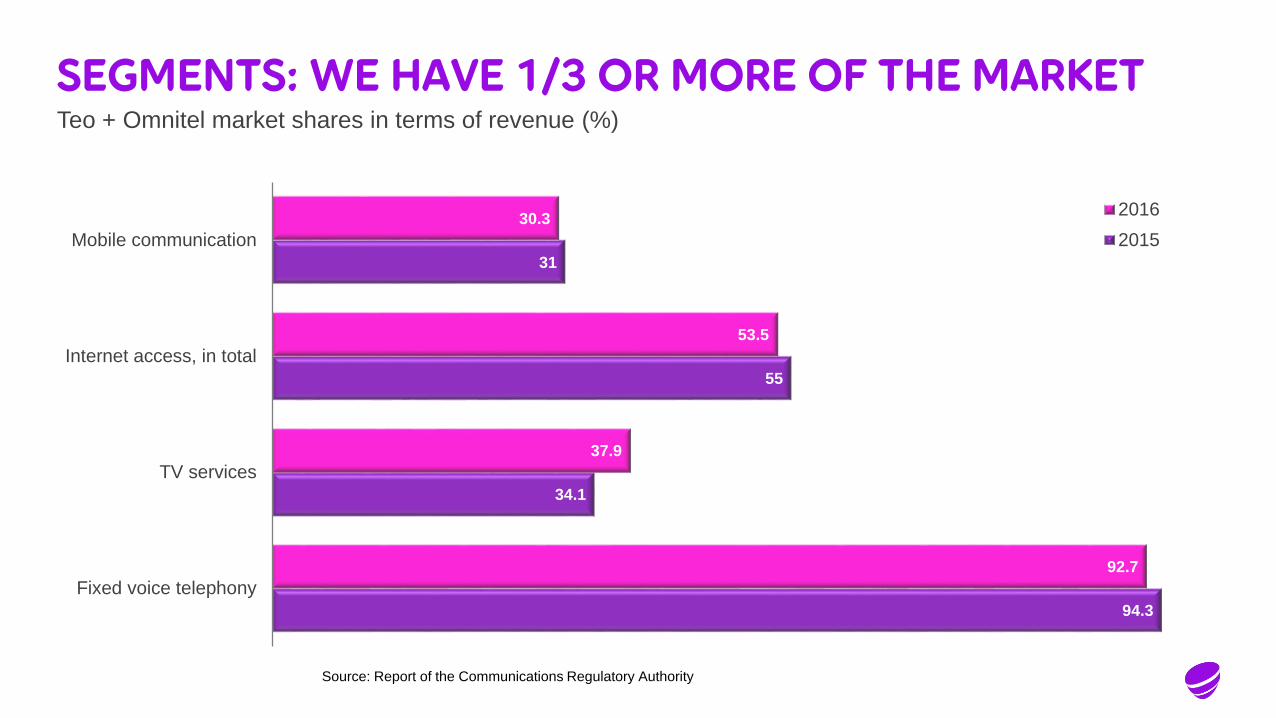
SEGMENTS: WE HAVE 1/3 OR MORE OF THE MARKETTeo + Omnitel market shares in terms of revenue (%)
94.3
34.1
55
31
92.7
37.9
53.5
30.3
Fixed voice telephony
TV services
Internet access, in total
Mobile communication
2016
2015
Source: Report of the Communications Regulatory Authority
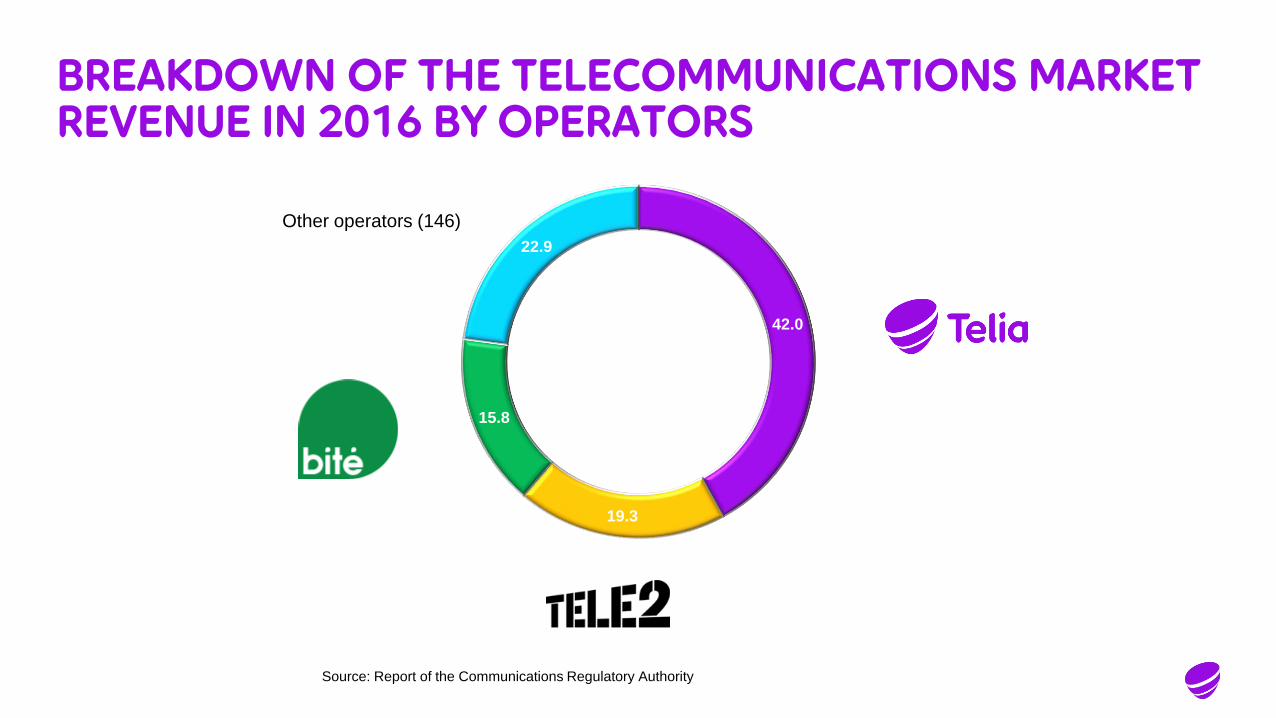
BREAKDOWN OF THE TELECOMMUNICATIONS MARKET REVENUE IN 2016 BY OPERATORS
42.0
19.3
15.8
22.9
Other operators (146)
Source: Report of the Communications Regulatory Authority
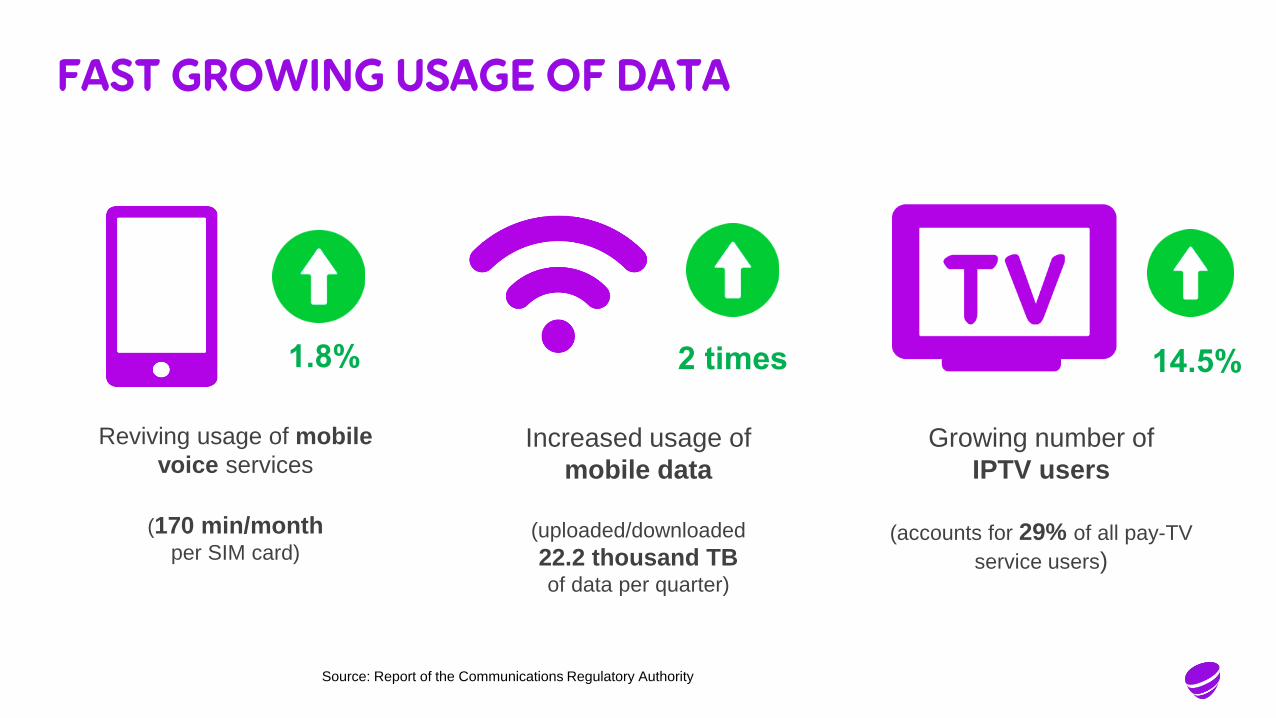
FAST GROWING USAGE OF DATA
Reviving usage of mobile
voice services
(170 min/monthper SIM card)
1.8%
Increased usage of
mobile data
(uploaded/downloaded
22.2 thousand TB of data per quarter)
2 times
Growing number of
IPTV users
(accounts for 29% of all pay-TV
service users)
14.5%
Source: Report of the Communications Regulatory Authority
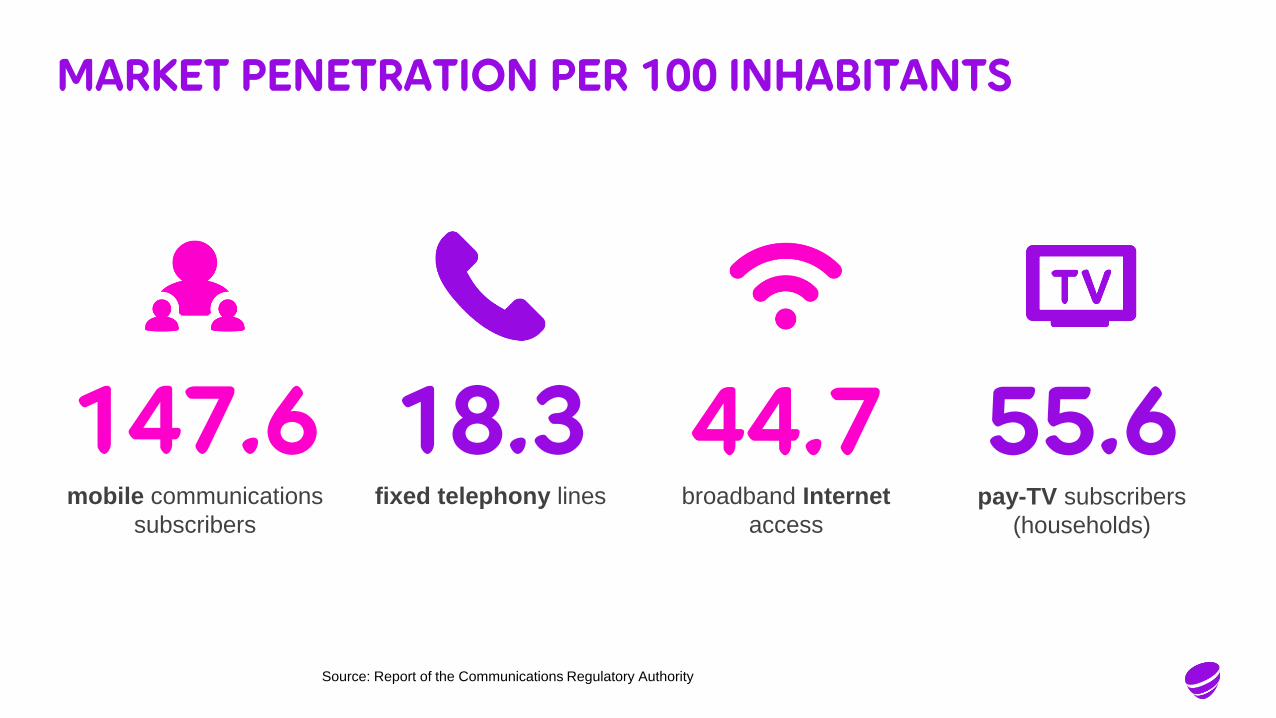
MARKET PENETRATION PER 100 INHABITANTS
147.6mobile communications
subscribers
18.3fixed telephony lines
44.7broadband Internet
access
55.6pay-TV subscribers
(households)
Source: Report of the Communications Regulatory Authority

OPERATING AND FINANCIAL RESULTS
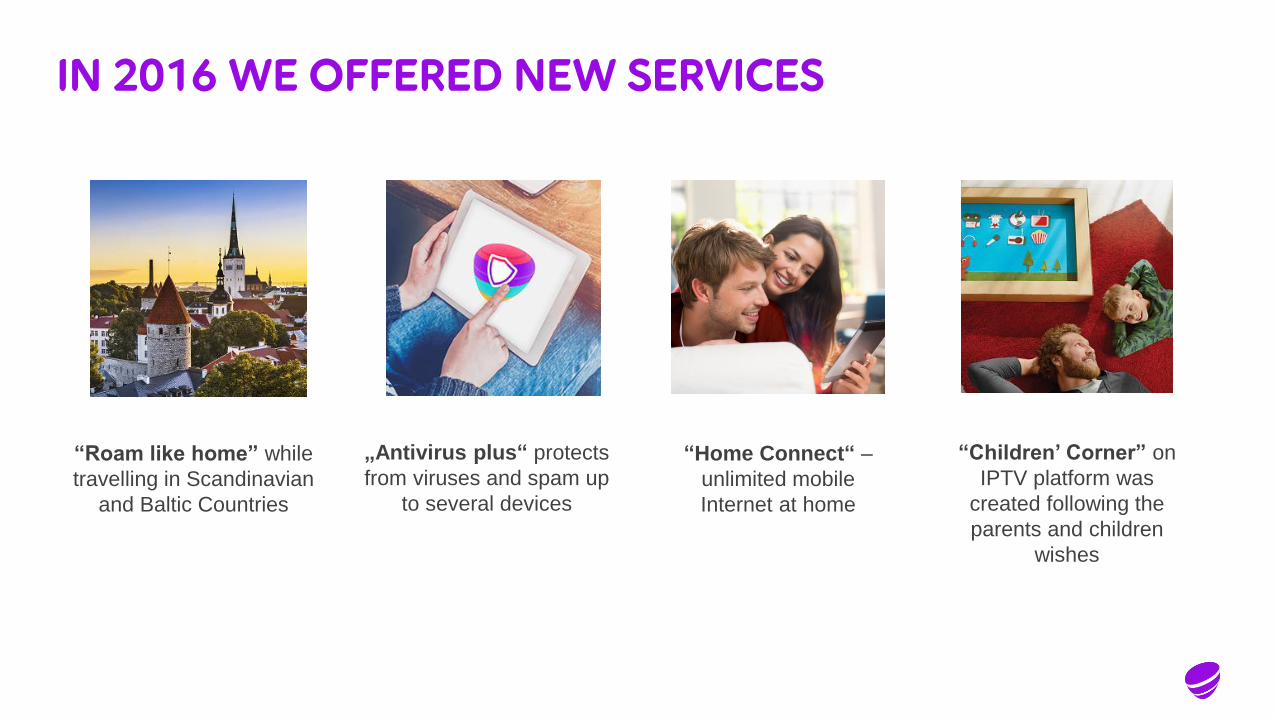
IN 2016 WE OFFERED NEW SERVICES
„Antivirus plus“ protects
from viruses and spam up
to several devices
“Home Connect“ –
unlimited mobile
Internet at home
“Roam like home” while
travelling in Scandinavian
and Baltic Countries
“Children’ Corner” on
IPTV platform was
created following the
parents and children
wishes
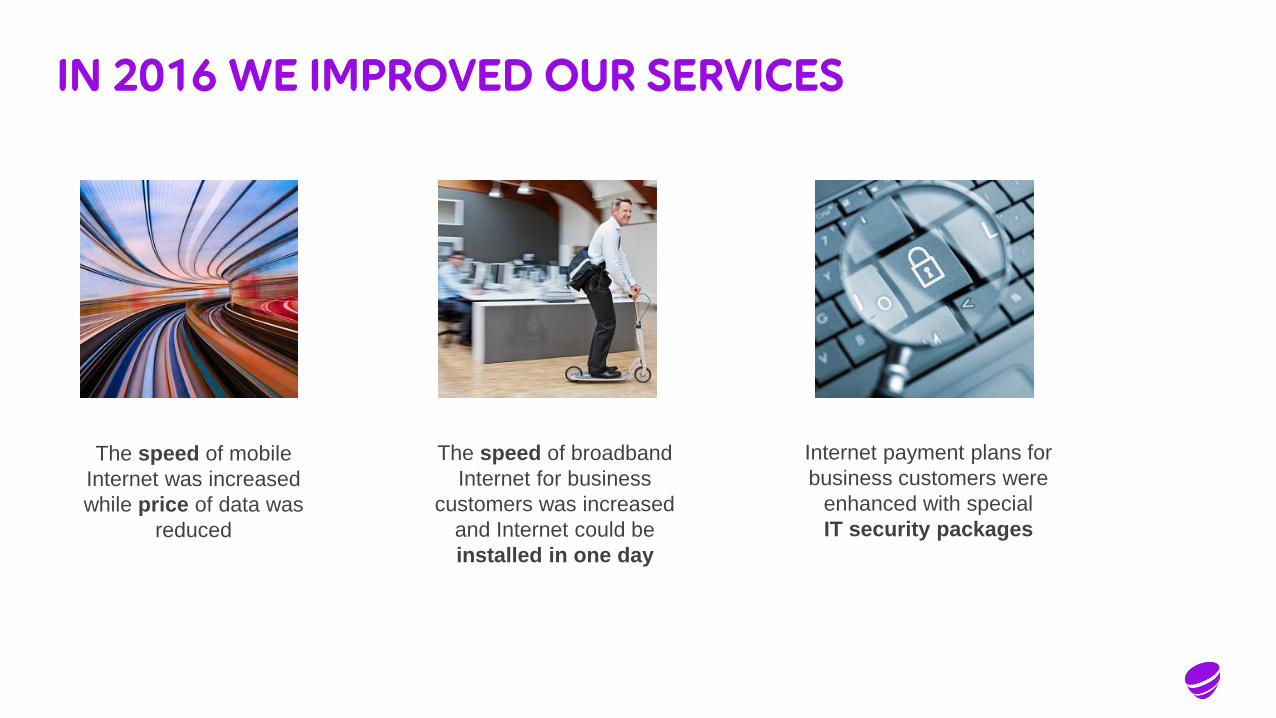
IN 2016 WE IMPROVED OUR SERVICES
Internet payment plans for
business customers were
enhanced with special
IT security packages
The speed of mobile
Internet was increased
while price of data was
reduced
The speed of broadband
Internet for business
customers was increased
and Internet could be
installed in one day
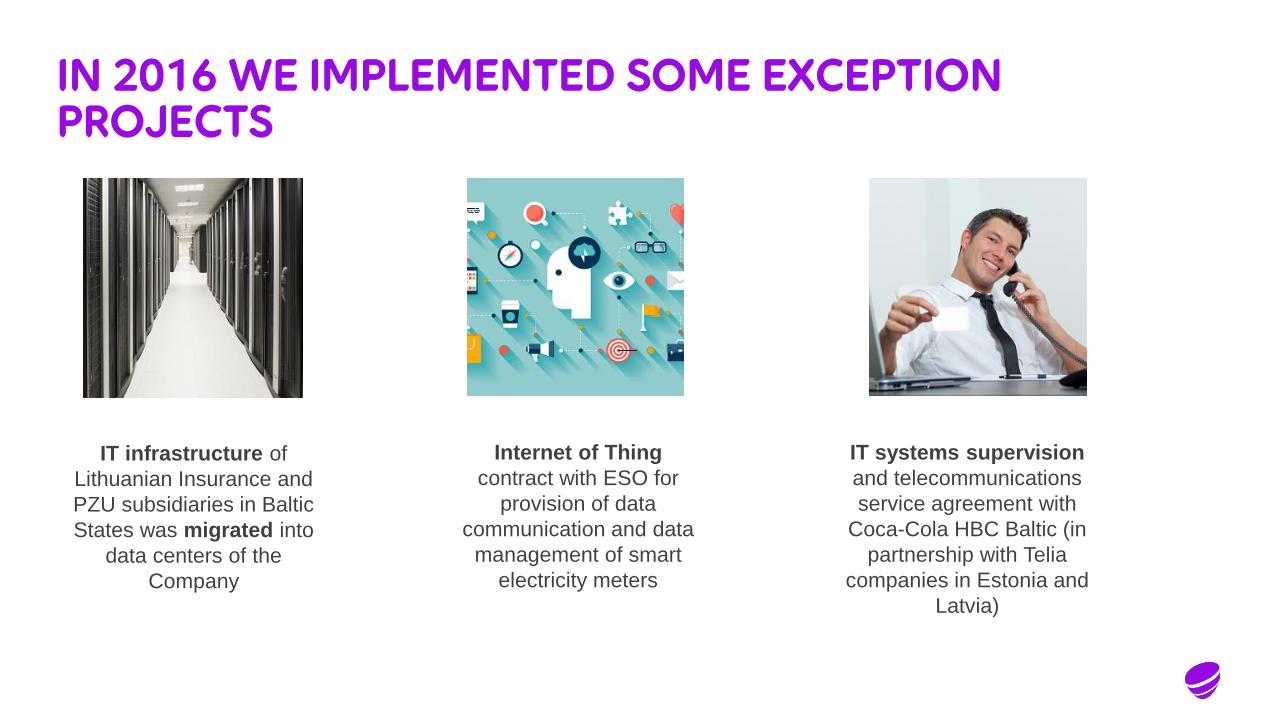
IN 2016 WE IMPLEMENTED SOME EXCEPTION PROJECTS
Internet of Thing
contract with ESO for
provision of data
communication and data
management of smart
electricity meters
IT infrastructure of
Lithuanian Insurance and
PZU subsidiaries in Baltic
States was migrated into
data centers of the
Company
IT systems supervision
and telecommunications
service agreement with
Coca-Cola HBC Baltic (in
partnership with Telia
companies in Estonia and
Latvia)
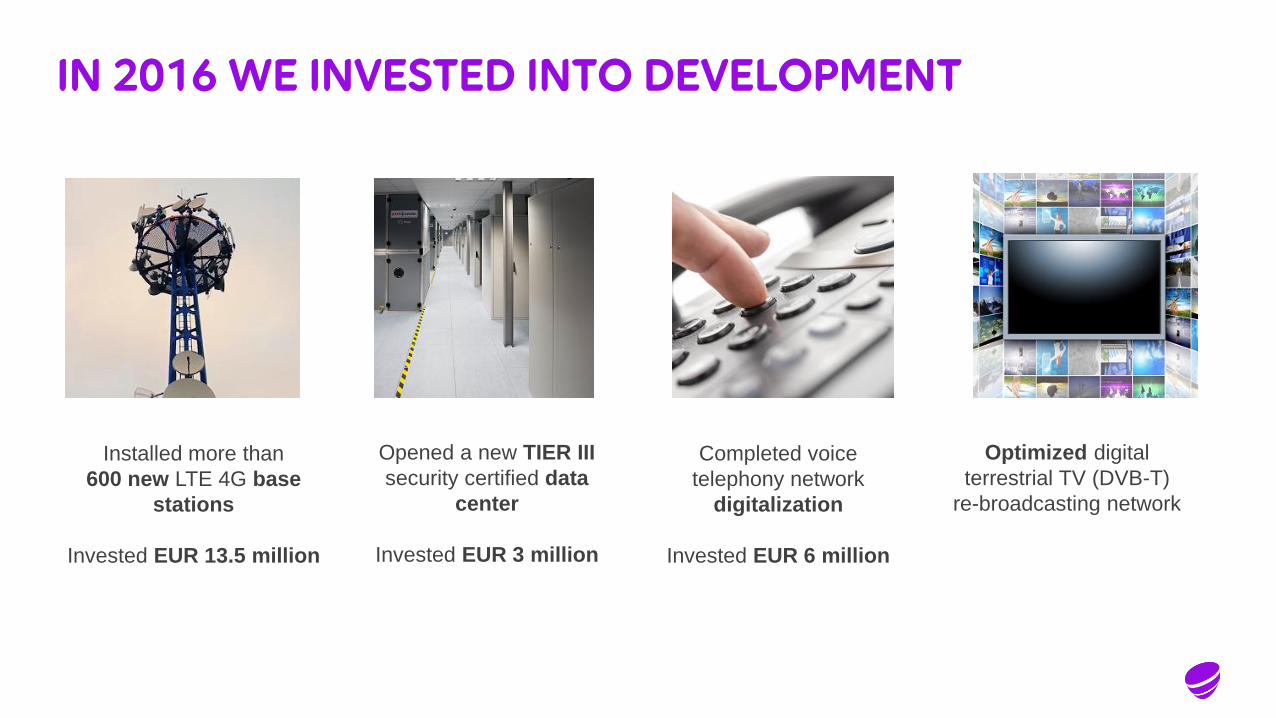
IN 2016 WE INVESTED INTO DEVELOPMENT
Opened a new TIER III
security certified data
center
Invested EUR 3 million
Completed voice
telephony network
digitalization
Invested EUR 6 million
Installed more than
600 new LTE 4G base
stations
Invested EUR 13.5 million
Optimized digital
terrestrial TV (DVB-T)
re-broadcasting network
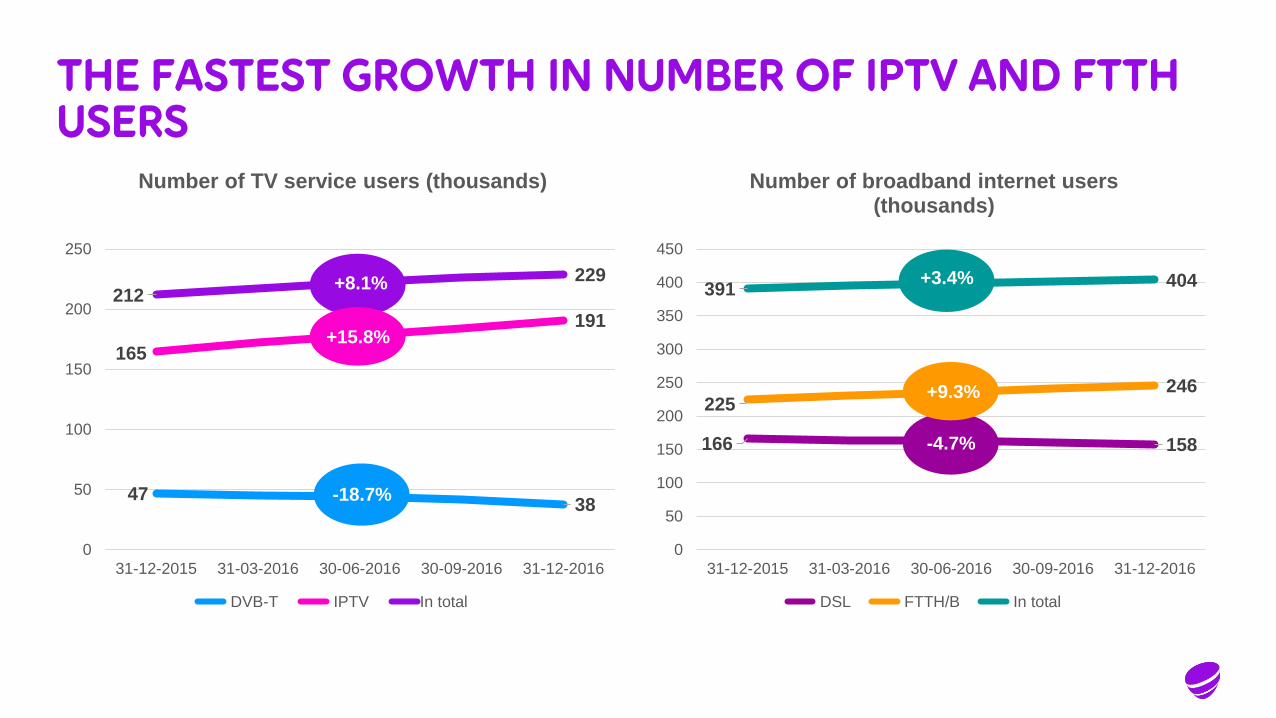
THE FASTEST GROWTH IN NUMBER OF IPTV AND FTTH USERS
4738
165
191
212229
0
50
100
150
200
250
31-12-2015 31-03-2016 30-06-2016 30-09-2016 31-12-2016
Number of TV service users (thousands)
DVB-T IPTV In total
-18.7%
+8.1%
+15.8%
166 158
225246
391 404
0
50
100
150
200
250
300
350
400
450
31-12-2015 31-03-2016 30-06-2016 30-09-2016 31-12-2016
Number of broadband internet users(thousands)
DSL FTTH/B In total
-4.7%
+3.4%
+9.3%
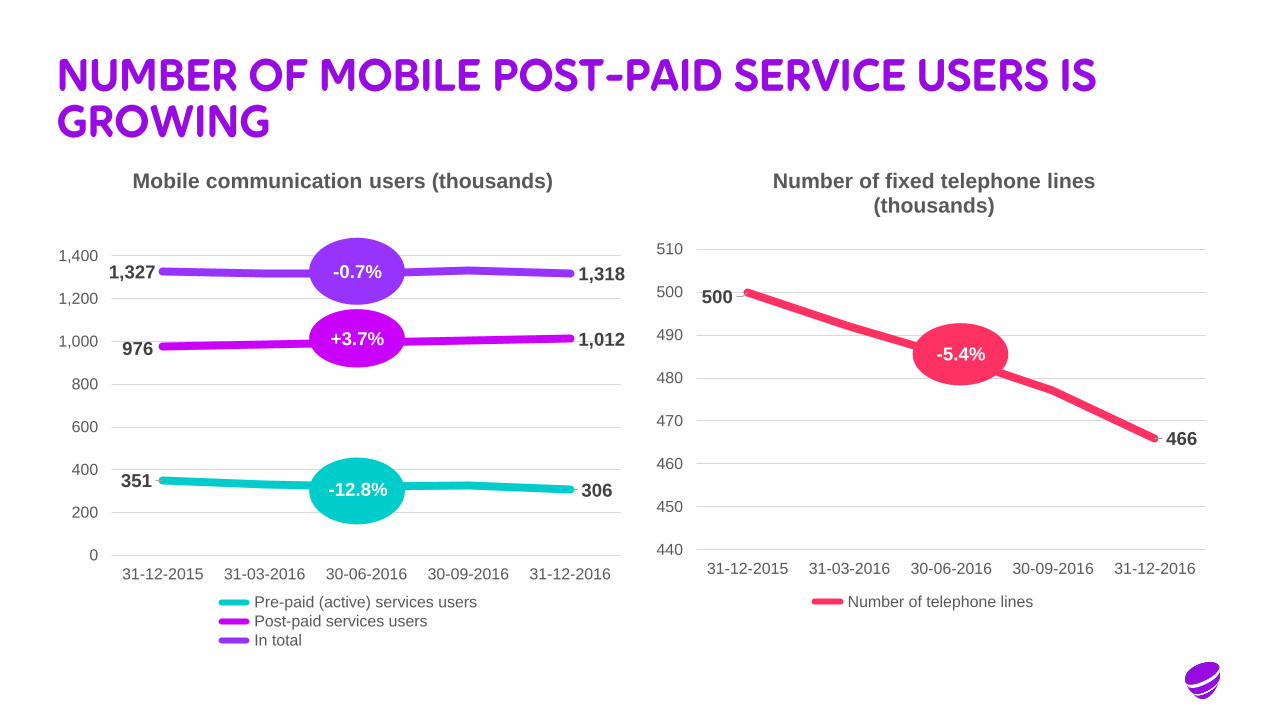
NUMBER OF MOBILE POST-PAID SERVICE USERS IS GROWING
351306
9761,012
1,327 1,318
0
200
400
600
800
1,000
1,200
1,400
31-12-2015 31-03-2016 30-06-2016 30-09-2016 31-12-2016
Mobile communication users (thousands)
Pre-paid (active) services users
Post-paid services users
In total
-12.8%
-0.7%
+3.7%
500
466
440
450
460
470
480
490
500
510
31-12-2015 31-03-2016 30-06-2016 30-09-2016 31-12-2016
Number of fixed telephone lines (thousands)
Number of telephone lines
-5.4%
+3,4 %
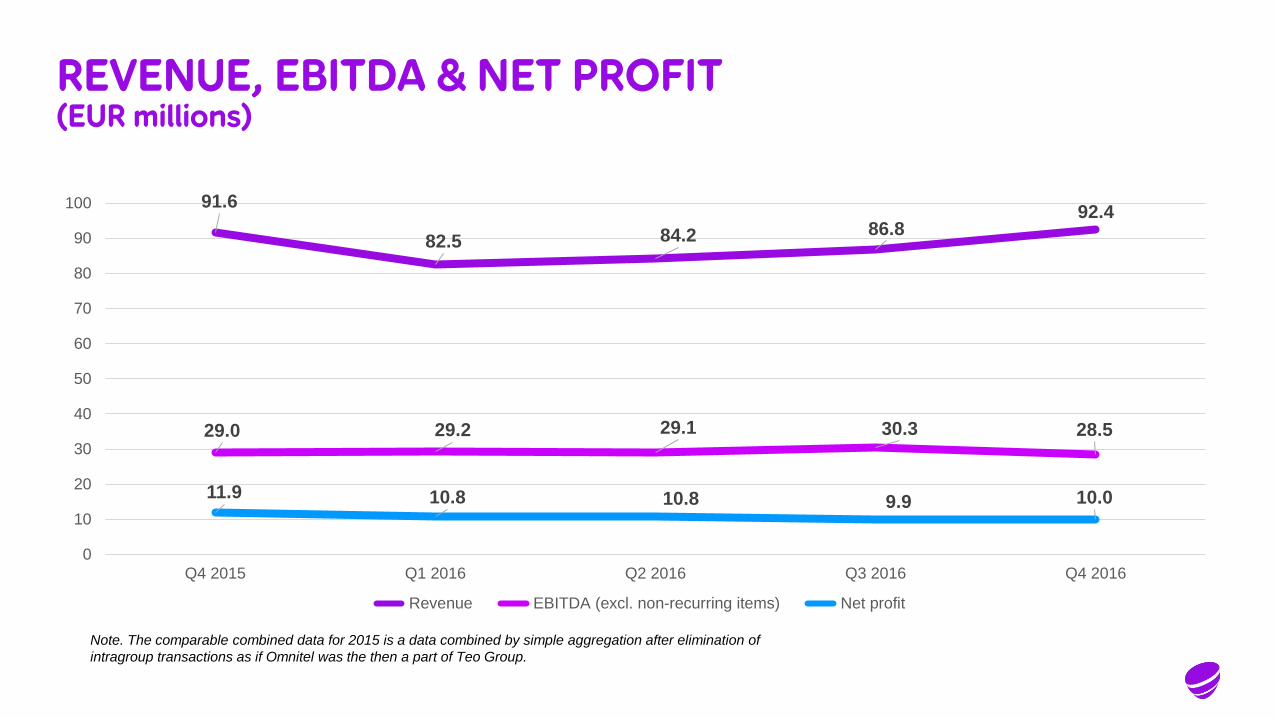
REVENUE, EBITDA & NET PROFIT(EUR millions)
91.6
82.5 84.2 86.892.4
29.0 29.2 29.1 30.3 28.5
11.9 10.8 10.8 9.9 10.0
0
10
20
30
40
50
60
70
80
90
100
Q4 2015 Q1 2016 Q2 2016 Q3 2016 Q4 2016
Revenue EBITDA (excl. non-recurring items) Net profit
Note. The comparable combined data for 2015 is a data combined by simple aggregation after elimination of
intragroup transactions as if Omnitel was the then a part of Teo Group.
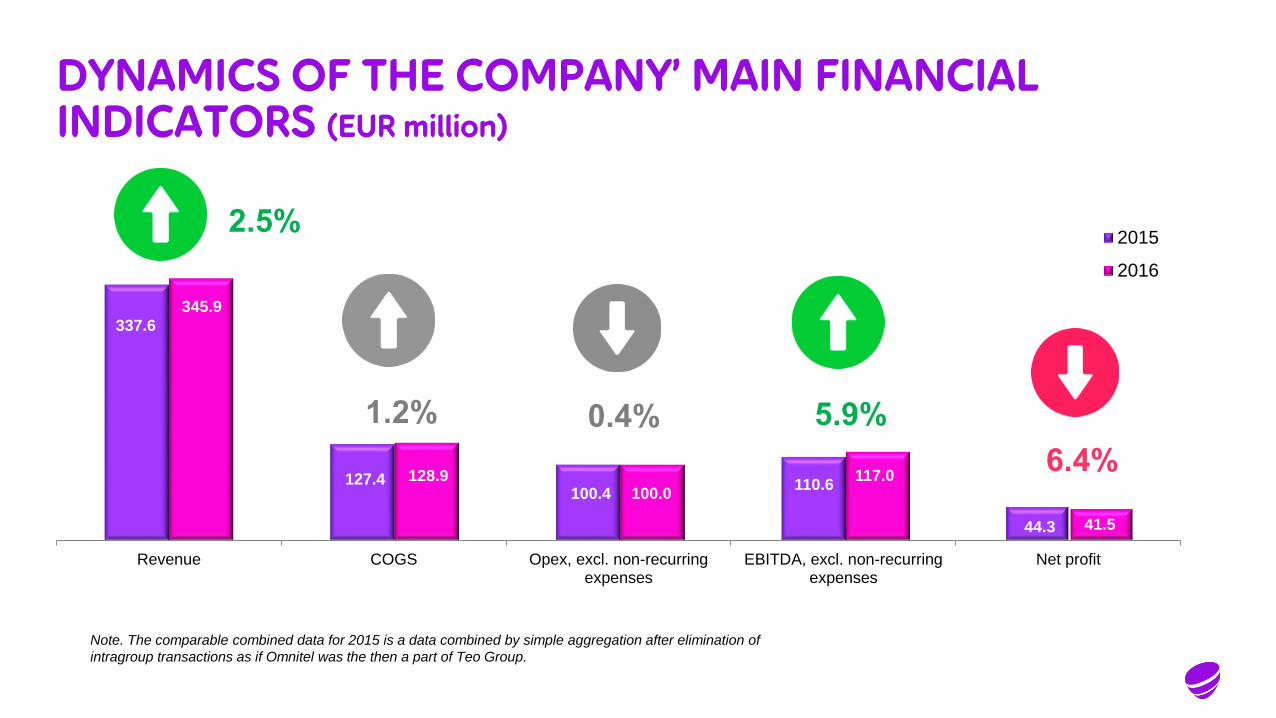
337.6
127.4100.4
110.6
44.3
345.9
128.9100.0
117.0
41.5
Revenue COGS Opex, excl. non-recurringexpenses
EBITDA, excl. non-recurringexpenses
Net profit
2015
2016
DYNAMICS OF THE COMPANY’ MAIN FINANCIAL INDICATORS (EUR million)
2.5%
1.2% 0.4%
6.4%
5.9%
Note. The comparable combined data for 2015 is a data combined by simple aggregation after elimination of
intragroup transactions as if Omnitel was the then a part of Teo Group.

2016 REVENUE BREAKDOWN
14% 14%
57% B2C16.3% Equipment sales
29.2% Mobile services
54.5% Broadband
services
42 % B2B
1% Other
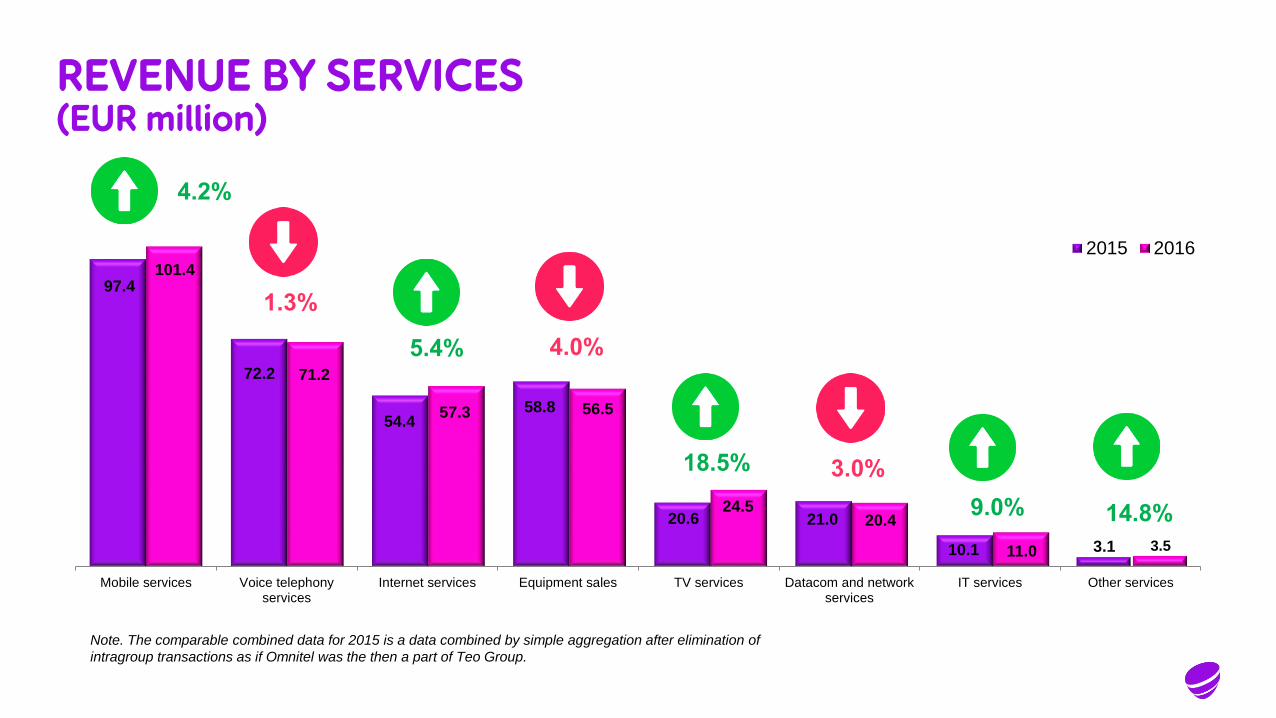
REVENUE BY SERVICES(EUR million)
97.4
72.2
54.458.8
20.6 21.0
10.1 3.1
101.4
71.2
57.3 56.5
24.520.4
11.0 3.5
Mobile services Voice telephonyservices
Internet services Equipment sales TV services Datacom and networkservices
IT services Other services
2015 2016
4.2%
5.4%
18.5%
9.0% 14.8%
1.3%
4.0%
3.0%
Note. The comparable combined data for 2015 is a data combined by simple aggregation after elimination of
intragroup transactions as if Omnitel was the then a part of Teo Group.
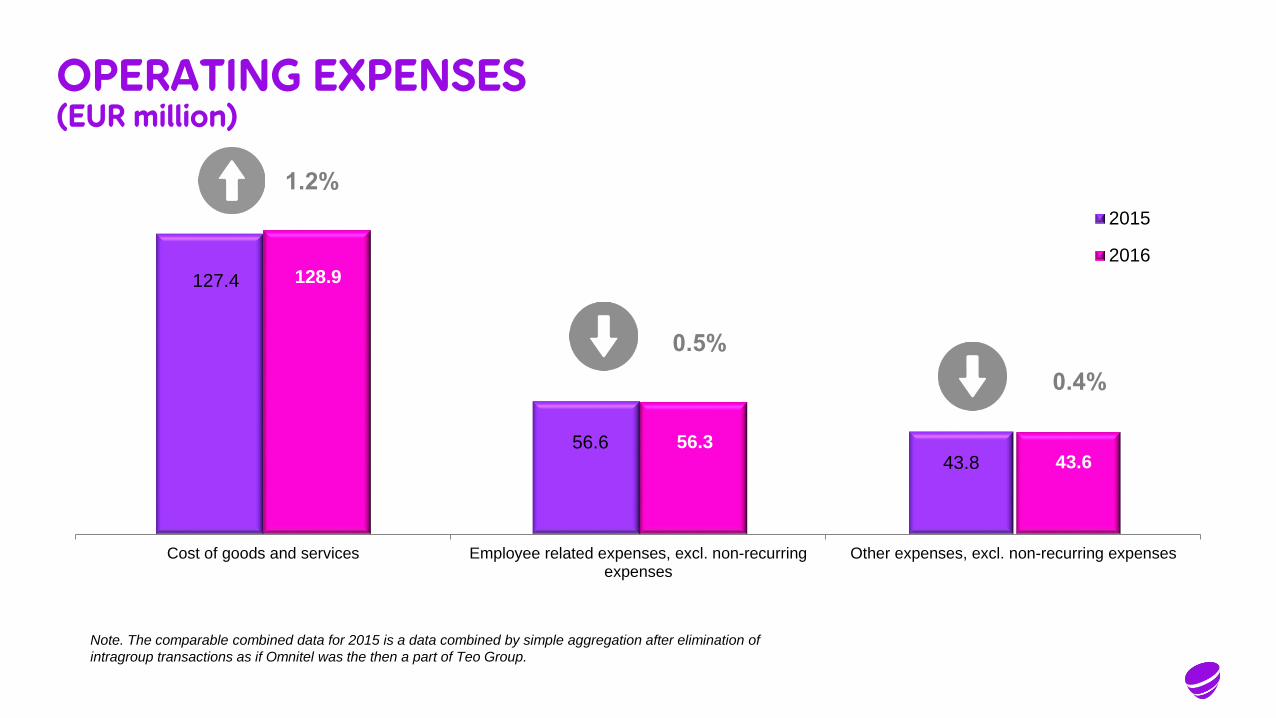
OPERATING EXPENSES(EUR million)
127.4
56.643.8
128.9
56.343.6
Cost of goods and services Employee related expenses, excl. non-recurringexpenses
Other expenses, excl. non-recurring expenses
2015
2016
1.2%
0.5%
0.4%
Note. The comparable combined data for 2015 is a data combined by simple aggregation after elimination of
intragroup transactions as if Omnitel was the then a part of Teo Group.
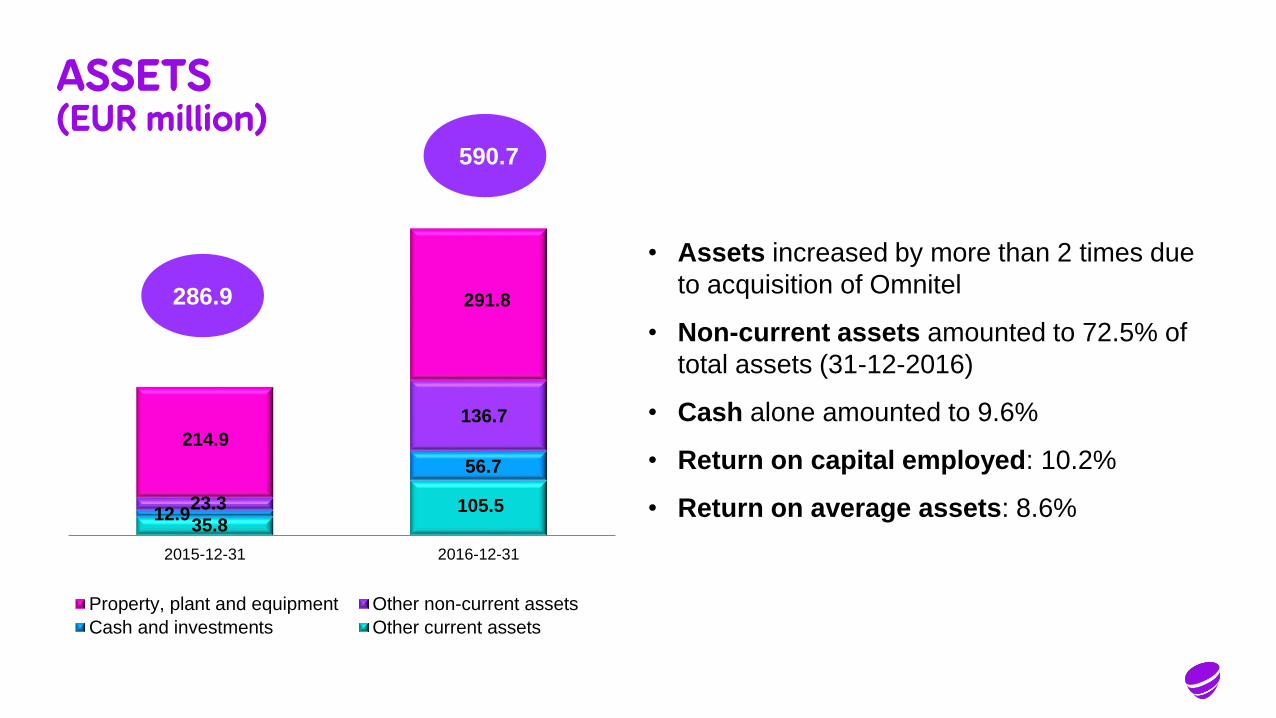
ASSETS(EUR million)
• Assets increased by more than 2 times due
to acquisition of Omnitel
• Non-current assets amounted to 72.5% of
total assets (31-12-2016)
• Cash alone amounted to 9.6%
• Return on capital employed: 10.2%
• Return on average assets: 8.6%35.8
105.512.9
56.7
23.3
136.7
214.9
291.8
2015-12-31 2016-12-31
Property, plant and equipment Other non-current assets
Cash and investments Other current assets
286.9
590.7
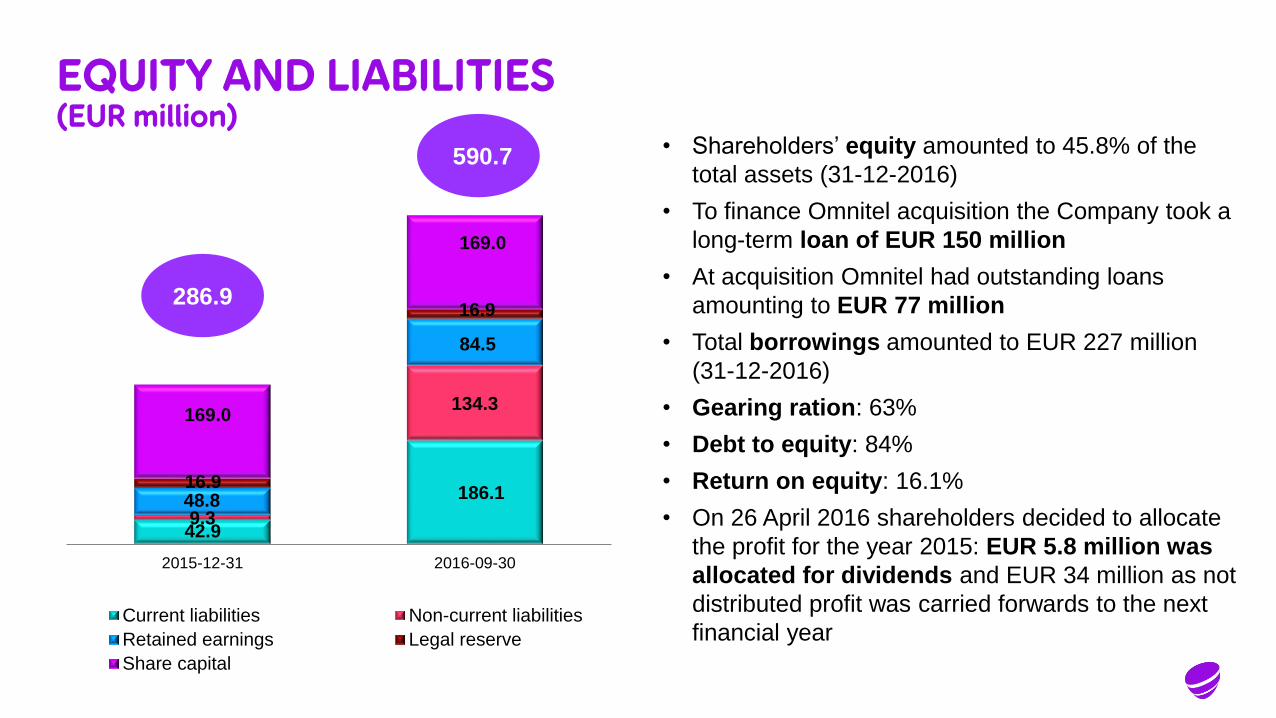
EQUITY AND LIABILITIES(EUR million)
• Shareholders’ equity amounted to 45.8% of the
total assets (31-12-2016)
• To finance Omnitel acquisition the Company took a
long-term loan of EUR 150 million
• At acquisition Omnitel had outstanding loans
amounting to EUR 77 million
• Total borrowings amounted to EUR 227 million
(31-12-2016)
• Gearing ration: 63%
• Debt to equity: 84%
• Return on equity: 16.1%
• On 26 April 2016 shareholders decided to allocate
the profit for the year 2015: EUR 5.8 million was
allocated for dividends and EUR 34 million as not
distributed profit was carried forwards to the next
financial year
42.9
186.1
9.3
134.3
48.8
84.5
16.9
16.9
169.0
169.0
2015-12-31 2016-09-30
Current liabilities Non-current liabilities
Retained earnings Legal reserve
Share capital
286.9
590.7
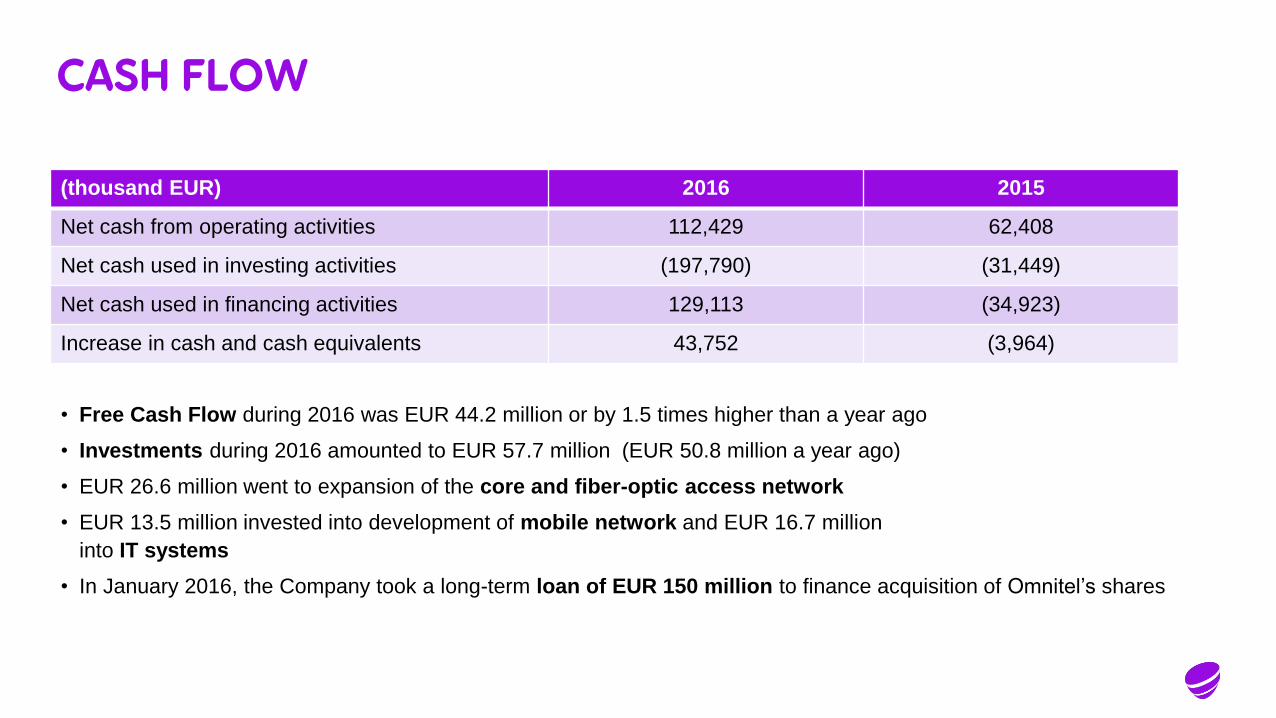
CASH FLOW
(thousand EUR) 2016 2015
Net cash from operating activities 112,429 62,408
Net cash used in investing activities (197,790) (31,449)
Net cash used in financing activities 129,113 (34,923)
Increase in cash and cash equivalents 43,752 (3,964)
• Free Cash Flow during 2016 was EUR 44.2 million or by 1.5 times higher than a year ago
• Investments during 2016 amounted to EUR 57.7 million (EUR 50.8 million a year ago)
• EUR 26.6 million went to expansion of the core and fiber-optic access network
• EUR 13.5 million invested into development of mobile network and EUR 16.7 million
into IT systems
• In January 2016, the Company took a long-term loan of EUR 150 million to finance acquisition of Omnitel’s shares
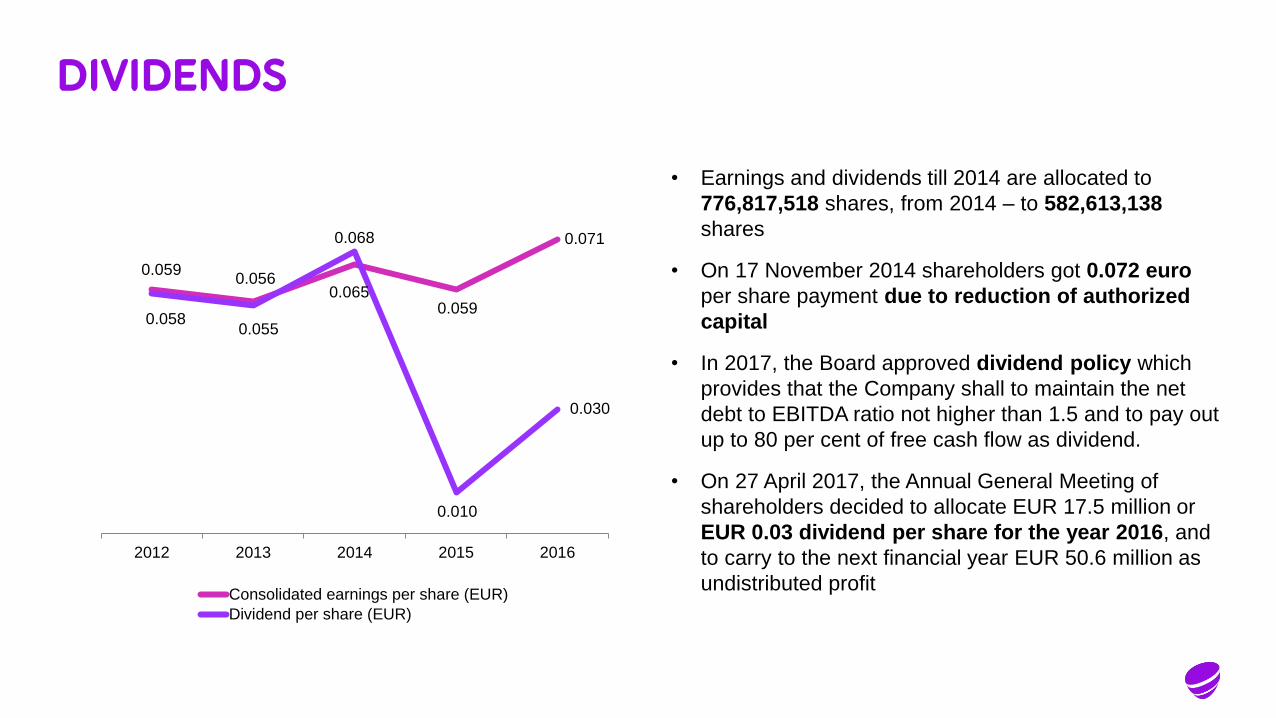
DIVIDENDS
• Earnings and dividends till 2014 are allocated to
776,817,518 shares, from 2014 – to 582,613,138
shares
• On 17 November 2014 shareholders got 0.072 euro
per share payment due to reduction of authorized
capital
• In 2017, the Board approved dividend policy which
provides that the Company shall to maintain the net
debt to EBITDA ratio not higher than 1.5 and to pay out
up to 80 per cent of free cash flow as dividend.
• On 27 April 2017, the Annual General Meeting of
shareholders decided to allocate EUR 17.5 million or
EUR 0.03 dividend per share for the year 2016, and
to carry to the next financial year EUR 50.6 million as
undistributed profit
0.0590.056
0.0650.059
0.071
0.0580.055
0.068
0.010
0.030
2012 2013 2014 2015 2016
Consolidated earnings per share (EUR)
Dividend per share (EUR)

SHARES AND SHAREHOLDERS
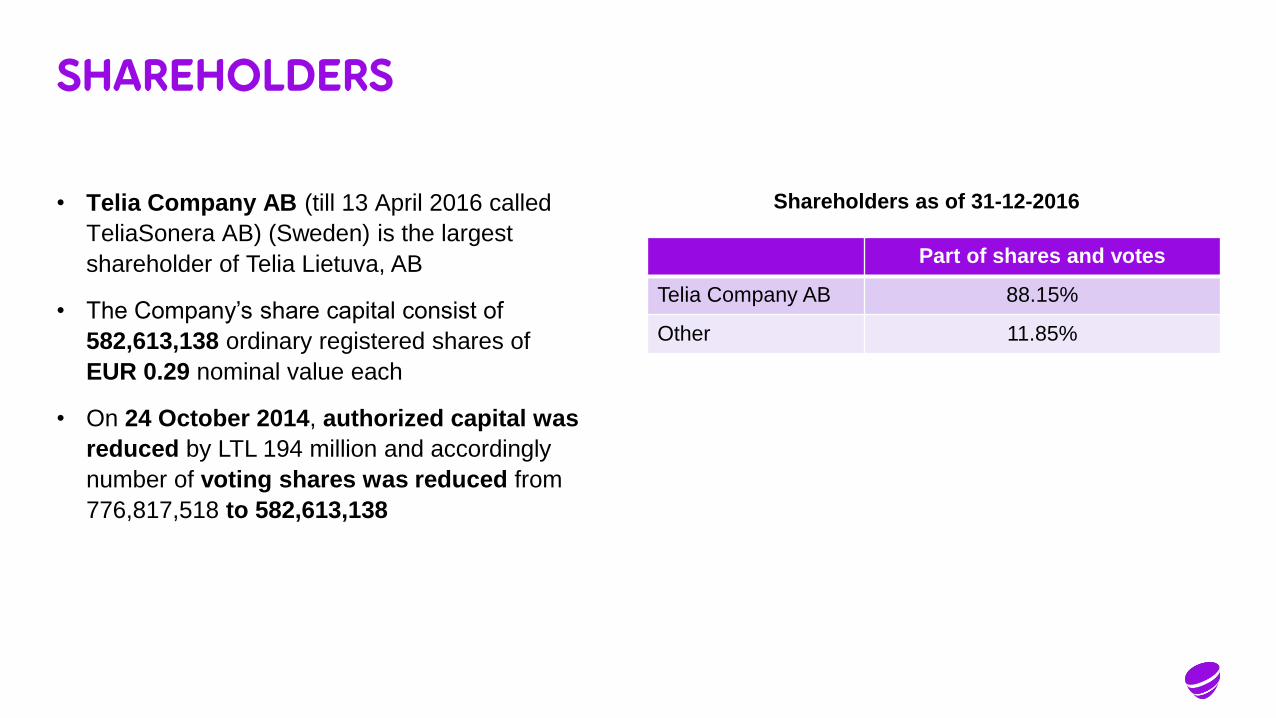
SHAREHOLDERS
• Telia Company AB (till 13 April 2016 called
TeliaSonera AB) (Sweden) is the largest
shareholder of Telia Lietuva, AB
• The Company’s share capital consist of
582,613,138 ordinary registered shares of
EUR 0.29 nominal value each
• On 24 October 2014, authorized capital was
reduced by LTL 194 million and accordingly
number of voting shares was reduced from
776,817,518 to 582,613,138
Part of shares and votes
Telia Company AB 88.15%
Other 11.85%
Shareholders as of 31-12-2016
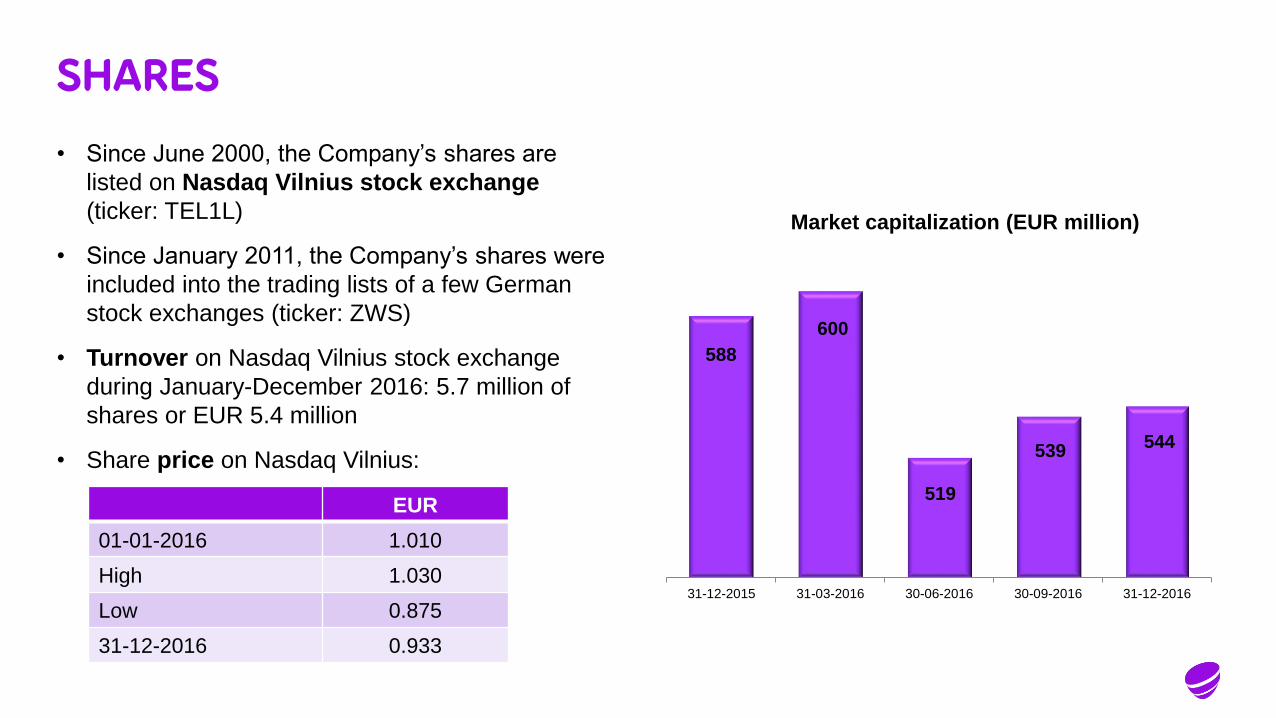
SHARES
• Since June 2000, the Company’s shares are
listed on Nasdaq Vilnius stock exchange
(ticker: TEL1L)
• Since January 2011, the Company’s shares were
included into the trading lists of a few German
stock exchanges (ticker: ZWS)
• Turnover on Nasdaq Vilnius stock exchange
during January-December 2016: 5.7 million of
shares or EUR 5.4 million
• Share price on Nasdaq Vilnius:
EUR
01-01-2016 1.010
High 1.030
Low 0.875
31-12-2016 0.933
588
600
519
539544
31-12-2015 31-03-2016 30-06-2016 30-09-2016 31-12-2016
Market capitalization (EUR million)
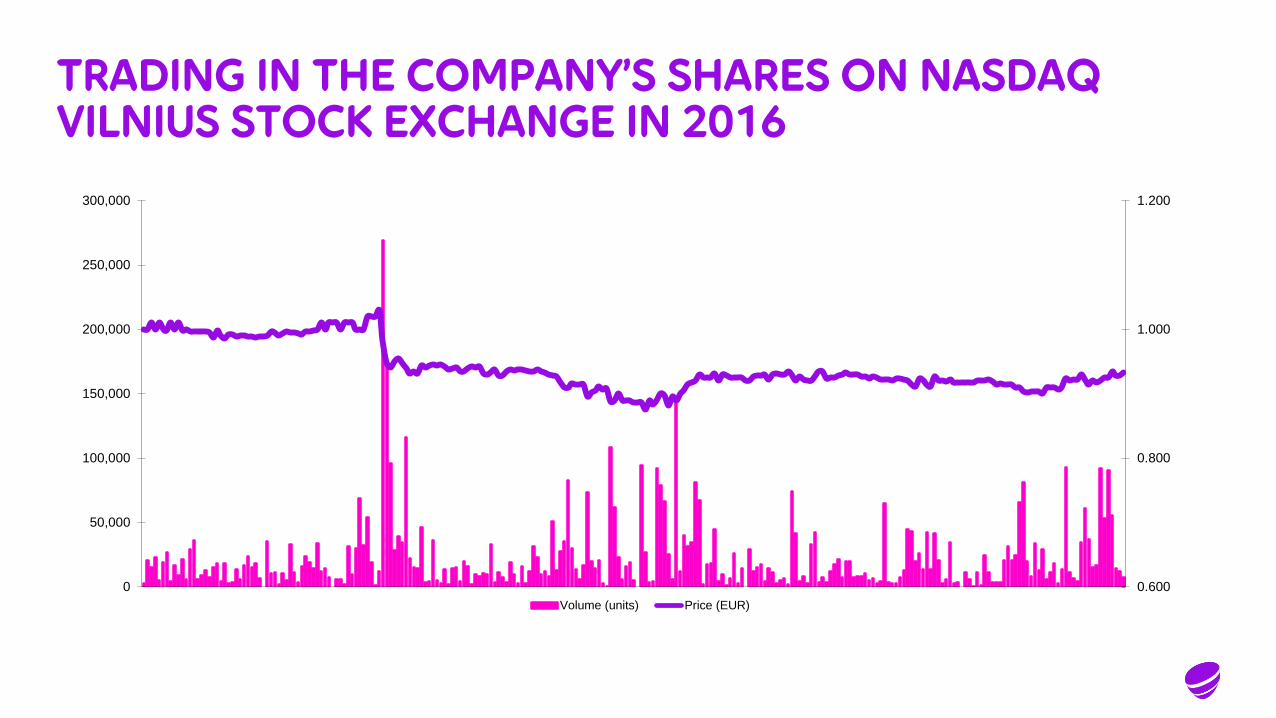
TRADING IN THE COMPANY’S SHARES ON NASDAQ VILNIUS STOCK EXCHANGE IN 2016
0.600
0.800
1.000
1.200
0
50,000
100,000
150,000
200,000
250,000
300,000
Volume (units) Price (EUR)
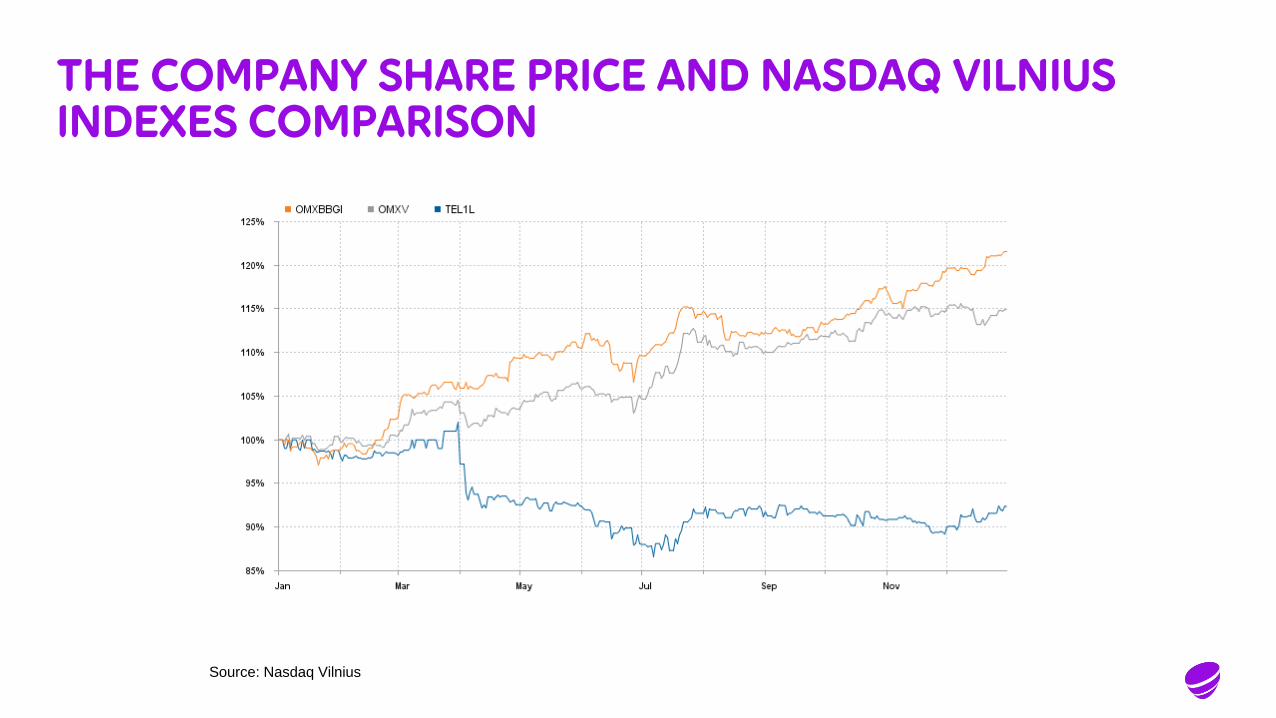
THE COMPANY SHARE PRICE AND NASDAQ VILNIUS INDEXES COMPARISON
Source: Nasdaq Vilnius

CORPORATEGOVERNANCE
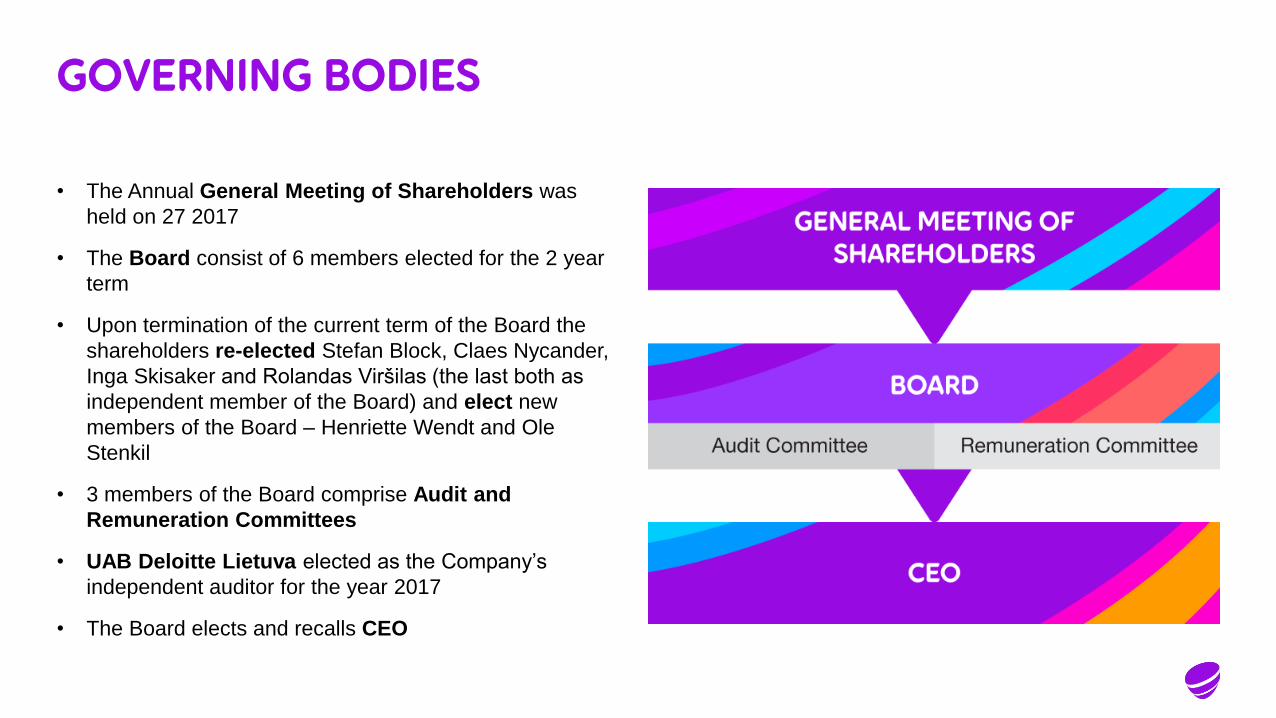
GOVERNING BODIES
• The Annual General Meeting of Shareholders was
held on 27 2017
• The Board consist of 6 members elected for the 2 year
term
• Upon termination of the current term of the Board the
shareholders re-elected Stefan Block, Claes Nycander,
Inga Skisaker and Rolandas Viršilas (the last both as
independent member of the Board) and elect new
members of the Board – Henriette Wendt and Ole
Stenkil
• 3 members of the Board comprise Audit and
Remuneration Committees
• UAB Deloitte Lietuva elected as the Company’s
independent auditor for the year 2017
• The Board elects and recalls CEO
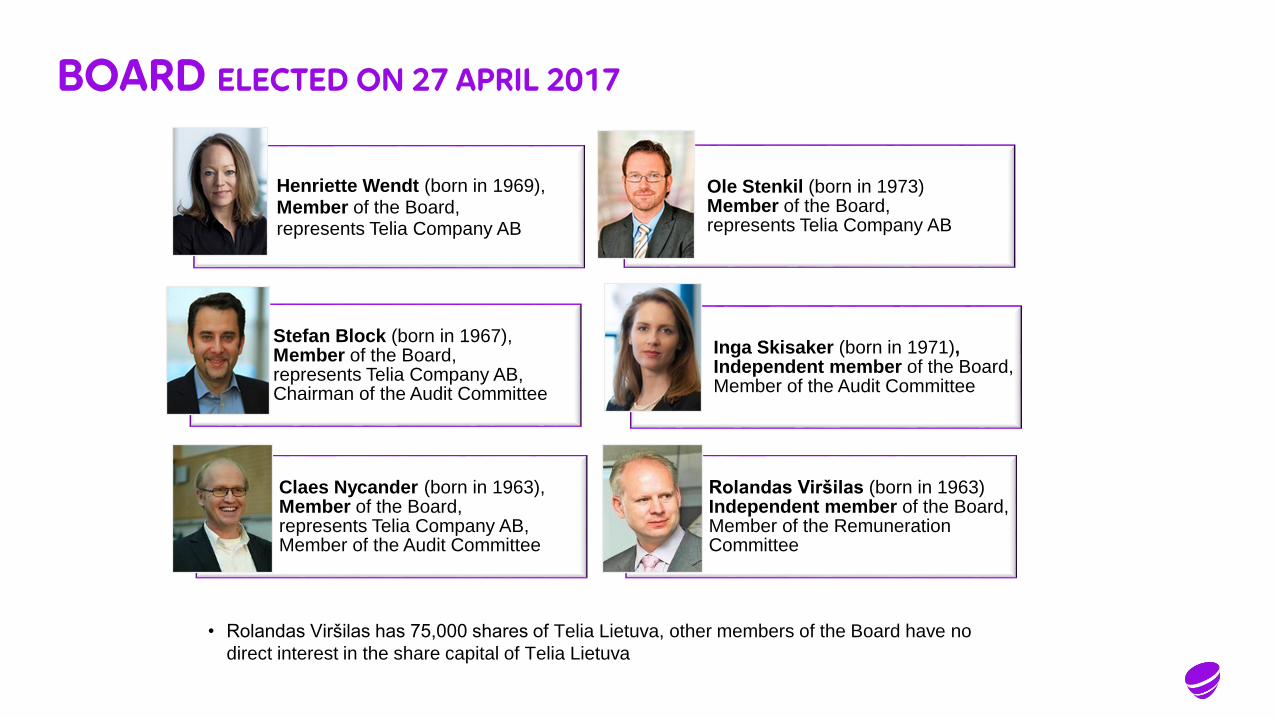
BOARD ELECTED ON 27 APRIL 2017
• Rolandas Viršilas has 75,000 shares of Telia Lietuva, other members of the Board have no
direct interest in the share capital of Telia Lietuva
Henriette Wendt (born in 1969),Member of the Board,represents Telia Company AB
Stefan Block (born in 1967),Member of the Board,represents Telia Company AB,Chairman of the Audit Committee
Claes Nycander (born in 1963),Member of the Board,represents Telia Company AB,Member of the Audit Committee
Ole Stenkil (born in 1973)Member of the Board,represents Telia Company AB
Inga Skisaker (born in 1971),Independent member of the Board,Member of the Audit Committee
Rolandas Viršilas (born in 1963)Independent member of the Board,Member of the Remuneration Committee
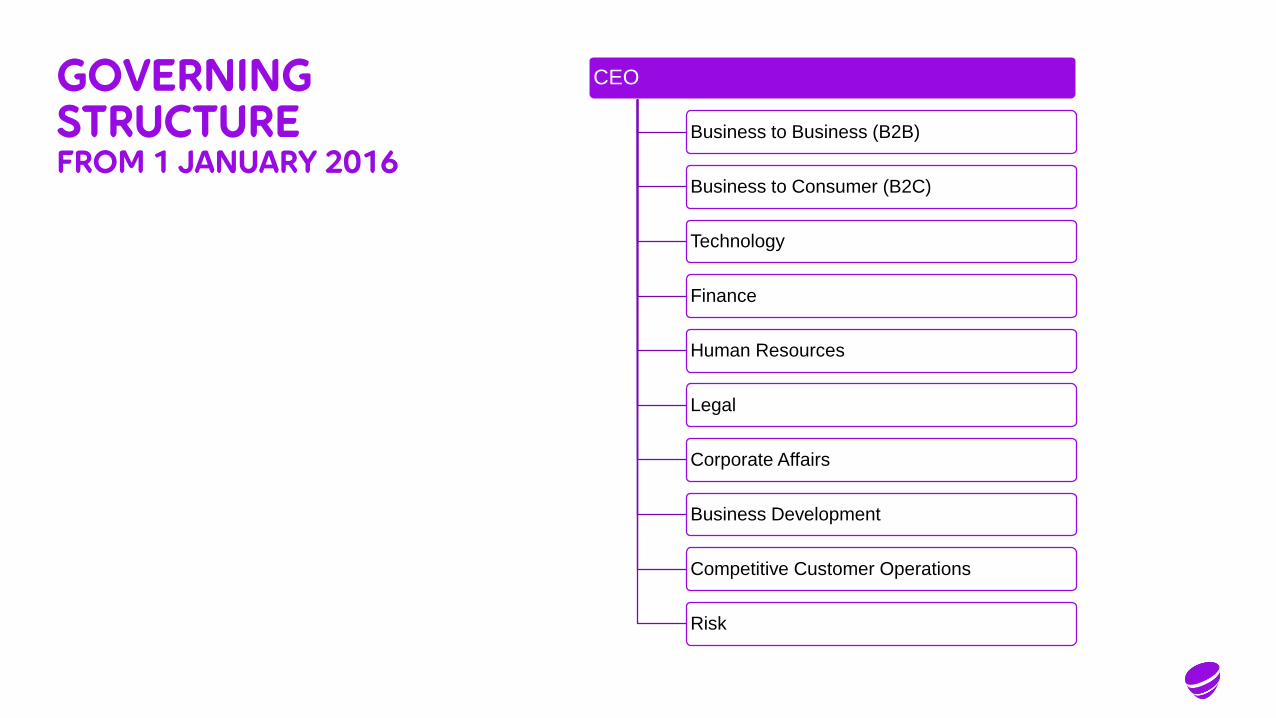
GOVERNING STRUCTUREFROM 1 JANUARY 2016
CEO
Business to Business (B2B)
Business to Consumer (B2C)
Technology
Finance
Human Resources
Legal
Corporate Affairs
Business Development
Competitive Customer Operations
Risk
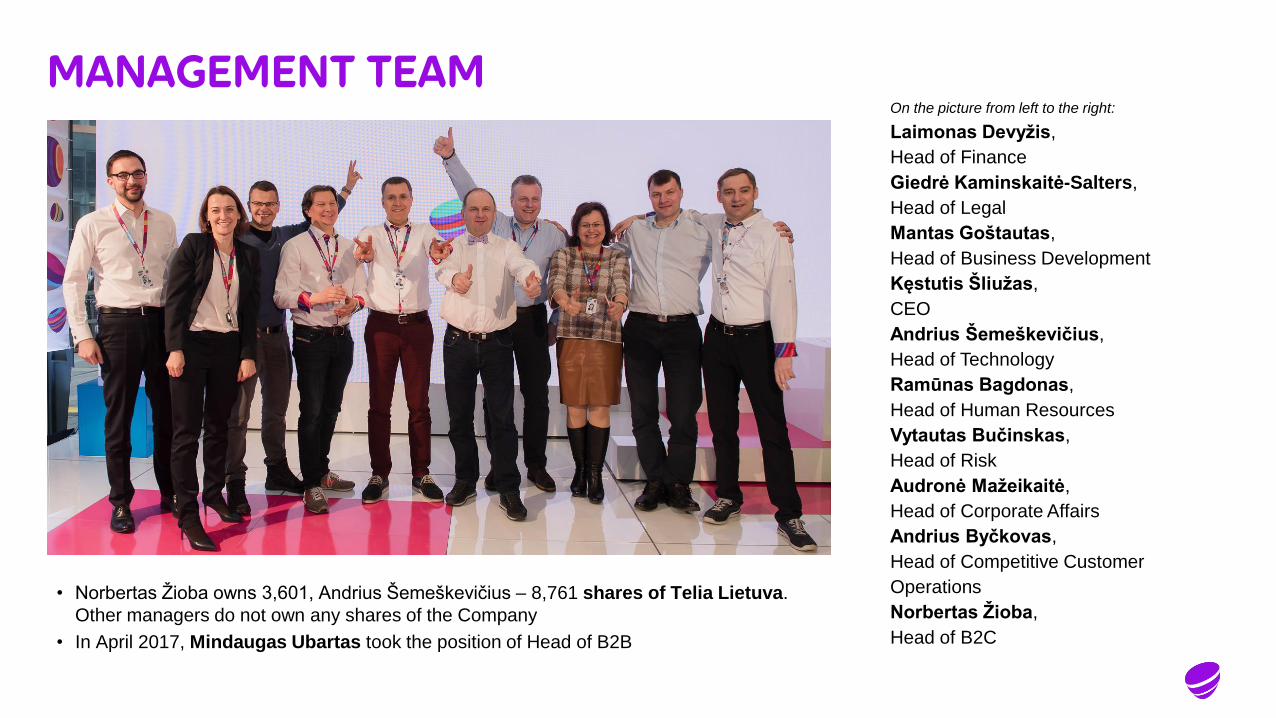
MANAGEMENT TEAMOn the picture from left to the right:
Laimonas Devyžis,
Head of Finance
Giedrė Kaminskaitė-Salters,
Head of Legal
Mantas Goštautas,
Head of Business Development
Kęstutis Šliužas,
CEO
Andrius Šemeškevičius,
Head of Technology
Ramūnas Bagdonas,
Head of Human Resources
Vytautas Bučinskas,
Head of Risk
Audronė Mažeikaitė,
Head of Corporate Affairs
Andrius Byčkovas,
Head of Competitive Customer
Operations
Norbertas Žioba,
Head of B2C
• Norbertas Žioba owns 3,601, Andrius Šemeškevičius – 8,761 shares of Telia Lietuva.
Other managers do not own any shares of the Company
• In April 2017, Mindaugas Ubartas took the position of Head of B2B
#VISAKOTINKLAS


