
THE SURVEY OF INCOME ANDPROGRAM PARTICIPATION
THE SURVEY OF INCOME AND
PROGRAM PARTICIPATION --RECENT HISTORY AND FUTUREDEVELOPMENTS
No. 232
Daniel H. WeinbergBureau of the Census
U. S. Department of Commerce BUREAU OF THE CENSUS
-1-
The Survey of Income and Program Participation B Recent History and Future Developments
Daniel H. Weinberg*
U.S. Census Bureau
Washington, DC 20233-8500
revised June 20, 2002
Abstract
Longitudinal monthly data from the Survey of Income and Program Participation (SIPP) enable
researchers to examine key dynamic events. This paper reports on recent Census Bureau
initiatives that have made the SIPP data easier to use, possible changes in SIPP=s design to make
it a viable source of official income and poverty statistics, some recent research findings within
the context of the overall research program, and some of the remaining challenges the Census
Bureau faces.
Key Words: surveys, survey research, income, program participation, poverty
* The author is Chief of the Housing and Household Economic Statistics Division at the U.S. Census Bureau. This paper reports the results of research and analysis undertaken by Census Bureau staff. It has undergone a more limited review than official Census Bureau publications. This report is released to inform interested parties of research and to encourage discussion. The author wishes to thank the following individuals for their comments and contributions to this paper: Evan Davey, Pat Doyle, Judy Eargle, Nancy Gordon, Vicki Huggins, Robert Kominski, Elizabeth Martin, Michael McMahon, Charles Nelson, Carole Popoff, and Karen Wheeless.

-2-
The Survey of Income and Program Participation B
Recent History and Future Developments
I. INTRODUCTION
Data from the Survey of Income and Program Participation (SIPP) provide a truly unique
perspective on economic behavior. SIPP=s design enables researchers to examine key
dynamic events. It tells us what happened in each household month by month, something no
other survey can do with accuracy.1 Because of its short recall period (four months with
monthly accounting), its longitudinal design that follows initial respondents for more than
two years (up to four), and the survey=s concomitant ability to capture intra-year variations in
economic and demographic characteristics, policy analysts have used SIPP data to examine
many relevant policy issues. These include:
‚ Program eligibility and participation rates in the food stamps program, including analysis
of dynamics (used in the simulation of proposed changes to the food stamps program);
‚ The gain or loss of health insurance (used in the development of and debate on President
Clinton=s health care reform initiative, especially regarding the availability of health
insurance to workers losing their jobs, and in development of the legislation improving
health insurance portability);
‚ Income and poverty changes over both short (month-to-month) and multiyear periods (for
example, documenting that most minimum-wage workers do not stay at that wage level);
1. A few annual surveys do ask about monthly behaviors, but they are more likely to have recall bias than the SIPP which asks about those behaviors three times a year.

-3-
‚ Welfare program participation (used in the development of and debate on the President
Clinton=s welfare reform initiative, most particularly to understand the effects of limiting
the time on welfare);
‚ The income replacement role of unemployment compensation and its effects on
reemployment (used by the recent Presidential Commission on Unemployment
Compensation); and
‚ The dynamics of health insurance coverage of children (used in debates over
establishment of the State Child Health Insurance Program).
SIPP also has an important role to play in the next several years, as social transfer programs
undergo large-scale change.
‚ SIPP will be used to evaluate the effectiveness of the Health Insurance Portability and
Accountability Act of 1996;
‚ SIPP will continue to be the only data available to evaluate how the Americans with
Disabilities Act of 1990 affects the employment and income of the disabled;
‚ Consistent with the recent National Academy of Sciences (NAS) report on poverty
measurement, SIPP may become the official source of income and poverty estimates in
the U.S.;
‚ Because SIPP provides the most accurate picture of eligibility and participation in social
transfer programs of any household survey, it, along with the Survey of Program

-4-
‚ Dynamics (SPD),2 will let researchers examine what happens to people as they leave
welfare because of the reforms enacted in the Personal Responsibility and Work
Opportunity Reconciliation Act of 1996; and
‚ SIPP is the only survey that allows us to understand the short-term relationship between
demographic change (e.g., marriage, childbirth, divorce, widowhood, and other life-
course events) and economic change.
In addition to its strengths as a longitudinal survey, SIPP is the only regular source for valuable
cross-section data such as the cost of child care, nonincome measures of economic hardship,
child disability, the relationship between adult disability and economic well-being, pension
coverage, housing affordability, and financial assistance for education. Additionally, it is one of
the few sources of data on household wealth (assets and liabilities) and employer-provided
health insurance.
Section II of this paper discusses recent Census Bureau initiatives that have made the SIPP data
easier to use. Section III focuses on possible changes in SIPP=s design in response to a desire to
make SIPP the source of official income and poverty statistics. Section IV presents some recent
research findings and lays out the Census Bureau=s overall research program. Finally, Section V
presents some of the remaining challenges the Census Bureau faces for SIPP.
2. The Survey of Program Dynamics is a follow-on survey to the 1992 and 1993 SIPP panels, designed to measure the effects of the 1996 welfare reform legislation. For more details on the SPD, see <http://www.sipp.census.gov/spd/>; see also Weinberg and Shipp (2002).
-5-
II. RECENT DEVELOPMENTS HAVE EASED DATA ACCESS
SIPP data files have had the reputation of being hard to use. This has, to a great extent, been true.
Even in the future, using SIPP data will require more effort and time than simpler cross-sectional
data. To researchers used to manipulating the annual March Current Population Survey (CPS)
data with ease, longitudinal data by person by month are unfamiliar. The familiar concepts of
family and household lose their fixed meaning as people move in and out of households. In
addition, the Census Bureau issued the first SIPP cross-section (wave) data (1984-1988 panels)
in a relatively sophisticated relational database that used a hierarchy of households, families, and
individuals -- a format unfamiliar to many data users. Because of user requests, it has issued the
1990 and subsequent panel cross-sectional (wave) data in Aperson-month@ format.
The Census Bureau undertook a number of additional projects in recent years to improve SIPP
data accessibility.3 Nevertheless, this complicated a data set will still require an investment of
time and effort by the new user to reap its benefits. As SIPP use has grown, however, it has
outstripped the ability of the outreach staff to keep pace. The Census Bureau has met the
challenge by developing additional user support tools:
‚ An Updated and Improved SIPP Users’ Guide. A third edition of the SIPP Users’ Guide
has been issued and will become a dynamic resource, available and continuously updated
in electronic format (the current version is available on CD-ROM as well as in print). In
addition, the new Guide contains several specific enhancements, based on feedback the
3. Several projects were completed by Westat Inc. and its subcontractor Mathematica Policy Research Inc.

-6-
Census Bureau has received from users over the years. These include sections on
commonly found problems along with their solutions, sections on how to match files
(with examples), and information on specific measurement issues (such as attrition and
seam problems). It focuses on the many changes that took place as SIPP changed from
paper-based to computer-assisted interviewing in April 1996. No significant changes
were made to the 2001 SIPP panel data collection methods.
‚ Processing Documentation. The documentation of post-data collection processing
procedures (edits, imputations, etc.) has been made more accessible to researchers.
Routine SIPP processing operations now produce, for each wave, a set of “Data Quality
Profile” tabulations to simplify analysts= review. These are available to other users as
part of the data file documentation. With these wave-by-wave tabulations, users can
answer certain questions easily and quickly determine how the SIPP sample behaves over
time. The Census Bureau hopes that the systematizing of data quality reviews will help
increase the speed of data delivery, but longitudinal data products will continue to take
longer to produce than cross-sectional wave files as longitudinal editing has built-in
delays, such as “backward” editing -- using data from wave At+1@ to edit wave At@. (More
on longitudinal processing below.)
-7-
A Comprehensive SIPP Bibliography. A comprehensive bibliography of all journal articles,
research papers, and working papers based upon SIPP data has been made available to the user
community on the Internet, covering the period up to 1997. Moreover, the bibliography is
available through the Internet (<http://www.sipp.census.gov/sipp/aboutbib.htm>) and may
eventually have keyword search and update capabilities (with hot links to relevant documents); it
now allows word searches on titles.
‚ A PC-based Tutorial. A personal computer-based tutorial will shortly be available on-line
that instructs users on the basics of SIPP. It is modular, so that, for example, new users
could go through the entire tutorial, while experienced users could use the tutorial to
brush up on specific areas of interest (such as longitudinal weighting).
‚ An Updated SIPP Quality Profile. The SIPP Quality Profile has been one of the more
useful SIPP data products. The third edition of the Profile, covering up to the 1990-1993
SIPP panels, was issued in 1998. However, as the result of resource constraints, this
series is out of date. A fourth edition of the Quality Profile that will include research that
uses the 1996 SIPP panel will be created in the next few years.
‚ A User-Friendly Web Site. The SIPP home page (http://www.sipp.census.gov/sipp/)
contains the following sections: Overview, History & Concepts, Methodology, Core
Content, Topical Module, Longitudinal, Data Access, Data Applications, Publications &
Analyses, What's New, User Notes/ListServe, and a Search capability. Users are more
easily able to find the information they need.

-8-
‚ Creation of State-level Weights. State-level weights for the 1996 panel for selected larger
states enable users to produce reliable estimates of population measures such as poverty
and program participation, though sample sizes will still limit more detailed estimates.
A few other dissemination and outreach projects are worth noting as well:
‚ Expanding the Base of Sophisticated SIPP Users. The Census Bureau has begun a “Small
Grants Program”, administered by the University of Chicago-Northwestern University
Poverty Research Center, to foster innovative uses of SIPP data. The Center has awarded
dozens of grants since 1997 and holds an annual conference.4
‚ Providing and Documenting the SIPP Instrument. The Census Bureau has implemented
computer-based instrument documentation to provide the user with access to the actual
SIPP computer-assisted personal interview questions, accessible from the SIPP web site.
‚ User-friendly Data Extraction. Several years ago, the Census Bureau established a
special outreach staff to oversee development of “SIPP On-Call” later “Surveys on
Call”.5 That system provides free Internet access to the pre-1996 panel microdata
through a menu-driven “Data Extraction System.” Since then, the Census Bureau has
totally redesigned the microdata access system to make it easier to use, and data are
available faster than through any other mechanism. The new data access system uses a
Census Bureau-built program, the Federal Electronic Research and Review Extraction
Tool (FERRET), as the data server for 1996 panel microdata and metadata (at
4. A list of small grants recipients can be found at <http://www.jcpr.org/small_grants/index.html>. 5. SIPP On-Call was the successor to SIPP Access, founded by Professor Martin David at the University of Wisconsin but discontinued when National Science Foundation funding ended.
-9-
<http://ferret.bls.census.gov/cgi-bin/ferret>).6 Their data extraction tool will be improved
as often as possible based on feedback from users.
‚ Establishment of an e-mail “list serve”. The Census Bureau has established and is
maintaining an e-mail list serve to respond to user inquiries quickly and enable the users
to educate each other. Users can sign up at <http:lists.census.gov/mailman/listinfo/sipp-
users>.
‚ Reestablishment of the Washington D.C. users group. The DC-area users group has
begun to meet again on a regular basis to hear updates on Census Bureau activities, share
information, and provide advice. (The Census Bureau also charters an advisory
committee on the SIPP and the SPD, organized by the American Statistical Association’s
Survey Research Methods Section, that meets approximately every 6 to 9 months.)
‚ Improving data access further. A private company, Unicon Research, has had great
success in packaging all extant microdata files for the CPS on a single CD-ROM along
with its documentation, and extract programs. The Census Bureau is cooperating with
Unicon, which is working under a National Institutes of Health research grant, to
investigate whether such a product is feasible for SIPP.
III. SIPP=S DESIGN MUST ADAPT TO NEW NATIONAL NEEDS
After several years of experimentation and development, SIPP began in late 1983. It was
intended to correct the deficiencies of the March CPS in collecting income data, and to expand
the data collected on transfer programs (only superficially dealt with by the March CPS
6. Other survey microdata are also available through FERRET.
-10-
beginning in 1980). The original design tried to compromise between the twin goals of
collecting accurate cross-section and longitudinal data on income and program participation by
having a multiple-panel overlapping design. This design proved difficult for the Census Bureau
to implement effectively, leading to unacceptable delays in data dissemination and unsatisfactory
data for most users (difficulty in combining multiple panels for cross-section users, and
insufficient sample sizes and too-short panels for longitudinal data users).
After a large-scale user survey, discussions with many potential users, and discussions with a
NAS panel on SIPP (see Citro and Kalton, 1993, for their final report), the Census Bureau
decided in 1992 to redesign the SIPP. The new design, which began in April 1996, focused
primarily on providing accurate and useful longitudinal data by using abutting four-year panels
(that is, a panel starting in 1996 and ending in 1999 with another starting in 2000 and ending in
2003, etc.).7 In addition, the Census Bureau planned to ameliorate the concerns of cross-section
data users through development of statistical techniques for correcting attrition bias.
Meanwhile, a separate NAS panel (Citro and Michael, 1995) recommended in 1995 that the
SIPP become the source of official income and poverty statistics. The Clinton administration
endorsed this goal, and funds to do research and expand the SIPP were included in the Fiscal
Year (FY) 1999 and FY 2001 budget requests (turned down by the Congress); they may be
included in forthcoming budget requests. Meeting the goal, however, would require the Census
Bureau to refocus the SIPP on providing a good time series of cross-section estimates, a standard
7. The NAS panel also recommended four-year panels, but beginning every two years. The 1996 panel started in April 1996 rather than February because of the 2-month government shutdown in early 1996.
-11-
by which the 1996 design fails. Further, attempts to develop new field, weighting, and estimation
procedures to attenuate or correct for attrition bias have not yet shown success. Unfortunately,
attrition from the 1996 panel has substantially exceeded predictions and already topped 25
percent (the original NAS projection for four years) by the end of the second year; attrition for
the 2001 panel is nearly that level after 1 year.
The Census Bureau convened an internal working group to examine the adaptability of the SIPP
to meet this new cross-section goal of poverty measurement while maintaining the ability of the
SIPP to meet the strongly expressed needs for longitudinal data. It recommended starting
supplementary three-year panels of 11,500 households each completing wave 1 (16,000 housing
units selected), one to start in each year that the larger, longitudinally focused panel of 36,700
households (50,000 housing units selected) does not. This design would provide, through
pooling of data from three panels, estimates of income and poverty of comparable reliability to
the March CPS at the national level for year-to-year changes.8 (Increased attrition has altered the
plans, which now target 17,000 housing units for the survey, with roughly 12,700 households
completing wave 1.) The Office of Management and Budget (OMB), in consultation with other
federal agencies, Congress, and the public, will decide whether to make changes in the current
official measures, pending the results of research conducted by the Census Bureau and other
agencies (see, e.g., Short, 2001).
As has been true in the past, meeting these multiple conflicting goals will be difficult for SIPP.
The late Wray Smith along with Tom Jabine interviewed a large fraction of the government and
8. The target was to match the reliability of the March CPS before it was expanded in 2001 to improve the reliability of health insurance coverage estimates for children.

-12-
nongovernment SIPP users in 1997 and gathered their suggestions for how the Census Bureau
should adapt the SIPP to the changing policy environment (Smith and Jabine, 1998). While lack
of people and time preclude major changes immediately, serious suggestions were put forward,
both for the 2000 panel (e.g., shortening it three years), and for later panels (e.g., drawing state-
based samples for the 2003 and later SIPP panels).
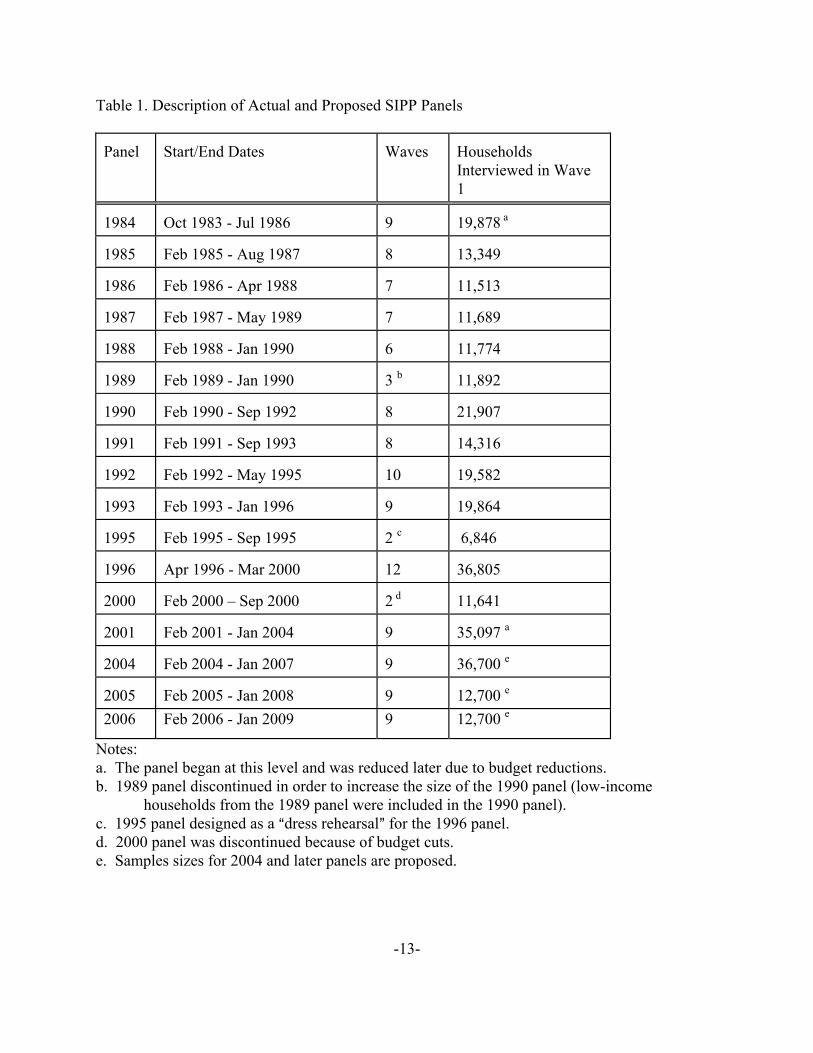
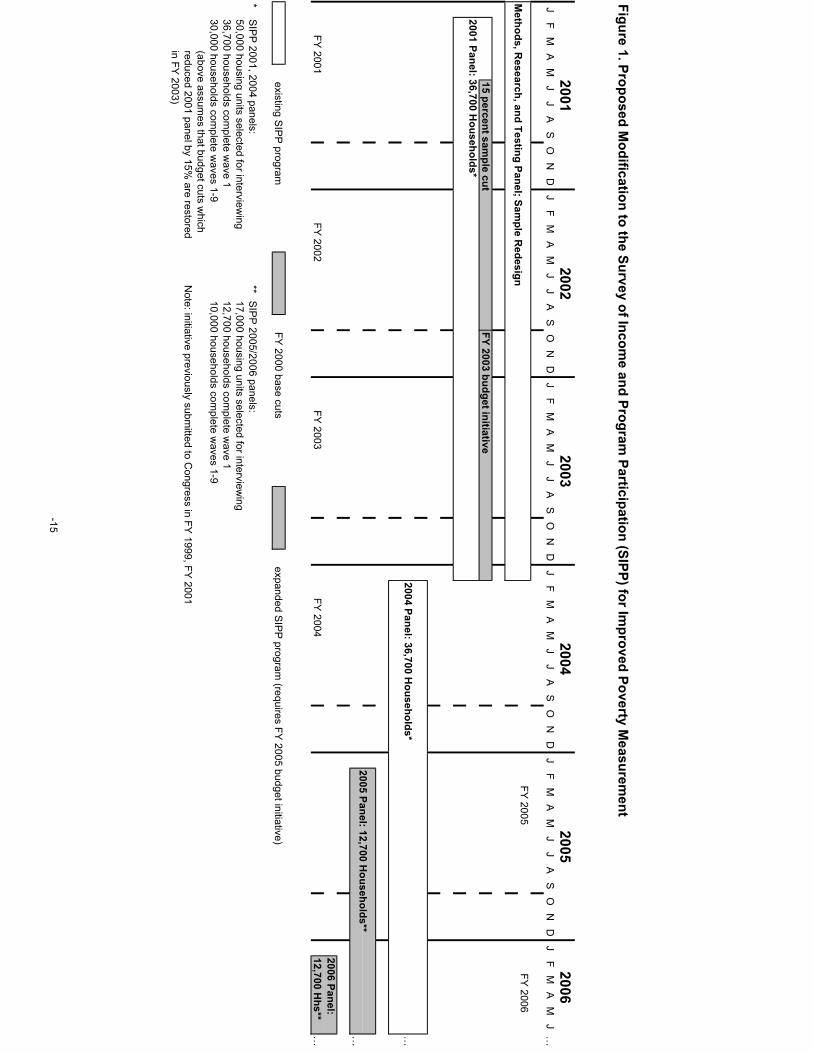
The Census Bureau’s current working plan for future SIPP panels is shown in Table 1. The table
assumes both that the FY 2003 budget initiative to restore SIPP’s sample size is approved by
Congress, and that a FY 2005 budget initiative to improve poverty measurement is included in
the President=s budget and approved.9 ) This new design is illustrated in Figure 1. First, note that
the Census Bureau decided to delay the beginning of the second large panel from 2000 to 2001
because of operational considerations associated with the 2000 decennial census. Second,
because of budget reductions in FY 2001, the 2000 panel was cancelled after 2 waves and the
2001 panel was reduced about 15 percent after 2 waves since the restoration of funding did not
take place in FY 2002 as had been expected. Since new samples will be drawn based on the
results of Census 2000, the 2004 (and subsequent) panels will be state-representative. To be
state-reliable for subgroup analysis, however, additional sample must be included, both to
compensate for the loss of efficiency for national estimates and to obtain equal reliability in each
state (the CPS sample in small states if proportionately larger than in large states to obtain
comparable reliability).
9 . These plans are presented to encourage discussion of alternatives and are subject to modification by the President and the Congress.
-13-
Table 1. Description of Actual and Proposed SIPP Panels Panel
Start/End Dates
Waves
Households Interviewed in Wave 1
1984
Oct 1983 - Jul 1986
9
19,878 a
1985
Feb 1985 - Aug 1987
8
13,349
1986
Feb 1986 - Apr 1988
7
11,513
1987
Feb 1987 - May 1989
7
11,689
1988
Feb 1988 - Jan 1990
6
11,774
1989
Feb 1989 - Jan 1990
3 b
11,892
1990
Feb 1990 - Sep 1992
8
21,907
1991
Feb 1991 - Sep 1993
8
14,316
1992
Feb 1992 - May 1995
10
19,582
1993
Feb 1993 - Jan 1996
9
19,864
1995
Feb 1995 - Sep 1995
2 c
6,846
1996
Apr 1996 - Mar 2000
12
36,805
2000
Feb 2000 – Sep 2000
2 d
11,641
2001
Feb 2001 - Jan 2004
9
35,097 a
2004
Feb 2004 - Jan 2007
9
36,700 e
2005
Feb 2005 - Jan 2008
9
12,700 e
2006 Feb 2006 - Jan 2009 9 12,700 e
Notes: a. The panel began at this level and was reduced later due to budget reductions. b. 1989 panel discontinued in order to increase the size of the 1990 panel (low-income
households from the 1989 panel were included in the 1990 panel). c. 1995 panel designed as a Adress rehearsal@ for the 1996 panel. d. 2000 panel was discontinued because of budget cuts. e. Samples sizes for 2004 and later panels are proposed.
JF
MA
MJ
JA
SO
ND
JF
MA
MJ
JA
SO
ND
JF
MA
MJ
JA
SO
ND
JF
MA
MJ
JA
SO
ND
JF
MA
MJ
JA
SO
ND
JF
MA
MJ
…
FY 2005FY 2006
……
FY 2001FY 2002
FY 2003FY 2004
…
existing SIPP programFY 2000 base cuts
expanded SIPP program (requires FY 2005 budget initiative)
*SIPP 2001, 2004 panels:
**SIPP 2005/2006 panels:
50,000 housing units selected for interviewing
17,000 housing units selected for interviewing
36,700 households complete w
ave 112,700 households com
plete wave 1
30,000 households complete w
aves 1-910,000 households com
plete waves 1-9
(above assumes that budget cuts w
hich reduced 2001 panel by 15%
are restoredN
ote: initiative previously submitted to C
ongress in FY 1999, FY 2001in FY 2003)
2006 Panel: 12,700 H
hs**
20012003
2004 Panel: 36,700 Households*
2005 Panel: 12,700 Households**
Figure 1. Proposed Modification to the Survey of Incom
e and Program Participation (SIPP) for Im
proved Poverty Measurem
ent
15 percent sample cut
FY 2003 budget initiative
2006
Methods, R
esearch, and Testing Panel; Sample R
edesign
20042002
2005
2001 Panel: 36,700 Households*
-15

-15-
Third, core content is now undergoing a thorough examination, based on user comments and the
Census Bureau’s own investigations of question validity and usefulness. Changes are being
pretested, using a separate methods panel, with implementation targeted for the 2004 panel.10
Topical modules are getting attention as well. The Census Bureau has chartered a “Continuous
Instrument Improvement Group” for SIPP that is systematically reviewing their content and
consulting with key federal agency data users.
To determine the effect of questionnaire length on response rates, the SIPP 2000 panel
instrument was modified to administer topical modules in three-quarters of the sample, while the
other one-quarter got the core questionnaire only. Response rates in both waves 1 and 2 in the
one-quarter of the sample that did not receive topical modules were slightly higher than those in
the rest of the sample that received topical modules (89.2 percent versus 88.6 percent in wave 1,
94.3 percent versus 93.5 percent in wave 2). However, neither of the differences tested as
statistically significant. Cumulative nonresponse after two waves was thus 17.9 percent for those
receiving the core and the topical modules and 16.6 percent for those receiving just the core
questionnaire.11
In the aftermath of radical changes in income support programs related to the 1996 welfare
reform legislation, SIPP faced the challenge of adapting its questions as soon as possible to
capture information about programs that vary among different states and localities, and that
10. The methods panel is designed to evaluate alternative measurement approaches for core SIPP items through research on existing data and in field and cognitive tests (see Doyle et al., 2000).
11. The difference would have to be roughly 1 percentage point in any wave to be statistically different at the 90
-16-
change over time. The 1996 panel included a special topical module in wave 8 (August-
November 1998) and the early results of that module were used to redesign the SIPP core.12
The Census Bureau is also evaluating questions needed to implement a possible new poverty
measure in SIPP, such as one recommended by the NAS. One example of questions that have
been added is an indicator of out-of-pocket medical expenditures. While a full battery of
expenditure questions is too lengthy for inclusion, one or a few questions can be used to improve
statistical matching or imputation. In addition, new program requirements and evolving policy
concerns may create a need to rapidly develop and test new questions and topical modules for
inclusion in SIPP before 2004.
IV. RESEARCH HAS RESOLVED KEY ISSUES BUT OTHERS REMAIN
The goals of the SIPP research and evaluation program are many; the status of achieving those
goals are presented below.
Improve cross-section and longitudinal weighting methods. The Census Bureau and contractors
conducted extensive research to improve longitudinal weighting methods, but identified no
methodology superior to the current method for longitudinal weighting (U.S. Census Bureau,
2001, pp. 102-104). Some minor adjustments have been made to both cross-section and
longitudinal weighting because of the research and because of sample design changes, but the
basic methodologies for cross-section and longitudinal weighting have not changed since the
percent confidence level. 12. See O’Harra (2002) for an analysis of some results from that wave.

-17-
(original) 1984 panel.
To further improve the effectiveness of the noninterview weighting adjustments in compensating
for nonresponse bias (due in part to attrition, but also to initial nonresponse), the Census Bureau
is investigating new methodologies and procedures for reducing nonresponse, such as using
administrative data in weighting, and increasing knowledge about nonrespondents using follow-
up studies and reporting by Field Representatives (interviewers). A follow-up mail survey of
1996 panel wave 1 nonrespondents was analyzed by Rottach (2001). He found no substantive
effect on estimates of poverty in wave 1 when the wave 1 nonrespondents who responded to the
mail survey and provided income information were included in the SIPP sample.
The 1997 Survey of Program Dynamics (SPD) offers a unique opportunity to measure the effects
of attrition and possibly develop adjustment models. A forthcoming paper by Vaughan and
Schueren (2002) will examine the effects of attrition in SPD (whose sampling frame was the
1992 and 1993 SIPP wave 1 respondents) on earnings estimates using the Social Security
Administration detailed earnings records.
Improve cross-section and longitudinal imputation methods. Based on research on alternative
longitudinal imputation methods for missing interviews, the Census Bureau has implemented a
new carry-over imputation approach for people missing up to two interviews and bounded by
complete interviews. The Census Bureau has also used the results of the longitudinal imputation
research to improve the cross-section imputations for the 1996 panel. Further, the switch to

-18-
CAPI has allowed the increased use of information from prior interviews (dependent
interviewing), reducing the length of the interview and ensuring more consistency. The Census
Bureau is also working on imputing missing month data for 1995 for the 1993 panel (which
ended in January 1996) and for early 1996 for the 1996 panel (which began late due to
government furloughs). The Census Bureau also plans to evaluate the type Z (noninterviewed
person in an interviewed household) imputation procedures in the hope that such imputation can
be improved.
Improve response rates/reduce attrition rates. Attrition rates for the 1996 panel were higher than
expected and have soared for the 2001 panel (see Table 2).13 Through the years the Census
Bureau has tested different measures to improve response rates, such as giving a small gift (e.g.,
a calculator) to sample households. Both monetary and nonmonetary gifts appear to reduce
nonresponse. Because of the increase in attrition, a number of experiments were undertaken
during the 1996 SIPP panel to reduce nonresponse, and in the SPD to return previously non-
responding households to the survey. A summary of the results of those tests is in Creighton et
al., 2001). They found that “incentives resulted in beneficial but modest improvements in
response” and “larger effects were seen for incentives targeted to nonrespondents in the prior
wave than for initial incentives given to everyone” (p. 305).14 They do note additional issues
13. Response rates for some longitudinal surveys appear higher than for the SIPP in the literature because they report their cumulative response rates on the basis of the number of households actually interviewed in wave 1 as 100 percent rather than on the basis of the number of housing units selected for interview. See Weinberg and Shipp (2002) for a comparison of attrition rates between SIPP, the Panel Study of Income Dynamics, and the National Longitudinal Survey of Youth (NLSY). The NLSY in particular has lower attrition in part because it does not need to follow all parts of any split original household, only the original sample people, and it has used incentives since its inception. 14. The use of a $40 incentive for nonrespondents and the decision to attempt reinterviews of previous

-19-
needing research, including the effects on nonresponse due to no contact, of frequency and
amount, on data quality, of prepaid versus discretionary incentives, of the form of the incentive,
and of implementation and improvements in tracking use.
Because the field staff were convinced that discretion in deciding when to use an incentive could
have a substantial effect, a different incentive scheme incorporating discretion is being tested in
the 2001 panel, which was reduced to 9 waves (3 years) because of the growing attrition
problem. The 2001 panel sample was divided roughly in quarters, with one-quarter acting as the
control, and the other three-quarters eligible for an incentive. For two-thirds of the experimental
sample, each of the Census Bureau’s 12 regional offices were given enough $40 debit cards to be
used for one-tenth of this sample, to be supplied to the field representatives for their
discretionary use to reduce nonresponse in any wave during each one-year cycle. Starting in
wave 4, the other one-third of the experimental group received an advance mailout of a $40 debit
card, but only if they were a nonrespondent in the previous wave.
nonrespondents using a $100 incentive in the Survey of Program Dynamics raised the response rate from 50.2 percent in 1999 to 65.8 percent in 2001 (Weinberg and Shipp, 2002).

-20-
Table 2. SIPP Sample Loss Rates, 1992, 1993, 1996, 2000, and 2001 SIPP panels
Panel:
1992
1993
1996
2000
2001
Panel:
1992
1993
1996
Wave
Wave
1
9.3%
8.9%
8.4%
11.3% 13.3%
7 23.0%
24.3%
29.9%
2
14.6
14.2
14.5
18.2
21.9
8
24.7
25.5 31.3
3
16.4
16.2
17.8
N/A
24.7
9
26.2
26.9 32.8
4
18.0
18.2
20.9
N/A
N/A
10
26.6
N/A 34.0
5
20.3
20.2
24.6
N/A
N/A
11
N/A
N/A 35.1
6
21.6
22.2
27.4
N/A
N/A
12
N/A
N/A 35.5
Notes: N/A = not applicable (1992-2000) or not available (2001) Loss based on eligible housing units selected for interview in wave 1, adjusted for expected sample growth.
Reduce response error. The Census Bureau has done extensive research to estimate response
error and investigate seam bias in SIPP data using administrative records.15 Comparison of SIPP
data with administrative records showed that response errors were rare (Marquis and Moore,
1990). Unfortunately, the Census Bureau clearly identified no basic causes (such as telescoping
or memory decay). This frustrates improvements because there are no clear fixes. This research
also found that although seam bias exists, over a longitudinal period, the underreporting within a
wave and the overreporting between waves, together with the SIPP staggered interviewing
pattern, essentially offset the seam bias errors on a calendar year basis. Conducting interviews in
15. Seam bias is the tendency of interviewed households to report events as occurring in month 1 of a 4-month recall period.
-21-
a computer-assisted environment, collecting information on current status (the Afifth@ month),
and using dependent interviewing in the 1996 panel unfortunately did not appreciably reduce
seam bias errors. It is now hoped that the large-scale improvements included in the methods
panel for 2004 implementation will reduce seam bias. This problem is proving difficult to solve,
though, and for the moment researchers should use care, such as providing results (e.g., spell
lengths) in 4-month intervals or statistically smoothing the transitions in continuous models.
Reduce sampling error. Efforts to reduce sampling error are now focusing on investigating the
use of Internal Revenue Service (tax return) aggregate controls in SIPP longitudinal weighting.
Results to date show that oversampling of low-income households in the 1990 panel and
oversampling of housing units likely to contain low-income households in the 1996 panel were
successful in reducing the variance for poverty and program participation estimates, without
serious adverse effects on most of the other important SIPP estimates, which was the goal. The
Census Bureau plans to continue to use oversampling of low-income groups in future panels.
Improve population coverage. Two SIPP-funded projects explored different approaches to
improving within-household coverage in demographic surveys. The Living Situation Survey,
conducted by Research Triangle Institute with funding from the Census Bureau, found improved
within-household coverage for total and Hispanic households using an expanded set of roster
probes which targeted undercounted and marginally attached persons (Sweet, 1994). A survey
conducted by the National Opinion Research Corporation found increases in coverage of Black
males with anonymous interviewing (Tourangeau, 1997). Further research is needed to examine

-22-
the feasibility of anonymous interviewing in a longitudinal survey with its need to keep track of
individuals.
Improve methods for analysis of SIPP data. The Census Bureau has focused its attention on two
areas to develop and improve analytical methods -- spell length analysis, and adapting some
standard analytical procedures for complex designs. Mera and Bailey (2002) have completed an
overview of the sampling and estimation issues important for analysts using SIPP, focusing on
aspects of its design – an unequal probability, clustered, stratified sampling plan with multiple
interviews -- and how it differs from classical assumptions about a simple random sample. Issues
for future research include development of guidance on when to use generalized sample
variances versus direct sample estimation of variance, the effects of imputation and
poststratification weighting on variance estimates, and how best to handle spell analysis and
other longitudinal methods in the presence of left- and right-censoring. Some work on the last
item is reported in Causey (2002).
Benchmark income data. The Census Bureau has completed a follow-up study to benchmark
SIPP (and March CPS) income data for calendar year 1996 against independent estimates (from
the National Income and Product Accounts and elsewhere); see Roemer (2000). (Similar studies
were done for calendar years 1984 in Vaughan, 1993, and for 1990 in Coder and Scoon-Rogers,
1996.) Unfortunately, Roemer concludes that “Redesigning the SIPP for the 1996 panel does not
seem to improve its income estimates” (p. 40). Roemer recommended and the Census Bureau
concurs that it is worthwhile to try to develop procedures to use administrative records to
-23-
improve income reporting. In particular we are investigating the use of administrative records to
examine transfer program recipiency and amounts (e.g., a study matching SIPP records to
housing program records is underway). Eventually, the Census Bureau anticipates using the
results to develop experimental nonsampling adjustments for underreporting. Early results from
the methods panel suggest reduced item nonresponse to income questions, and this may improve
aggregate reporting.
Measure program eligibility and simulate tax liabilities. Over the next several years, the Census
Bureau plans to develop formal estimates of program eligibility for major transfer programs from
the SIPP data. The estimates will become part of routine SIPP processing and be included in the
public use file when complete. Sentier Research Inc. has developed a parameter-driven tax
simulation model that is being adapted to both the March CPS and the SIPP; its outputs will be
included on the public use files.
Improve methods of poverty measurement. A major effort to apply the NAS poverty panel=s
recommended methods and examine other alternative poverty measures using the SIPP is
underway. A joint research paper with the Bureau of Labor Statistics (Short et al., 1998) applied
the panel’s suggested methods to the SIPP for the first time; an analysis using the 1996 panel is
underway. The Short et al. paper, several other research papers on the subject (both Census
Bureau and external), and the reports completed using the March CPS, are on the poverty
measurement web site.16
16. <http://www.census.gov/hhes/www/povmeas.html>.
-24-
V. CONCLUSION
SIPP is a unique member of the federal government=s portfolio of household surveys. It is
invaluable to policy makers and academic researchers and provides insights not available from
any other household survey. Many policy analysts have used the data to inform important policy
issues, and if it becomes the source of official income and poverty statistics it will become even
more important. The Census Bureau is confident about its ability to make the value of SIPP clear
to its constituents and is committed to making SIPP the key source of economic and policy-
relevant statistics about households.
Nevertheless, the Census Bureau faces many challenges in current SIPP operations that it is
addressing.
1. Pretest instruments more systematically and extensively. The use of an automated instrument
(questionnaire) provides many enhancements to improve data collection. In particular, the
questionnaire takes advantage of automated skip patterns and built-in edits for range checks and
inconsistencies, and it improves the display, accuracy, and timeliness of data which aids
respondent=s recall. However, there are no simple “pen and ink” changes to CAPI instruments. If
a problem is found in the instrument during production, it normally takes two months to fix and
field the changes after the Census Bureau discovers the problem. As the instrument becomes
stabilized over time, these problems are resolved. The 2004 panel questionnaire is undergoing
extensive field testing in parallel to the “live” 2001 panel.

-25-
2. Encourage better respondent cooperation to reduce nonresponse. Interviewers, at least,
perceive declining cooperation as related to questionnaire length. Questionnaire length, in turn,
is a function of the many topics about which SIPP is being asked to collect information. When
asked specifically about the apparent trade-off between questionnaire length and response,
members of the OMB SIPP Interagency Advisory Committee said clearly that the information
was so valuable that they would rather accept the lower response rate than reduce the content.
Nevertheless, the Census Bureau will continue to search for ways to improve response, such as
increased use of financial incentives. The 2000 SIPP panel length test will provide limited
evidence on the effect of questionnaire length on cooperation. The additional incentive tests
incorporated in the 2001 panel will also help direct future efforts to reduce attrition. The Census
Bureau is also considering the recommendations of the Interagency Household Survey
Nonresponse Group (see Atrostic et al., 2001, and Bates et al., 2001; see also Groves et al.,
2002).
3. Continue to have a strong methodological research program. The Census Bureau has
resolved many of the research issues worrying SIPP analysts in the early years of the survey. On
the other hand, there is no easy answer for attrition bias, one of the main problems that SIPP (and
other longitudinal surveys) must deal with, nor for seam bias. If approved by the Congress, the
commitment to preparing the SIPP to become the source of official income and poverty statistics
will give a clear research focus for the next several years. Other areas of focus include eligibility
modeling and creating a tax simulation system for SIPP.

-26-
4. Improve the timeliness of SIPP data products by developing a new longitudinal processing
system. Serious delays in data processing for the SIPP resulted from the switch from paper
questionnaire to CAPI for the 1996 panel. It was only in early 2002 that the first longitudinal
microdata (waves 1-4) were released; waves 1-12 will be released a few months after that. To
improve timeliness, a Census Bureau working group met and proposed an alternative strategy.
Instead of producing cross-section wave files for the core data as soon as possible, and then
editing all the panel’s waves for consistency at the end, cross-section wave files would be
eliminated and only a longitudinal core file would be produced. (This file would be
supplemented by cross-section topical module files, produced as they are now.) Further, few
(and no major) changes would be permitted to the 1996 questionnaire until 2004, and even then
the questionnaire will be constrained to produce outputs as close as possible to the 1996
questionnaire.
After consulting with users, this new strategy will be adopted for the 2001 and subsequent
panels, with one difference. That difference is the provision of a preliminary cross-section file
for wave 1 as soon as possible (a target date of 8 months after data collection ends; the
preliminary 2001 panel wave 1 file was released in June 2002, the delay resulting from
additional confidentiality protections added for all Census Bureau microdata products in early
2002). Second, a longitudinally edited file containing waves 1-4 will be released approximately
8 months after data collection ends for wave 4. This allows the imputation of missing wave
information for waves 2 and 3, and the longitudinal editing of demographic information. Finally,
as each subsequent wave is completed, it is edited to be consistent with the already released

-27-
waves, and released 8 months after the end of data collection for that wave. Topical module data
will receive a lower priority, and thus will typically take 12-18 months to be released, depending
in part on whether the questionnaire had been used before.
While this new longitudinal processing plan will undoubtedly improve timeliness, the tradeoff is
slightly less accuracy. This reduced accuracy has three aspects:
♦ less missing wave imputation (since after wave 3 the subsequent wave will not be available
for longitudinal editing, the Census Bureau cannot impute the missing data accurately; the
user can remedy this defect);
♦ changes to demographic information provided after wave 4 will not be used; they will be
edited to be consistent with earlier information (respondents do occasionally correct previous
responses, though less so after wave 4 than earlier in the panel); and
♦ a zero weight will be assigned to nonrespondents returning to the sample after wave 4 (the
2001 panel and subsequent panels include all post-wave 1 nonrespondents in the interview
sample for all subsequent waves).
SIPP is no longer a toddler, it is a teenager (19 in October 2002). As many teenagers do, it is
showing signs of maturity, but clearly SIPP still has a way to go. Having a high profile goal --
providing official income and poverty statistics -- would help it grow quickly into a responsible
adult member of the federal government=s survey community. Even without that goal, its

-28-
contribution to understanding the effects of the 1996 welfare reform legislation should help it
mature and be recognized as a vital national survey.
-29-
REFERENCES Atrostic, B.K., Nancy Bates, Geraldine Burt, and Adriana Silberstein. “Nonresponse in U.S. Government Household Surveys: Consistent Measures, Recent Trends, and New Insights,” Journal of Official Statistics, Vol 17, No.2. 2001, pp. 209-226. Bates, Nancy, Pat Doyle and Adriana Silberstein “Survey Nonresponse: New Definitions and Measurement Methods.” Statistical Policy Working Paper 32: 2000 Seminar on Integrating Federal Statistical Information and Processes. Washington D.C. Federal Committee on Statistical Methodology, Office of Management and Budget. April 2001. Pp. 253-269. Causey, Beverly D. "Maximum-Likelihood Estimation for Spell Duration Under Censoring for the U.S. Survey of Income and Program Participation," U.S. Census Bureau staff paper, 2002. Citro, Constance F. and Graham Kalton (eds.). The Future of the Survey of Income and Program Participation. Washington, D.C. National Academy Press. 1993. Citro, Constance F. and Robert T. Michael (eds.). Measuring Poverty: A New Approach. Washington, D.C. National Academy Press. 1995. Coder, John and Lydia Scoon-Rogers. AEvaluating the Quality of Income Data Collected in the Annual Supplement to the March Current Population Survey and the Survey of Income and Program Participation.@ U.S. Census Bureau staff paper, July 1996. Creighton, Kathleen P., Karen E. King, and Elizabeth A. Martin. “The Use of Monetary Incentives in Census Bureau Longitudinal Surveys.” Statistical Policy Working Paper 32: 2000 Seminar on Integrating Federal Statistical Information and Processes. Washington D.C. Federal Committee on Statistical Methodology, Office of Management and Budget. April 2001. Pp. 289-310. Doyle, Patricia, Elizabeth Martin, and Jeffrey Moore. “The Survey of Income and Program Participation (SIPP) Methods Panel Improving Income Measurement.” SIPP Working Paper 234. Washington, DC, November 2000, <http://www.sipp.census.gov/sipp/workpapr/wp234.pdf>. Groves, Robert M., Don A. Dillman, John L. Eltinge, and Roderick J.A. Little. Survey Nonresponse. New York: John Wiley and Sons. 2002. Marquis, Kent H. and Jeffrey C. Moore. AMeasurement Errors in SIPP Program Reports.@ Proceedings of the 1990 Annual Research Conference, U.S. Census Bureau. 1990.
-30-
Mera, Ruben N. and Leroy Bailey. “An Assessment of SIPP: Estimation and Analysis in Light of Its Complex Design.” U.S. Census Bureau staff paper, April 2002. O’Hara, Brian J. “Work and Work-Related Activities of Mothers Receiving Temporary Assistance to Needy Families: 1996, 1998, and 2000.” U.S. Census Bureau Current Population Report P70-85, May 2002. Roemer, Marc I. “Assessing the Quality of the March Current Population Survey and the Survey of Income and Program Participation Income Estimates, 1990-1996.” U.S. Census Bureau staff paper, June 2000. <http://www.census.gov/hhes/www/income/assess1.pdf> Rottach, Reid. “Adjusting for Wave 1 Unit Nonresponse in the 1996 SIPP Panel Using Auxiliary Data.” U.S. Census Bureau staff paper, October 2001. Smith, Wray and Thomas Jabine. A Redesign of the Survey of Income and Program Participation for 2000 and Beyond: Fall 1997 Study Report [for the Census Bureau].” 1998. Short, Kathleen. Experimental Poverty Measures: 1999. U.S. Census Bureau Current Population Report P60-216. Washington D.C. October 2001. Short, Kathleen, Martina Shea, David Johnson, and Thesia I. Garner. APoverty Measurement Research Using the Consumer Expenditure Survey and the Survey of Income and Program Participation (with Supporting Estimates from the Current Population Survey).@ Paper presented at the annual meeting of the American Economic Association, Chicago, January 1998. Sweet, E. M. "Roster Research Results from the Living Situation Survey." Proceedings of the 1994 Annual Research Conference. U.S. Bureau of the Census. 1994. Tourangeau, R., G. Shapiro, A. Kearney, and L. Ernst. "Who Lives Here? Survey Undercoverage and Household Roster Questions." Journal of Official Statistics 13(1):1-18, 1997. U.S. Census Bureau. SIPP Users’ Guide Third Edition. Washington, D.C. 2001. U.S. Census Bureau. SIPP Quality Profile. Third Edition. SIPP Working Paper 230. Washington, DC, 1998 <http://www.sipp.census.gov/sipp/workpapr/wp230.pdf>. Vaughan, Denton R. AReflections on the Income Estimates from the Initial Panel of the Survey of Income and Program Participation (SIPP).@ Studies in Income Distribution No. 17. U.S. Department of Health and Human Services, Social Security Administration, May 1993. Vaughan, Denton and Fritz Scheuren. “Measuring and Adjusting for Longitudinal Attrition in the Survey of Program Dynamics.” Paper prepared for presentation at the Joint Statistical Meetings, New York, August 2002.

-31-
Weinberg, Daniel H. and Stephanie S. Shipp. “The Survey of Program Dynamics: Comment [on Rossi]” in D. Besharov and P. Germanis (eds.) Family Well-Being After Welfare Reform, Maryland School of Public Affairs Welfare Reform Academy, February 2002. <http://www.welfareacademy.org/pubs/familywellbeing/>.


