
The Transportation Problem
Initial Basic Feasible Solution Methods
Transportation model:• The transportation problem deals
with the distribution of goods from several points of supply (sources) to a number of points of demand (destinations)
• Usually we are given the capacity of goods at each source and the requirements at each destination
• Typically the objective is to minimize total transportation and production costs
A typical transportation problem contains
Inputs:Sources with availability
Destinations with requirementsUnit cost of transportation from various sources to
destinations
Objective:To determine schedule of transportation to minimize total transportation cost
There are three basic methods to find the initial solution for a balanced Transportation Problem Northwest Corner Method Least Cost Method Vogel’s Method
1. Select the northwest corner cell of the transportation table and allocate as many units as possible equal to the minimum between availability supply and demand requirements
2. Adjust the supply and demand numbers in the respective rows and columns allocation
3. If the supply for the first row is exhausted ,then move down to the first cell in the second row and first column and go to step 2.
4. If the demand for the first column is satisfied, then move horizontally to the next cell in the second column and first row and go to step 2
5. If for any cell, supply equals demand, then the next allocation can be made in cell either in the next row or column.
6. Continue the procedure until the total available quantity is fully allocated to the cells as required.
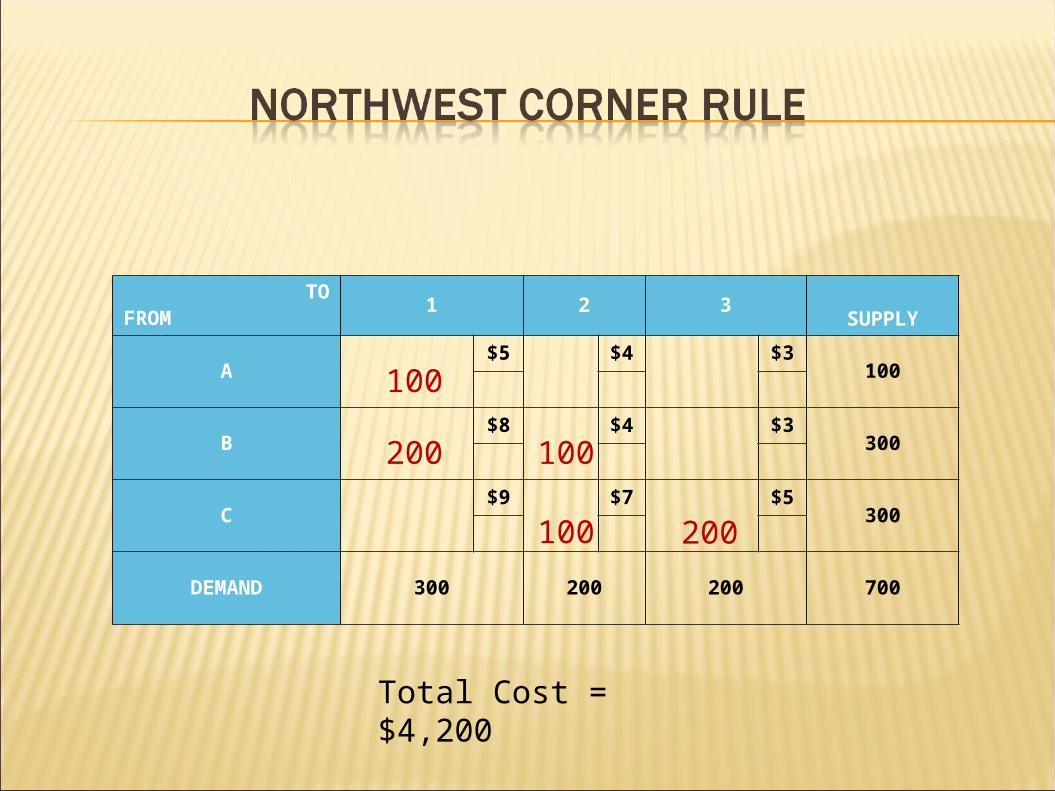
TOFROM
1 2 3SUPPLY
A$5 $4 $3
100
B$8 $4 $3
300
C$9 $7 $5
300
DEMAND 300 200 200 700
100
200 100
100 200
Total Cost = $4,200

Although the Northwest Corner Rule is the easiest, it is not the most efficient starting point because our objective is not included in the process.
The Northwest Corner Method does not utilize shipping costs. It can yield an initial bfs easily but the total shipping cost may be very high.
The least cost method uses shipping costs in order come up with a bfs that has a lower cost.

Steps of Least Cost Method
1. Select the cell with the minimum cell cost in the tableau and allocate as much to this cell as possible, but within the supply and demand constraints.
2. Select the cell with the next minimum cell-cost and allocate as much to this cell as possible within the demand and supply constraints.
3. Continue the procedure until all of the supply and demand requirements are satisfied. In a case of tied minimum cell-costs between two or more cells, the tie can be broken by selecting the cell that can accommodate the greater quantity.

TOFROM
1 2 3SUPPLY
A$5 $4 $3
100
B$8 $4 $3
300
C$9 $7 $5
300
DEMAND 300 200 200 700
200
100
100
300
Total Cost = $4,100
Vogel’s Approximation MethodVogel’s Approximation Method (VAMVAM) is not as simple as the northwest corner method, but it provides a very good initial solution, often one that is the optimaloptimal solution
VAM tackles the problem of finding a good initial solution by taking into account the costs associated with each route alternative
To apply VAM, we first compute for each row and column the penalty faced if we should ship over the second-bestsecond-best route instead of the least-costleast-cost route

Using Vogel’s method: Begin with computing each row and column a
penalty. The penalty will be equal to the difference between the two smallest shipping costs in the row or column.
Identify the row or column with the largest penalty.
Find the first basic variable which has the smallest shipping cost in that row or column.
Assign the highest possible value to that variable Compute new penalties and use the same
procedure.

3 0 0OPPORTUNITY
COSTS
TOFROM A B C TOTAL
AVAILABLE
D 100$5 $4 $3
100 1
E 200$8
100$4 $3
300 1
F$9
100$7
200$5
300 2
TOTAL REQUIRED 300 200 200 700
Transportation table with VAM row and column differences shown
VAM Step 2VAM Step 2. identify the row or column with the greatest opportunity cost, or difference (column A in this example)VAM Step VAM Step 33.Assign as many units as possible to the lowest-cost square in the row or column selectedVAM Step 4VAM Step 4. Eliminate any row or column that has been completely satisfied by the assignment just made by placing Xs in each appropriate squareVAM Step 5VAM Step 5. Recompute the cost differences for the transportation table, omitting rows or columns eliminated in the previous step

3 1 0 3 0 2OPPORTUNITY
COSTS
TOFROM A B C TOTAL
AVAILABLE
D 100$5
X$4
X$3
100 1
E$8 $4 $3
300 1
F$9 $7 $5
300 2
TOTAL REQUIRED 300 200 200 700
VAM assignment with D’s requirements satisfied

VAM Step 6VAM Step 6. Return to step 2 for the rows and columns remaining and repeat the steps until an initial feasible solution has been obtained
In this case column B now has the greatest difference, 3 We assign 200 units to the lowest-cost square in the
column, EB We recompute the differences and find the greatest
difference is now in row E We assign 100 units to the lowest-cost square in the
column, EC

Second VAM assignment with B’s requirements satisfied
3 1 0 3 0 2OPPORTUNITY
COSTS
TOFROM A B C TOTAL
AVAILABLE
D 100$5
X$4
X$3
100 1
E$8
200$4 $3
300 1
F$9
X$7 $5
300 2
TOTAL REQUIRED 300 200 200 700

TOFROM A B C TOTAL
AVAILABLE
D 100$5
X$4
X$3
100
E X$8
200$4
100$3
300
F$9
X$7 $5
300
TOTAL REQUIRED 300 200 200 700
Third VAM assignment with E’s requirements satisfied

TOFROM A B C TOTAL
AVAILABLE
D 100$5
X$4
X$3
100
E X$8
200$4
100$3
300
F 200$9
X$7
100$5
300
TOTAL REQUIRED 300 200 200 700
Final assignments to balance column and row requirements
Total Cost = $3,900


