
The US and New Mexico Economies: Recent Developments and Outlook
A presentation to NM Legislative Finance Committee Presented by Jeffrey Mitchell, Director, UNM-BBER
January 2016

Review: National Economy o Generally good – despite strong global headwinds and distressed
commodity & equity markets.
o Final estimate for 2015Q2 revised up to 3.9%. 2015Q3 to 2.0%.
o Employment expanded in October by 307,000, in November by 252,000 and 292,000 in December. Unemployment rate to 5.0%.
o Wages only slowly responding to high employment growth. YET:
o Consumer Confidence Index higher in 2015 than any year since before the Recession.
o Growth driven by consumer spending, offsetting weak exports & government.
o Commodities (esp. oil) and equities on the run.
o Housing is still weak but slowly improving .

Growth (%) in Real GDP, Quarter-Over-Previous-Quarter, SAAR
Global Insight, Jan. 16 and Oct. 15
-2.0%
-1.0%
0.0%
1.0%
2.0%
3.0%
4.0%
5.0%
2011 2012 2013 2014 2015 2016 2017 2018 2019 2020
January 2016 October 2015
US Real GDP Forecast Comparison

US Federal Deficit ($Billions)
Global Insight, Jan. 16 and Oct. 15
-$1,600
-$1,400
-$1,200
-$1,000
-$800
-$600
-$400
-$200
$0
$200
$400
96 97 98 99 00 01 02 03 04 05 06 07 08 09 10 11 12 13 14 15 16 17 18 19 20
January 2016 October 2015
Comparison of Federal Deficit

US Employment Forecast by Sector
Global Insight Jan. 16
2012 2013 2014 2015 2016 2017 2018 2019 2020
Employment Sector
Construction 114 212 281 259 356 346 257 212 188
Manufacturing 200 93 170 137 (17) 105 114 122 96
Trade, Transportation & Utilities 405 385 520 537 371 224 162 104 67
Prof. & Bus. Services 606 588 573 653 634 725 538 390 535
Health Care & Soc. Asst. 375 386 315 536 593 344 282 349 276
Leisure & Hospitality 423 486 450 448 306 175 213 189 146
Other Private 307 216 312 260 34 (206) (70) (35) 2
Government (175) (69) 8 91 98 142 242 200 261
Total Nonfarm Payrolls 2,255 2,296 2,629 2,920 2,375 1,855 1,739 1,530 1,571
Annual Growth 1.7% 1.7% 1.9% 2.1% 1.7% 1.3% 1.2% 1.0% 1.1%IHS Global Insight, January 2016
Increase (Decrease) in US Payroll Employment from Previous Calendar Year, Actual & Forecast (Thousands)
New Mexico Review

New Mexico Economic Current Situation o Employment growth, slow since 2009 but stronger in FY2015 (1.4%), has again
slowed (0.5% in 2015 Q3 & 4).
o In FY2015, 64% (4,400 of 6,900) new jobs were in healthcare; 40% of these in ‘social assistance’ and 60% outside metro areas.
o Mining employment remained resilient for 3 quarters after price fall (June 2014-March 2015) but has begun to fall since. Rig counts continue to decline (102 at end-2014 to 35 last week.
o Unemployment rate rising to 6.8% (November, vs. 5.0% US) as with labor force, which declined every quarter from the recession through 2014, grew(>10,000 or 1.1% in 2015Q3).
o Home sales improving (up 10% in Q3) and building permits beginning to respond, but values remain flat. A key indicator?
o Mixed economic news for rural New Mexico – increased water reserves, snow has had terrible and likely long-term impact on diary & cattle.
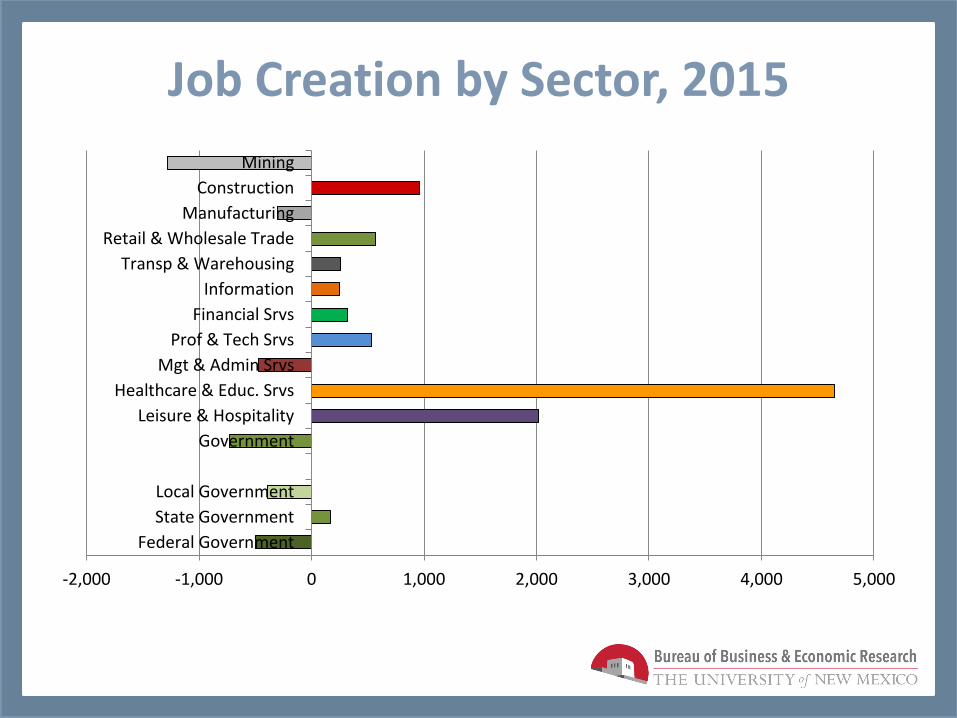
Job Creation by Sector, 2015
-2,000 -1,000 0 1,000 2,000 3,000 4,000 5,000
Federal Government
State Government
Local Government
Government
Leisure & Hospitality
Healthcare & Educ. Srvs
Mgt & Admin Srvs
Prof & Tech Srvs
Financial Srvs
Information
Transp & Warehousing
Retail & Wholesale Trade
Manufacturing
Construction
Mining
Oil & Gas Impacts on NM Economy
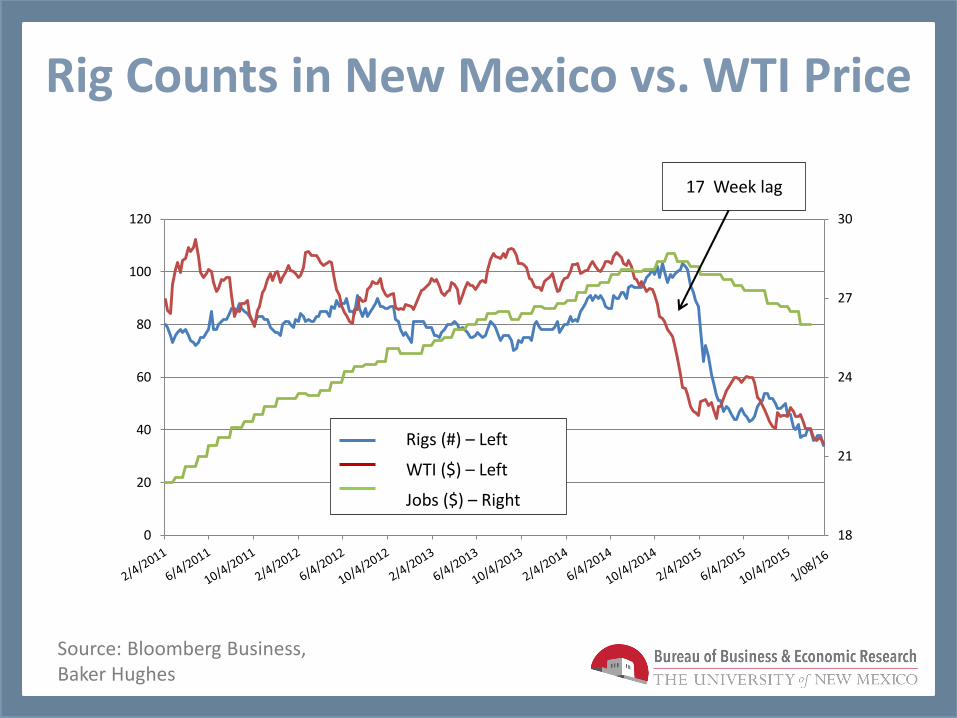
Rig Counts in New Mexico vs. WTI Price
Source: Bloomberg Business, Baker Hughes
18
21
24
27
30
0
20
40
60
80
100
120
Rigs (#) – Left
WTI ($) – Left
Jobs ($) – Right
17 Week lag

1. Employment impact: lower investment in production, creating fewer jobs in the oil industry and through purchasing by companies and spending by workers.
2. Fiscal impact: reduces state and local government revenues, forcing budget cuts.
3. Consumer impact: lower gasoline prices mean more household spending on local goods & services.
West Texas Intermediate (WTI): From $106/barrel in July 2014 to $27.96/barrel spot yesterday.
How does the decline in oil prices affect New Mexico’s economy

1. Employment impacts of oil & gas industry
2014
2014-2010
Impact Type
Employment Labor Income
(Millions) Average Labor
Income
Direct 36,587 $2,472.54 $67,580 Indirect 40,496 $2,163.76 $53,432 Induced 25,240 $952.32 $37,730 Total 102,323 $5,588.62 $158,742 Multiplier 2.8 2.3
Impact Type
Employment Labor Income Average Labor
Income
Direct 11,784 $956.24 $81,147 Indirect 6,338 $468.21 $73,872 Induced 6,342 $292.72 $46,160 Total 24,464 $1,717.18 $70,193 Multiplier 2.1 1.8
For every one job lost in Oil & Gas, expect to lose another 1.1 additional jobs (indirect & induced); and a total of $201,179 in labor income in the oil & gas industry.
However, some of these losses will be offset by gains in other sectors as consumers spend elsewhere and labor becomes available for other industries.
2. Fiscal impact: Oil & State General Fund
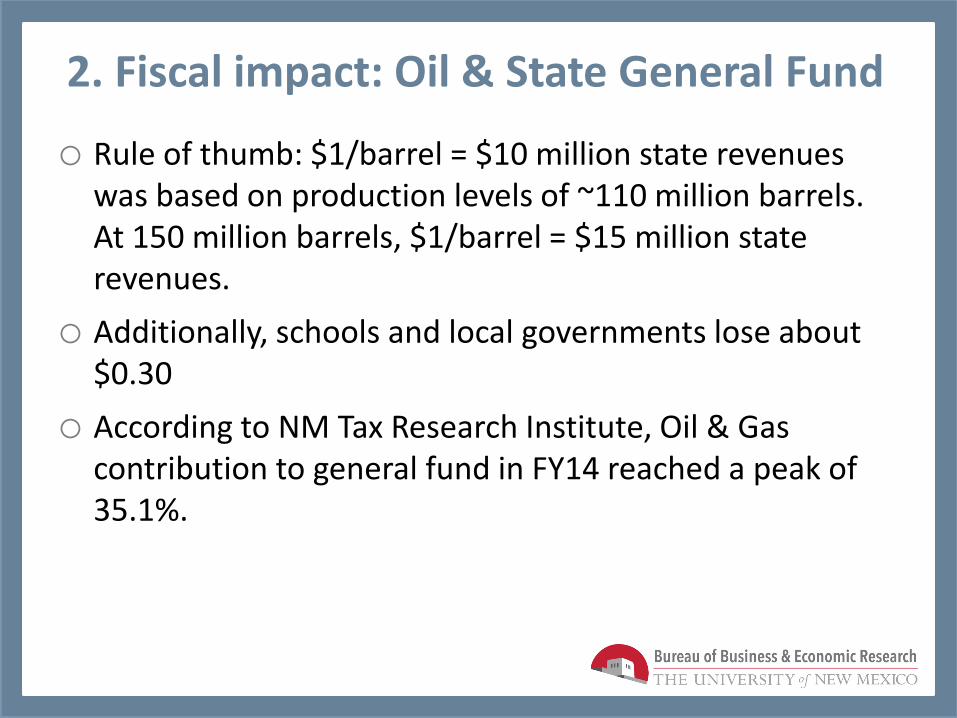
o Rule of thumb: $1/barrel = $10 million state revenues was based on production levels of ~110 million barrels. At 150 million barrels, $1/barrel = $15 million state revenues.
o Additionally, schools and local governments lose about $0.30
o According to NM Tax Research Institute, Oil & Gas contribution to general fund in FY14 reached a peak of 35.1%.

Contribution of Oil & Gas to State General Fund
Permanent funds (10%)
Total: $6,040 million (FY 2014)
Source: New Mexico Tax Research Institute, January 2015.
Current O&G (21%)

3. Consumer impact: more money to spend locally
* JP Morgan Chase & Co Institute, October 2015
Impact of higher consumer spending
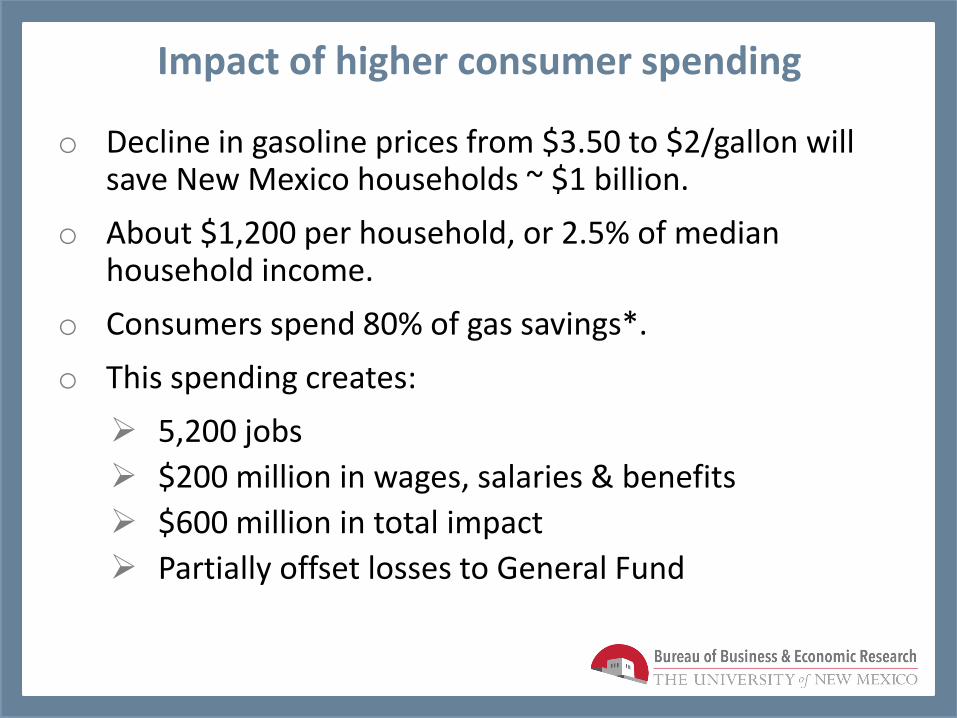
o Decline in gasoline prices from $3.50 to $2/gallon will save New Mexico households ~ $1 billion.
o About $1,200 per household, or 2.5% of median household income.
o Consumers spend 80% of gas savings*.
o This spending creates:
5,200 jobs
$200 million in wages, salaries & benefits
$600 million in total impact
Partially offset losses to General Fund

New Mexico Economic Outlook

New Mexico Economic Outlook: 2016-2020
o Employment growth: 1.2% or 10,250 jobs per year
o Composition of new jobs: 37% in health care & social assistance; 31% in low-wage service sectors; 13% in mining, utilities, construction, manuf, transportation; 12% in P&BS, 5% in government (tied to health)
o Employment impact of low oil prices likely wear off by end-2016.
o Income growth: 3.3% in 2016, rising to 5.1% in 2018; wages growth to private sector workers key variable.

Forecast Comparison: Employment Growth
-0.5%
0.0%
0.5%
1.0%
1.5%
2.0%
2011 2012 2013 2014 2015 2016 2017 2018 2019 2020
January 2016 October 2015
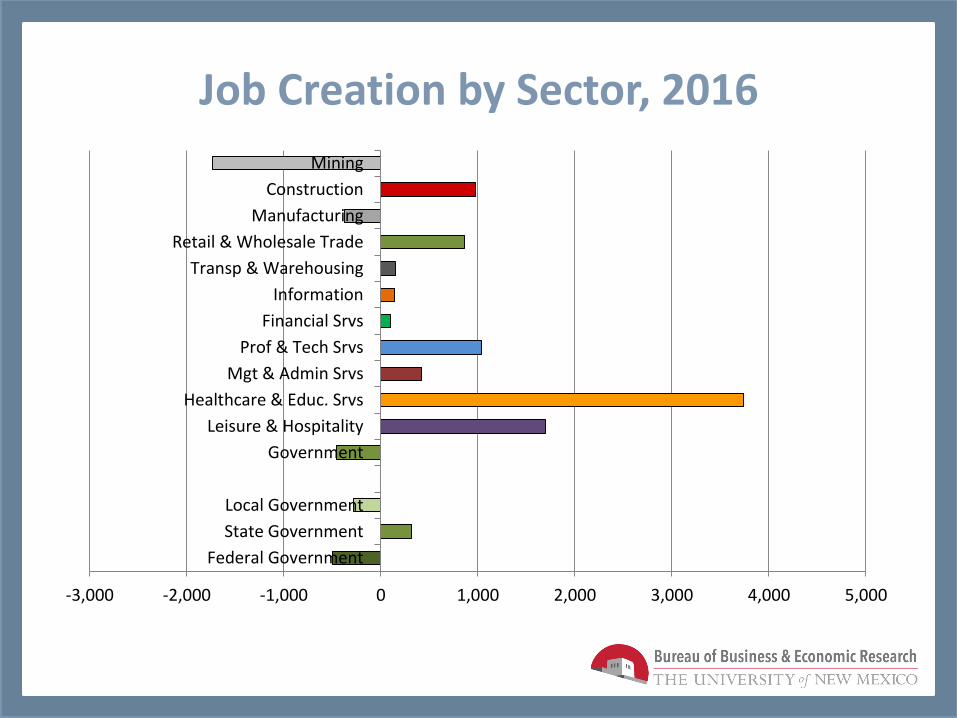
Job Creation by Sector, 2016
-3,000 -2,000 -1,000 0 1,000 2,000 3,000 4,000 5,000
Federal Government
State Government
Local Government
Government
Leisure & Hospitality
Healthcare & Educ. Srvs
Mgt & Admin Srvs
Prof & Tech Srvs
Financial Srvs
Information
Transp & Warehousing
Retail & Wholesale Trade
Manufacturing
Construction
Mining

Job Creation by Sector, 2017-2020
-500 0 500 1,000 1,500 2,000 2,500 3,000 3,500 4,000 4,500
Federal Government
State Government
Local Government
Government
Leisure & Hospitality
Healthcare & Educ. Srvs
Mgt & Admin Srvs
Prof & Tech Srvs
Financial Srvs
Information
Transp & Warehousing
Retail & Wholesale Trade
Manufacturing
Construction
Mining

Forecast Comparison: Income
-2%
-1%
0%
1%
2%
3%
4%
5%
6%
7%
8%
2011 2012 2013 2014 2015 2016 2017 2018 2019 2020
January 2016 October 2015
$1.2 billion (2% of all income) due to Medicaid expansion alone

Income growth by component, 2016-2020
Private sector Wages, 35%
Gov't sector wages, 6%
Investments, 21%
Transfers, 29%
Proprietors' Income, 4%
Other Labor income, 9%

US & NM: Housing Starts & Permits
0.000
0.200
0.400
0.600
0.800
1.000
1.200
1.400
1.600
1.800
2.000
0.000
2.000
4.000
6.000
8.000
10.000
12.000
14.000
16.000
06 07 08 09 10 11 12 13 14 15 16 17 18 19 20
NM Housing Permits (Total) US Housing Start (Total)
Thousands, NM Millions, USA

New Mexico Job Gain/Loss by Region

Job Gain/Loss by Sector – 2015-2018 (‘000s)
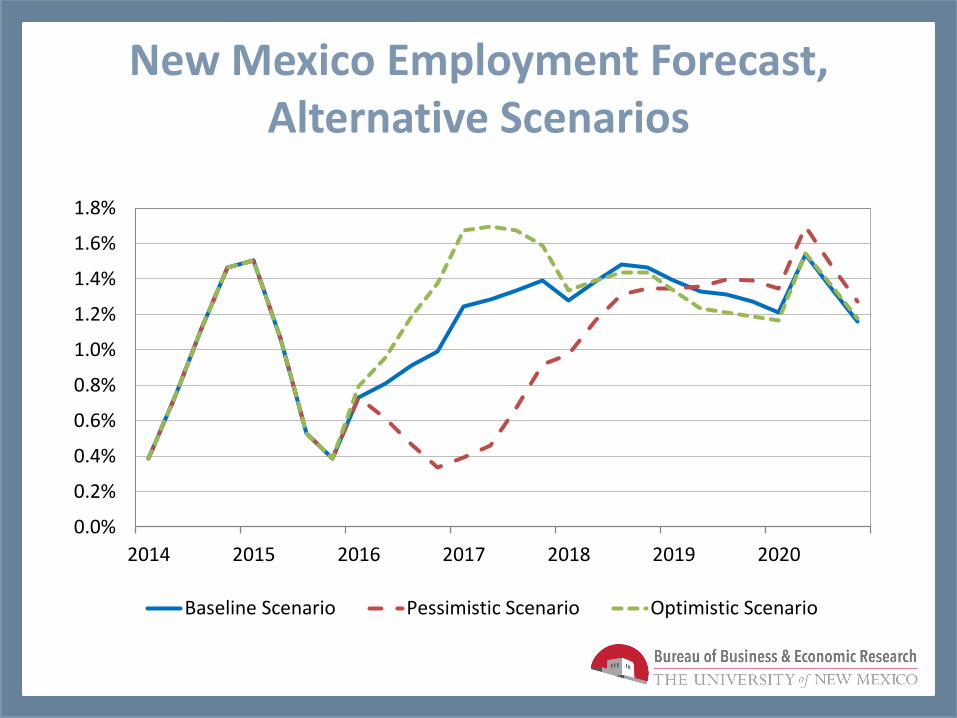
New Mexico Employment Forecast, Alternative Scenarios
0.0%
0.2%
0.4%
0.6%
0.8%
1.0%
1.2%
1.4%
1.6%
1.8%
2014 2015 2016 2017 2018 2019 2020
Baseline Scenario Pessimistic Scenario Optimistic Scenario

The US and New Mexico Economies: Recent Developments and Outlook
A presentation to NM Legislative Finance Committee Presented by Jeffrey Mitchell, Director, UNM-BBER
January 2016

NM Oil &Gas production volume, value and average annual price, 2004-2014
Value of
Oil (Mn $)
Oil
Production
(Barrels)
Oil Price
($/barrel)
Value of
Natural
Gas (Mn $)
Gas Production
(Mn Cubic Ft)
Gas Price
($/mn
cubic ft)
Value of Oil &
Natural Gas
(Mn $)
2004 $2,536 65,080,988 $38.97 $8,438 1,550,415,488 $5.44 $10,974
2005 $3,225 61,197,817 $52.70 $11,020 1,527,910,128 $7.21 $14,246
2006 $3,722 60,421,932 $61.60 $9,697 1,535,202,552 $6.32 $13,419
2007 $4,100 59,747,879 $68.62 $10,408 1,463,560,727 $7.11 $14,507
2008 $5,835 60,860,052 $95.88 $11,978 1,399,310,626 $8.56 $17,814
2009 $3,553 62,361,737 $56.98 $5,713 1,347,452,643 $4.24 $9,266
2010 $5,024 66,486,436 $75.56 $6,919 1,271,074,334 $5.44 $11,943
2011 $6,658 73,639,513 $90.41 $7,234 1,223,725,404 $5.91 $13,891
2012 $7,677 87,616,153 $87.62 $5,031 1,211,921,368 $4.15 $12,708
2013 $9,617 103,967,116 $92.50 $5,404 1,162,695,874 $4.65 $15,022
2014 $10,519 125,752,132 $83.65 $6,098 1,203,266,979 $5.07 $16,617
Jan-Apr
2015 $2,117 47,883,676 $44.20 $1,131 378,203,062 $2.99 $3,247
Source: Oil and Natural Gas Administration and Revenue Database (ONGARD).

NM Oil & Gas production, by basin, 2004-2014
Source: Oil and Natural Gas Administration and Revenue Database (ONGARD).


